DOI:10.32604/iasc.2022.022104
| Intelligent Automation & Soft Computing DOI:10.32604/iasc.2022.022104 | |
| Article |
From Similarities to Probabilities: Feature Engineering for Predicting Drugs’ Adverse Reactions
Faculty of Informatics and Computer Science, The British University in Egypt (BUE), Cairo, Egypt
*Corresponding Author: Nahla H. Barakat. Email: nahla.barakat@bue.edu.eg
Received: 27 July 2021; Accepted: 13 September 2021
Abstract: Social media recently became convenient platforms for different groups with common concerns to share their experiences, including Adverse Drug Reactions (ADRs). In this paper, we propose a two stage intelligent algorithm which we call “Simi_to_Prob”, that utilizes social media forums; for ranking ADRs, and evaluating the ADRs prevalence considering different age and gender groups as its first stage. In the second stage, ADRs are predicted utilizing a different data set from the Food and Drug Administration (FDA). In particular, Natural Language Processing (NLP) is used on social media to extract ranked lists of ADRs, which are then validated using novel intrinsic evaluation methods. In the second stage, feature engineering is used to extend the input feature space, then a two stage supervised machine learning method is used to predict future ADRs incidences. Our results show correct ranked list of ADRs for three antihypertensive drugs, where high Spearman’s rank correlation coefficients (rs) of of 0.7458, 0.6678 and 0.5929 were obtained between SIDER database for drug ADRs, and our obtained lists from social media. Furthermore, Relatedness between ADRs and age and gender groups achieved high area under the ROC curve (AUC) reaching 0.959. The second stage results showed high AUCs of 0.96 and 0.99 for the prediction of future ADRs probabilities. The proposed algorithm shows that mining social media can provide reliable source of information, and additional features that can be used to boost supervised machine learning methods’ performance in different domains including Pharmacovigilance research.
Keywords: Feature engineering; machine learning; natural language processing; pharmacovigilance; social media; word embedding
Over the last decade, social media have proliferated to be not only a medium of interaction with family and friends, but also as convenient platforms for patients who have common diseases, to voluntarily share knowledge, discuss their diseases’ related symptoms, and drugs adverse reactions [1]. This has led to the generation of large amount of information that have been progressively utilized in medical, Pharmacovigilance and other domains [1–4]. It has been shown that social media have great potential for Pharmacovigilance activities [1,5], in particular; detecting unknown, monitoring frequency and prevention of, Adverse Drug Reaction (ADRs) [6]. This is very valuable, as ADRs are shown to be among the top ten causes of hospitalizations and death worldwide [7]. Therefore, some ADRs reporting systems are made available to get ADRs reports by patients, medical practitioners, and pharmaceutical companies; for example, the U.S. Food and Drug Administration (FDA) Adverse Event Reporting System (FAERS)1. However, in such passive systems, some ADRs might be under reported, late or biased. This in fact, was the main motivation behind utilizing publically available social media data for medical research, as early as of 2010 [1]. In this context, several machine learning and Natural Language Processing (NLP) methods have been used to mine texts of social media forums to extract ADRs [1–3,5,8], as summarized in Section 3. However, most of those approaches either only detect or extract ADRs from manually labelled text.
In this paper, we propose two stage intelligent algorithm, which we call “Simi_to_Prob” for quantifying, ranking then predicting ADRs. In the first stage, NLP and feature engineering have been used on social media forums for obtaining a quantified, ranked list of ADRs, as well as exploring the prevalence of different ADRs considering different age and gender groups, which are then evaluated using intrinsic evaluation. In the second stage, and based on the outcome of the first stage, a two-step supervised learning method have been used for the predicting the probabilities of most frequent ADRs; utilizing a different, real-world data extracted from the FAERS, in addition to set of engineered features that extend the input feature space, based on stage 1 outcomes. Starting with a combined, unlabelled, data sets from both Medhelp2 and AskApatient3 social media medical forums, and additional data sets from FAERS; reporting ADRs of specific antihypertensive drugs; the study key points can be summarized as follows:
Key Points
• Mining unlabelled social media text can be a reliable source of information,
• Feature engineering utilizing concept’s similarities can boost supervised machine learning methods performance,
• The area under the ROC curve has been introduced as novel intrinsic evaluation method for concept’s similarities,
• A quantified, valid ranked list of most frequent ADRs have been obtained from social media,
• A novel, two step machine learning algorithm with feature engineering have been used for future ADRs prediction.
The rest of the paper is organized as follows: Section 2 summarizes related work, and Section 3 details the methodology. Section 4 describes stage 1 methodology, followed by stage 1 results and evaluations in Sections 5. Section 6 details Stage 2 methodology and its results, followed by conclusions, study limitations, and future work in Section 7.
Several methods have been proposed for the identification and/or extraction of drugs adverse reactions (ARs) from text and social media in particular. Most of those methods were lexicon-based. However, lexicon-based methods have some limitations; including the need for manual annotation of data, the discovery of ADRs is limited by the utilized lexicons, and in many cases a mix between ADRs for a drug and its indication may happen [1]. To overcome those limitations, new extended lexicons; and different techniques to handle misspellings have been proposed [5]. In addition, several studies handled ADRs’ extraction as a supervised machine learning task [9], word embedding [3,10], and deep learning [11]. The majority of those studies used performance metrics like accuracy, and/or F-measure, where manually annotated data by domain experts were the gold standards. However, few studies went beyond just drug–ADRs relation extraction, where the gold standards used were the available, confirmed domain knowledge. The following section highlight the main features of latter category, as it is most relevant to our study4. However, more comprehensive reviews can be found in [1–3,5,8].
2.1 Drug Adverse Reactions Extractions and Validation
One of the earliest studies that utilized social media for ADRs detection was by Leaman et al. [12]. A lexicon was built from social media, in addition to manually added colloquial expressions [12]. The utilized data sets was obtained from DailyStrength5, which was manually annotated. DaliyStrength data was also utilized by [13], who also aimed to find ADRs’ mentions for a specific set of drugs (black box drugs), using supervised machine learning methods. The hypothesis was that black box drugs have larger number of reported ADRs; compared to other drugs. A drug was defined as normal or black box based on the manufacturers and FDA information [13]. In a close study, and to detect future FDA drug watch list [14], classified users’ posts to find the drugs which have similar reviews as drugs appearing in a specific FDA watch list. An ensemble classifier has been used to classify drugs as watch list, or none watch list, and it was found that withdrawn drugs have been detected in conversations, prior to their withdrawals [14]. Word embeddings have also been utilized, where a complete framework for identifying and evaluating ADRs [15] have been proposed. Relatedness and coherence measures were employed, as well as extrinsic evaluation [15]. Again using word embeddings [16], word2vec has been used to investigate the association-as measured by cosine similarity-between drugs and ADRs. The idea is that; distributional semantics obtained by word embeddings can capture semantic associations; as contextually related concepts appear closer in semantic space. The authors obtained the cosine similarity between three chosen drugs from Twitter posts, with 10 known, and some less known ADRs reported in https://Drugs.com6. It has been shown that known ADRs obtained higher similarity to the drug, compared to less known ADRs for the same drug [16].
From the reviewed methods, it can be seen that none of these methods neither quantified/ranked ADRs based on their frequencies; investigated or evaluated the prevalence of different ADRs; considering different age or gender groups, nor suggested a supervised method utilizing engineered features to predict ADRs probabilities, which are considered the main contributions of this study. The following section details our methodology.
The proposed approach in this study proceeds in two stages. In the first stage, a customized lexicon containing all the ADRs extracted from the used social media data sets have been obtained. Feature engineering, and word embeddings are then used to extract a ranked list of potential ADRs for each drug, then their prevalence have been investigated considering different gender and age groups. However, and as we will show, the ADRs’ lexicon has not been used the same way as the previously published lexicon-based methods that detect ADRs, but as a pool of all ADRs that appeared in our datasets; and are utilized as shown Fig. 1, and explained in the following sections. In the second stage, feature engineering and two step supervised machine learning methods have been utilized to predict the future probabilities of ADRs using 3 different, real-life data sets. The proposed algorithm is detailed below:
The Proposed Algorithm: “Simi_to_Prob”
Stage 1: Drug ADRs Extraction, Ranking and Evaluation
1. Data sets have been retrieved from Medhelp and AskApatient social medical forums using drug generic name, concatenated with the string “side effects”.
2. After basic data pre-processing, all ADRs mentions in the combined data sets have been extracted using MetaMap [17], which constituted our own ADR’s lexicon.
3. Gender and age have been extracted from user’s profiles or posts using string matching methods.
4. Feature engineering has been used to get specific age groups; from individual ages.
5. A word embedding training data set is prepared by concatenating posts, age groups, gender groups and drugs’ generic names.
6. Several embedding models have been obtained by training Word2vec using different embedding and window sizes.
7. The following average concepts’ similarities have been obtained over all embedding models:
• Drug name-ADRs similarities;
• Age groups-ADRs similarities;
• Gender-ADRs similarities;
8. The obtained similarities have been evaluated using intrinsic evaluation methods.
Stage 2: Prediction of the Probabilities of Future ADRs Incidence
9. From the obtained similarities, additional engineered features have been used to extend the feature space of another, real life data set obtained from FAERS reports regarding same drugs ADRs, and then predict potential ADRs probabilities for new patients, using two step supervised machine learning algorithm. Figs. 1 and 2 show the steps of the proposed algorithm.
4 Stage 1: Drug ADRs Extraction, Ranking and Evaluation
Two different forums have been chosen to get data from; the general medical forum “MedHelp”, and “askApatient” drug review forum. MedHelp is a generic medical social forum, where a drug mention in a post does not necessarily have some ADRs associated with it [8]; while askApatient is a dedicated,forum specialized for ADRs reporting and drug rating. Medical forums were chosen as they have much more relevant data, compared to generic social forums [1]. Data for three different antihypertensive drugs belonging to three different drug families were retrieved; namely: “Atenolol”, which belongs to “Beta Blockers” family, “Lisinopril”, which belongs to the “Angiotensin-Converting Enzyme (ACE) inhibitors”, and “Amlodipine”, which belongs to “Calcium Channel Blockers” family of drugs. Antihypertensive drugs have been chosen as it has been shown that suffering ADRs is a main reason for Non-adherence to antihypertensive drugs [18], which may lead to serious complications.
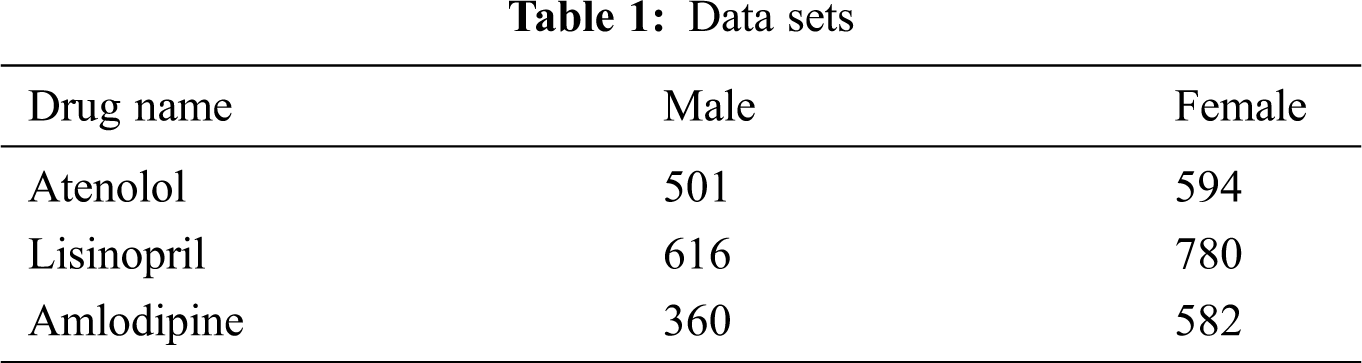
To retrieve data from MedHelp, the string resulting from concatenating generic drug name + the string “side effect” have been used as the keywords for data retrieval. In addition to the posts’ body text, age and gender of the post writer were retrieved if available. For the AskApatient forum, drug reviews were filtered using the hypertension as an indication, and the drug generic name is used as a keyword. Age, gender, and the entry under “side effects” were collected. All posts containing different drug names, other than the three chosen drugs were excluded. Details of the data sets are shown in Tab. 1.
Basic text processing including tokenization, lowercasing, stop words removal and lemmatization have been performed on text posts.
4.3 Extraction of Age and Gender Data
Age and gender of the post writer were available with almost all reviews in the AskApatient forum, but this was not the case for MedHelp; these data were missing from most of the users’ profiles. However, age and gender were frequently mentioned the beginning of the posts’ body text. Therefore, a sliding window pattern matching mechanism [19] was used in order to find the patterns that match age or gender expressions.
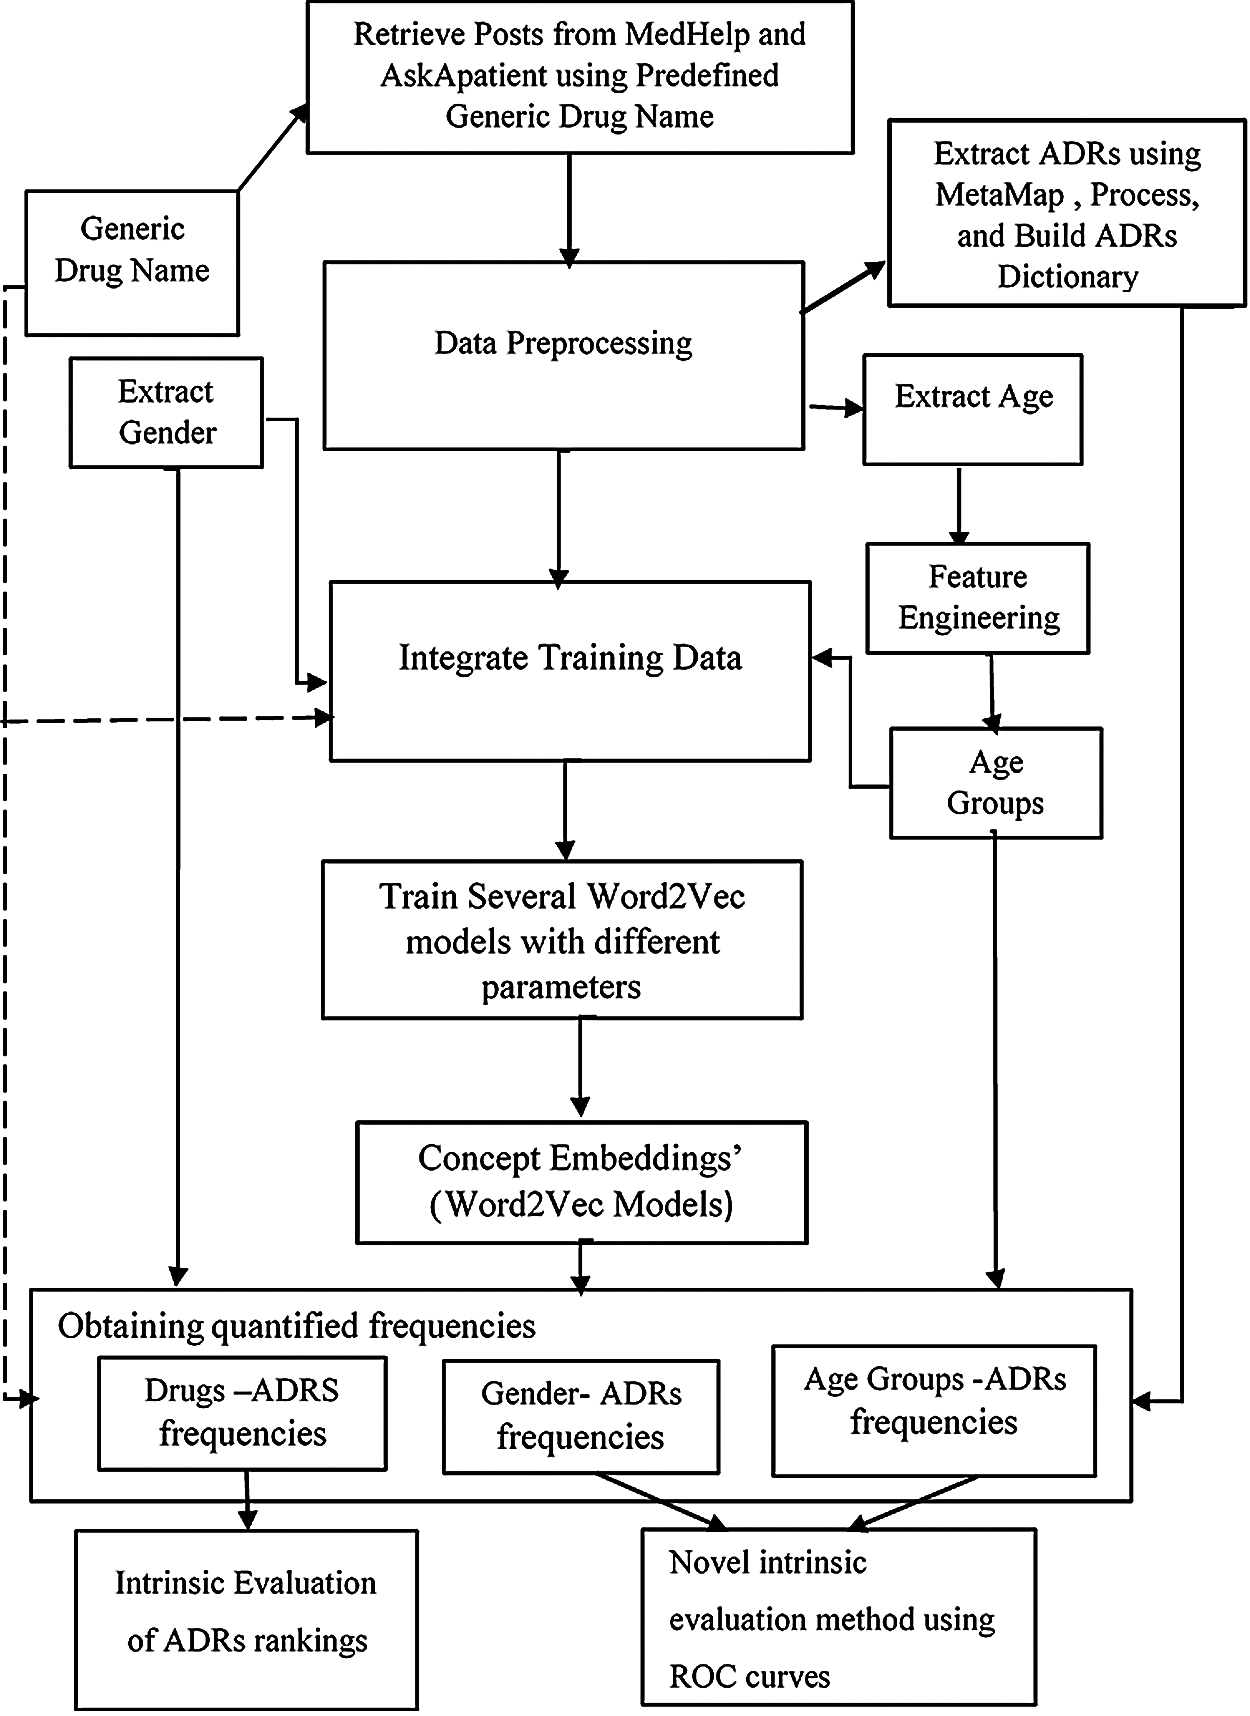
Figure 1: Stage 1: ADRs extraction, ranking and evaluation
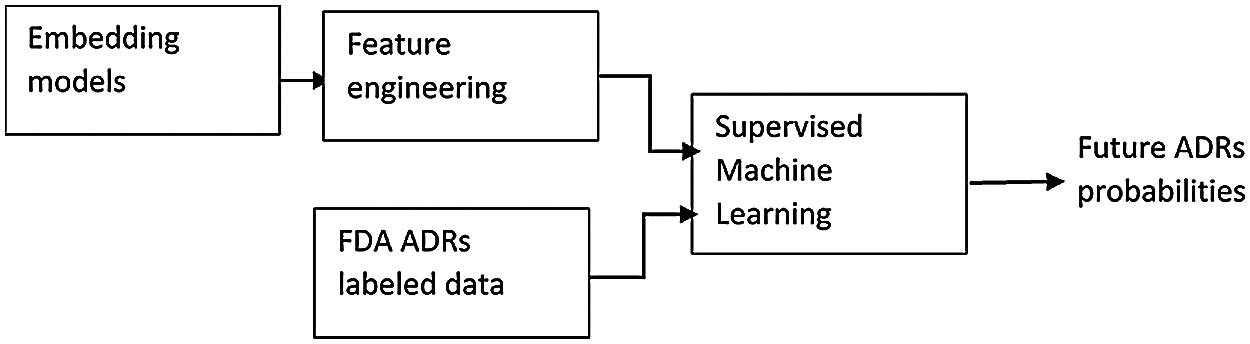
Figure 2: Stage 2: Predicting future ADRs probabilities
MetaMap [17] has been utilized to extract UMLS concepts related to ADRs. MetaMap is a program that discovers and maps biomedical text to its corresponding concepts in the Unified Medical Language System (UMLS) , then ranks the discovered UMLS concepts, and retain the concepts with the best fit of each term in the source text [17]. The objective of this step was to build our own lexicon of ADRs from the data set we use, rather than using other lexicons, which may not include all the ADRs mentioned in user’s posts. It is important to notice here that our lexicon has not been used in a similar way as the published lexicon-based methods for ADRs detection, but to have a pool of all ADRs’ mentions, for the purposes explained in the following sections.
Feature binning method have been used to assign individual ages to specific age-groups for the following reasons:
• Allow categorization of individual ages into three age groups; <40, 40–65, and >65 years, which were defined by medical practitioners. Obtaining the embeddings in terms of age-groups rather than individual ages offer better generalization of the obtained relationships, and allow verification of the obtained results. However, the individual ages of post writers were left untouched in the posts text.
• Use the age-groups for results reporting and analysis.
The same is valid for gender-groups, which are also used for embeddings’ results analysis.
The most prevalent ADR found in our data sets is “pain”. As pain is normally associated with a body organ, where it appears, therefore, a second pre-processing step is performed as follows: if the “pain” string was preceded by a body part/organ, then the two words are concatenated. For example, chest pain are concatenated to be one word “chestpain”; in both the data sets, as well as the dictionary.
4.6 Building Embedding Models Using Word2Vec
Word2Vec [20] has been used to build several embedding models for each individual drug data set.
Word2vec is a word embedding algorithm that takes unlabelled text corpus as input, and outputs dense vector representation for each token in that corpus. The main idea behind Word2vec [20] is a three layered neural network that learns distributed representations of tokens and its context, by optimizing an objective function. Word2Vec skip gram model [20] has been chosen to obtain concept embeddings, as it has been shown that skip-gram models achieved the highest correlations with human judgments compared to other benchmark methods in the assessments for semantic similarity tasks [4]. Different models have been obtained with embedding sizes ranged from 50–100, window size between 10 and 25. We have also used minimum word frequency of 5, and 500 iterations. Other parameters were set to default values.
4.7 Computing Concepts’ Similarities
All resulting embeddings have been utilized for computing concepts similarities. In particular, cosine similarities between the following pairs of concepts have been obtained from each model, and each of the ADRs in our lexicon:
• Drug name and each of the ADRs;
• Age-group, and each of the ADRs;
• Gender-group, and each of the ADRs
The individual similarities (obtained from each model) are then averaged to get unbiased, reliable results, and overcome the variability resulting from different training parameters.
The main hypothesis here is that; the higher the similarity between an ADR and a drug, the more likely that this drug is associated with that ADR. Therefore, if a specific drug-ADR pair has higher similarity than the same drug and other ADR, this would mean that the ADR with higher similarity is more frequent than other ADRs with lower similarities, given a specific drug. The same is valid for age and gender groups; higher similarity between an ADR to a specific age-group, compared to similarities to other age-groups means that this age-groups is more likely to suffer that ADR, compared to other age-groups. The same is also valid considering different gender-groups. Results are detailed in Section 4.8.
4.8 Stage 1 Results and Discussion
Our ADR lexicon originally included 90 ADR terms. However, we ended up with 65 ADRs only for all the three drugs; as all frequencies <5 were excluded during the training process of Word2Vec. It was also found that, not all drugs had the same type or number of ADRs.
To get more reliable results; only similarities with values ≥0.25 for ADRs-drugs, ADRs-age group and ADRs-gender groups pairs are reported in Sections 4.8.1–4.8.3. However, and for the sake of comparisons between different age and gender groups, as well as the intrinsic evaluation of results; some of the reported similarities are <0.25, as we will show in details in Sections 5.1–5.3. Therefore, it is important to note here that not all the figures show the same set of ADRs.
4.8.1 Drugs’ Similarities to Different Adverse Reactions
The number of ADRs; with similarities ≥0.25 to each drug are shown in Tab. 2. From this table, it can be seen that a total of 53 ADRs were reported, with the highest number of ADRs obtained for Amlodipine, followed by Lisinopril then Atenolol respectively. Figs. 3 and 47 show the ADRs’ details and similarity values for the corresponding drugs. Even though the three drugs belong to three different families, there are commonly reported ADRs, like dizziness, fatigue, tiredness, headache, anxiety, depression, and Cramp. However, the similarities are somehow different for each of the drugs. There are also some ADRs specific to individual drugs, like Oedema, Bradycardia, and Cough for Amlodipine, Atenolol, and Lisinopril respectively.
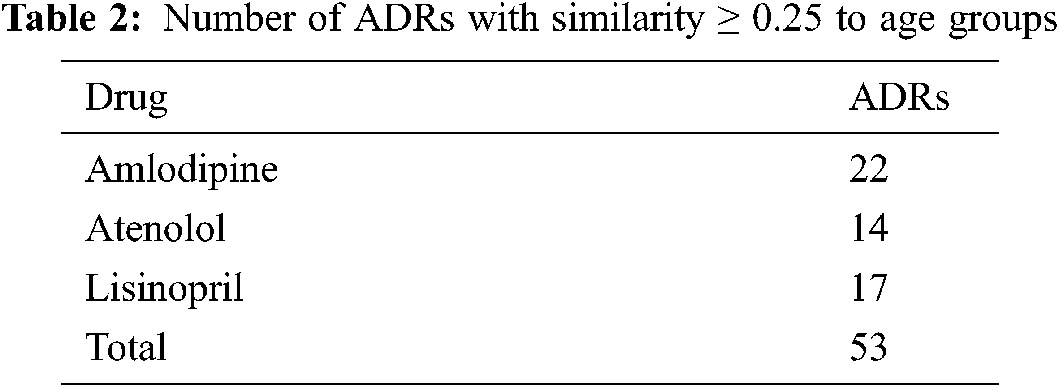
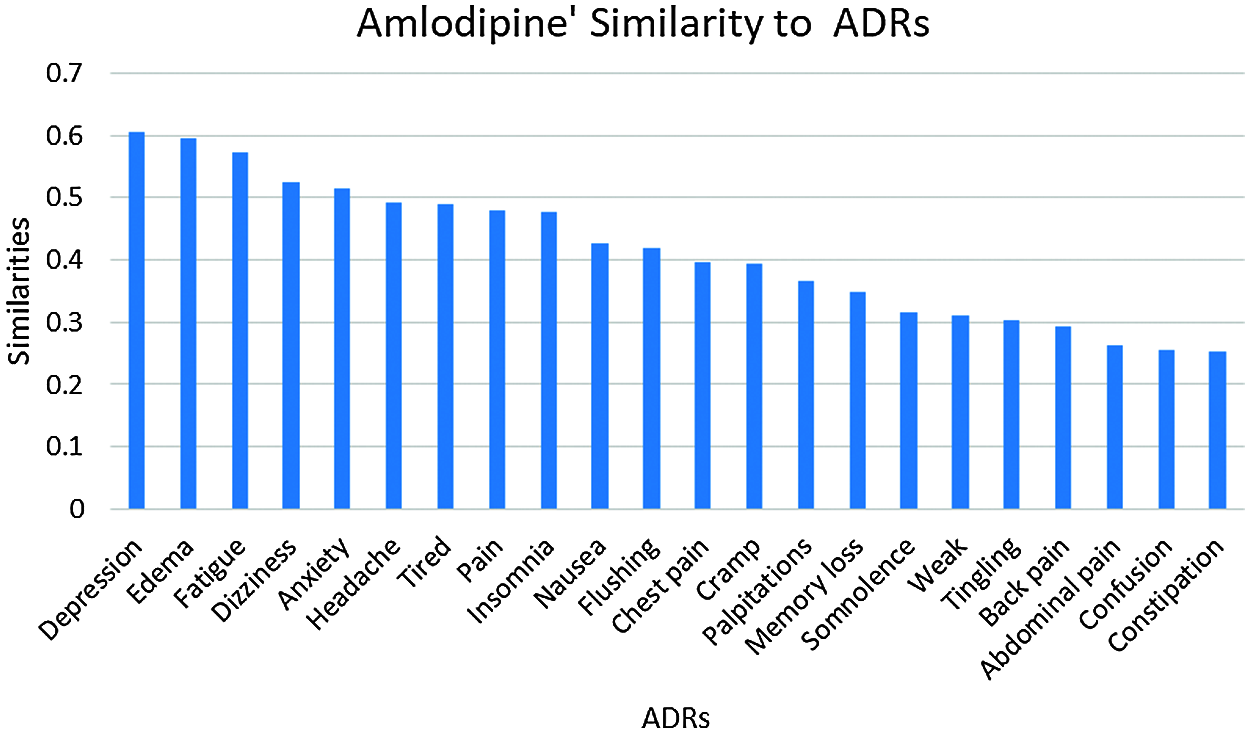
Figure 3: Amlodipine similarities to its ADRs
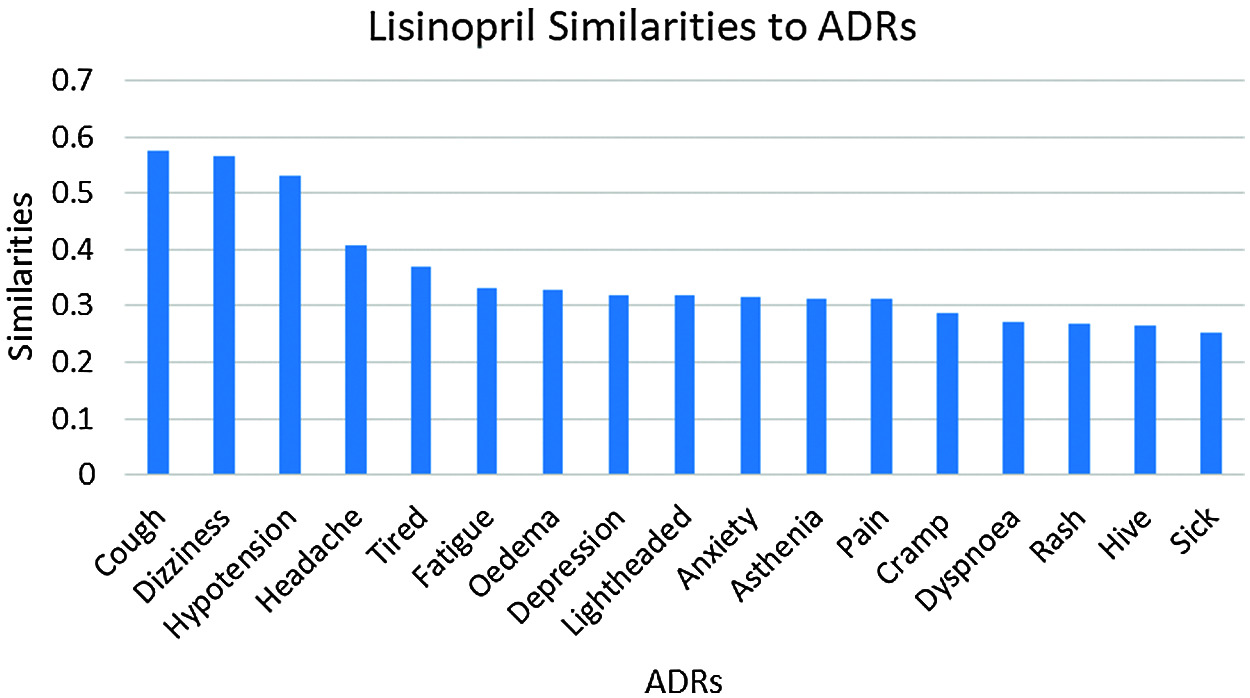
Figure 4: Lisinopril similarities to its ADRs
4.8.2 Age-Groups Similarities to Different ADRs
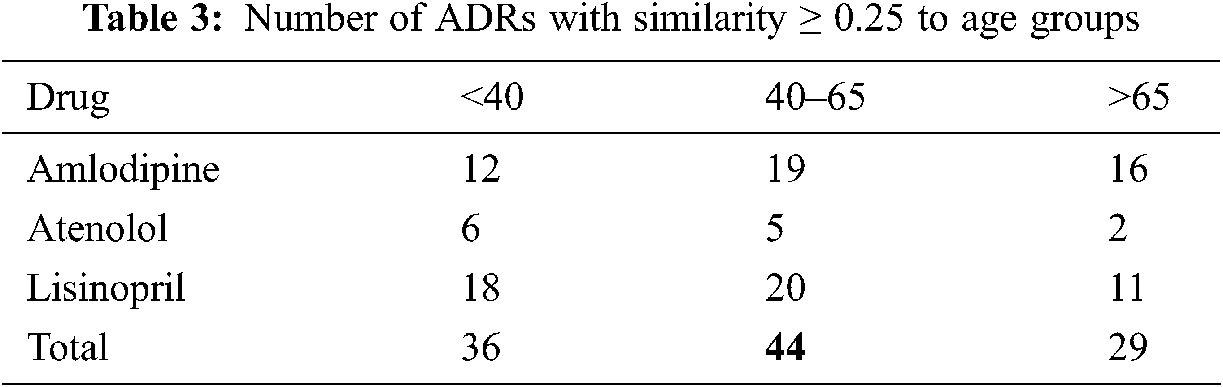
Given the high similarities between drugs and some of the ADRs as shown in Section 4.8.1, we further investigate the similarities between these ADRs; and different age, and gender groups. Again, only similarities ≥0.25 are reported. The number of ADRs with similarities ≥0.25 to different age-groups are shown in Tab. 3. From that table, it can be seen that the number of ADRs increases with age, with a peak for the age-group 40–65 years, then slightly decrease for age-group >65. Figs. 5 and 6 show the ADRs and their similarities to different age-groups. From these figures, it can be seen that Amlodipine has 6 ADRs with similarities ≥0.50 to age-group 40–65, with lower similarities to other age groups. For Lisinopril, the age-group 40–65 has similarity ≥0.50 to one ADR, which is the case for age-group <40. It can also be noticed that some ADRs are more common in an age group than the others. For example, the highest similarities to ADRs in general are noticed in the age group 40–65. However, there are some exceptions to that, where dizziness and lightheadedness are more similar to age group <40 for the Lisinopril drug. These outcomes are consistent with pharmaceutical domain knowledge [21].
4.8.3 Gender-Groups Similarities to Different ADRs
Results in Tab. 4, and Figs. 7 and 8 show that the number of ADRs are higher in females compared to males, where a total number of 43 ADRs were found, as compared to 37 for males. Types and similarities of ADRs are shown in Figs. 7 and 8. From these figures, it can be seen that for Amlodipine drug, Females had similarities ≥0.50 to six ADRs, and ≥0.30 to twelve ADRs, where males had only similarities ≥0.30 to fourteen ADRs. For Lisinopril, both males and females had similarities >0.50 with one ADR, and similarities ≥0.30 to nine and ten ADRs respectively. Again common ADRs can be seen for both male and female groups, and some other have higher similarities to females, like tingling, cough, and Oedema.
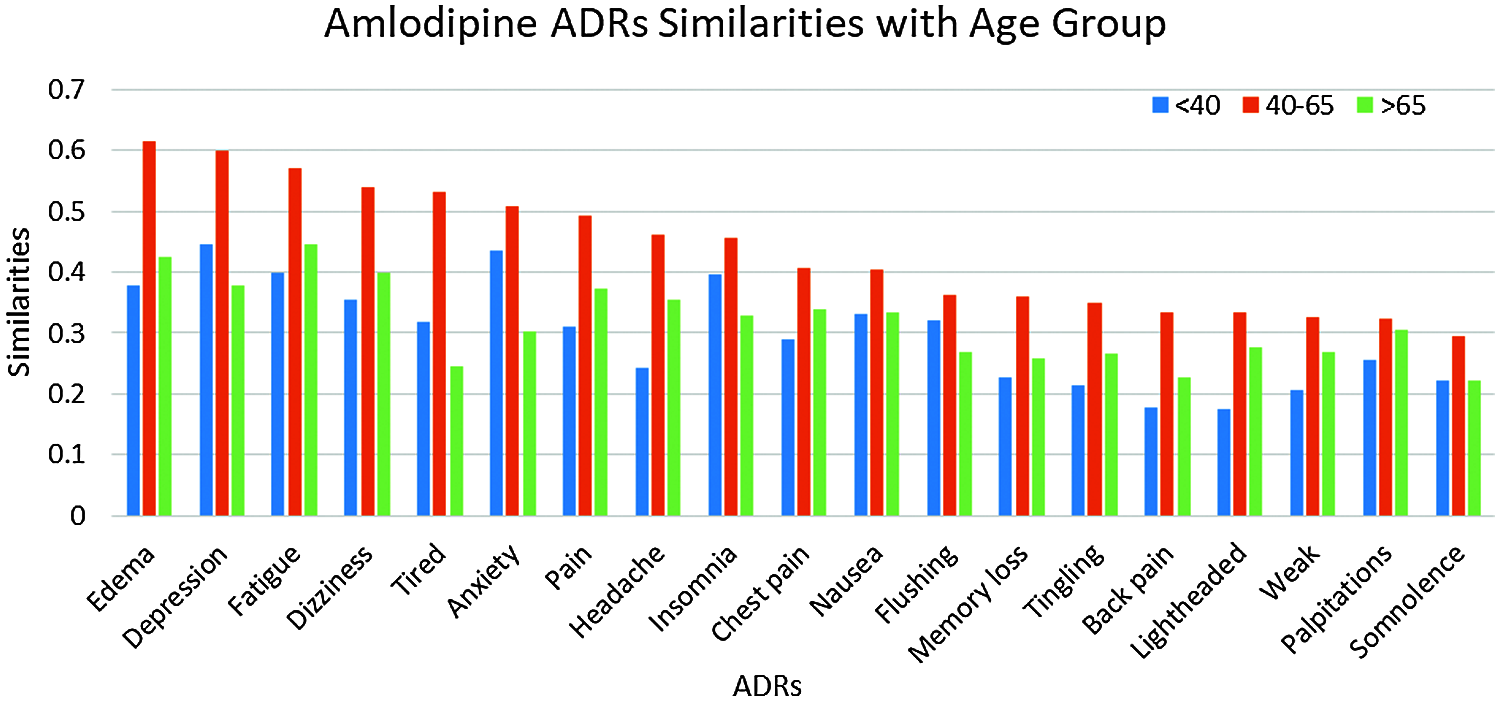
Figure 5: Similarities of amlodipine ADRs to age groups
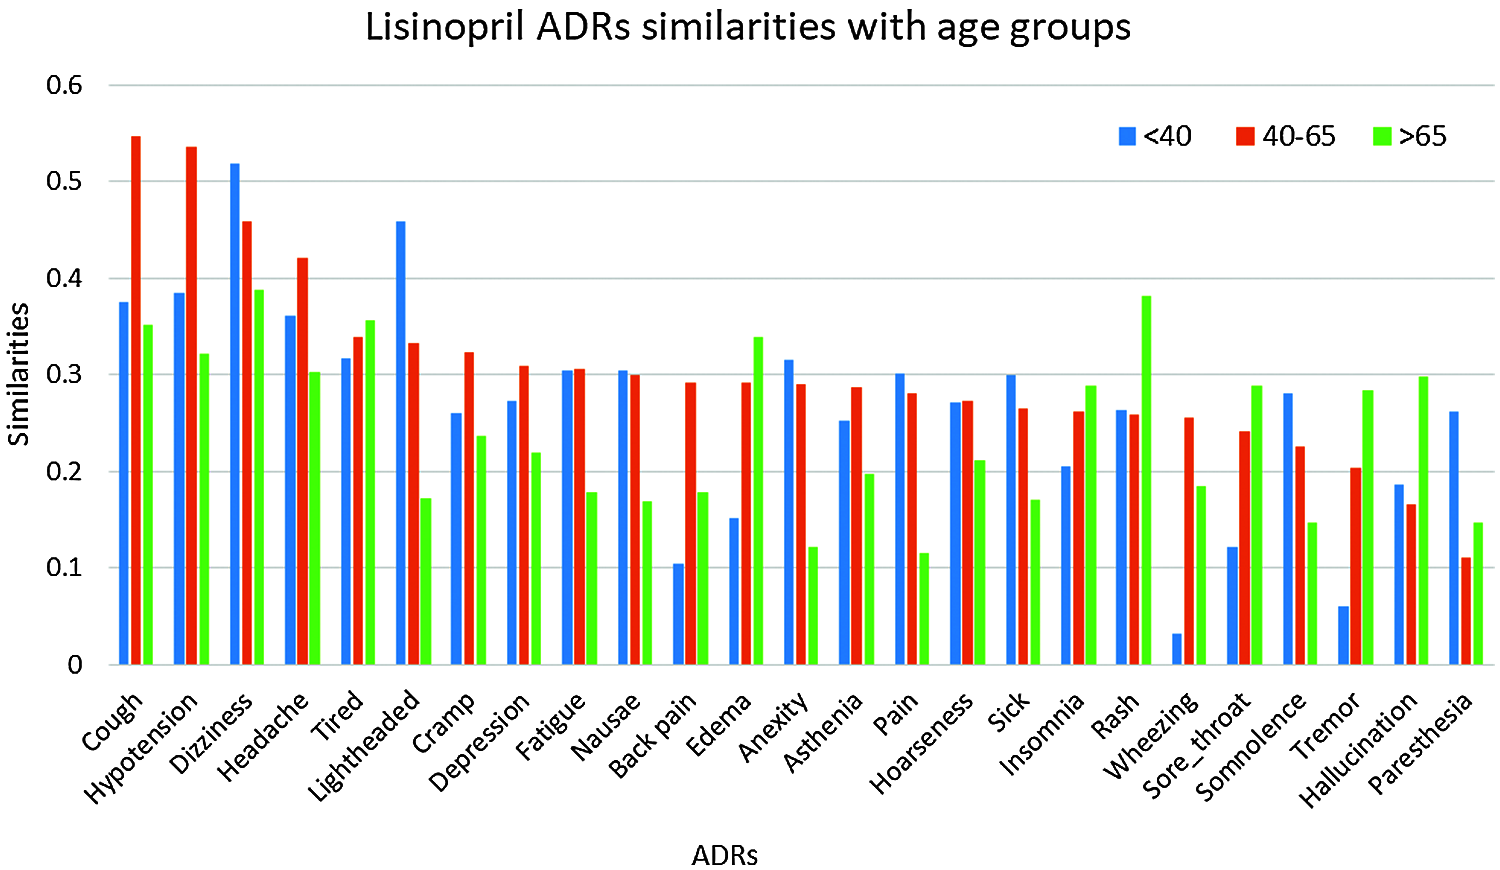
Figure 6: Similarities of lisinopril ADRs to age groups
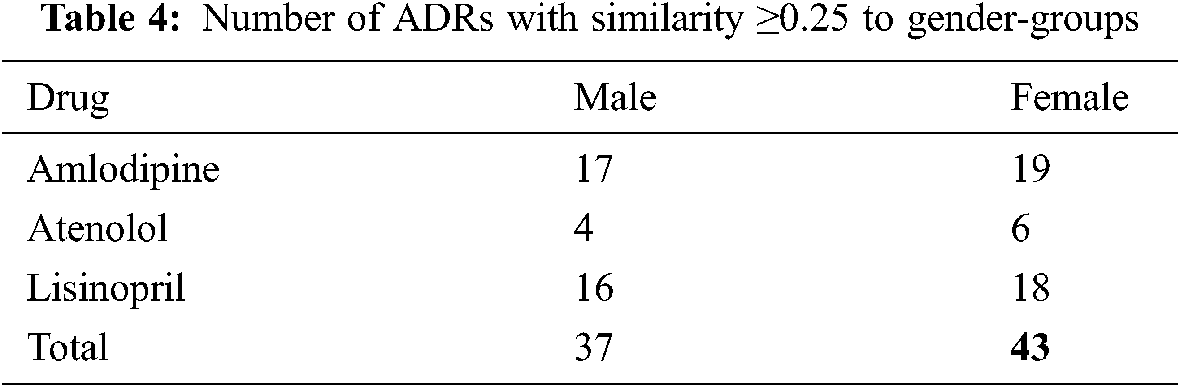
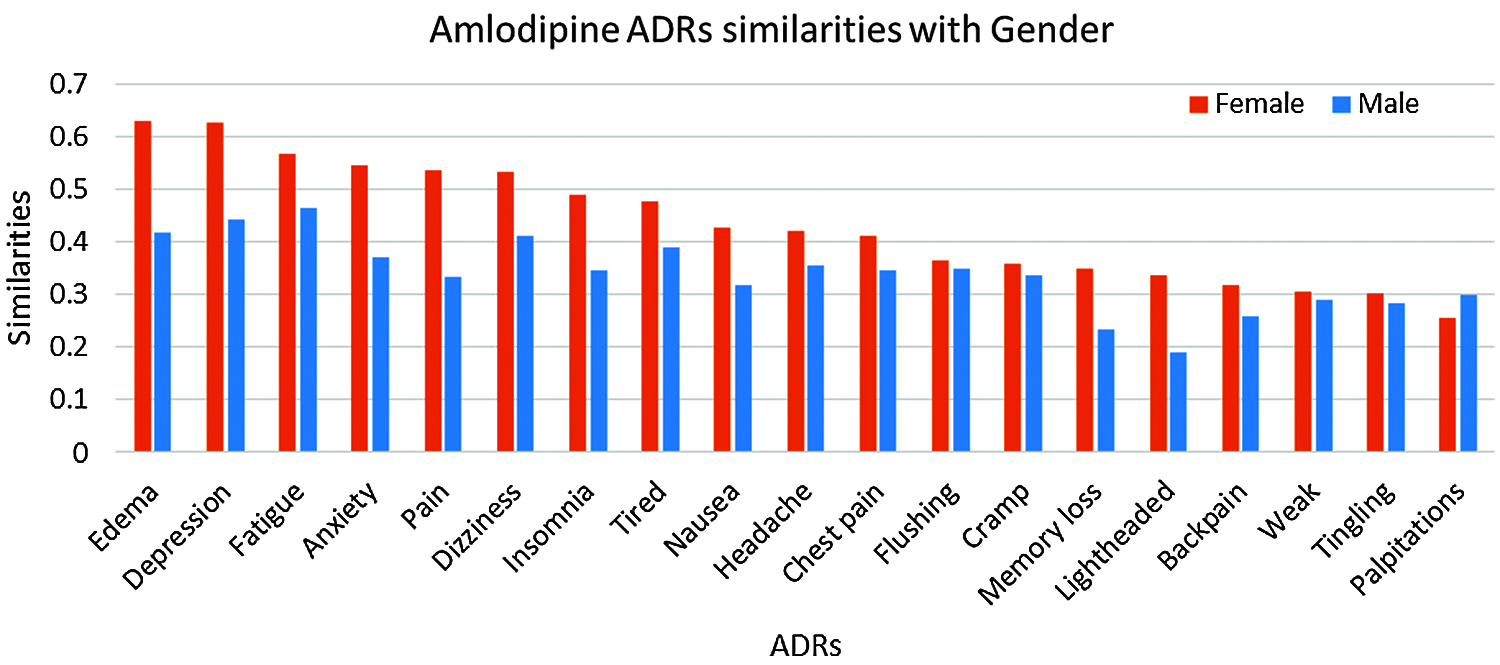
Figure 7: Similarities of amlodipine ADRs to gender-groups
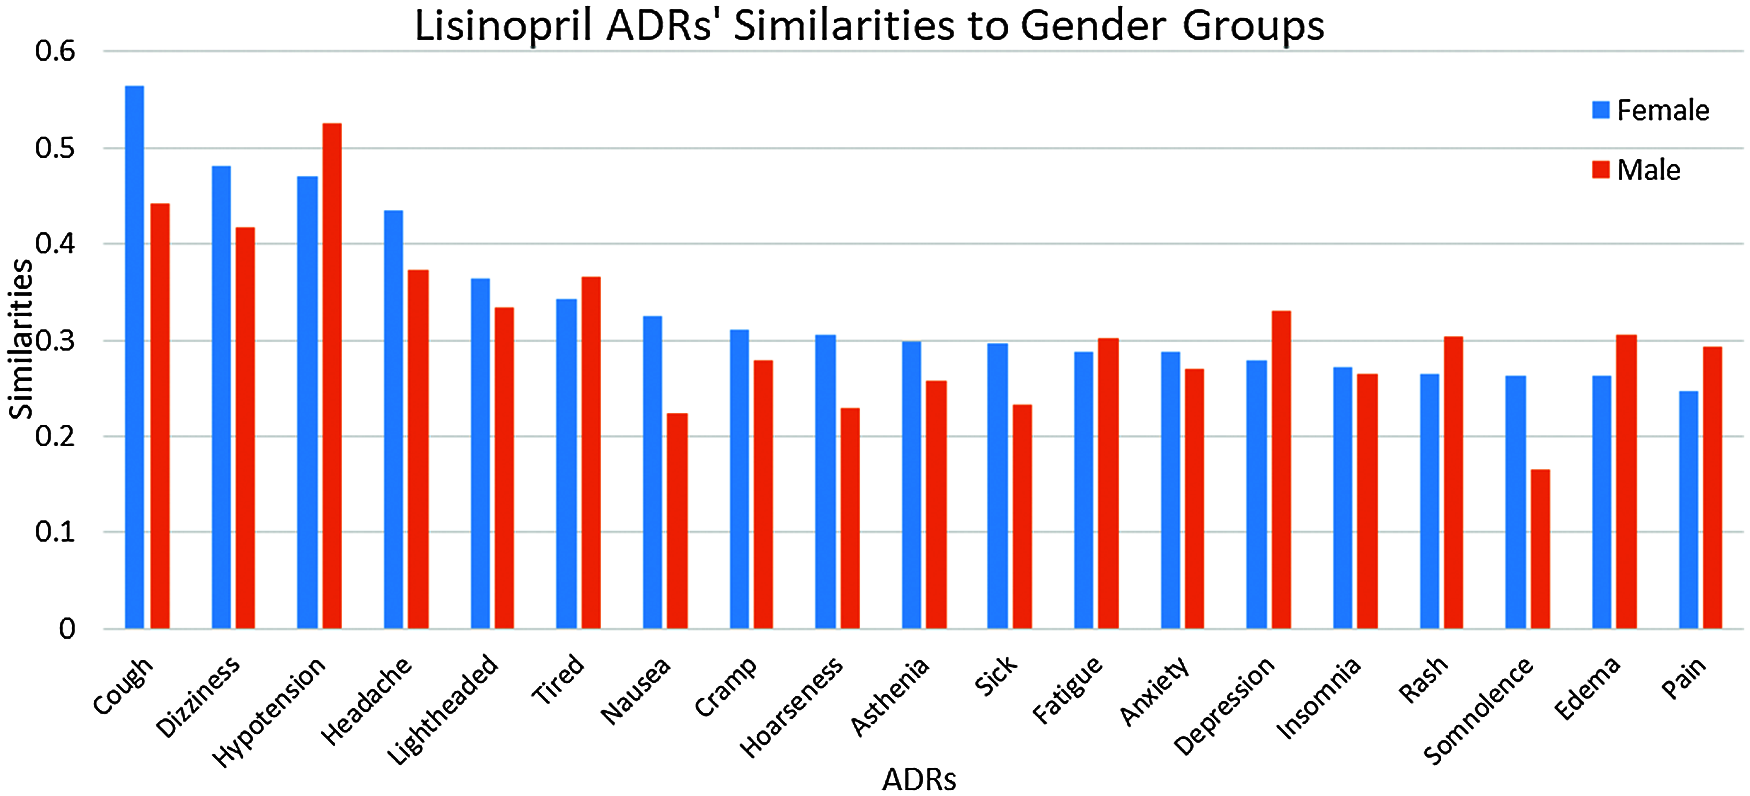
Figure 8: Similarities of lisinopril ADRs to gender-groups
5 Intrinsic Evaluation of Stage 1 Results
As shown in Section 4.8, very promising results have been obtained. Therefore, it was necessary to evaluate those results using intrinsic evaluation methods; details are shown in Sections 5.1 and 5.2.
5.1 Drug-ADRs Similarity Evaluations
To evaluate our hypothesis regarding ADRs’ similarities to individual drugs and their frequency; a comparison between the obtained ADRs; and the already known ADRs’ for the same drugs have been performed. SIDER database [22] has been utilized for this purpose; and ADRs appeared in both SIDER and our ADRs’ lexicon (the intersection of the two lists) have been considered. This was due to the fact that, some SIDER ADRs were not reported in our data set; and many of our data sets’ ADRs either are not listed on SIDER’s database, or listed, but do not have frequencies yet. Based on the average drug—ADRs similarities, a descendingly sorted list of ADRs for each drug have been obtained, with the ADR with highest similarity at the top. SIDER’s ADRs were also descendingly sorted, based on the average frequencies of the ADRs; where the ADR with highest average frequency at the top. Spearman’s rank correlation coefficient (rs) is then obtained between our sorted list of ADRs, and SIDER sorted list of ADRs for each drug [22]. Tab. 5 shows the obtained rs values. From this Table, It can be seen that there is a strong ranking correlation between the reported ADRs’ frequencies by SIDER database [22]; and our obtained ADRs’ similarities for all drugs; where rs had the values of 0.7458, 0.6678, and 0.5929 for Amlodipine, Atenolol and Lisinopril ADRs respectively, and the results were statistically significant with p < 0.05, p < 0.05, and p < 0.01 respectively. The relatively low rs value for Lisinopril can be attributed to the larger number of common ADRs; compared to the other two drugs. Figs. 9 and 10 show the detailed ADRs’ rankings compared to SIDER’s rankings for Amlodipine and Lisinopril respectively.
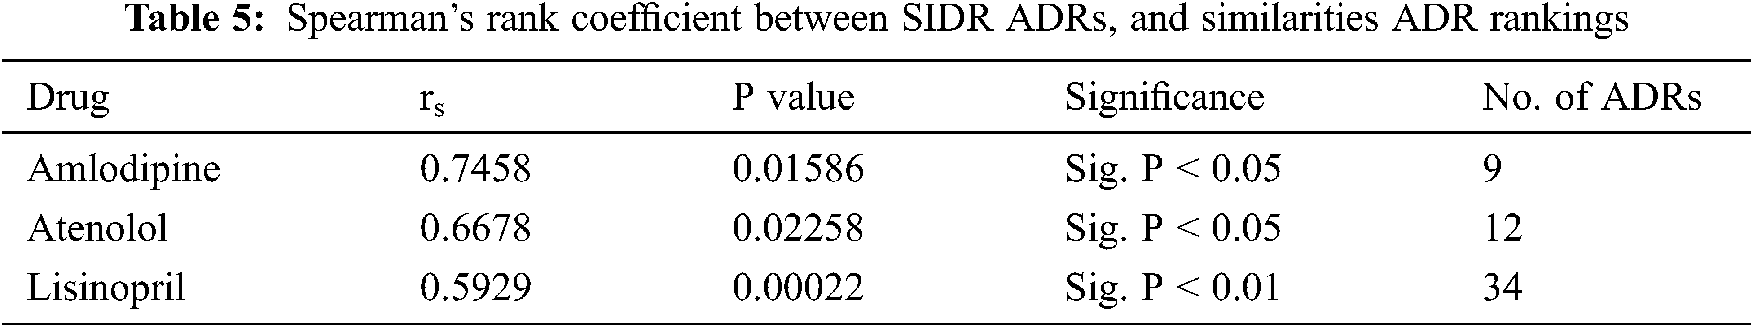
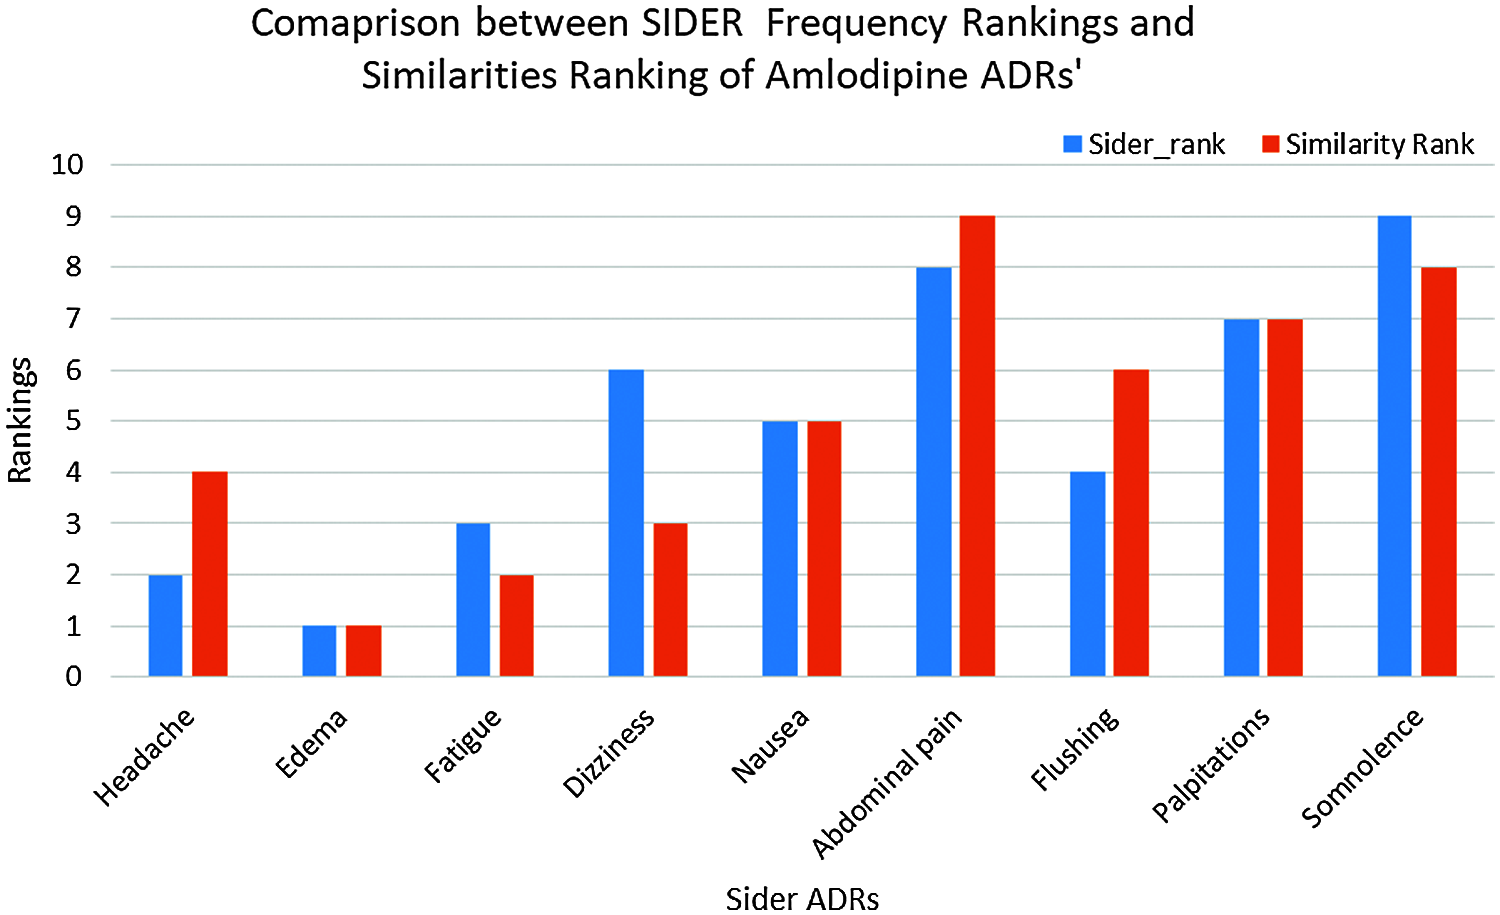
Figure 9: SIDER vs. similarities for amlodipine ADRs ranking
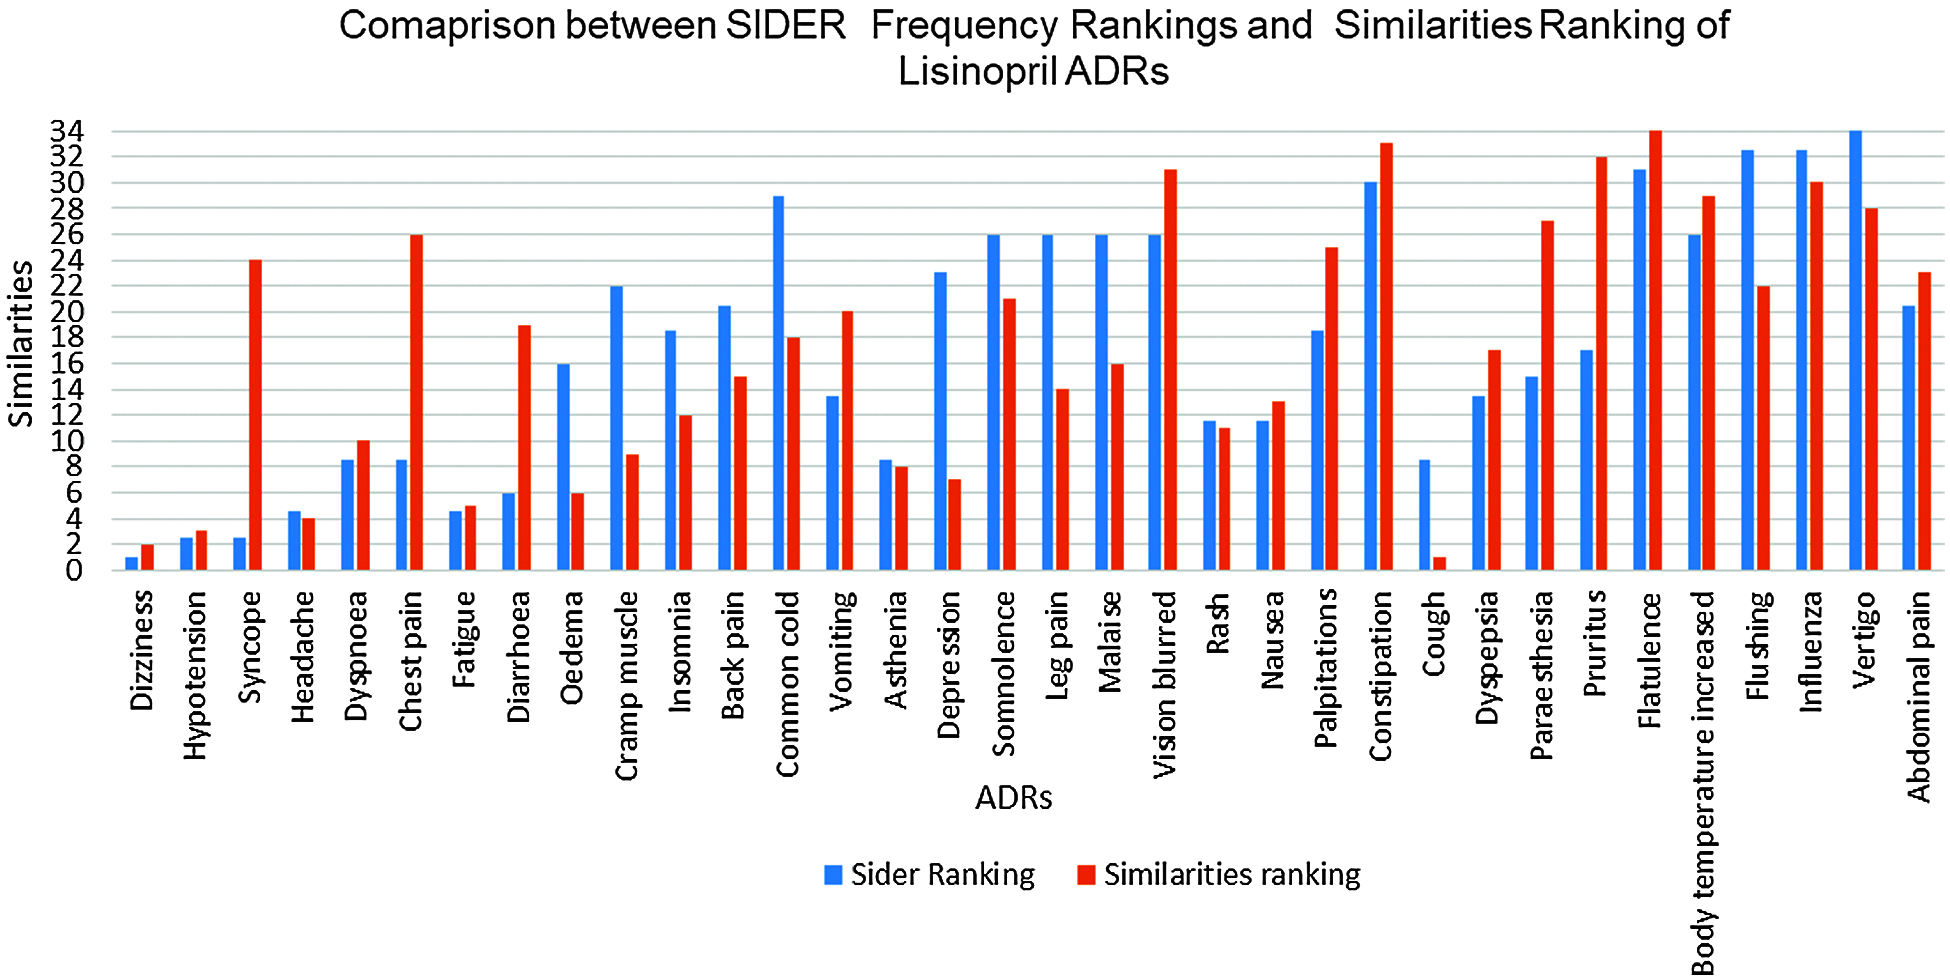
Figure 10: SIDER vs. similarities for lisinopril ADRs ranking
5.2 Intrinsic Evaluation of ADRs’ Similarities to Age and Gender-Groups
Given the good evaluation results for all drug-ADR pairs, it would be interesting to see how valid is the obtained similarities between drug ADRs and age and gender groups. As SIDER and other drug databases do not provide frequencies for ADRs in relation to age and gender groups; we suggest here a new intrinsic evaluation method, which uses the area under the ROC curve (AUC); to evaluate different ADRs similarities, as predictors for age and gender groups, using the following data sets described in Section.
From each model, one feature vector corresponding to each age-group is obtained; where similarities between each of the ADRs to each age-group constitute its features; and the age-group is the target class. Therefore, we end up three feature vectors from each embedding model; one for each age-group.
From each model, one feature vector corresponding to each gender-group is obtained; where similarities of each of the ADRs to each gender-group constitute its features; and the gender-group is the target class. Therefore, we end up with two feature vectors from each embedding model, one for each gender-group.
Using above two data sets, different ROC curves have been plotted for different ADRs as predictors for different age or gender groups, and the AUC corresponding to each ADR is obtained. Sample of the results are shown in Section 5.2.2 and 5.2.3.
5.2.2 Results for ADRs’ Similarities to Age-groups
Tab. 6 shows a sample of the AUC values obtained for different ADRs as predictors to different age-groups. The variability of the AUC values refers to the extent to which a specific ADR similarity (relatedness) to an age-group is discriminative from the other two age-groups. Fig. 11 shows sample of ROC curves obtained for the performance of different ADRs as age-group predictors; for Lisinopril. From Tab. 6 and the figures, it can be seen that most of the ADRs achieved very high AUC values for all age-groups and all drugs. However, some AUCs also were <0.60 in some cases. High AUC values indicate that different age-groups experience different ADRs with different frequencies. Even in the cases of AUCs <0.60, those are for specific age-groups, and other age-groups have higher AUCs for the same ADR and drug. Furthermore, all the AUCs with values <0.60 for a specific age-group and ADR can be attributed to the fact that the average ADR similarity to that age-group; has a value between the average similarities of the other two age-groups.
5.2.3 Results for ADRs’ Similarities to Gender-groups
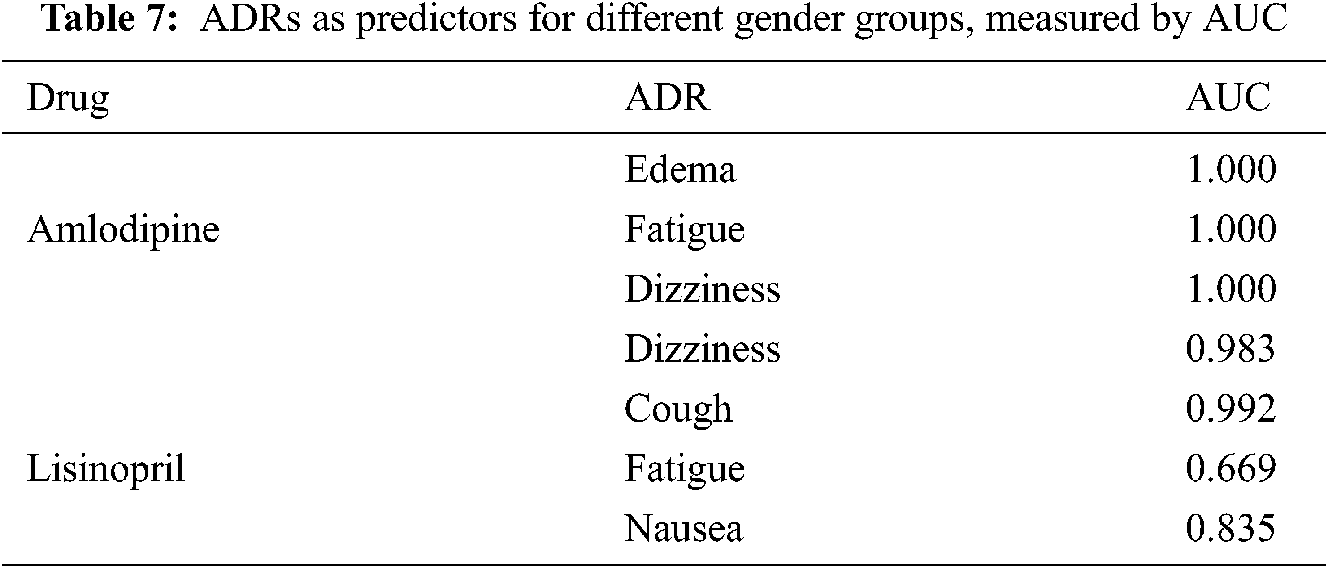
Tab. 7 shows a sample of the AUCs values obtained by different ADRs as predictors for gender-groups. From this table, it can be seen that almost all ADRs obtained very high AUCs with value of 1 in some cases, in predicting gender-groups, which means that the ADRs affect both genders differently, as reflected by the similarity values.
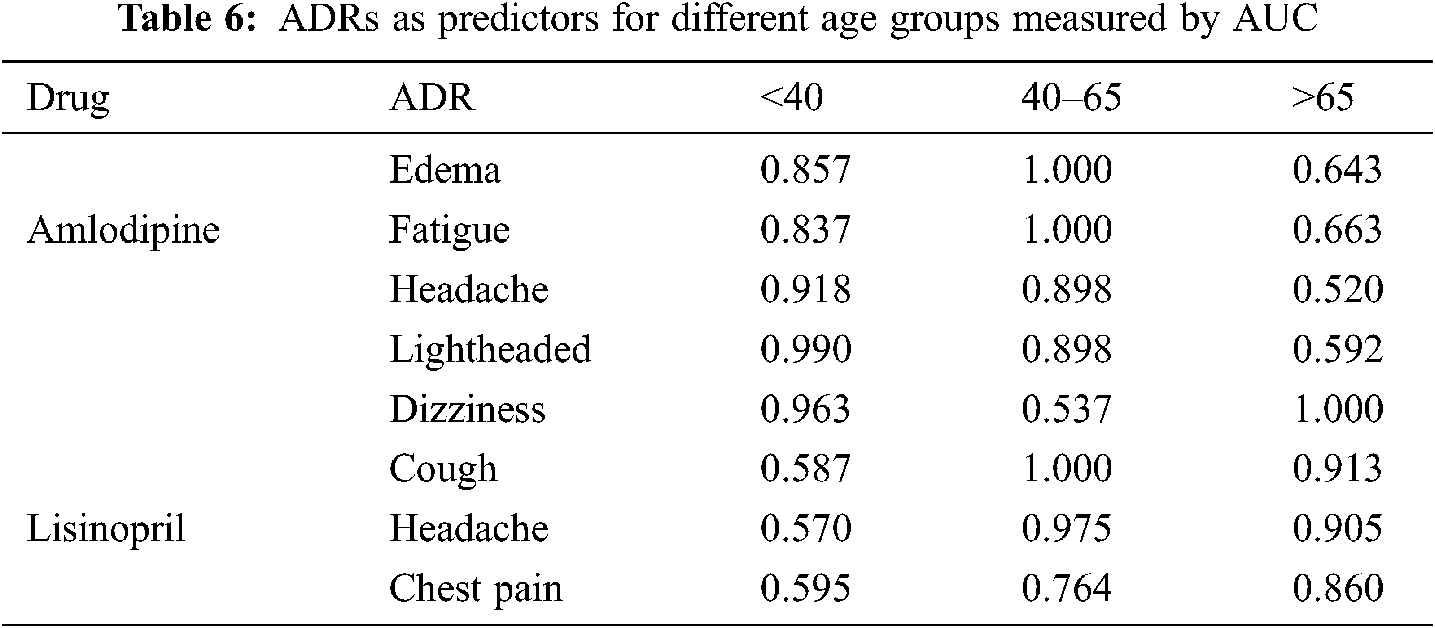
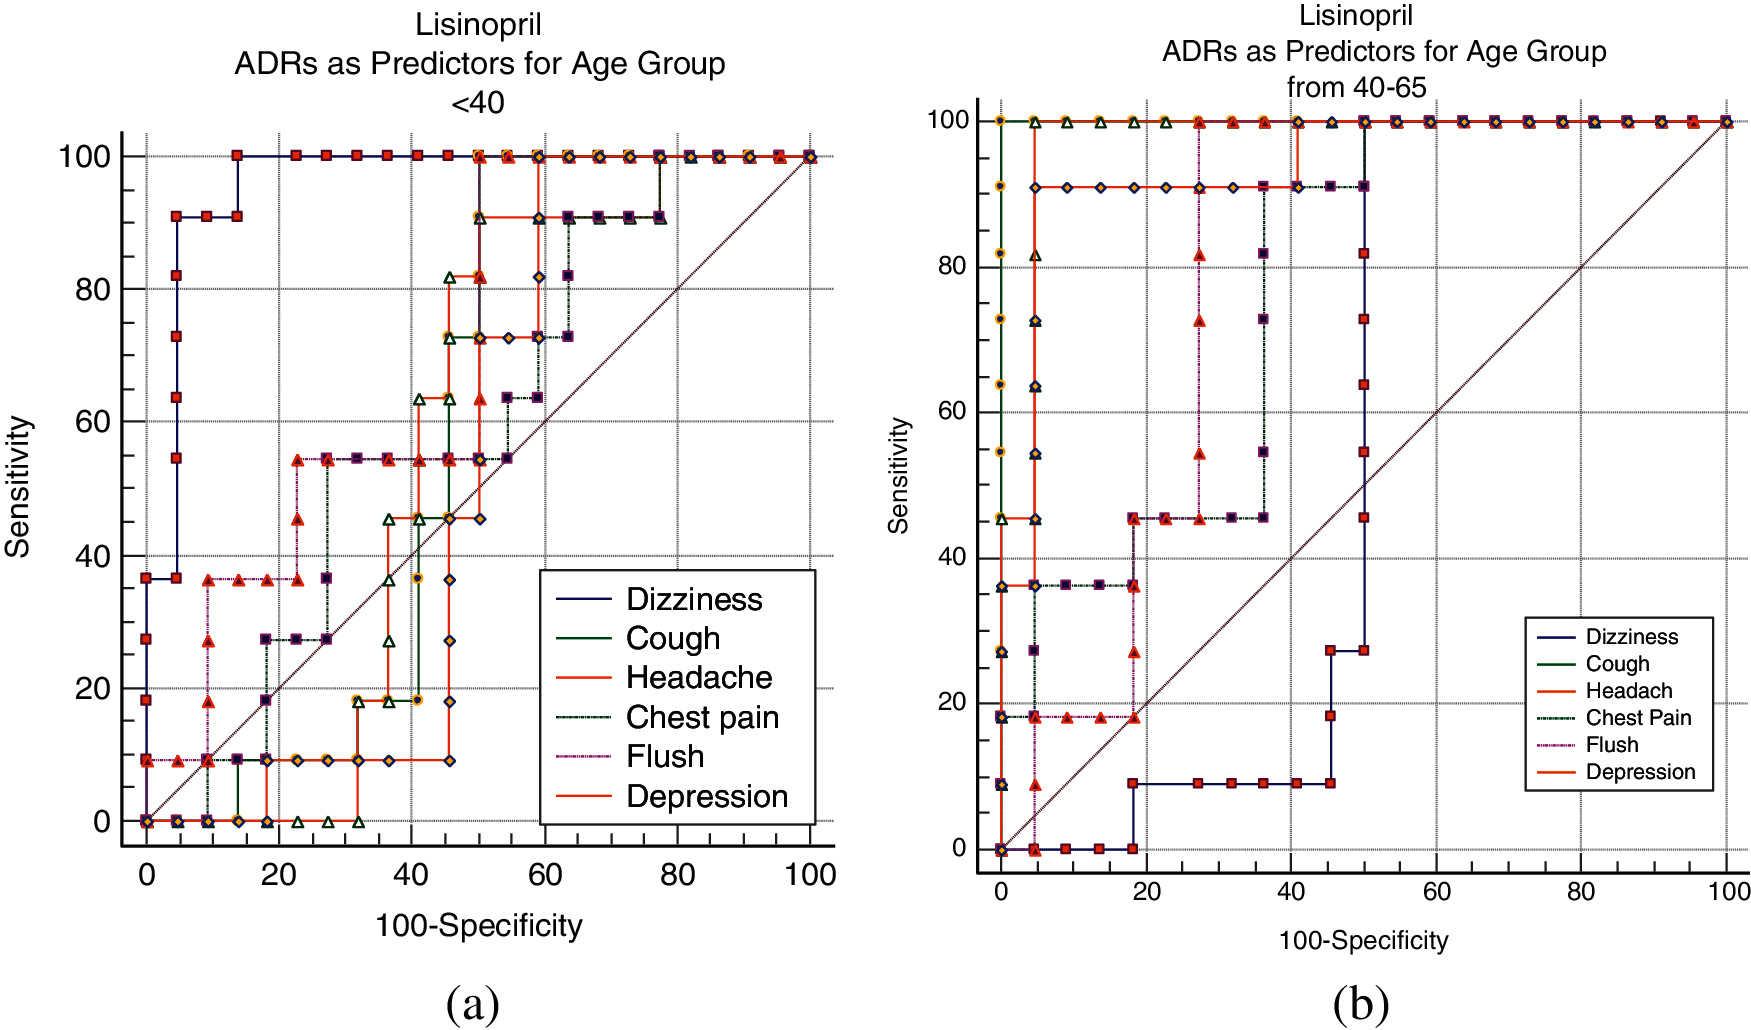
Figure 11: Lisinopril ADRs as predictors for age groups; (a) <40, (b) 40–65
6 Stage 2: Predicting Future ADRs Probabilities
In this section, feature engineering and two stage supervised machine learning method is used for the prediction of drug’s most frequent ADRs, given the patient age and gender, and ADRs similarity parameters to both age and gender groups; as obtained in the previous sections. This section can be also considered as extrinsic evaluation of our proposed approach. For this stage, a different, real life data set has been utilized in all the following steps, which are detailed in the following sections.
The data sets for this stage have been obtained from FDA (FAERS)8 pubic dashboard, which offers access to reported ADRs by patients and other medical entities. Data was downloaded for the drugs Atenolol, Amlodipine, and Lisinopril, which was then cleaned by removing duplicate records, and filtered to only include “hypertension” or “high blood pressure”, or “high BP” as indication for the drugs. The input features considered from these data sets are the patient age and gender. The class labels for each drug is handled as follows: all records that reported the ADR under consideration are considered as positive examples; while records that reported other ADRs, but not the aforementioned ADRs constitute the negative examples. In particular, the positive examples are the records that reported Oedema as ADR for Amlodipine, Dizziness as ADR for atenolol, and Cough as ADR for Lisinopril. A sample of the records that reported other but not the aforementioned ADRs constituted the negative examples. In summary, the extracted features from FAERS reports include drug name, age, gender, and class label (ADR exist, none). This in addition to other engineered features which are used to extend the input feature space, as described in Section 6.2.
6.2 Feature Engineering Based on Embeddings
Building on our hypothesis, feature engineering has been used for ADRs prediction. Given that different embedding sizes result in different values for drug-ADR pair similarities, while the window is fixed, it has been found that similarities decreases with larger embedding sizes, while smaller embedding sizes lead to similarity increase. Therefore, and based on the results obtained in Section 5, we assume that the examples taken from FAERS reporting system and reported the ADRs we study have the highest (maximum) similarity for drug-ADR pair, while those which did not report that ADR would have the minimum similarity. It should be noted here that we did not assume zero similarity here instead of minimum similarity to cater for other factors that might cause the ADR to appear. Therefore, the data sets have been extended with the feature similarity parameters, which was used with both positive and negative examples as follows:
6.2.1 Similarity Parameters Added to Positive Examples.
Considering Atenolol and dizziness as example, the features will be:
• Maximum similarity of a dizziness to different age-groups (different for each age-group),
• Maximum similarity of dizziness to gender (different for male/female),
• Class: dizzy.
6.2.2 Similarity Parameters Added to Negative Examples.
• Minimum similarity of a dizziness to different age-groups (different for each age-group),
• Minimum similarity of dizziness to gender (different for male/female),
• Class: none.
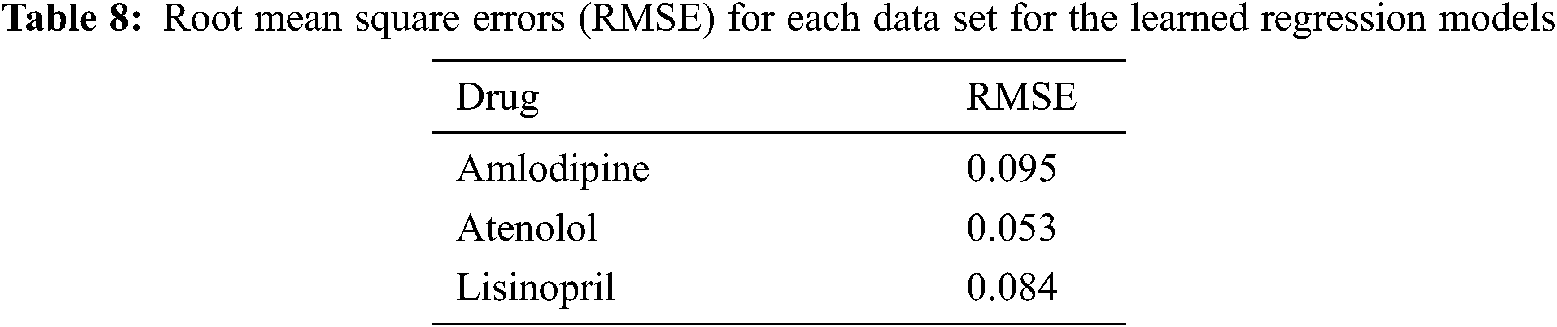
6.3 Age-ADR Similarity Parameters Fine Tuning
As the similarity was obtained for age groups, it was important to fine tune ADR similarities to individual ages in the above data set. To achieve that, Support Vector regression has been used, which was trained using 10 fold cross validation, with FAERS data set; age, gender, in addition to and gender-ADR similarity parameter, as input features, while age group-ADR similarity parameter is the predicted value. The target age group-ADR similarity parameter is then replaced by their predicted values, which are used in all the following steps. Tab. 8 shows the root mean square error (RMSE) for each data set for the learned regression models.
6.4 Predicting Similarity Parameters for New Patients
To predict whether a new patient will suffer a specific ADR, we need first to predict his/her similarity parameters, which is handled as follows:
As a result of the step 6.3, we have a regression model to predict age-ADR similarity parameters; given the age, gender and gender-ADR similarity parameter for the new patient, while the predicted value is the ADR–age similarity parameter. Using the above obtained similarity parameter, the ADR existence (class label) is predicted using supervised machine learning algorithm as the second step. To evaluate the proposed method, three training data sets of 647, 38% positive and 62% negative; 320, 50% positive, 50% negative; and 556, 45% positive and 55% negative examples; for Amlodipine, Atenolol, and Lisinopril respectively. Results are shown in Section 6.5.
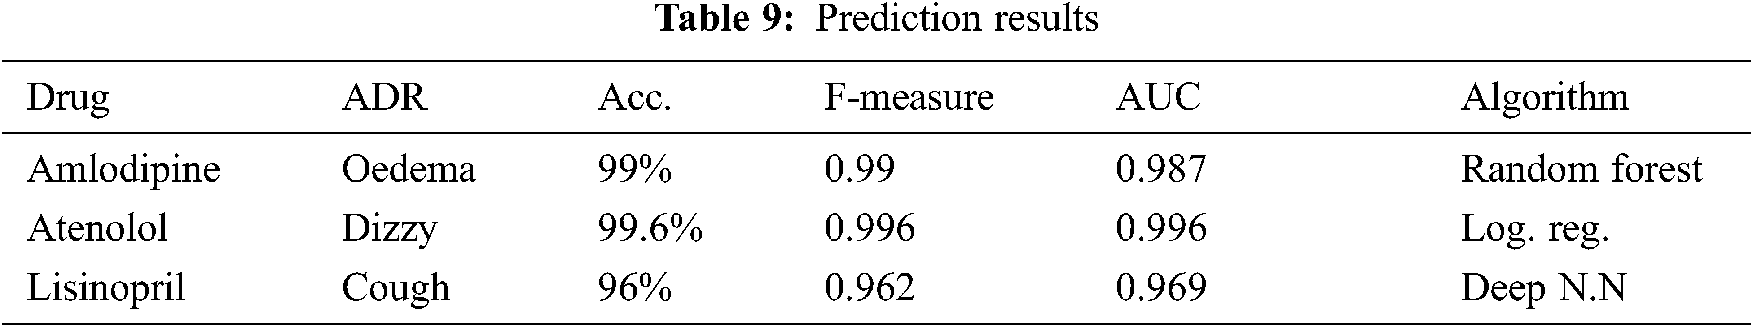
Several machine learning algorithms have been tested, and random forest, logistic regression and, deep Neural network [23] with five hidden layers; trained using 10 fold cross validation achieved the best results for amlodipine, Atenolol, and Lisinopril respectively. Tab. 9 shows the obtained results on predicting the probabilities of most frequent ADRs; for each of the three drugs. From this table, it can be seen that ADRs can be predicted, with very high accuracy, AUC, and F-Measure; ranging from 99 to 96%. The high results can be attributed to the almost separable values of the similarity parameters.
In this paper, we proposed a two stage intelligent algorithm called “Simi_to_Prob” to extract, quantify and rank the ADRs of three antihypertensive drugs, utilizing posts from medical, social forums. The hypothesis was that if an ADR is appearing closer (as measured by cosine similarity) than other ADR to a drug; then it is likely that this ADR exists more frequently compared to other ADRs. We also compared the prevalence of ADRs, considering different age and gender groups. It has been shown that ADRs are more common in females than males, and in age-group 40–65, compared to the other two age-groups. Based on the aforementioned findings, a two-step supervised machine learning algorithm have been then used to predict probabilities of the most frequent ADRs for each drug. The AUC have been used for the first time for intrinsic evaluation. Many of the obtained ADRs in this study were previously known, and some of them are reported as post marketing, but still no frequencies reported for them. For example, anxiety, headache for Atenolol, and others still not reported by SIDER. Our results also showed that some known ADRs have higher similarity (frequency) than the same ADRs reported in SIDER, like Cough for Lisinopril, and Nausea for Atenolol. This opens an extended research area to explore more ADRs for existing and new drugs, given the simplicity of proposed approach, and the promising results it obtained. Furthermore, it can help in discovering the pattern of usage of different drugs by different gender and age-groups, where it was found that some drugs are more commonly prescribed for certain age and/or gender groups. The proposed methods can also be utilized in other domains to explore the relatedness of different concepts in text corpuses from social media and other sources. One potential limitation of this study is the inability to detect misspelled and/or colloquial description of ADRs. But given the high rs value with SIDER ADRs list show that those cases did not influence the results.
1 2https://www.medhelp.org/forums/Hypertension/show/1222
3https://(https://www.askapatient.com/)
4More papers are reviewed in the appendix
5 6 7Atenolol figures are available in the appendix
8Funding Statement: This research did not receive any specific grant from any funding agencies.
Conflicts of Interest: The authors declare that they have no conflicts of interest to report regarding the present study.
1. A. Sarker, R. Nikfarjam, K. O’Connor, K. Smith, S. Jayaraman et al., “Utilizing social media data for pharmacovigilance: A review,” Journal of Biomedical Informatics, vol. 54, no. 3, pp. 202–212, 2015. [Google Scholar]
2. F. K. Khattaka, S. Jebleea, C. Pou-Proma, M. Abdallaa, C. Meaney et al., “A survey of word embeddings for clinical text,” Journal of Biomedical Informatics: X, vol. 4, pp. 1–18, 2019. [Google Scholar]
3. K. S. Kalyan and S. Sangeetha, “SECNLP: A survey of embeddings in clinical natural language processing,” Journal of Biomedical Informatics, vol. 101, pp. 1–21, 2020. [Google Scholar]
4. K. L. Chan and M. Chen, “Effects of social media and mobile health apps on pregnancy care: Meta-analysis,” JMIR mHealth and uHealth, vol. 17, no. 1, pp. 118–136, 2019. [Google Scholar]
5. A. C. Tricco, W. Zarin, E. Lillie, S. Jeblee, R. Warren et al., “Utility of social media and crowdintelligence data for pharmacovigilance: A scoping review,” BMC Medical Informatics and Decision Making, vol. 18, pp. 1–14, 2018. [Google Scholar]
6. World Health Organization, Safety Monitoring of Medicinal Products: Guidelines for Setting Up and Running a PHarmacovigilance Centre, The Uppsala Monitoring Centre (the UMCUppsala, Sweden, Geneva, 2000. [Google Scholar]
7. M. Tiftikci, A. Özgür, Y. He and J. Hur, “Extracting adverse drug reactions using deep learning and dictionary based approaches,” in Proc. the Tenth Text Analysis Conf. (TAC 2017Maryland, USA, 2017. [Google Scholar]
8. D. Pappa and L. K. Stergioulas, “Harnessing social media data for pharmacovigilance: A review of current state of the art, challenges and future directions,” International Journal of Data Science and Analytics, vol. 8, no. 2, pp. 113–135, 2019. [Google Scholar]
9. C. Y. Lee and Y. P. P. Chen, “Machine learning on adverse drug reactions for pharmacovigilance,” Drug Discovery Today, vol. 24, no. 7, pp. 1332–1343, 2019. [Google Scholar]
10. A. Nikfarjam, A. Sarker, K. O’Connor, R. Ginn and G. Gonzalez, “Pharmacovigilance from social media: Mining adverse drug reaction mentions using sequence labeling with word embedding cluster features,” Journal of the American Medical Informatics Association, vol. 22, no. 3, pp. 671–681, 2015. [Google Scholar]
11. B. Fana, W. Fan, C. Smith and H. Garner, “Adverse drug event detection and extraction from open data: A deep learning approach,” Information Processing & Management, vol. 57, no. 1, pp. 102–131, 2020. [Google Scholar]
12. R. Leaman, L. Wojtulewicz, R. Sullivan, A. Skariah, J. Yang et al., “Towards internet-age pharmacovigilance: Extracting adverse drug reactions from user posts in health-related social networks,” in Proc. 2010 Workshop on Biomedical Natural Language Processing, Uppsala, Sweden, 2010. [Google Scholar]
13. A. Patki, A. Sarker, P. Pimpalkhute, A. Nikfarjam, R. Ginn et al., “Mining adverse drug reaction signals from social media: Going beyond extraction,” in Proc. BioLink-SIG, Boston, USA, 2014. [Google Scholar]
14. B. W. Chee, R. Berlin and B. Schatz, “Predicting adverse drug events from personal health messages,” in Proc. the American Medical Informatics Association (AMIA) Annual Symp., USA, vol. 2011, pp. 217–226, 2011. [Google Scholar]
15. M. Zhao, A. J. Masino and C. C. Yang, “A framework for developing and evaluating word embeddings of drug-named entity,” in Proc. The BioNLP, 2018 Workshop, Melbourne, Australia, pp. 156–160, 2018. [Google Scholar]
16. A. Sarker and G. Gonzalez, “A corpus for mining drug-related knowledge from twitter chatter: Language models and their utilities,” Data in Brief, vol. 10, no. Pt 1, pp. 122–131, 2017. [Google Scholar]
17. R. Aronson l. and F. M. Lang, “An overview of metamap: Historical perspective and recent advances,” Journal of the American Medical Informatics Association, vol. 17, no. 3, pp. 229–236, 2010. [Google Scholar]
18. Y. G. Tedla and L. E. Bautista, “Drug side effect symptoms and adherence to antihypertensive medication,” American Journal of Hypertension, vol. 29, no. 6, pp. 772–779, 2016. [Google Scholar]
19. K. Al-Khamaiseh and S. ALShagarin, “A survey of string matching algorithms,” Journal of Engineering Research and Applications, vol. 4, no. 7, pp. 144–156, 2014. [Google Scholar]
20. T. Mikolov, K. Chen, G. Corrado and J. Dean, “Efficient estimation of word representations in vector space,” in Int. Conf. on Learning Representations (ICLR 2013Arizona, USA, 2013. [Google Scholar]
21. V. R. Moore, P. A. Glassman, A. Au, C. B. Good, T. C. Leadholm et al., “Adverse drug reactions in the veterans affairs healthcare system: Frequency, severity, and causative medications analyzed by patient age,” American Journal of Health-System Pharmacy, vol. 76, no. 5, pp. 312–319, 2019. [Google Scholar]
22. M. Kuhn, I. Letunic, L. Jensen and P. Bork, “The sider database of drugs and side effects,” Nucleic Acids Research, vol. 4; 44, no. D1, pp. D1075-9, 2016. [Google Scholar]
23. E. Frank, M. A. Hall and I. H. Witten, Data Mining: Practical Machine Learning Tools and Techniques, 4th ed., San Francisco, USA: Morgan Kaufmann, 2016. [Google Scholar]
 | This work is licensed under a Creative Commons Attribution 4.0 International License, which permits unrestricted use, distribution, and reproduction in any medium, provided the original work is properly cited. |