DOI:10.32604/iasc.2022.022160
| Intelligent Automation & Soft Computing DOI:10.32604/iasc.2022.022160 | |
| Article |
Heart Sound Analysis for Abnormality Detection
1The University of Lahore, Gujrat, Pakistan
2The Superior university, Lahore, Pakistan
3Lahore College for Women University, Lahore, Pakistan
*Corresponding Author: Sohail Masood Bhatti. Email: sohailmasood@superior.edu.pk
Received: 29 July 2021; Accepted: 16 September 2021
Abstract: According to the World Health Organization, 31% death rate in the World is because of cardiovascular diseases like heart arrhythmia and heart failure. Early diagnosis of heart problems may help in timely treatment of the patients and hence control death rate. Heart sounds are good signals of heart health if examined by an expert. Moreover, heart sounds can be analyzed with inexpensive and portable medical devices. Automatic heart sound classification can be very useful in diagnosing heart problems. Major focus of this research is to study the existing techniques for heart sound classification and develop a more sophisticated method. A signal processing technique is been proposed for heart sound classification. Five classifiers, Naive Bayes algorithm, Sequential (SMO), J48, Rep tree and Random Forest (RF) are used for this experiment. A detailed experimentation is performed to fine-tune the method and finally results are compared with the existing systems. The best proposed classifying technique results the overall accuracy of 91.33%.
Keywords: Time-series processing; cardiovascular; arrhythmia; signal processing; pattern recognition
Cardiac disease is one of the main reasons of death around the world [1]. The World Health Organization evaluated that 31% death rate in the World is because of heart diseases, for example, heart arrhythmia and heart failure [2]. Global deaths due to heart disease are 16.7 million in 2002 and estimated 23.3 million in 2030 [3].
Heart disease is a main health problem and a leading cause of death throughout the world. The treatment of cardiac disease can be easy, efficient and cost effective if the disease is diagnosed early and clearly. If the disease is detected early, it would be more convenient to take suitable measures [4].
Dealing with complex data of heart disease such as PCG signals, it seems reasonable to use machine learning both for highlight extraction and classification. The detection of cardiac disease is necessary for patients to survive. Due to lack of proper health facilities and experienced physicians in underdeveloped countries and areas, heart diagnosis is not possible. In case it does happen, it’s critical. The proposed system will be able to categorize heart beat recordings as normal or abnormal. This would be beneficial for the physicians and untrained people to perform an initial screening of a heart disease [5–9].
In the recent years, the high concern about heath management administration and medicinal welfare makes the quick advancement of home medical instruments for health care and diagnosis in everyday life [10]. The Phonocardiogram (PCG) alerts contain extraordinarily precious statistics touching the situation about the heart. Phonocardiography is very beneficial where ECG and others methods of heart disease detection are challenging to implement. Phonocardiography signals consist of information that is useful for diagnosis of heart disease [4]. Phonocardiograms, in addition to other health care have come into wide use for inexperienced users. The phonocardiogram (PCG) has been generally concentrated to research the origin of heart sounds and for location of heart illnesses. Phonocardiogram signal has many features for example, the magnitude and occurrence substance of heart sounds, part of heart sounds, nearness of extra diastolic or systolic mumbles and the attributes of these mumbles, which can uncover heart diseases and the condition of heart function. In the dominant part of cases, the PCG occasions identified with a given disease are contained in particular intervals of the cardiovascular cycle, thus segmentation of the PCG signal and extraction of required features [11]. The dataset is obtained from physionet challenge 2016 (available at: https://physionet.org/challenge/).
The objective of this paper is to develop a system for classification of heart sounds into normal and abnormal so the condition of heart could be intermittently checked at home and everyone doesn’t have to wait for symptoms of heart disorder to show up and after that approach a cardiologist. The aim of our thesis is in accordance with verify the probability of using power spectrum density to calculate additional features from cardiac sound recording which can be utilized for normal and abnormal cardiac sound classification.
Another aim is to evaluate diagnostic classification methods for the diagnosis of cardiovascular disease using various methods to determine diagnostic test.
In past, a lot of work has been done for cardiac patients to survive. Different methodologies have been implemented for cardiac disease identification. The following work has been done by researchers for physionet challenge 2016.
Reference [12] classified heart sound recordings using convolutional neural networks (CNN). Convolutional neural networks are able to automatically extract useful features from Mel- frequency cepstral coefficient heat maps to differentiate among regular and irregular cardiac sounds from noisy data. The results presented from the challenge are with specificity = 93, sensitivity = 76 and overall = 84 [12].
Reference [13] presented a technique depends on feature representation made by a wavelet-based strong convolutional neural network concerning every cardiovascular halo within the test recording. The CNN-based characteristic it approaches joins physiological and otherworldly purposes to shorten the characteristics about entire heart sound recording. This method acquired a score, sensitivity or specificity concerning 81%, 84%, and 77%, respectively [13].
Reference [14] presented a approach for differentation of heart sounds as normal and abnormal. This approach combines a convolutional neural network classifer and a time frequency based trained classifier. The classifier ensemble method received the best rating regarding the struggle including sensitivity, specificity, then overall rating of 94%, 77%, or 86%, respectively [14].
Reference [1] proposed a machine learning system depends on neural systems. The segmentation about the PCG recordings are executed with system established on Hidden Markov Model. The highlights classify the signals as normal or abnormal. The good overall rating completed in the accurate time on the physio net challenge 2016 is 0.79 including specificity 76% then sensitivity 81% [1].
Reference [15] established a system for cardiac sound classification. Cardiac sound recordings were windowed among five second sections also the classifiers were trained according to the five second windowed recordings. Features of this technique contain Mel- frequency cepstral coefficients and spectrograms. Best lean result all through the respectable stage, assessed between overall dataset, has a rating regarding 0.811 together with 77% sensitivity then 85.3% specificity [15].
Reference [16] Presented some other approach for characterization concerning regular and irregular cardiac sounds utilizing a nested group of algorithms as consists of Random Forest, logit-boost and a cost-sensitive classifier. The strategy comprised on iii phases: preprocessing, segmentation and then evaluation. Testing consequences demonstrate as that strategy done a common score on 84.48%, positioning 5th [16].
Reference [17] Developed a classification method for detection of normal and abnormal sounds without segmentation. For this, a subset of 18 highlights is chosen among 40 includes in light of a wrapper highlight selection technique. These highlights were expelled from time recurrence, and time-recurrence spaces with no division. The picked highlights are supported into a group of 20 encourage forward neural frameworks for classification. The calculation got the general exactness of 91.50% (88.7% specificity and 94.2% sensitivity) and 85.9% (86.9% sensitivity and 84.9% specificity) on training and hidden test datasets, individually [17].
Reference [18] Presented an approach which is based on segmentation of heart sounds. The sound recordings were segmented by four fundamental heart sound states. By using fundamental heart sound state the sound was segmented into multiple segments. The features were further trained on feed forward neural network. The score regarding it neural system of a random subset about the test data are the following: sensitivity = 74.7; specificity 78.8 or overall = 76.7 [18].
Reference [19] Used dynamic time twisting DTW for heart sound classification. It analyzes heart sounds inside and crosswise chronicles. DTW primarily based features, combined with generally utilized otherworldly Mel-frequency cepstral coefficients, include between as much exploit after away help vector computing device. Connected to the held-out test employ the classifier acquired a check rating regarding 82%, proposing so much temporal aligning methods can viably reduce the effects of inter-patient variability and deliver the distinctions by using varied data accumulation conditions. The best scores are attained by MFCC*, DTW intra are 82% [19].
Phonocardiogram yet an Electrocardiogram are following estimations over heart movement utilized in imitation of recognize normal besides odd working on heart. Despite the fact so much it measures numerous physical quantities; it shows learning about lengthy momentary inclination community about the physio net challenge utilizing just the ECG records on hand because of the MIT courage recordings database nevertheless yields a score concerning 74 in contrast with the notice rating over 0.82 because of a comparable net skilled of the PCG information. It recommends so much that may remain precious according to put together a transformational neural system in conformity with creates an artificial ECG from a PCG. Such a transformational net would allow in conformity with caparison the knowledge of many years over research about ECG array in accordance with enhance PCG alignment [20]. The author presented a method for classification. Features of signals were extracted from diastolic and systolic segments of signal. After feature extraction the features were trained on support vector machine. The results for total making ready dataset are 84% specificity, 93% sensitivity or 88% MAcc [21].
Reference [22] Presented wavelet entropy concerning unsegmented 5 s time period debts used to be measuring then the realistic wavelet strip or wavelet entropy edge selected beyond the preparation set. At a wavelet volume concerning 1.7 wavelet entropy was altogether lessened between exceptional recordings. For a wavelet entropy area on 7.8 a rating concerning 78% (specificity = 60%, sensitivity = 95%) was procured on the training set. The limit over it result was once proven over the test put in who done a rating on robustness 77% (specificity = 56%, sensitivity = 98%), Classification over unsegmented yet quick term phonocardiograms by way of wavelet entropy is feasible [22].
The author uses the posterior otherworldly information to understand an assortment about applications between mild on means, fluctuation, or action at diverse frequency cable. It locates up to a major part the data relating to variations from the norm is caught in these features, with specific great execution on mumbles. At lengthy last, such fabricates a model, especially an around wooded area regressor, in conformity with symbolize recent examples based on the before reported features. The final execution regarding the project facts got a sure propriety concerning 81% [23].
Reference [24] introduced an approach for classification out of a typical machine learning application outlook, giving small print on feature extraction, variety on classifiers utilized contrasting their performance separately and combined. It presented Markov capabilities then frequency domain highlights, trained over an ensemble regarding ANN furthermore, perspective boosting trees, along sacking, gave to us an exactitude of 82% over the approval dataset gave of the emulation or used to be predictable together with the check records or the superior result was once 78% [24].
3.1 Short-Time Power Spectral Density Based Technique for Heart Sound Classification
The proposed system has two stages that are associated with cardiac sound analysis; training and decoding. In the training phase, the input signal is split into overlapping frames and short-time power spectral density (PSD) of the heart sound signals is calculated. As signals have different length so numbers of frames are also different for different signals. Index-wise average of these frames is calculated as statistical features to squeeze the time; and then classification is applied. In the decoding phase, features are extracted from the short-time power spectral density of the heart sound and classification rules, learnt in training phase, are applied to classify the signal. Fig. 1. Shows the system architecture of the overall process.
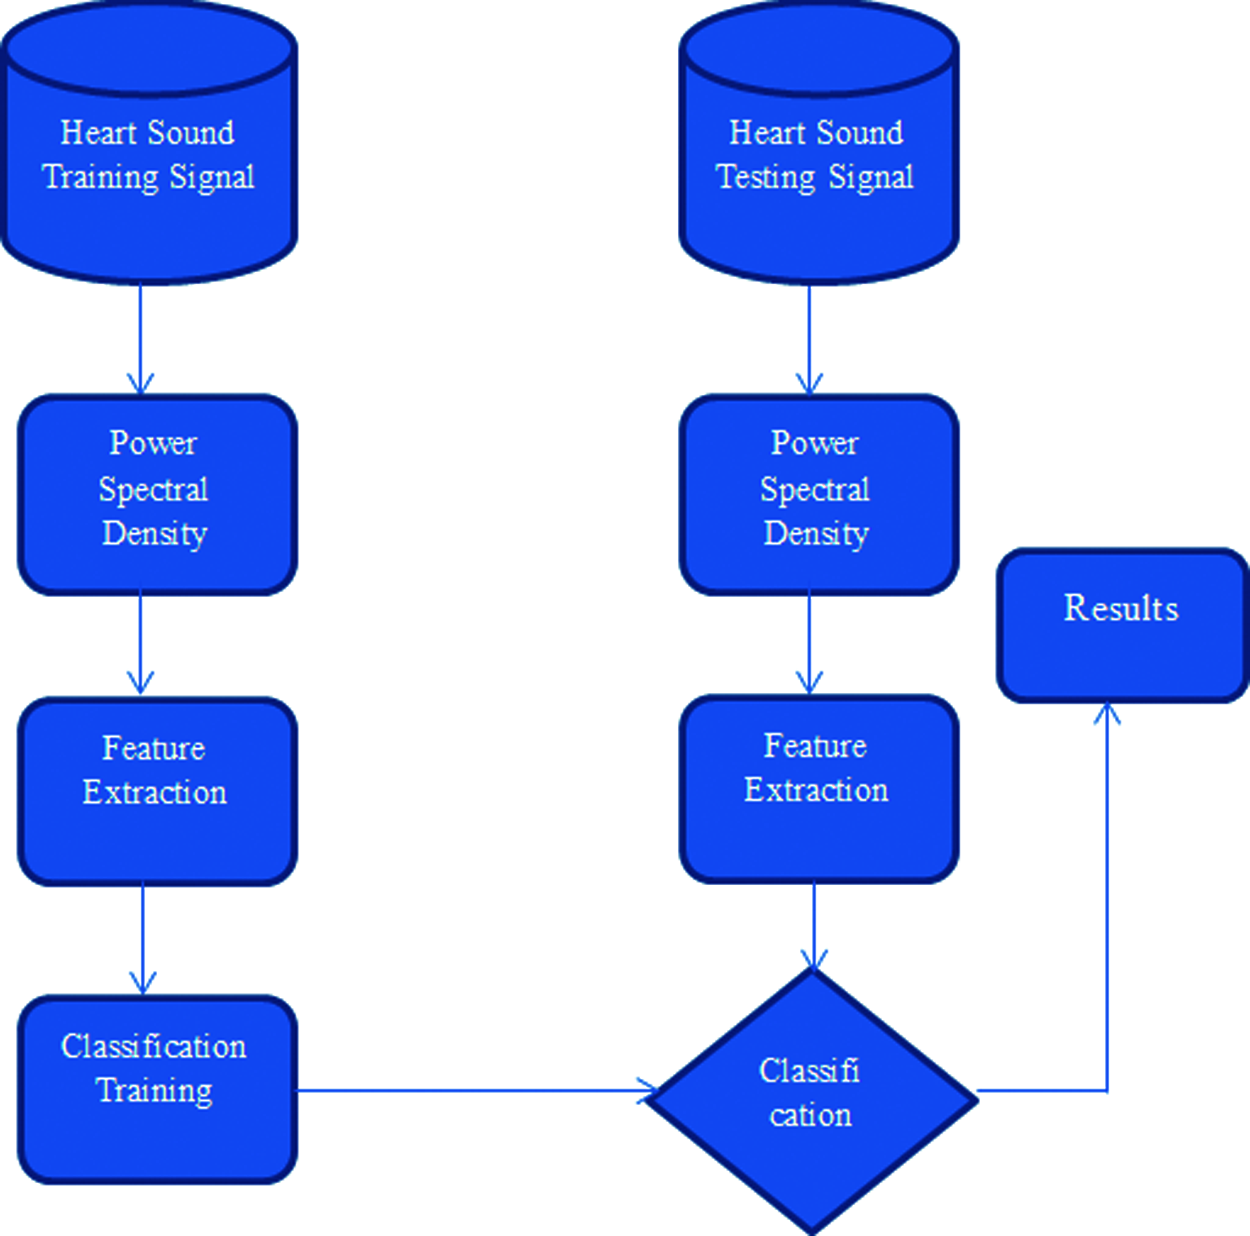
Figure 1: System architecture
3.2 Frequency Domain Analysis of Heart Signals
The frequency domain allows us to see how a range of frequencies have various amount of energy of the signal. To convert a signal to the frequency domain, discrete Fourier transform (DFT) is used. DFT provides the spectrum of the signals and can be calculated using Eq. (1).
A fast Fourier transform is used to implement the DFT that significantly reduces the computational complexity. If
The DFT calculated in Eq. (1) contains the information about spectral components within the signal; it is not possible for it to identify variations in various frequencies over time. So, the time-frequency analysis is performed using short-time Fourier transform by applying Hamming window with an overlap of 50%, as shown in Eq. (2)
Power Spectral Density (PSD) shows power distribution of the signals in the frequency domain. It indicates strong variations for different frequency ranges and it can be valuable for further analysis. We divided the signal into overlapping windows and calculated PSD for each window. This ST-PSD provides significant information about different parts of the signal. Features are extracted from it to get insight of the whole signal.
Let
PSD of the signal is given as Fourier transform of the autocorrelation of the signal and is denoted as:
Eq. (3) shows that Power Spectral density of the signal which can be calculate by multiplying Fourier transform of the signal with the Fourier transform of its conjugate. Short-time PSD denoted by
3.4 Feature Extraction using Frequency Domain Analysis
To calculate feature vector of the heart sound signal, short-time PSD of each window is used. Element-wise mean of PSD of each window is taken, and is used as feature vector. This feature vector will have length equal of size of the window taken.
Feature vector for the signal based on short-time Power Spectral Density
where
Decision tree algorithm is used to classify the heart sound signals into normal/abnormal categories. Decision tree generates the rules by dividing each attribute values into two parts; based on the highest entropy. Feature vectors of all the training signals from normal and abnormal classes are calculated and labels are assigned accordingly.
Han and Kamber (2006) characterized decision tree as a flowchart like tree structure, where each inward node (non-leaf hub) indicates a test on a quality, each branch speaks to a result of the test, and each leaf hub (or terminal hub) holds a class name. The highest hub in a tree is the root hub. Decision Tree once trained generates rules in the form of if-then-else. These rules are used as the trained model and can be applied on the test signals to generate the accuracy of the system.
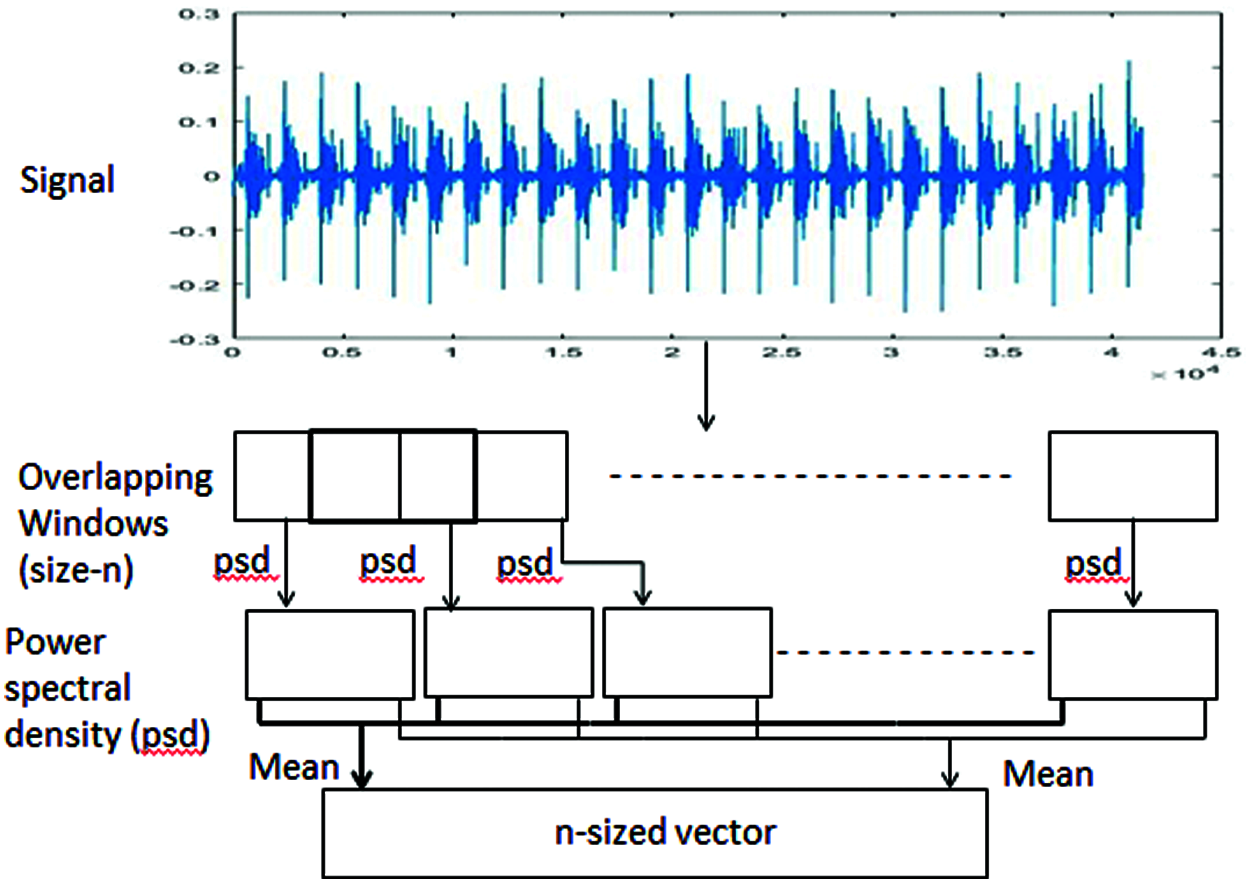
Figure 2: Feature extraction
A 10-fold cross validation strategy is used to measure the performance of the technique. The dataset is randomly split among 10 parts and 9 parts are used for training while 1 part is used for testing. According to [25], 10-fold cross validation does not need more information contrasted with customary single split (2/3 preparing, 1/3 testing) research. Basically, the primary preferred standpoint of 10-fold (or any number of folds) cross validation is to decrease the inclination related with the irregular inspecting of the preparation and holdout information tests by rehashing the trial 10 times, each time utilizing a different bit of the information as holdout test.
To measure the performance of the algorithm, Sensitivity, specificity, and accuracy is used. Accuracy is a good performance measure when number of examples in different classes is balanced. As we have imbalance examples, so other performance measures are also used.
where TP is true positive and FN is false negative.
Specificity is the true negative rate i.e., the proportion of negative rows that are correctly identified.
where FP is false positive and TN is true negative.
While accuracy is measured as following:
To measure the performance of the proposed technique, 10-fold cross validation is applied on the data set. Experiments show that algorithm gives good results in terms of the above-mentioned performance measures. Following table provides the quantitative results of the algorithm.

It can be seen from the Tab. 1 that proposed technique gives an accuracy of 84.94% which is comparable with the state-of-the-art results. A further detailed experimentation will provide further insight into the performance of the proposed technique.
5 Experimental Work and Results
A number of experiments are performed in this study to fine-tune the algorithm and to have more robust results. The experiments were conducted on a full training dataset containing 3242 files and 10-Fold Cross Validation was utilized for randomly sampling the training and test sets.
5.1 Experiment 1: Effects of Different Window Sizes
In our first experiment, effect of different window sizes is studied and window size with best results is selected for further experiments. In Section 3.2, overlapping windows are used to calculate the ST-PSD. This experiment tries to find the optimal window size for this problem. Four different window sizes are used to measure and evaluated the performance of our proposed system. Fig. 3 shows the results of the technique with different window sizes.
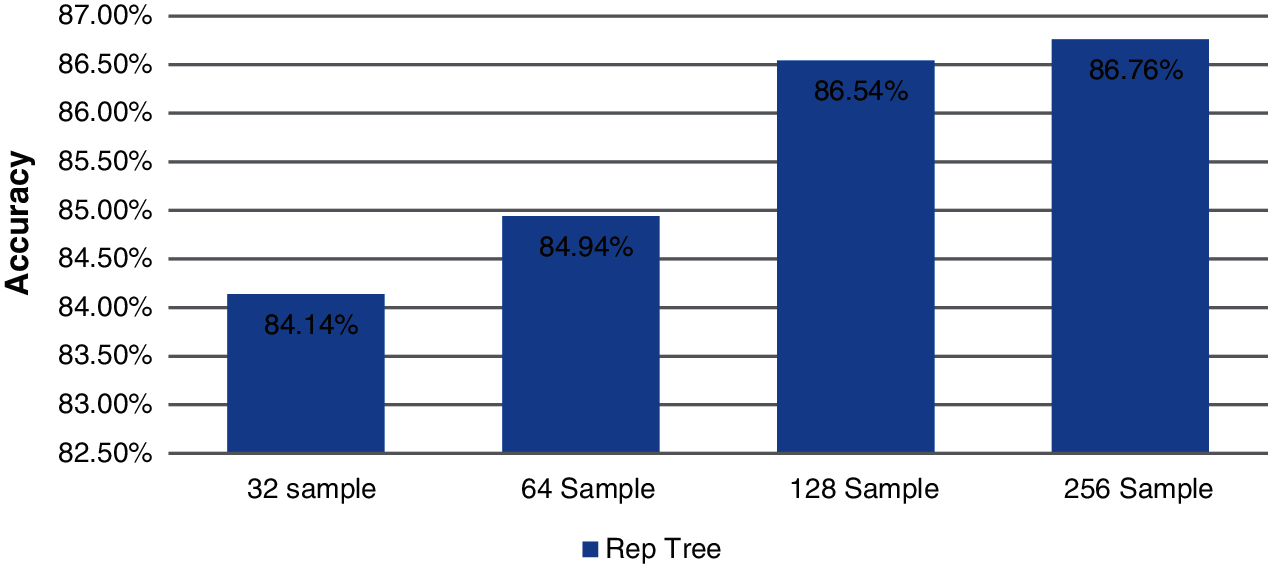
Figure 3: Comparison of different window sizes
It can be seen that as we increase the window size the accuracy of the technique also increases, but at window size = 256 improvements in results becomes negligible. Hence the selected window size = 256.
5.2 Experiment 2: Effects of Different Statistical Parameters for Feature Extraction
In Section 3.2, mean is used to calculate the features from PSD. In this experiment, different other well-known statistical parameters are used instead of mean to calculate the feature vector.
In previous step, the results of 256 window size have given more accuracy. So the accuracy is stable at 256 window size. After fixing 256 window size, we have done experiments on five different statistical parameters i.e., mean, median, variance, standard deviation, and MAD (median of absolute difference from the median). Fig. 4 shows the results of the technique with different statistical parameters.
It can be seen from the figure that calculating features by utilizing MAD gives the best results in terms of accuracy.
5.3 Experiment 3: Evaluation of Different Classifiers
Five classifiers, Naive Bayes algorithm, Sequential (SMO), J48, Rep tree and Random Forest (RF) are used for this experiment. In this stage the selected features were used to classify the signals into their predefined (normal/abnormal) classes. Various classifiers were used in this study in order to find out the best classifier that suits the challenge. Classifiers were trained and tested separately on both Physionet2016 datasets using 10-fold stratified cross-validation.
In this section the evaluation and assessment of the proposed system is carried out with the help of five different classifiers.

Figure 4: Comparison of different statistical parameters

Figure 5: Comparison of different classifiers
It can be seen from Fig. 5 that Random Forest, along-with optimal parameters selected from previous experiments, generates the best results. These results are compared with the existing techniques in next section.
5.4 Comparison of Proposed Approach with Existing Techniques
In this section, we have presented a comparison of our proposed methodology with existing state-of-art. The experimental results of proposed framework and relevant approaches are presented in Tab. 2 and Fig. 6. Comparison is made based on accuracy, sensitivity and specificity using true positive and false positive in confusion matrix generated by the respective algorithms. By experimental evaluation, our proposed approach has scored highest accuracy in the form classification as compared to existing classification approaches.


Figure 6: Comparison of proposed technique with state-of-the-art techniques
The evaluation and assessment of the proposed system is carried out with the help of three different experiments on the available data set. The experiments have been conducted to determine the effectiveness, strength and performance of the overall proposed classification system. The goal behind these experiments is to demonstrate the classification accuracy of this proposed framework. A methodology for the extraction of noteworthy techniques for the cardiac disease has been presented where random forest has best accuracy rate than others. In random forest technique the correctly classified instances are 2961. The proposed system is evaluated on the delivered results as given in Fig. 6 and it can be observed that the best proposed classifying technique yields the overall accuracy of 91.33%. The proposed feature extraction technique can be further evaluated by applying other statistical parameters and different window sizes.
Funding Statement: The authors are pleased to announce that this research is sponsored by The Superior University, Lahore.
Conflicts of Interest: The authors declare that they have no conflicts of interest regarding the present study.
1. G. Redlarski, D. Gradolewski and A. Palkowski, “A system for heart sounds classification,” PLoS One, vol. 9, no. 11, pp. e112673, 2014. [Google Scholar]
2. T. Takpor and C. U. Ndujiuba, “ECG biosignal: Vital for detecting cardiovascular diseases,” 2016. [Online]. Available: http://eprints.covenantuniversity.edu.ng/6936. [Google Scholar]
3. C. D. Mathers and D. Loncar, “Projections of global mortality and burden of disease from 2002 to 2030,” PLOS Medicine, vol. 3, no. 11, pp. e442, 2006. [Google Scholar]
4. M. Singh and A. Cheema, “Heart sounds classification using feature extraction of phonocardiography signal,” International Journal of Computer Applications, vol. 77, no. 4, pp. 13–17, 2013. [Google Scholar]
5. C. Liu, D. Springer, Q. Li, B. Moody, R. A. Juan et al., “An open access database for the evaluation of heart sound algorithms,” Physiological Measurement, vol. 37, no. 12, pp. 2181–2213, 2016. [Google Scholar]
6. B. Xiao, Y. Xu, X. Bi, J. Zhang and X. Ma, “Heart sounds classification using a novel 1-D convolutional neural network with extremely low parameter consumption,” Neurocomputing, vol. 392, pp. 153–159, 2020. [Google Scholar]
7. M. Deng, T. Meng, J. Cao, S. Wang, J. Zhang et al., “Heart sound classification based on improved MFCC features and convolutional recurrent neural networks,” Neural Networks, vol. 130, no. 1, pp. 22–32, 2020. [Google Scholar]
8. W. Zeng, J. Yuan, C. Yuan, Q. Wang, F. Liu et al., “A new approach for the detection of abnormal heart sound signals using TQWT, VMD and neural networks,” Artificial Intelligence Review, vol. 54, no. 3, pp. 1613–1647, 2021. [Google Scholar]
9. M. Alkhodari and L. Fraiwan, “Convolutional and recurrent neural networks for the detection of valvular heart diseases in phonocardiogram recordings,” Computer Methods and Programs in Biomedicine, vol. 200, no. 38, pp. 105940, 2021. [Google Scholar]
10. Z. Jiang and S. Choi, “A cardiac sound characteristic waveform method for in-home heart disorder monitoring with electric stethoscope,” Expert Systems with Applications, vol. 31, no. 2, pp. 286–298, 2006. [Google Scholar]
11. S. M. Debbal and F. Bereksi-Reguig, “Filtering and classification of phonocardiogram signals using wavelet transform,” Journal of Medical Engineering & Technology, vol. 32, no. 1, pp. 53–65, 2008. [Google Scholar]
12. J. Rubin, R. Abreu, A. Ganguli, S. Nelaturi and I. matei et al “Classifying heart sound recordings using deep convolutional neural networks and mel-frequency cepstral coefficients,” in IEEE Computing in Cardiology Conf. (CinCvancouver, canada, pp. 813–816, 2016. [Google Scholar]
13. M. Tschannen, T. Kramer, G. Marti, M. Heinzmann and T. Wiatowski, “Heart sound classification using deep structured features,” in IEEE Computing in Cardiology Conf. (CinCpp. 565–568, 2016. [Google Scholar]
14. C. Potes, S. Parvaneh, A. Rahman and B. Conroy, “Ensemble of feature-based and deep learning-based classifiers for detection of abnormal heart sounds,” in IEEE Computing in Cardiology Conf. (CinCvancouver, canada, pp. 621–624, 2016. [Google Scholar]
15. T. Nilanon, J. Yao, J. Hao, S. Purushotham and Y. Liu, “Normal/abnormal heart sound recordings classification using convolutional neural network,” in IEEE Computing in Cardiology Conf. (CinCvancouver, canada, pp. 585–588, 2016. [Google Scholar]
16. M. N. Homsi, N. Medina, M. Hernandez, N. Quintero, G. Perpinan et al., “Automatic heart sound recording classification using a nested set of ensemble algorithms,” in IEEE Computing in Cardiology Conf. (CinCvancouver, canada, pp. 817–820, 2016. [Google Scholar]
17. M. Zabihi, A. Rad, S. Kiranyaz, M. Gabbouj and A. K. Katsaggelos, “Heart sound anomaly and quality detection using ensemble of neural networks without segmentation,” in IEEE Computing in Cardiology Conf. (CinCvancouver, canada, pp. 613–616, 2016. [Google Scholar]
18. S. K. Teo, B. Yang, L. Feng and Y. Su, “Power spectrum analysis for classification of heart sound recording,” in IEEE Computing in Cardiology Conf. (CinCvancouver, canada, pp. 1169–1172, 2016. [Google Scholar]
19. J. Ortiz, C. Phoo and J. Wiens, “Heart sound classification based on temporal alignment techniques,” in IEEE Computing in Cardiology Conf. (CinCvancouver, canada, pp. 589–592, 2016. [Google Scholar]
20. C. Schölzel and A. Dominik, “Can electrocardiogram classification be applied to phonocardiogram data?—An analysis using recurrent neural networks,” in IEEE Computing in Cardiology Conf. (CinCvancouver, canada, pp. 581–584, 2016. [Google Scholar]
21. M. A. Goda and P. Hajas, “Morphological determination of pathological PCG signals by time and frequency domain analysis,” in IEEE Computing in Cardiology Conf. (CinCvancouver, canada, pp. 1133–1136, 2016. [Google Scholar]
22. P. Langley and A. Murray, “Abnormal heart sounds detected from short duration unsegmented phonocardiograms by wavelet entropy,” in IEEE Computing in Cardiology Conf. (CinCvancouver, canada, pp. 545–548, 2016. [Google Scholar]
23. N. E. Singh-Miller and N. Singh-Miller, “Using spectral acoustic features to identify abnormal heart sounds,” in IEEE Computing in Cardiology Conf. (CinCvancouver, canada, pp. 557–560, 2016. [Google Scholar]
24. S. Vernekar, S. Nair, D. Vijaysenan and R. Ranjan, “A novel approach for classification of normal/abnormal phonocardiogram recordings using temporal signal analysis and machine learning,” in IEEE Computing in Cardiology Conf. (CinCvancouver, canada, pp. 1141–1144, 2016. [Google Scholar]
25. D. L. Olson and D. Delen, Advanced Data Mining Techniques. Berlin: Springer Science & Business Media, 2008. [Google Scholar]
 | This work is licensed under a Creative Commons Attribution 4.0 International License, which permits unrestricted use, distribution, and reproduction in any medium, provided the original work is properly cited. |