DOI:10.32604/iasc.2022.022179
| Intelligent Automation & Soft Computing DOI:10.32604/iasc.2022.022179 | |
| Article |
Combining CNN and Grad-Cam for COVID-19 Disease Prediction and Visual Explanation
1SSDIA Laboratory, ENSET of Mohammedia, Hassan II University of Casablanca, Mohammedia, 28820, Morocco
2STIE Team, CRMEF Casablanca-Settat, Provincial Section of El Jadida, El Jadida, 24000, Morocco
3College of Computer Science and Engineering, Taibah University, Medina, 344, Saudi Araibia
4Department of Information Systems, College of Computer Engineering and Sciences, Prince Sattam bin Abdulaziz University, Al-Kharj, 11942, Saudi Arabia
*Corresponding Author: Bouchaib Cherradi. Email: bouchaib.cherradi@gmail.com
Received: 30 July 2021; Accepted: 02 September 2021
Abstract: With daily increasing of suspected COVID-19 cases, the likelihood of the virus mutation increases also causing the appearance of virulent variants having a high level of replication. Automatic diagnosis methods of COVID-19 disease are very important in the medical community. An automatic diagnosis could be performed using machine and deep learning techniques to analyze and classify different lung X-ray images. Many research studies proposed automatic methods for detecting and predicting COVID-19 patients based on their clinical data. In the leak of valid X-ray images for patients with COVID-19 datasets, several researchers proposed to use augmentation techniques to bypass this limitation. However, the obtained results by augmentation techniques are not efficient to be projected for the real world. In this paper, we propose a convolutional neural network (CNN)-based method to analyze and distinguish COVID-19 cases from other pneumonia and normal cases using the transfer learning technique. To help doctors easily interpret the results, a recent visual explanation method called Gradient-weighted Class Activation Mapping (Grad-CAM) is applied for each class. This technique is used in order to highlight the regions of interest on the X-ray image, so that, the model prediction result can be easily interpreted by the doctors. This method allows doctors to focus only on the important parts of the image and evaluate the efficiency of the concerned model. Three selected deep learning models namely VGG16, VGG19, and MobileNet, were used in the experiments with transfer learning technique. To bypass the limitation of the leak of lung X-ray images of patients with COVID-19 disease, we propose to combine several different datasets in order to assemble a new dataset with sufficient real data to accomplish accurately the training step. The best results were obtained using the tuned VGG19 model with 96.97% accuracy, 100% precision, 100% F1-score, and 99% recall.
Keywords: COVID-19; X-ray images; prediction; CNN; Grad-Cam
In December 2019, a virulent virus appeared in the city of Wuhan, China, and quickly spread around the world. The virus was called coronavirus, or COVID-19, and is known by medical scientists as SARS-CoV-2. Symptoms in people infected with the virus are very similar to other types of pneumonia. However, the exception is that the virus spreads very rapidly, and it kills people with weak immune systems within a short time of infection. According to the World Health Organization (WHO), by the end of 2020, 85 million people have been infected and almost two million people have died. On average, the mortality rate has been estimated at 3%1.
Pneumonia is caused by many germs, including bacteria and viruses like the novel coronavirus (COVID-19). Certain symptoms are specific to COVID-19, such as chest pain, breathing difficulties, coughing with mucus, high fever, intense diarrhea, abdominal pain, and extreme fatigue. Once these symptoms are detected by doctors, the patient is suspected of having COVID-19, but the reverse transcription-polymerase chain reaction (RT-PCR) test or radiology imaging is required to confirm the diagnosis before adopting appropriate treatment. X-ray imaging is the most popular and available radiography tool in hospitals and medical clinics around the world. Due to its low cost, it is the most used technique by doctors for diagnosing cases of pneumonia. Types of pneumonia are defined by their cause (bacterial or viral) when analyzing lung X-ray images, but distinguishing between different types is difficult because some types look very similar. Therefore, alternative diagnosis methods are needed to assist traditional manual methods of detecting and differentiating between COVID-19 and other types of pneumonia.
Early detection of COVID-19-infected patients is crucial in saving human lives [1]. Therefore, doctors and physicians need a medical diagnosis system to accurately differentiate between COVID-19 cases and other similar diseases in addition to their habitual clinical diagnosis. In the medical field, this need is valid for any other disease.
Many medical methods of COVID-19 diagnosis are used in clinical routine. The RT-PCR method, searching for the COVID-19 virus in person’s nose or throat, is the most used, but due to its lack of accuracy and its required delay; cannot handle with the increasing number of infected people over the world. Especially, with appearance of multiple variants of COVID-19 that spreads more rapidly.
Another method that is often used for past infected patients of COVID-19 is serology test. This method consists of looking for antibodies in blood to determine if the patients already infected with COVID-19 virus. Other early detection method consists of analysing chest X-ray images of suspected patients in order to detect the COVID-19 virus effect percentage on patient’s lung. All these methods are manual and time consuming. So, the scientific community is still need to alternative methods that can diagnose COVID-19 virus rapidly and accurately.
Recently, artificial intelligence (AI) tools, such as machine learning (ML) and deep learning (DL), along with the development of other techniques, such as the Internet of Things (IoT), has attracted several researchers because of their efficiency in various fields like rumor detection in social media [2], natural language processing [3,4], plant disease detection [5,6], smart energy economy and management [7–9], civil engineering systems [10,11], and educational system analysis and assessment [12,13].
Medical diagnosis support systems (MDSS) have also gained particular interest in recent years. These smart tools constitute an important aid for medical professionals to gain time, effort, and accuracy [14,15]. The diagnosis of most diseases can be aided by ML and DL algorithms, such as brain tumor detection using the CNN technique [16,17], diabetes mellitus prediction [18,19], patients with atherosclerosis disease classification [20–22], and detecting pneumonia on lung images [23,24].
Copious amounts of medical data require high-performance computing (HPC) techniques, such as parallel computing. To overcome the constraint of execution time, graphical processing units (GPU) become crucial devices in medical data processing applications [25,26] because they can significantly accelerate parallel processing; therefore, almost all studies related to medical image processing utilize GPUs as accelerators to achieve fast calculations [27].
Doctors often diagnose pneumonia by clinical examination and analyzing the patient’s symptoms, but for improved diagnosis accuracy, they often conduct a chest X-ray to confirm its cause, whether viral or bacterial. The main treatment is antibiotics and pain-relief medication, drinking more water, and resting. Other types of pneumonia treatment can result in severe complications, as happens with COVID-19 cases. Recent research associated very high risk of complications and increased viral infective load for patients with COVID-19 and taking anti-inflammatory drugs (NSAIDs) as treatment [28]. Therefore, the precision of a COVID-19 diagnosis is highly recommended. With increasing numbers of people infected with COVID-19, traditional diagnosis methods are very frustrating and insufficient [29,30].
Currently, doctors refer to a laboratory test called real-time RT-PCR as a formal and official method to confirm suspected COVID-19 in patients presenting clear symptoms. This method takes 24 hours to provide results, but it is not completely accurate as it presents a high false-negative rate [30], which requires complementary tests to confirm the diagnosis, such as manually analyzing chest imaging or blood serology results.
X-ray radiation-based imaging is used for many technology industries, including X-ray radiography and computed tomography (CT) imaging. X-ray radiography consists of body organs exploiting absorbed waves to produce a 2-D grayscale image, whereas CT scans use a computer to combine multiple 2-D grayscale images to form a 3-D image similar to MRI technology, which is very expensive. X-ray radiography is available in almost all medical facilities, but CT technology rarely exists in hospitals and needs experts to operate it.
Statistical studies show that CT or X-ray imaging helps doctors diagnose COVID-19 in 89.9% of cases. This is an important factor that motivates us to use X-ray technology to auto-diagnose COVID-19 [31]. There are very few differences in the grayscale of chest X-ray images that are important for an accurate diagnosis of COVID-19. An automatic methodology of classifying X-ray images is an interesting alternative to help doctors correctly diagnose COVID-19 [32], especially when a computer can process and distinguish between 255 levels of gray, in contrast to human eyes [33,34].
In this work, we focus on automating the detection and classification of COVID-19, other types of pneumonia, and normal cases by analyzing chest X-ray images. The proposed methodology consists of using the power of CNN and Grad-CAM [35] for a visual explanation of the responsible region in an X-ray image.
The main contributions of this paper are:
– A representative dataset from many sources has been collected to generate a valid and equilibrated X-ray -based dataset of three classes: normal, pneumonia, and COVID-19.
– Pre-trained CNNs (VGG16, VGG19, and MobileNet) are selected based on their performance evaluation in the related literature.
– A CNN-based zero-shot transfer learning technique is applied in the training process to exploit the knowledge of the pre-trained models.
– CNN models will be adapted by adding additional layers before the output layer to suit our specific prediction task.
– A Grad-CAM visual explanation method is applied to debug the prediction process for each model and to highlight the interesting regions in the X-ray image responsible for the final decision.
Experimental results demonstrate the higher performance of the modified VGG19 model in comparison with VGG16 and MobileNetV2.
The remainder of this paper is structured as follows. In Section 2, we present a background on (a) previous similar works on predicting COVID-19; (b) a general overview on the common methodology to establish a CNN model; (c) a specified focus on the pre-trained CNN models that constitute the basis for our proposed transfer learning-based models. Section 3 describes the methodology adopted in this work and the different image resources used to feed the study. In Section 4, we present our findings and results and provide a brief technical comparison of different proposed models with previous ones. Additionally, we will present some Grad-CAM illustrations to explain the image regions of interest that are responsible for the final prediction decisions; we will also discuss these results. Section 5 provides a conclusion by highlighting the limitations of our methodology and describing improvements and perspectives for future work.
2.1 Previous Studies on Predicting Covid-19 Disease
Recently, researchers have started investigating the COVID-19 pandemic from different perspectives. Some of their works concern exploiting AI to help diagnose COVID-19 based on different laboratory resources. In this section, we describe some interesting studies related to ours concerning the use of ML techniques to detect COVID-19 using clinical data.
Rahimzadeh et al. [36] proposed a novel CNN model composed of two other pre-trained networks, XCEPTION and RESNET50V2. This model was retrained using a dataset of 11,302 chest X-ray images for classifying cases into pneumonia, normal, or COVID-19. The dataset consisted of 180 images of COVID-19, 6.054 of pneumonia, and 8.851 of normal cases. While training the proposed model, the authors obtained 99.51% on validation accuracy for classifying COVID-19 using X-ray images, but they did not proceed with the test step evaluation.
A new automatic system for diagnosing COVID-19 based on ML is presented in Islam et al. [37]. The system consisted of merging a long short-term memory (LSTM) classifier used for classification layers with a CNN used for feature extraction and selection layers. This work used 421 cases, which is a very weak dataset for training, of which 141 had COVID-19 features and 140 features each for normal and pneumonia classes. The authors in this work adopted a data augmentation technique to increase the size of the used dataset for training, but this method presented several problems as the techniques produced a big correlation and dependency between generated features, which affected real-world classification. The authors also bypassed the testing step to obtain more accurate performances that described the ability of the model to deal with real cases. The model obtained 97% accuracy on the validation step.
Saha et al. [38], a CNN model was designed to detect COVID-19 based on chest X-ray images. The model was composed of five convolutional blocks of different sizes, but using the same filter of 3 × 3, each block was followed by a max-pooling layer. The fully connected layer comprised three dense layers, each one followed by a dropout layer to optimize processing complexity. The output layer used a sigmoid activation function with three classes: normal, pneumonia, and COVID-19. During the training step, the authors used an X-ray image dataset of 234 normal images, 390 of pneumonia, and only 94 of COVID-19. The obtained results showed 87.4% accuracy in detecting COVID-19, but an over-fitting problem was clearly present on the accuracy charts due to the weakness of the dataset and the low quality of the pre-processed images.
Wang et al. [39] proposed an interesting ML algorithm to classify COVID-19 and other types of pneumonia. The pre-processing step consisted of the segmentation and deletion of unused areas. The DenseNet121-FPN model was implemented for COVID-19 chest segmentation, and the COVID-19 Net model was used for the classification task. The dataset contained 924 COVID-19 cases and 342 cases of other pneumonia. The authors obtained 87% accuracy on the validation and training processes.
Song et al. [40] designed a DRE-Net CNN model as a personalized pre-trained ResNet-50 model. The CT scans used in the dataset contained only 88 confirmed COVID-19 cases, 101 cases of bacterial pneumonia, and 86 normal cases. The network was evaluated and compared with Res-Net, Dense-Net, and VGG16, and the proposed model obtained better results than the other models, achieving 92% accuracy and 95% area under curve (AUC).
Ni et al. [41] assembled 19,291 CT images to feed their proposed model for diagnosing COVID-19. Their proposal was a concatenated multi-view point regression network (MVPNET) model and a 3D U-Net-based model. The proposed method consisted of processing and analyzing the number of abnormalities in the images and calculating the distance between suspected lesions to diagnose COVID-19. The final results achieved 94% accuracy and 100% sensitivity, outperforming three radiologists’ diagnoses in terms of accuracy and precision.
El Gannour et al. [24] utilized a transfer learning technique, without specifying which type was used, to retrain six different models. The experiment used 219 COVID-19 X-ray images, 1,341 normal, and 1,345 other viral pneumonia images. The authors chose to train VGG16, VGG19, Inception V3, Xception, ResNet50 V3, and MobileNet V2. The results gave 98% for the Xception model. However, the dataset was not equilibrated, and the number of COVID-19 X-ray images was weak compared to the other classes.
In our recent work [42], we presented preliminary results of training three CNN models using transfer learning technique to detect patients with COVID-19. We obtained promising results in terms of performance evaluation metrics.
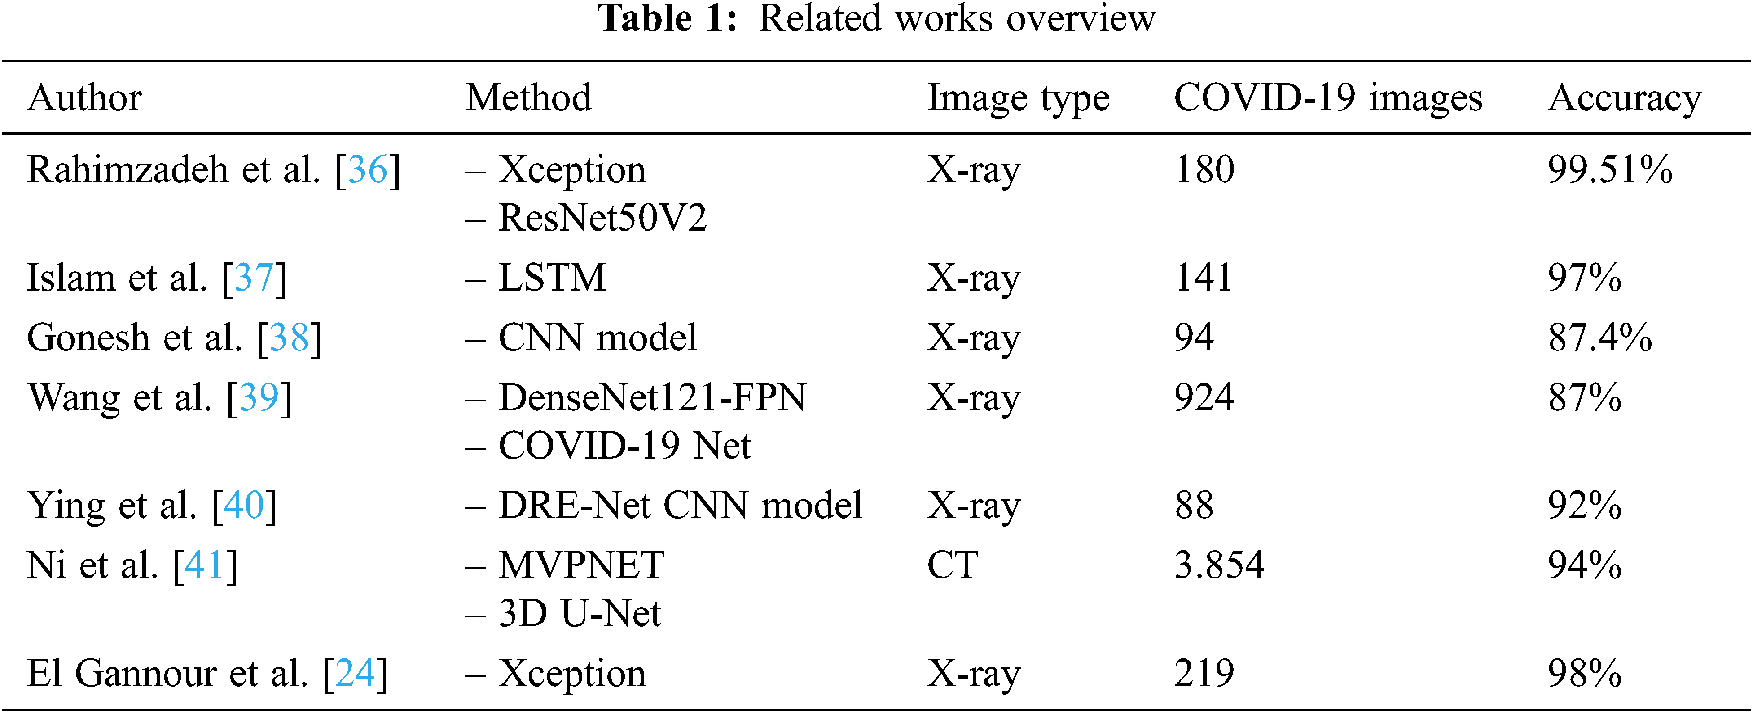
A brief overview of this some related works is shown in Tab. 1, summarizing methodologies, datasets, and the different obtained results.
The present paper is an extended version of our work presented in Moujahid et al. [42]. In fact, we propose a complete diagnosis support system for COVID-19 disease. We gave more details about the architectures of the pre-trained and tuned CNN models. In addition, we used Grad-Cam technique for visual explanation of the regions of interest to track the prediction process in the X-ray image. We presented also additional tools to evaluate the obtained results of the tuned CNN models.
2.2 Convolutional Neural Networks (CNNs)
A CNN is a type of deep neural network specializing in handling computer vision and image processing. Its name comes from the famous mathematical operation called convolution applied to matrices. For complex functions f and g, the discrete convolution is given by the following formula:
CNN architecture consists of linking different types of layers: the input layer followed by convolutional layers related to multiple hidden layers, and an output layer called a classifier. The hidden layers are a combination of convolutional layers, pooling layers, and fully connected layers, which are also called dense layers. Each layer is composed of multiple neurons interconnected with other neurons in the previous and next layers [43].
Each layer is defined by different parameters that specify input dimensions, stride, and padding during the processing step. The input layer takes handles with a limited number of tensors in parallel according to the given configuration, based on the available computing and memory capacity [43].
The convolutional layer plays a crucial role in how CNNs operate. The layers mean that power comes from its learnable kernels. When data arrives at the input of a convolution layer, the layer convolves the inputs with the configured filter across spatial dimensionality. This operation produces an activation map that can be visualized [43].
The goal of the pooling layer is to gradually decrease the dimensionality of the inputs, and, thus, optimize and reduce the number of hyper-parameters and the complexity of the model. The main problem with this type of layer is the destruction of some information that could be important to the input features. There are many types of pooling operations, such as average, max, and general, but max-pooling is the main type used for image processing [44]. An example of this is illustrated in Fig. 1.
The output y of a pooling layer is defined by Eq. (2):
where
The output feature of a pooling layer dimensionality ratio depends on the stride and the filter parameters defined during the configuration. Eq. (2) shows the relationship between the input and output feature sizes.
where N is the input size, F is the filter size, and S is the stride size.
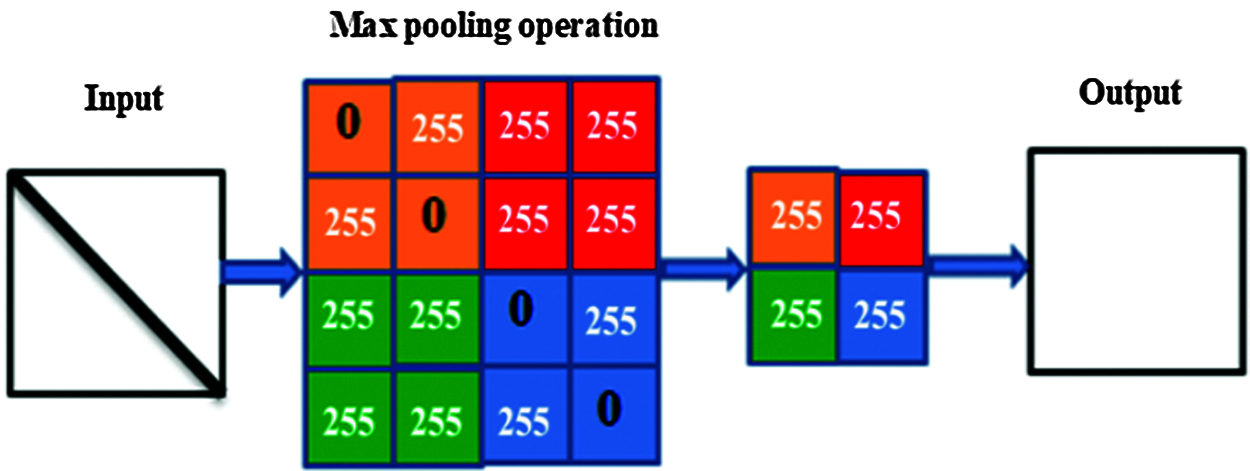
Figure 1: The pooling process illustrates the max-pooling mechanism
Fully connected layers also called dense layers consist of connecting all the neurons in adjacent layers so they are fully connected to each neuron in the previous and next layer. In a CNN, the first layers in the fully connected layers flatten the inputs into one vector and then the next layers apply adequate weights to predict the correct label of each feature according to certain calculated probabilities.
Dropout layer present a technique used to prevent a CNN model from over fitting phenomenon. Its concept works by randomly setting the outgoing edges of neurons in hidden layers to 0 at each epoch of the training phase.
2.3 Pre-Trained CNN Architectures
This architecture is based on using small convolutional filters (3 × 3) and having 16 weight layers, as illustrated in Fig. 2. This model was submitted to the 2014 ImageNet challenge [45].
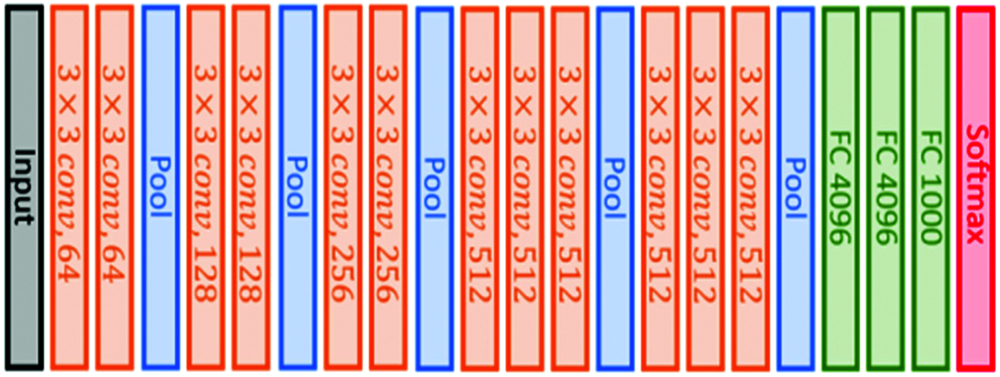
Figure 2: VGG16 original architecture
This architecture is similar to VGG16 architecture in that it also uses small convolutional filters (3 × 3), but it has 19 weight layers, as illustrated in Fig. 3. This model was also submitted to the 2014 ImageNet challenge [45].
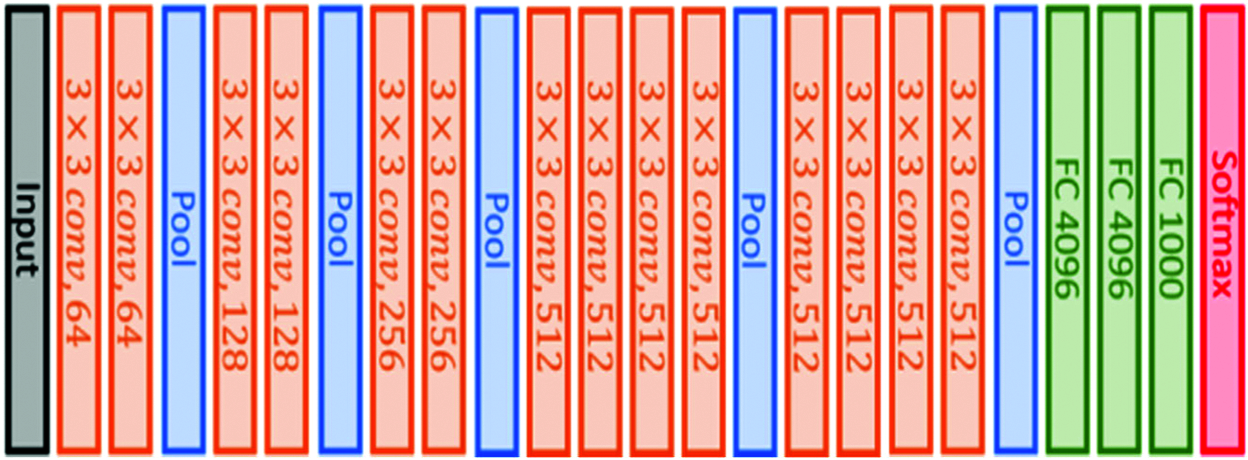
Figure 3: VGG19 original architecture
The MobileNetV2 model was originally designed to improve the performance of mobile networks performing multiple tasks, as illustrated in Fig. 4.
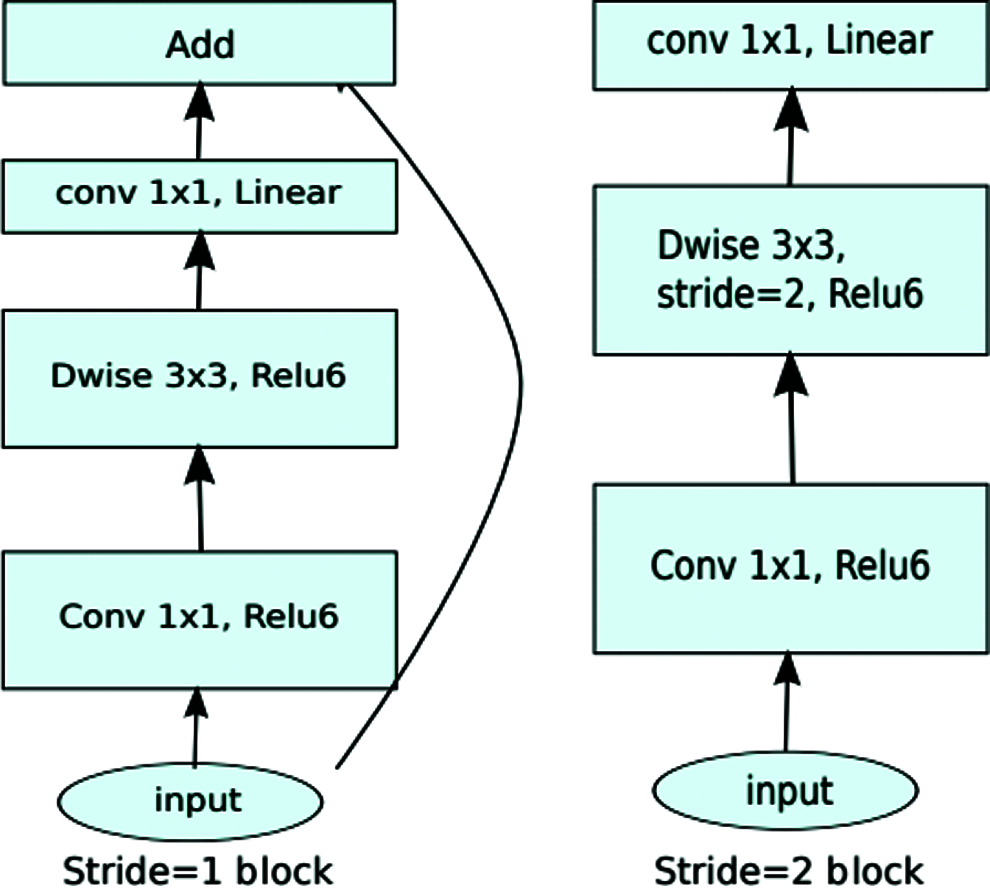
Figure 4: MobileNetV2 original architecture
It is based on an inverted residual structure where bottleneck layers oppose traditional residual models [46].
2.4 Transfer Learning Technique
When a CNN-based algorithm is trained on a specific dataset for classification purposes, the process generates a model with trained weights ready for classifying any feature similar to the original dataset. This knowledge can be exploited for other classification purposes [47]. This is called the transfer learning concept in ML, which is illustrated in Fig. 5.
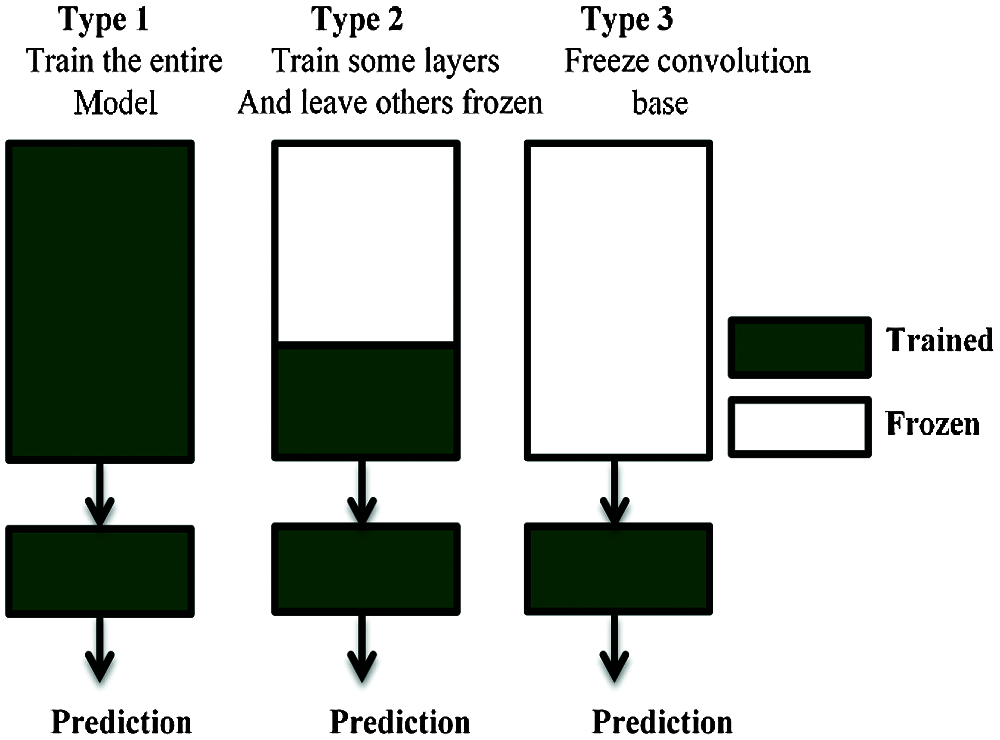
Figure 5: Transfer learning technique
There are many derivatives of transfer learning depending on the nature of the task. In our case study, we used this technique on models that were originally trained on an ImageNet dataset. This is different from the task of classifying.
AI techniques are the global methodology adopted for this study, in particular, an ML concept based on CNN and transfer learning. The proposed CNN models involved removing the layers at the head of the original model then flattening the output of the previous layer. We added 512-sized dense layers followed by a dropout layer and another 256-sized dense layer perceptron. Finally, we added an output layer adapted for three classes. This methodology was applied for all three models: VGG16, VGG19, and MobileNetV2. This method allowed us to assemble a valid, sufficient, and useful dataset to train our proposed CNN models.
3.1 Global Overview of the Proposed Prediction System
The dataset was assembled for pre-processing before it was partitioned into thirds to feed the CNN-based models (VGG16, VGG19, MobileNetV2). Seventy percent was reserved for the training step, 15% for validation, and 15% for the testing step. After finishing all the steps, we used several techniques for evaluation and Grad-CAM visualization to determine the best-adapted and performing model. A global overview of the architecture is illustrated in Fig. 6.
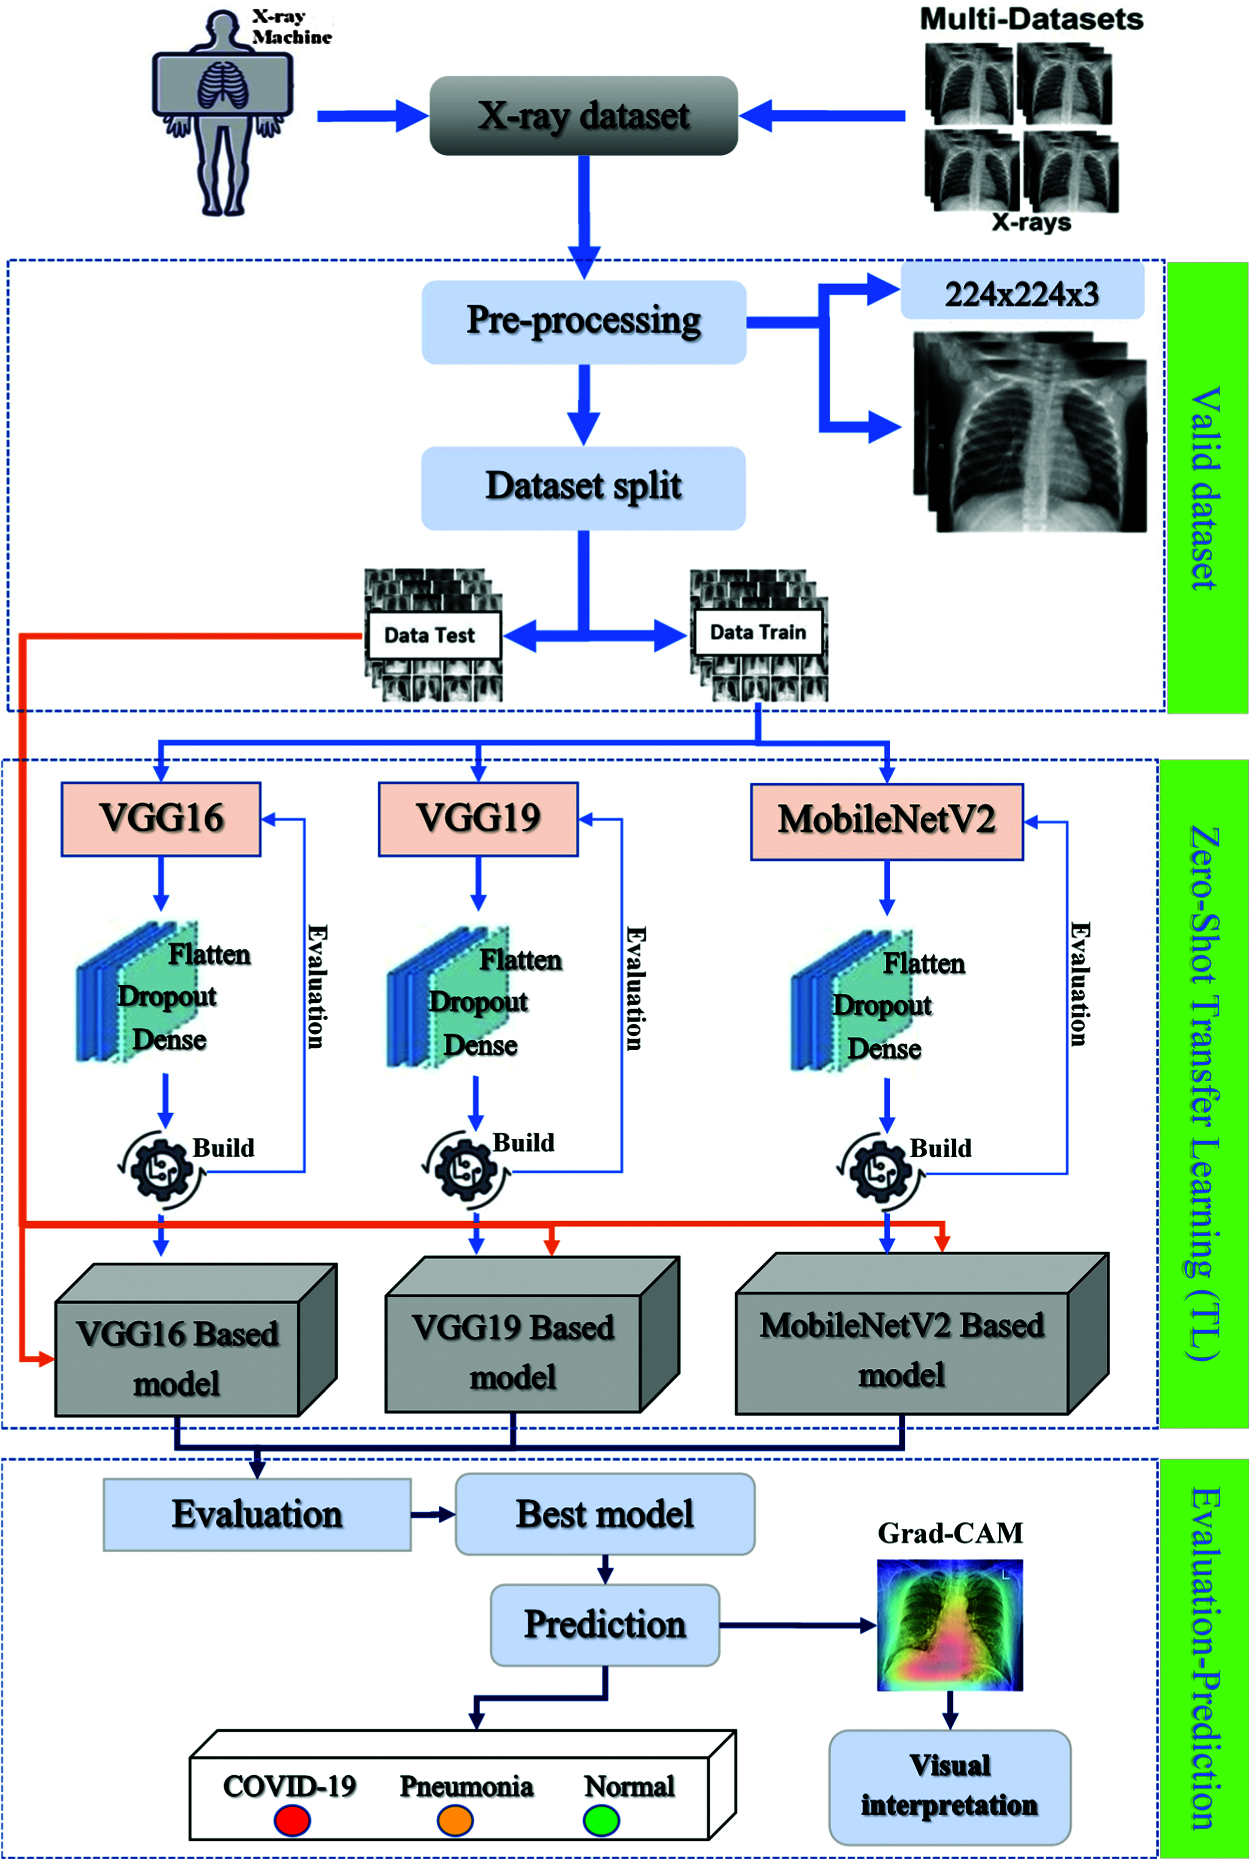
Figure 6: Global overview of the proposed prediction system
3.2 Dataset Collection and Preprocessing
Even if publicly available datasets change permanently by adding new features, the amount of data is still insufficient to achieve a good training process. Different sources of COVID-19 datasets were chosen to collect X-ray images, and only the valid ones were selected to build the COVID-19 X-ray dataset.
The selected images were then resized to adapt to the input shape of the model. The collected dataset consisted of three different classes: confirmed COVID-19 cases, other pneumonia cases, and normal cases. Fig. 7 shows examples of images from each class.

Figure 7: Example of images from the dataset: (a) normal (b) pneumonia (c) COVID-19
The publicly available sources are described in Tab. 2. Pneumonia and normal X-ray images used in our dataset come from the Kaggle platform2 and comprise 1.341 normal cases and 1.345 other pneumonia cases.
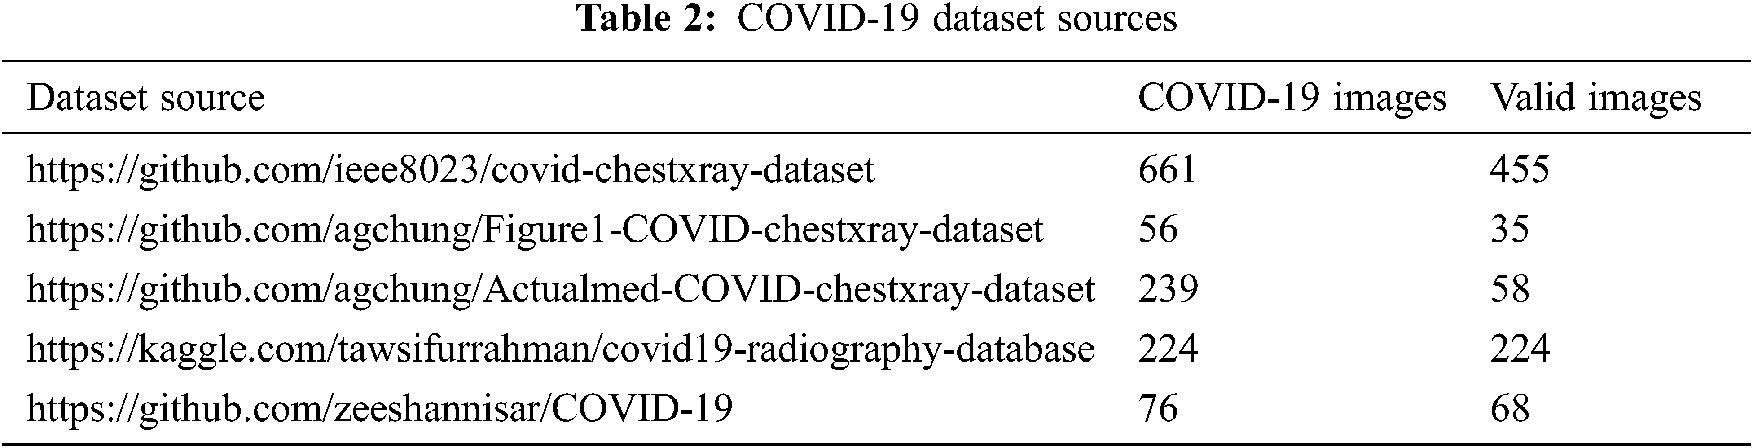
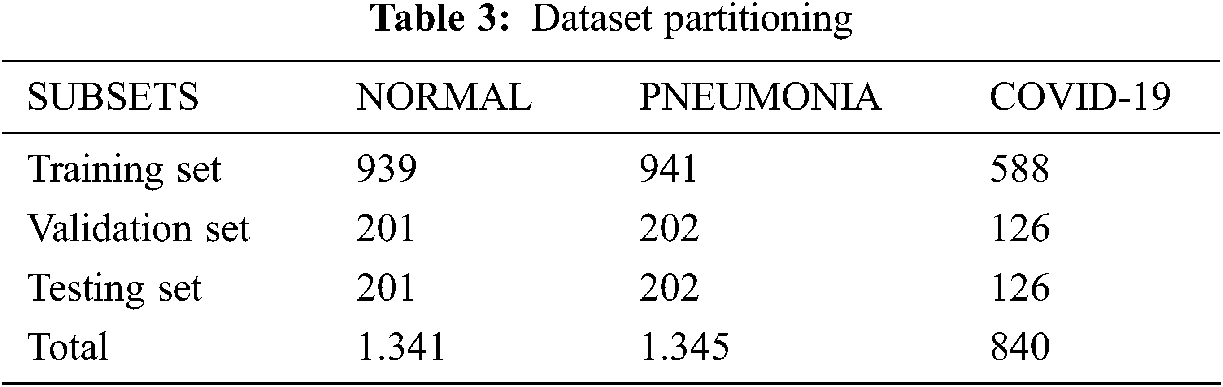
In this experiment, we collected 840 valid thoracic X-ray images from several sources. The final dataset was partitioned into three parts: 70% for the training step, 15% for validation, and 15% for the testing step. Tab. 3 presents a brief description of this partitioning.
3.3 Model Debugging Using the Grad-Cam Technique
The gradient-weighted class activation mapping (Grad-CAM) technique is used to debug almost any CNN model to perform and validate its performances versus task classification [35]. This technique visually shows how the model looks at the image while processing and which pixels in the image contain the most important information.
Based on the last convolutional layer feature map, the Grad-CAM method consists of processing the neuron importance weights
where
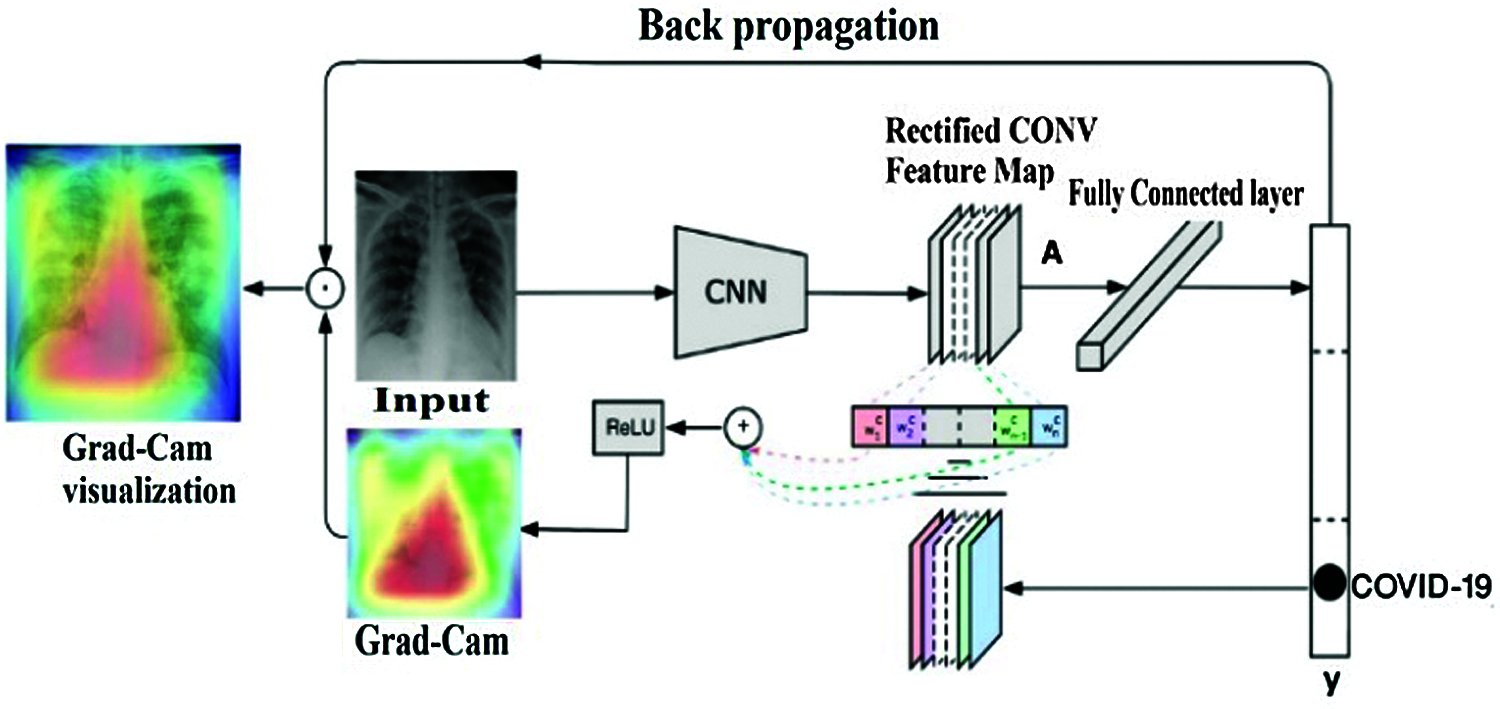
Figure 8: Grad-CAM visual explanation mechanism
3.4 Performance Evaluation Metrics
In ML, metrics are superior evaluation tools for describing a model’s performance, and the number of metrics depends on the type of the model. In our case, we adopted the metrics usually used to evaluate CNN models, which are based on four essential parameters. True positives (TP) represent the number of predicted positive cases that match the ground truth; false negatives (FN) concern the number of predicted negative cases that are positive in the ground truth; true negatives (TN) are the numbers of predicted features that are negative cases that match the ground truths; false positives (FP) are the number of predicted positive cases but are negatives in the ground truth. The following equations present the different metrics used:
• Recall (true positive rate): The number of elements accurately predicted as positives out of total true positive cases.
• Precision: The number of elements accurately predicted as positives out of the total elements identified as positive cases.
• F1-score: This metric combines recall and precision values.
• Accuracy: The number of elements accurately predicted over all of the predicted elements.
• Loss represents the estimated error in the model predictions.
where
CNN model performance depends on several criteria, such as its architecture, the number of trainable parameters, and the configuration and type of layers. In our work, we chose to implement the models that exist in the literature in terms of performance in image processing tasks (VGG16, VGG19, and MobileNetV2). This section presents our findings and the results of our work.
In epochs, the training accuracy of the VGG16 model increases step-by-step, and the validation accuracy increases until the 10th epoch when it becomes constant and stable for the remainder of the time (the architecture is shown in Fig. 9). This behavior encouraged us to insert a stopping condition if the improvement of validation accuracy decreased for three consecutive epochs. According to the condition, the training stops at the 25th epoch, as shown in Fig. 10.

Figure 9: VGG16 model architecture
The loss function was used to optimize the model during training and validation. It shows the model behavior across epochs in terms of updating weights for better predictions. In general, if the loss is low, the accuracy is higher.

Figure 10: VGG16 model accuracy (a) and loss (b)
The VGG19 model (architecture in Fig. 11) shows similar results to VGG16, except that validation accuracy was less improved after the 10th epoch.
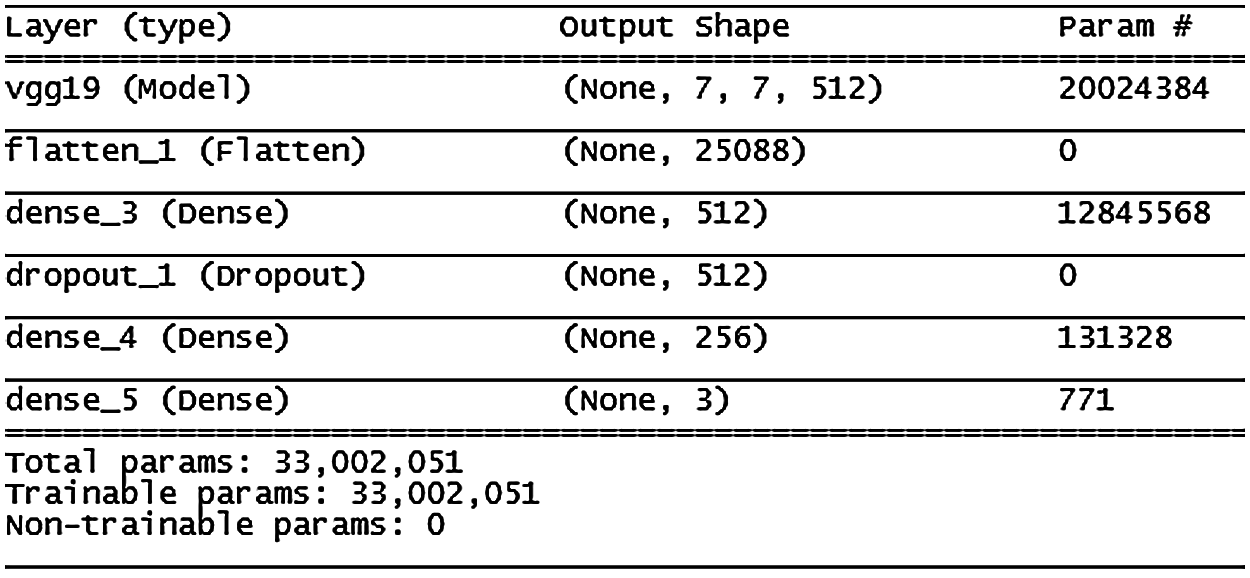
Figure 11: VGG19 model architecture
Training accuracy continued to improve across all the epochs, but the validation improvement improved faster in the first epochs then started to decrease. This model needed training over 18 epochs before stopping; more details are shown in Fig. 12.

Figure 12: VGG19 model accuracy (a) and loss (b)
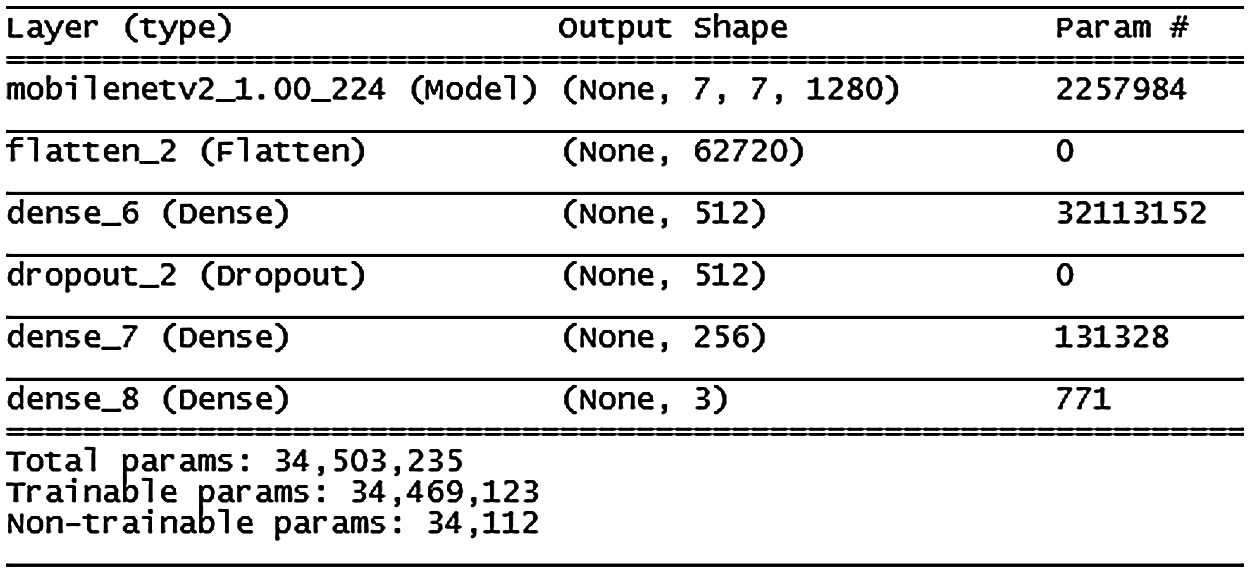
Figure 13: MobileNetV2 model architecture
Fig. 13 shows the MobileNetV2 model, where accuracy improved slowly until the 13th epoch then improvement slowed down and stabilized over the following epochs. Stopping conditions were achieved at the 45th epoch. This model showed some signs of the overfitting problem compared with the VGG16 and VGG19 models; more details are shown in Fig. 14.

Figure 14: MobileNetV2 model accuracy (a) and loss (b)
In this work, we did not use augmentation techniques to increase the dataset size. All of the X-ray images used were extracted from different public sources then filtered and validated before pre-processing. Other methods cited in the related literature had very high accuracy results, but the datasets did not represent real case classification tasks. For example, in Tab. 1, Rahimzadeh et al. [36] had 99.51% validation accuracy using only 180 COVID-19 images. The authors adopted an augmentation technique to increase the dataset, which is not recommended for this type of task. The MobileNetV2 model had worse results compared with the VGG16 and VGG19 models.
Training a CNN model generates a prediction model with correct weights that corresponds to the dedicated task. In our case, the obtained weights were tested and evaluated using a completely independent sub-dataset already prepared as shown in Tab. 3. The testing performances were evaluated using recall, F1-score, precision, accuracy, and loss. Tab. 4 shows the obtained results, with the best results written in bold.
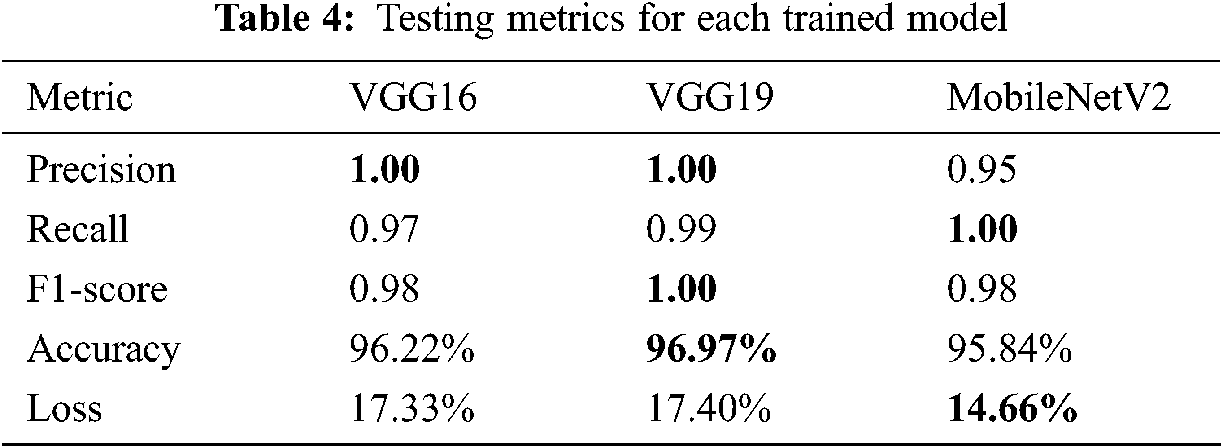
The results of the trained models show that VGG16 and VGG19 obtained 100% precision against 95% for MobileNetV2. VGG19 was the most accurate at 96.97% and obtained 100% for the F1-score parameter but the worst loss value. According to these results, the VGG19 model was judged the best model for predicting COVID-19 cases in terms of accuracy and efficiency. Another interesting tool to obtain a clear view of the models’ performances during the test step was the confusion matrix, where all the predicted labels of X-ray features were compared to the ground truth labels. Fig. 15 shows the results of this tool for each model.
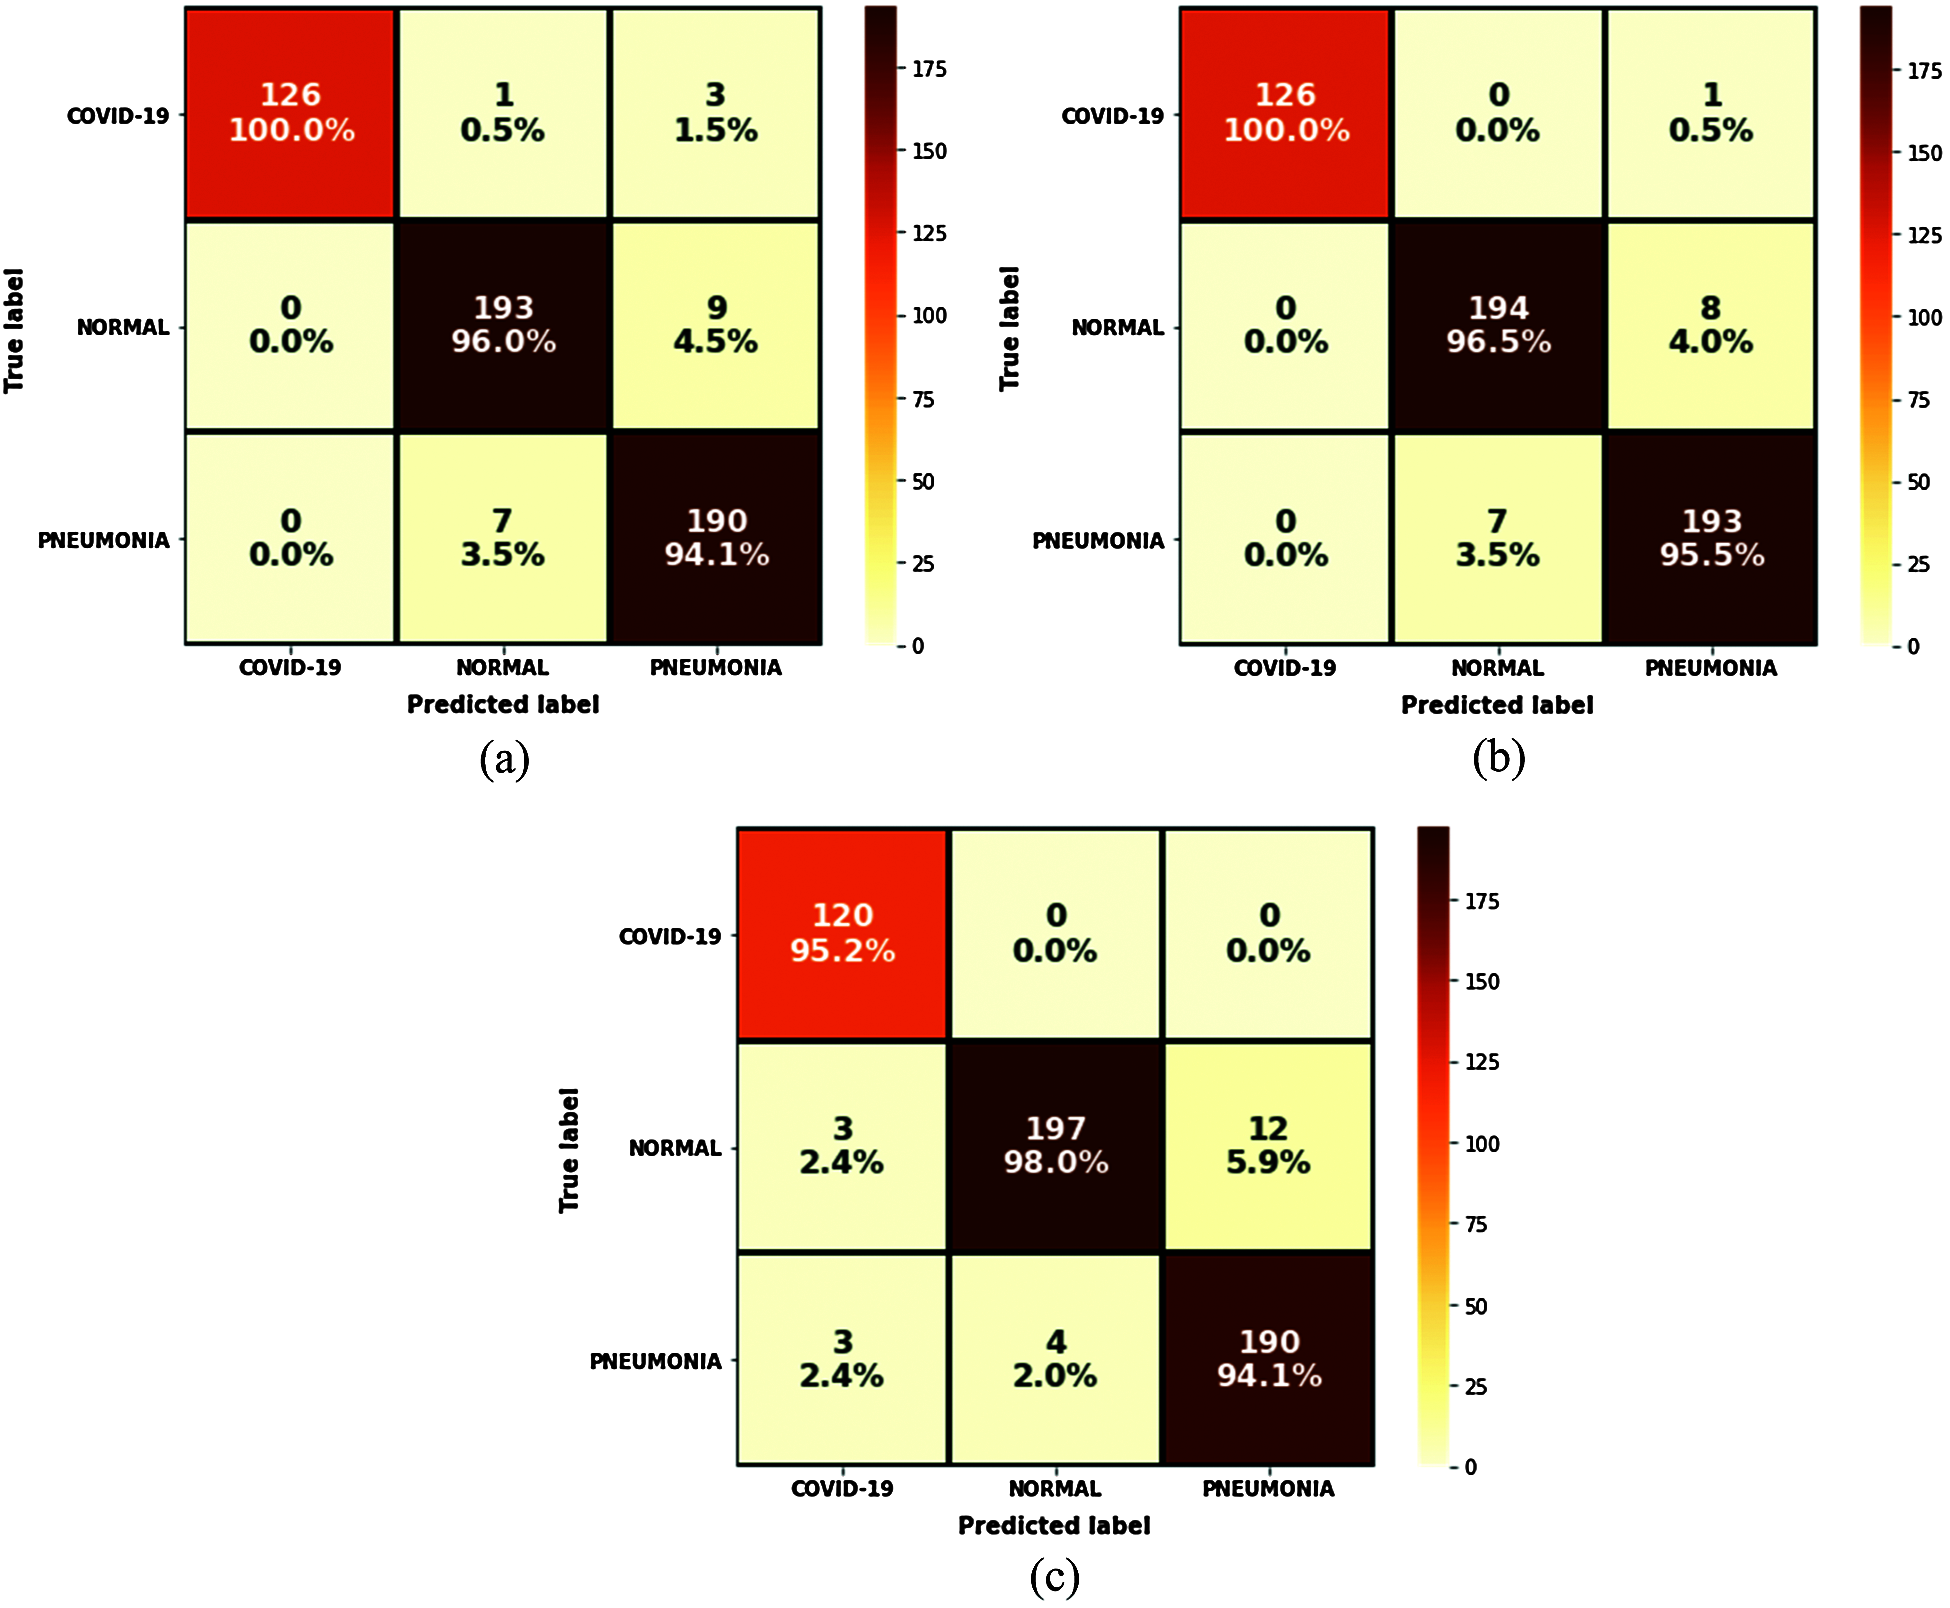
Figure 15: Confusion matrix results: (a) VGG16; (b) VGG19; (c) MobileNetV2
Evaluation of a binary classification model can be performed using receiver operating characteristic (ROC) curve methodology. This tool is similar to precision/recall metrics with a visual presentation based on a curve that plots a true positive rate versus a false positive rate. To use this tool to evaluate our judged best model for this task, we considered each class using a binary classification approach, which visualized the area under each curve of each class. We concluded which model was best classified using this tool; Fig. 16 shows the results.
Another interesting tool for model performance evaluation is the precision/recall ROC curve, which is similar to the true positive rate-based ROC curve. The difference is that it shows the variations of precision and recall across testing results for binary classification tasks.
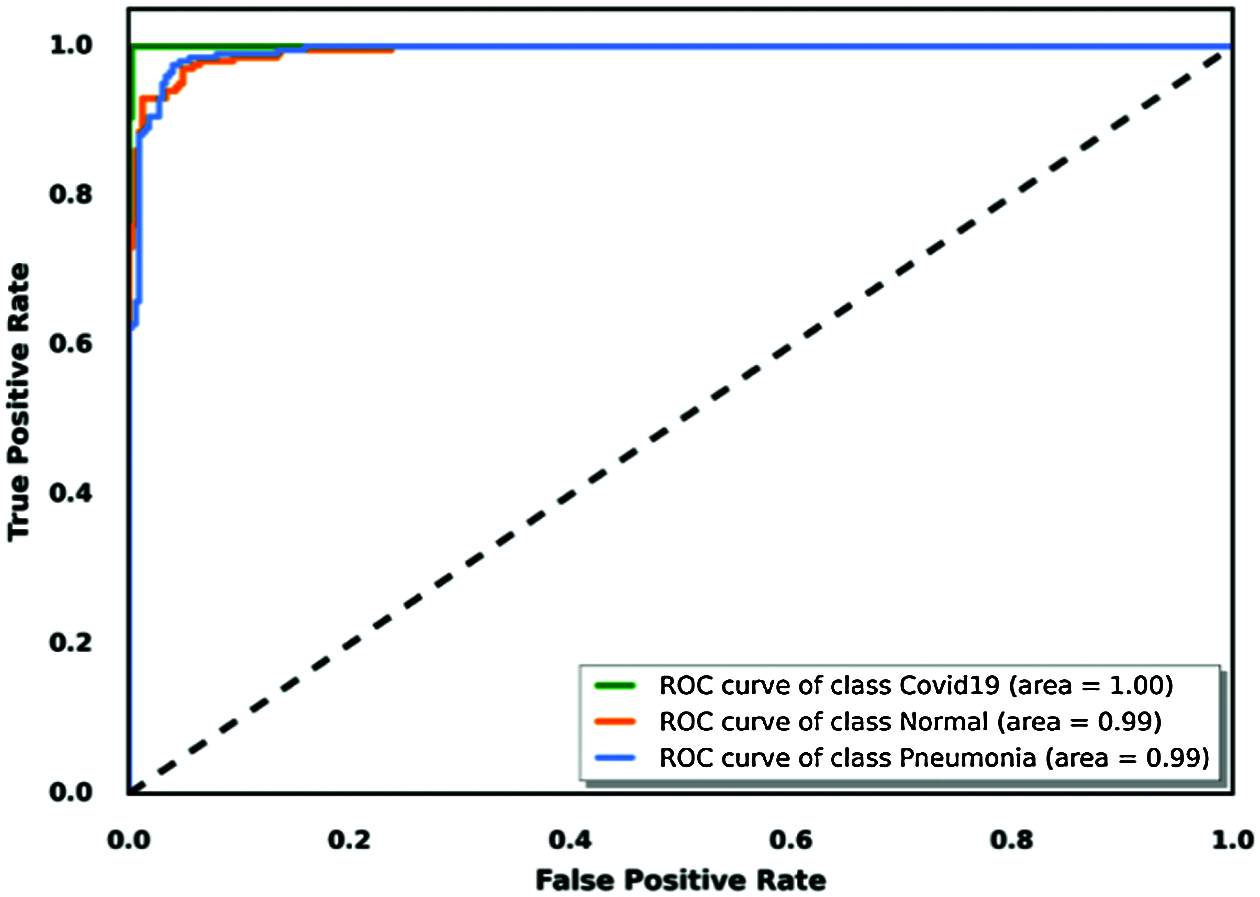
Figure 16: True positive rate based on the ROC curve visualization for the VGG19 model
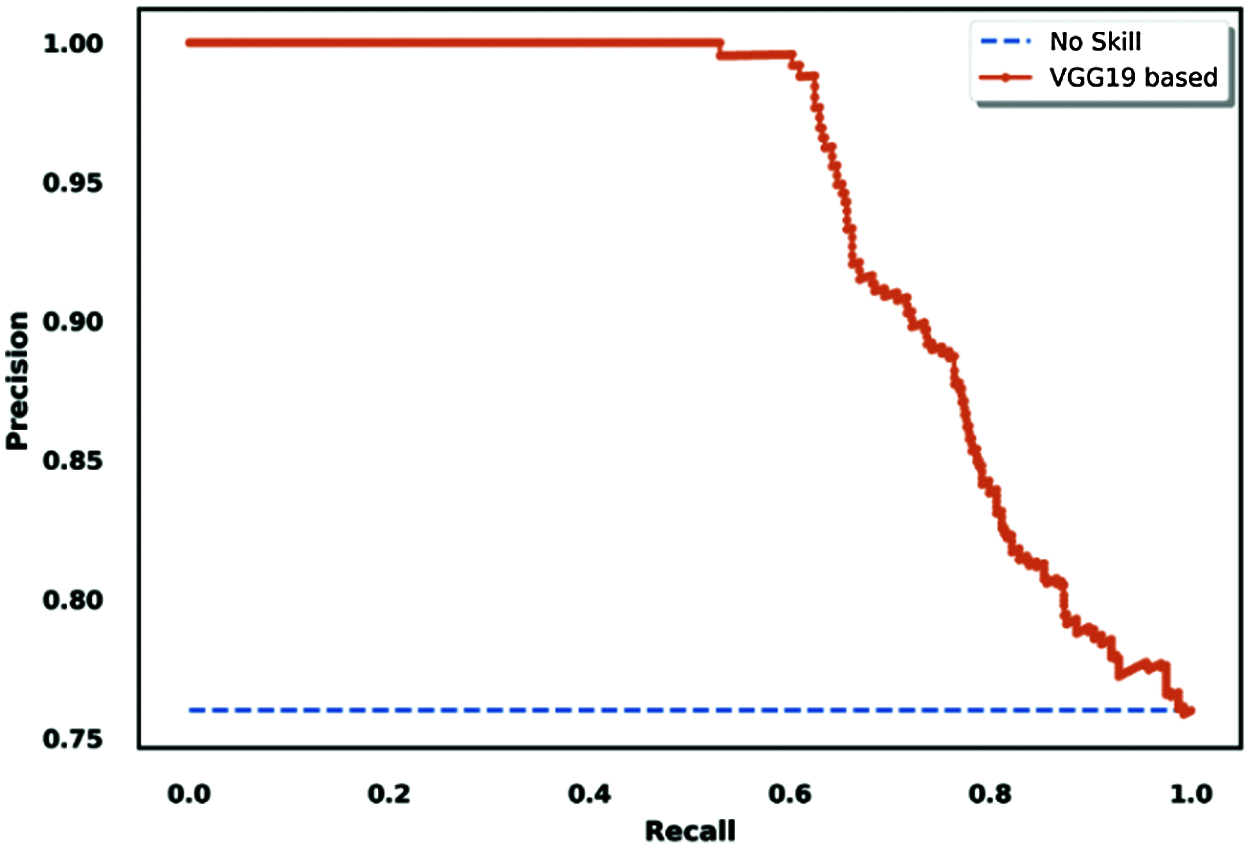
Figure 17: Precision/recall-based ROC curve visualization for the VGG19 model
We adapted our situation to the binary classification task to use this methodology for evaluation as an extra method. We created virtual results considering that COVID-19 was the principal class, and the other two classes (normal and pneumonia) were non-COVID classes; the results are shown in Fig. 17.
4.3 Grad-Cam Visual Explanation of Results
CNN models are generally a black box tool in terms of image processing across layers. Selvaraju et al. [35] proposed Grad-CAM as an interesting approach for debugging almost any CNN model Based on locating and processing the gradient of the target for the last convolutional layer, this methodology provides us with a heat-map to visualize how the model is processing our dataset and which regions of the images contribute the most to the prediction decision. This technique consists of tracking prediction process based on the last convolutional layer. Weighted sum of the feature maps is performed for each prediction in order to detect the principle areas of the original image that actually affects the model decision. The result is a kind of heat map that could be associated to the original image for visualization. This technique helps to determine whether the model predicts the COVID-19 case based on the correct infected region of the chest or not. Fig. 18 shows a real COVID-19 X-ray tested for prediction by different CNN models.

Figure 18: Grad-CAM visualization for predicting a real case of COVID-19: (a) Original case (True class: COVID-19), (b) VGG-19 (Predicted class: COVID-19), (c) VGG-16 (Predicted class: COVID-19), (d) MobileNetV2 (Predicted class: Normal)

Figure 19: Grad-CAM visualization for predicting a real case of pneumonia: (a) Original case (True class: Pneumonia), (b) VGG-19 (Predicted class: Pneumonia), (c) VGG-16 model (Predicted class: Pneumonia), (d) MobileNetV2 (Predicted class: Pneumonia)
The results of the prediction experiment show that the VGG19 and VGG16 models correctly predicted the case, and the Grad-CAM visualization confirmed that the prediction was based on the correct regions in the lungs. The MobileNetV2 model predicted the case as normal, and the Grad-CAM visualization of this model showed that the prediction was based on a small region of the X-ray image, which explains the result.

Figure 20: Grad-CAM visualization for predicting a real case of normal: (a) Original case (True class: Normal), (b) VGG-19 (Predicted class: Normal), (c) VGG-16 (Predicted class: Normal), (d) MobileNetV2 (Predicted class: Pneumonia)
Fig. 19 shows how the different models predicted a pneumonia X-ray image. The results demonstrate that the VGG16, VGG19, and MobileNetV2 models correctly predicted the pneumonia case. Grad-CAM visualization analysis shows that the VGG16 model decision was based on the correct regions of interest in the lungs. The VGG19 model’s Grad-CAM visualization was similar to the VGG16 result with little difference in the region of interest, but it still focused on the correct areas of the lungs. The debugging of the MobileNetV2 model using Grad-CAM visualization showed that the prediction decision was based on a small region in the lungs, which makes the prediction of this model untrustworthy.
In Fig. 20, the prediction of normal cases by different models shows that the VGG16 and VGG19 models correctly predicted the case as normal, but the MobileNetV2 model predicted it as pneumonia. The Grad-CAM visualization analysis confirmed that the VGG16 and VGG19 decisions were based on the correct pixels in the X-ray image, but the MobileNetV2 model focused on the wrong pixels in a small area of the image.
4.4 Comparing our Results with Related Works
Comparing our results to existing methods cited in the related works section shows that the VGG19 model had a 99% recall, 100% F1-score, and 96.97% accuracy. Additionally, our proposed model demonstrated that the percentage of correctly predicted COVID-19 cases that matched the ground truth in the test sub-dataset reached maximum precision (100%). In general, our method obtained good accuracy results compared to several cited methods; more details are shown in Tab. 5.
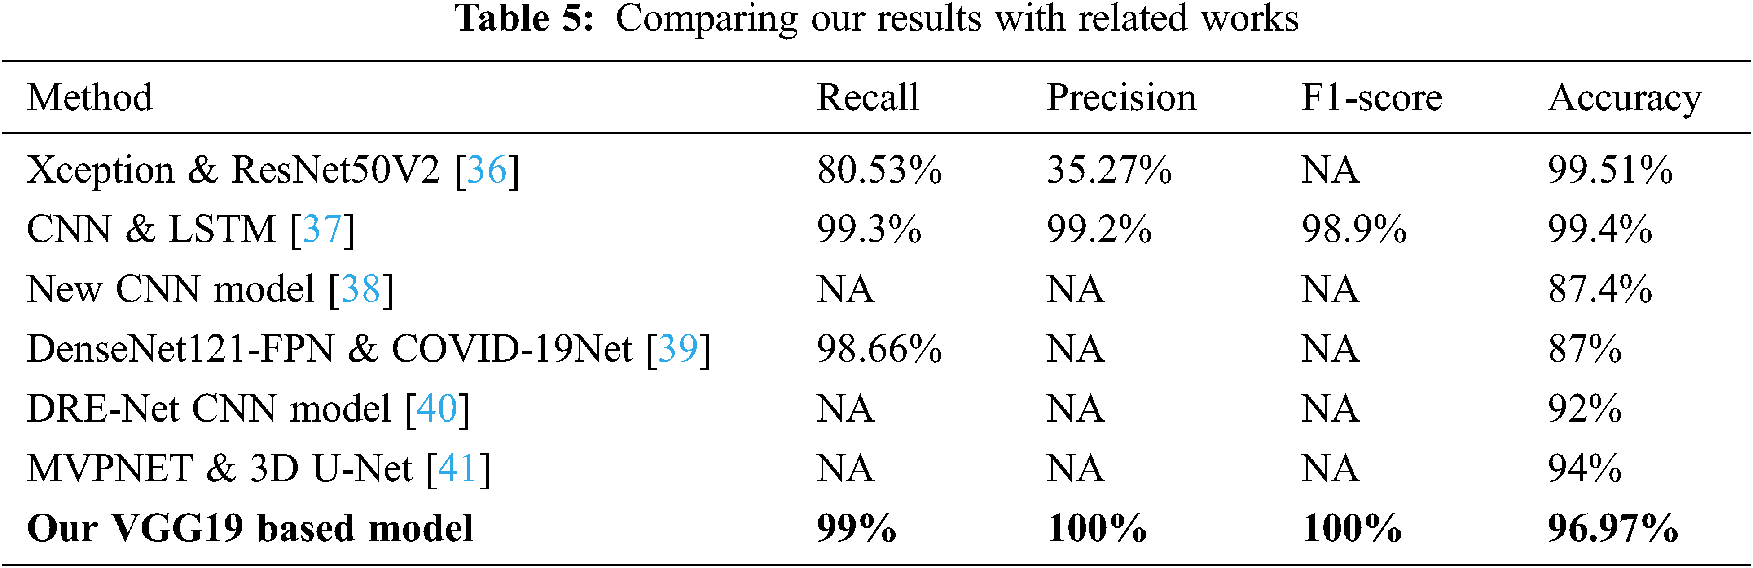
In particular, Rahimzadeh et al. [36] obtained high accuracy of 99.51% compared to our proposed model, but these results are less meaningful for predicting COVID-19 disease due to the use of a very unbalanced dataset. This is justified by the low value of the precision metric of 35.53%. In fact, the used dataset contains only 180 X-ray images that belong to patients infected with COVID-19 against 6054 patients with pneumonia and 8851 of normal patients. In addition, dataset images correlation is high due to the use of data augmentation technique. However, in our work, we avoid using any augmentation technique and trained our models by using only valid images that could contribute on the correct prediction of the COVID-19 patients. As a result, we obtained high precision on our best model and predicts 100% of COVID19 cases on the test set.
In this paper, we focused on training three CNN-based models using a zero-shot transfer learning technique to test the models’ ability to diagnose COVID-19 by analyzing a patient’s chest X-ray images.
The results obtained are very interesting in terms of precision and accuracy for all models and especially for the VGG19 model that obtained very satisfying results. Before conducting this experiment, we collected several positive COVID-19 X-ray images that were publicly available and filtered them to use only the valid elements.
The final version of our dataset contained 840 X-ray images of positive COVID-19 cases; however, this is still insufficient and needs to be increased. We trained the three models (VGG19, VGG16, and MobileNetV2) using the assembled dataset then tested the trained models on the test set. The results were used to evaluate the models’ decisions. To debug the prediction process, we implemented the Grad-CAM technique to visualize the region of interest in each X-ray image in each model; in particular, which pixels contributed the most to the model’s prediction decision.
Since the motivation is still present to continue in this topic in order to increase the performance of COVID-19 diagnosis, many improvements could be applied to this work in the future such as: 1) Increasing the dataset size of positive COVID-19 Chest X-ray images would absolutely make the dataset more balanced and improve the accuracy of prediction, 2) An optimization method of CNN hyper parameters could be adopted to increase the accuracy results. The main aim is to combine the best parts of high accuracy models in classifying COVID-19 into one model to achieve better performance.
Acknowledgement: We are thankful to the “Centre National pour la Recherche Scientifique et Technique” (CNRST) and the Hassan II University of Casablanca, Morocco, for their support to this work a part of a project entitled “Scientific and Technological Research Support Program in Link with COVID-19” launched in April 2020 (Reference: Letter to the Director of “Ecole Normale Supérieure de l’Enseignement Technique de Mohammedia” dated June 10th 2020).
1https://www.worldometers.info/coronavirus
2https://kaggle.com/tawsifurrahman/covid19-radiography-database
Funding Statement: The authors received no specific funding for this study.
Conflicts of Interest: The authors declare that they have no conflicts of interest to report regarding the present study.
1. H. A. S. Hashmi and H. M. Asif, “Early detection and assessment of Covid-19,” Frontiers in Medicine, vol. 7, pp. 311, 2020. [Google Scholar]
2. A. Alsaeedi and M. Al-Sarem, “Detecting rumors on social media based on a CNN deep learning technique,” Arabian Journal for Science and Engineering, vol. 45, no. 12, pp. 10813–10844, 2020. [Google Scholar]
3. S. Hamida, B. Cherradi and H. Ouajji, “Handwritten Arabic words recognition system based on hog and Gabor filter descriptors,” in Proc. of 1st Int. Conf. on Innovative Research in Applied Science, Meknes, Morocco, Engineering and Technology (IRASETpp. 1–4, 2020. [Google Scholar]
4. M. Al-Sarem, F. Saeed, A. Alsaeedi, W. Boulila and T. Al-Hadhrami, “Ensemble methods for instance-based Arabic language authorship attribution,” IEEE Access, vol. 8, pp. 17331–17345, 2020. [Google Scholar]
5. K. P. Ferentinos, “Deep learning models for plant disease detection and diagnosis,” Computers and Electronics in Agriculture, vol. 145, no. 6, pp. 311–318, 2018. [Google Scholar]
6. S. H. Lee, H. Goëau, P. Bonnet and A. Joly, “New perspectives on plant disease characterization based on deep learning,” Computers and Electronics in Agriculture, vol. 170, pp. 105220, 2020. [Google Scholar]
7. H. Ghoddusi, G. G. Creamer and N. Rafizadeh, “Machine learning in energy economics and finance: A review,” Energy Economics, vol. 81, no. 12, pp. 709–727, 2019. [Google Scholar]
8. P. Pawar and K. P. Vittal, “Design and development of advanced smart energy management system integrated with IoT framework in smart grid environment,” Journal of Energy Storage, vol. 25, no. 3, pp. 100846, 2019. [Google Scholar]
9. M. Zekić-Sušac, S. Mitrović and A. Has, “Machine learning based system for managing energy efficiency of public sector as an approach towards smart cities,” International Journal of Information Management, vol. 58, pp. 102074, 2020. [Google Scholar]
10. C. Feng, M. Y. Liu, C. C. Kao and T. Y. Lee, “Deep active learning for civil infrastructure defect detection and classification,” in Computing in Civil Engineering 2017, Seattle, United States, pp. 298–306, 2017. [Google Scholar]
11. H. G. Melhem and S. Nagaraja, “Machine learning and its application to civil engineering systems,” Civil Engineering Systems, vol. 13, no. 4, pp. 259–279, 1996. [Google Scholar]
12. R. Lynch, P. M. McNamara and N. Seery, “Promoting deep learning in a teacher education programme through self- and peer-assessment and feedback,” European Journal of Teacher Education, vol. 35, no. 2, pp. 179–197, 2012. [Google Scholar]
13. Q. N. Naveed, A. M. Aseere, A. Muhammad, S. Islam, M. R. N. Qureshi et al., “Evaluating and ranking mobile learning factors using a multi-criterion decision-making (MCDM) approach,” Intelligent Automation & Soft Computing, vol. 29, no. 1, pp. 111–129, 2021. [Google Scholar]
14. B. Cherradi, O. Terrada, A. Ouhmida, S. Hamida, A. Raihani et al., “Computer-aided diagnosis system for early prediction of atherosclerosis using machine learning and k-fold cross-validation,” in Int. Congress of Advanced Technology and Engineering (ICOTEN). Taiz, Yemen, 1–9, 2021. [Google Scholar]
15. Y. K. Chan, Y. F. Chen, T. Pham, W. Chang and M. Y. Hsieh, “Artificial intelligence in medical applications,” Journal of Healthcare Engineering, vol. 2018, pp. 1–2, 2018. [Google Scholar]
16. H. Moujahid, B. Cherradi and L. Bahatti, “Convolutional neural networks for multimodal brain MRI images segmentation: A comparative study,” in Proceeding of Smart Applications and Data Analysis, M. Hamlich, L. Bellatreche, A. Mondal, C. Ordonez (eds.vol. 1207. Cham: Springer International Publishing, pp. 329–338, 2020. [Google Scholar]
17. A. Bousselham, O. Bouattane, M. Youssfi and A. Raihani, “Towards reinforced brain tumor segmentation on MRI images based on temperature changes on pathologic area,” International Journal of Biomedical Imaging, vol. 2019, no. 13, pp. 1–18, 2019. [Google Scholar]
18. O. Daanouni, B. Cherradi and A. Tmiri, “Type 2 diabetes mellitus prediction model based on machine learning approach,” in Innovations in Smart Cities Applications Edition 3, M. Ben Ahmed, A. A. Boudhir, D. Santos, M. El Aroussi, İ.R. Karas (eds.Cham: Springer International Publishing, pp. 454–469, 2020. [Google Scholar]
19. O. Daanouni, B. Cherradi and A. Tmiri, “Automatic detection of diabetic retinopathy using custom CNN and grad-cam,” in Proceedings of Advances on Smart and Soft Computing, F. Saeed, T. Al-Hadhrami, F. Mohammed, E. Mohammed (eds.Vol. 1188. Singapore: Springer Singapore, pp. 15–26, 2021. [Google Scholar]
20. O. Terrada, B. Cherradi, A. Raihani and O. Bouattane, “Classification and prediction of atherosclerosis diseases using machine learning algorithms,” in Proc. of 2019 5th Int. Conf. on Optimization and Applications (ICOAKenitra, Morocco, pp. 1–5, 2019. [Google Scholar]
21. O. Terrada, S. Hamida, B. Cherradi, A. Raihani and O. Bouattane, “Supervised machine learning based medical diagnosis support system for prediction of patients with heart disease,” Advances in Science, Technology and Engineering Systems Journal, vol. 5, no. 5, pp. 269–277, 2020. [Google Scholar]
22. O. Terrada, B. Cherradi, A. Raihani and O. Bouattane, “A novel medical diagnosis support system for predicting patients with atherosclerosis diseases,” Informatics in Medicine. Unlocked, vol. 21, pp. 100483, 2020. [Google Scholar]
23. H. Moujahid, B. Cherradi, O. E. Gannour, L. Bahatti, O. Terrada et al., “Convolutional neural network based classification of patients with pneumonia using X-ray lung images,” Advances in Science, Technology and Engineering Systems Journal, vol. 5, no. 5, pp. 269–277, 2020. [Google Scholar]
24. O. El Gannour, S. Hamida, B. Cherradi, A. Raihani and H. Moujahid, “Performance evaluation of transfer learning technique for automatic detection of patients with covid-19 on X-ray images,” in 2020 IEEE 2nd Int. Conf. on Electronics, Control, Optimization and Computer Science (ICECOCSKenitra, Morocco, pp. 1–6, 2020. [Google Scholar]
25. O. Bouattane, B. Cherradi, M. Youssfi and M. O. Bensalah, “Parallel c-means algorithm for image segmentation on a reconfigurable mesh computer,” Parallel Computing, vol. 37, no. 4–5, pp. 230–243, 2011. [Google Scholar]
26. N. Ait Ali, B. Cherradi, A. El Abbassi, O. Bouattane and M. Youssfi, “GPU fuzzy c-means algorithm implementations: Performance analysis on medical image segmentation,” Multimedia Tools and Applications, vol. 77, no. 16, pp. 21221–21243, 2018. [Google Scholar]
27. N. A. Ali, B. Cherradi, A. El Abbassi, O. Bouattane and M. Youssfi, “New parallel hybrid implementation of bias correction fuzzy C-means algorithm,” in 2017 Int. Conf. on Advanced Technologies for Signal and Image Processing (ATSIPFez, pp. 1–6, 2017. [Google Scholar]
28. E. Bruce, F. Barlow-Pay, R. Short, A. Vilches-Moraga, A. Price et al., “Prior routine use of non-steroidal anti-inflammatory drugs (NSAIDs) and important outcomes in hospitalised patients with COVID-19,” Journal of Clinical Medicine, vol. 9, no. 8, pp. 2586, 2020. [Google Scholar]
29. K. Kallianos, J. Mongan, S. Antani, T. Henry, A. Taylor et al., “How far have we come? artificial intelligence for chest radiograph interpretation,” Clinical Radiology, vol. 74, no. 5, pp. 338–345, 2019. [Google Scholar]
30. N. Liu, L. Wan, Y. Zhang, T. Zhou, H. Huo et al., “Exploiting convolutional neural networks with deeply local description for remote sensing image classification,” IEEE Access, vol. 6, pp. 11215–11228, 2018. [Google Scholar]
31. M. D. McInnes, M. M. Leeflang, J. P. Salameh, T. A. McGrath, C. B. Pol et al., “Imaging tests for the diagnosis of COVID-19,” Cochrane Database of Systematic Reviews, Issue 6, Art. No. CD013639, 2020. [Google Scholar]
32. Q. Zhang, Y. Liu, G. Liu, G. Zhao, Z. Qu et al., “An automatic diagnostic system based on deep learning, to diagnose hyperlipidemia,” Diabetes Metabolic Syndrome and Obesity: Targets and Therapy, vol. 12, pp. 637–645, 2019. [Google Scholar]
33. D. Singh, V. Kumar, M. Kaur and M. Kaur, “Classification of COVID-19 patients from chest CT images using multi-objective differential evolution-based convolutional neural networks,” European Journal of Clinical Microbiology & Infectious Diseases, vol. 39, no. 7, pp. 1379–1389, 2020. [Google Scholar]
34. S. Wang, B. Kang, J. Ma, X. Zeng, M. Xiao et al., “A deep learning algorithm using CT images to screen for Corona virus disease (covid-19),” European Radiology, vol. 31, pp. 1–9, 2021. [Google Scholar]
35. R. R. Selvaraju, M. Cogswell, A. Das, R. Vedantam, D. Parikh et al., “Grad-CAM: Visual explanations from deep networks via gradient-based localization,” International Journal of Computer Vision, vol. 128, no. 2, pp. 336–359, 2020. [Google Scholar]
36. M. Rahimzadeh and A. Attar, “A modified deep convolutional neural network for detecting COVID-19 and pneumonia from chest X-ray images based on the concatenation of Xception and ResNet50V2,” Informatics in Medicine Unlocked, vol. 19, no. 6, pp. 100360, 2020. [Google Scholar]
37. Md Z. Islam, Md M. Islam and A. Asraf, “A combined deep CNN-LSTM network for the detection of novel coronavirus (COVID-19) using X-ray images,” Informatics in Medicine Unlocked, vol. 20, pp. 100412, 2020. [Google Scholar]
38. G. C. Saha, I. A. Ganie, G. Rajendran and D. Nathalia, “CNN analysis for the detection of SARS-CoV-2 in human body,” International Journal of Advanced Science and Technology, vol. 29, no. 12, pp. 2369–2374, 2020. [Google Scholar]
39. S. Wang, Y. Zha, W. Li, Q. Wu, X. Li et al., “A fully automatic deep learning system for COVID-19 diagnostic and prognostic analysis,” European Respiratory Journal, vol. 56, no. 2, pp. 1–44, 2020. [Google Scholar]
40. Y. Song, S. Zheng, L. Li, X. Zhang, X. Zhang et al., “Deep learning enables accurate diagnosis of novel coronavirus (COVID-19) with CT images,” IEEE/ACM Transactions on Computational Biology and Bioinformatics, 2021. [Google Scholar]
41. Q. Ni, Z. Y. Sun, L. Qi, W. Chen, Y. Yang et al., “A deep learning approach to characterize 2019 coronavirus disease (COVID-19) pneumonia in chest CT images,” European Radiology, vol. 30, no. 12, pp. 6517–6527, 2020. [Google Scholar]
42. H. Moujahid, B. Cherradi, M. Alsarem and L. Bahatti, “Diagnosis of COVID-19 disease using convolutional neural network models based transfer learning,” in Innovative Systems for Intelligent Health Informatics (IRICT 2020). Malaysia, 148–159, 2021. [Google Scholar]
43. S. Albawi, T. A. Mohammed and S. Al-Zawi, “Understanding of a convolutional neural network,” in Proc. of 2017 Int. Conf. on Engineering and Technology (ICETAntalya, pp. 1–6, 2017. [Google Scholar]
44. H. J. Jie and P. Wanda, “RunPool: A dynamic pooling layer for convolution neural network,” International Journal of Computational Intelligence Systems, vol. 13, no. 1, pp. 66–76, 2020. [Google Scholar]
45. A. Kensert, P. J. Harrison and O. Spjuth, “Transfer learning with deep convolutional neural networks for classifying cellular morphological changes,” SLAS Discovery: Advancing Life Sciences R&D, vol. 24, no. 4, pp. 466–475, 2019. [Google Scholar]
46. C. M. Jones and T. Athanasiou, “Summary receiver operating characteristic curve analysis techniques in the evaluation of diagnostic tests,” The Annals of Thoracic Surgery, vol. 79, no. 1, pp. 16–20, 2005. [Google Scholar]
47. S. Hamida, O. E. Gannour, B. Cherradi, H. Ouajji and A. Raihani, “Optimization of machine learning algorithms hyper-parameters for improving the prediction of patients infected with COVID-19,” in Proc. of 2020 IEEE 2nd Int. Conf. on Electronics, Control, Optimization and Computer Science (ICECOCSKenitra, Morocco, pp. 1–6, 2020. [Google Scholar]
 | This work is licensed under a Creative Commons Attribution 4.0 International License, which permits unrestricted use, distribution, and reproduction in any medium, provided the original work is properly cited. |