DOI:10.32604/iasc.2022.022266
| Intelligent Automation & Soft Computing DOI:10.32604/iasc.2022.022266 | |
| Article |
Quality Prediction of Wearable Apps in the Google Play Store
1Department of Computer Science, COMSATS University Islamabad, Attock Campus, 43600, Pakistan
2Faculty of Computing, The Islamia University of Bahawalpur, Bahawalpur, 63100, Pakistan
3Department of Computer Science and Software Engineering, International Islamic University, Islamabad, 44000, Pakistan
4Department of Computer Engineering, College of Computer and Information Technology, Taif University, PO Box 11099, Taif, 21994, Saudi Arabia
5Faculty of Engineering, Moncton University, NB, E1A3E9, Canada
6Department of Computer Engineering, Jeju National University, Jejusi, 63243, Korea
7Department of Information and Communication Engineering, Yeungnam University, Gyeongsan, 38541, Korea
*Corresponding Author: Muhammad Shafiq. Email: shafiq@ynu.ac.kr
Received: 02 August 2021; Accepted: 03 September 2021
Abstract: Play Store reviews play an important role in demonstrating that decisions are made from the user’s perspective, and contain a wealth of knowledge that can be used to understand quality issues and help developers build higher-quality mobile applications. Even for very important information, it can ensure the authenticity of user-generated content. In Play Store, wearable applications were recently launched, and are always open and easy to use, and are gradually being welcomed by users. Driven by popularity and self-interest, profit-incentive developers are developing low-quality applications and hiring robots to exaggerate ratings, reviews, or install counts. This is how spam in applications increases. Low-quality applications reduce the user’s quality experience and trust, because after users download an application, they will know the irrelevant and annoying content of the application. As a result, the reputation of the Play Store is damaged. Therefore, we analyzed the review content of different wearable applications and proposed a regression model that has a wide range of recommended features, including sentiment, content similarity, language and time features, to detect wearable applications in the Play Store. We use advanced machine learning techniques to evaluate and verify the quality of the model. Compared with existing models, the performance of our proposed model is very good, with an error rate as low as 0.40 MSE. Therefore, our regression model is most suitable for deep neural network (DNN) training.
Keywords: Machine learning; app quality prediction; wearable apps
From 2009 to 2019, the development of mobile applications on the market increased exponentially, with approximately 3.3 million available applications recorded [1]. Play Store reviews play an important role in presenting decisions from the user’s perspective, and noteworthy data can ensure the effectiveness of user-generated content. Due to the development of technology in recent years, the usage rate of wearable devices is on the rise [2], and developers have begun to develop applications specifically designed to run continuously on these wearable devices, called wearable applications. Despite the prosperity, many applications still receive low-star ratings [3] or reviews for lack of specific features, irrelevant descriptions, or poor user experience, all of which are related to the quality of the application. The Play Store allows users to search for any mobile application, install it, and provide feedback by rating or reviewing the application. These reviews and star ratings are basic indicators of application quality and its benchmarks.
Reviews on the Play Store represent a rich source of information related to the application. Therefore, it seems good to have users read reviews before downloading the app. However, new users will not even communicate whether the app is relevant after reading the reviews. The application leaderboard shows the ranking of the application, which is another way to promote the application. The top-ranked apps have higher downloads and millions of dollars in revenue. Therefore, application developers with profit incentives use illegal means by inflating ratings, reviews, or install counts [4], and some online application reviews sell software and websites, and many companies use them for commercial and profit incentives [5,6]. The user only downloads the application that appears at the top of the list and after downloading; the user understands the inappropriate content of the application, which reduces the user’s quality experience and trust. Therefore, there is a need to detect low-quality applications.
In this paper, we propose a regression model to divide wearable applications into low-quality and high-quality by analyzing the effects of comment content and proposed functions. Our basic research contributions are as follows:
• We propose a regression model that can effectively analyze reviews and descriptions about apps in the Play Store. We discussed detailed background analysis on the classification and analysis of review fraud, spam and incentive reviews and ratings, and app reviews and ratings.
• We evaluated by investigating the parameters such as content, sentiment, vocabulary, and statistical features in data set. We also elaborated on the key features that might aid in assessing the quality of wearable applications.
• We analyze the quality of applications through machine learning and feature engineering techniques, which include a series of functions that help improve the prediction of applications.
The structure of this article is arranged as follows. Section 2 provides an overview of related works. Section 3 introduces the proposed model. Section 4 discusses the results using the original and selected feature data sets. Finally, Section 5 draws our conclusions.
This section discusses some of the background information most relevant to this research. This information is mainly divided into the following categories.
In Rodrigues et al. [7] proposed a new method to evaluate App through comment sentiment analysis. The author conducted various analyses to confirm the correlation between the number of star ratings and the review content of various apps on Google Play. It turns out that the information in the comment does not display the star rating correctly. This study presents sentiment ratings by summarizing the opinions given by users in the comments. In Sangani et al. [8] present a detailed sentiment analysis of comments on various applications. They scrapped the comment dataset, cleaned it up, extracted features, applied linear regression to it, and provided a list of topics so that developers could interpret the comments. Average rating and representative reviews are their goals, but for a fixed learning rate with only average review length, their algorithm complexity is O(nk). In addition, the data set they use only contains reviews of popular apps. In Zhu et al. [9] uses a fuzzy logic model based on comment sentiment analysis to detect fraud in applications. Therein, the data set for 5 different application categories: social, shopping, gaming, finance, and news is used. The data set is passed through several stages of preprocessing and feature extraction, which helps extract user comment scores and help classify the application as fraudulent or genuine. The proposed method achieves an accuracy of 83% on average.
In, Liu et al. [10] uses text mining to extract features of applications and summarize user comments related to different applications and Natural Language Processing (NLP) techniques for writing rules. They extracted 600 reviews for each application and user reviews of two recent applications. They use SAS Sentiment Analysis Studio for sentiment analysis. The results show that the technology based on NLP rules outperforms the default model with 90% accuracy. In Luiz et al. [11] proposed a framework focusing on three different building blocks, namely sentiment analysis, topic modeling and summary reasoning. Therein, the authors extract semantic topics and related features from text data, and assign semantics to each extracted feature so that developers can effectively identify which topics will adversely affect the rating of the application. The results show that topic modeling can combine data in subcategories, which helps to determine which features have a positive and negative impact on the overall evaluation of the application. In Guzman et al. [12] uses NLP technology to extract application features in user reviews and topic modeling in order to group these features into more meaningful features. By combining these two technologies, the author generates abstracts with different granularities, which will help analyze user comments to identify new user needs or schedule future versions.
2.2 Fraud, Spam and Incentivized Reviews and Ratings
In Xie et al. [13] uses the automatic data collection system App watcher to analyze promotional incentives and suspicious reviewers, monitors applications that provide paid review services, and captures relevant metadata about the applications (e.g., the number of applications, service prices, and services Start Time). The system also exposes promotional apps through popular websites and app stores, and builds a basic tracker to restrict suspicious lists to promote apps. In Rahman et al. [14] proposed a new application review semantic analysis method for fraud detection. Therein, the authors use app review ratings, package names, and main conversations to detect fraud in apps. They apply NLP technology to obtain action words and fuzzy logic to further classify comments, and then conduct pattern analysis in the conversation, and finally analyze and compare the results.
In Abu-El-Rub et al. [15] analyzed incentive reviews on the Play Store and recognized the wide variety of review types and spam such as advertising, copy, and hidden profit incentives. They discovered a new type of abuse in the comments. By writing these comments, users promoted non-popular applications by targeting popular ones. They also detected promotional comments with 91% accuracy. In Li et al. [3] solved the problem related to low-rated applications and proposed a sextant method that uses apk file data and Convolutional Neural Network (CNN) to detect low-rated applications. The technique is based on static program analysis, which can prevent reputational risks in the application market because these low-quality applications are exposed to end users and facilitate the manual review process. On average, their method achieved 92.31% accuracy.
In Damaini et al. [16] developed a fraud detection ranking system to get a better user experience based on rankings, ratings, and reviews. In this way, the two types of fraud are assisted by analyzing the user’s comments and ratings on the application, and finally the three pieces of evidence are used to calculate the aggregation to evaluate the credibility of the application’s leading session. In Seneviratne et al. [17] used app metadata and detected spam apps. The suggested method manually marks the deleted applications according to some checkpoint heuristics, which show the reason for the application being deleted. A 35% of the deleted applications were spam. The authors map these heuristics to identify the spam applications. Authors also build an Adaptive Boost classifier for early detection of spam applications, with an accuracy rate of 95%. However, the precision of this method is 85–95%.
In Zhu et al. [18] focused on ranking, rating, review, recommendation based evidences. They used real data from the Play Store for evaluation, and collected the data set of the top 300 applications from the App Store rankings for experimental purposes. Compared with existing methods, they obtained a higher accuracy rating. In Sandulescu et al. [19] solved the problem of the same person writing false comments under different names, and posted each comment under multiple names. They proposed two methods of junk opinion detection. The first method extends the semantic similarity, and it uses WordNet to find the dullness between the review words. The second method is based on topic modeling, using the topic similarity of reviews: bag of words and bag of opinions phrases. The experiment was conducted on three different data sets from these applications: Yelp, Trustpilot, and Ott. The first method is better than the vector model. The result shows that the accuracy score of the comment classifier is very high.
In Arp et al. [20] proposed an effective and interpretable system called DREBIN for detecting malicious applications. They perform extensive static analysis to collect the extracted feature sets mapped into the vector space for the system through learning-based detection. Their system is superior to several technologies with a 94% malware detection capability. In Fu et al. [21] proposed a WisCom integrated system for Play Store user reviews, which can analyze millions of reviews and user ratings. This system is able to identify inconsistencies in reviews, reasons why users like or dislike apps, and provide valuable insights for app market-related users and preference-related apps. In [21], the author conducted a review-centered, market-centered, and application-centered analysis of reviews. It also collected app metadata information for approximately 171,493 user reviews.
In Ghai et al. [22] proposed a comment processing method. They suggest some parameters to discover the usefulness of comments. These parameters show the different changes of a particular comment relative to other comments, thereby increasing the possibility of detecting spam or not detecting spam based on the score assigned to each comment. The method also divides comments into helpful and unhelpful with a threshold of 0.75. In Gao et al. [23] proposed a framework to identify emerging issues by analyzing user comments. After evaluating the framework on six popular apps in Play Store and App Store, feedback from different users showed that 88.9% of users agreed that the framework helped to solve the identified problems in app development. In, Maalej et al. [24] introduced several probabilistic methods to classify app reviews for feature requests, bug reports, and user ratings. They use comment metadata to classify user comments. Therein, the NLP, text classification and sentiment analysis techniques are adopted to over-extract comment data. Their results show that the classification results of separate metadata are not good. When combined with NLP, the classification accuracy obtained is between 70–90%.
In Platzer [25] proposed a system to automatically classify user comments related to the motivation for use in the comments, named recommendation system, application reward decision support system, download prediction mechanism, and learning environment for mobile application development. Author conducted feature-based opinion mining, latent semantic indexing and sentiment analysis for review content and reviewed quality evaluation. In Khalid et al. [26] developed a system so that end users better understand different mobile applications. They also analyzed the existing review systems and identified different deficiencies and made suggestions to help improve the quality of user reviews. In Vasa et al. [27] conducted a preliminary analysis of Apple App Store reviews. The detailed analysis included a data set of approximately 17,330 applications, including 8.7 million reviews. Their results show that it is useful for users to give short comments with ratings, while users give longer comments with ratings. In some categories, the ratings of applications are significantly higher than other categories, but the category influences the length of the comment. However, reliable quality predictions for wearable applications need to be designed to help users understand the true ratings before installing them on the Play Store.
We propose a prediction model to detect whether the quality of the application is low or high. The proposed framework consists of five stages, as shown in Fig. 1. In the first stage of preprocessing, data cleaning is performed. The data set is cleaned to remove noise. In the second stage, data conversion techniques are applied to improve the reliability of the preprocessed data set. In the third stage, the proposed features are calculated from the features of the existing data set. In the fourth stage, a feature selection technique is applied to select a feature subset from the feature set of the original data set. Finally, train the classifier on the data set we prepared, and divide the application into two categories, namely low quality and high quality. Finally, different performance indicators are applied to evaluate the performance of each training classifier. The steps in Fig. 1 are discussed in the following subsections.

Figure 1: Proposed regression model
The data set used is taken from [28] and has many functions related to wearable applications. The retrieved data set takes the form of two files, one contains application metadata and the other contains a comment data set, which contains functions related to each application (for example, application ID, rating, review text, application Description, commenter’s name, comment score, maximum installs, minimum installs, etc.). The data set contains nearly 4720 application data, and its score is associated with each comment given by the user. Initially, there were only about 1,198 applications from 2015 to 2016, and a data set of 146,205 comments in total was used for further processing. The number of applications has a rating range of 1 to 5, where 1 is the lower rating and 5 is the highest rating.
From the comment data set, only English comments were initially filtered, because app comments have different languages and symbols, and they must be preprocessed before features are extracted. Before eliciting features, we have performed operations such as lowercase letters, stop word removal, and punctuation removal. After filtering the English comments, the comment text becomes lowercase. As a result, a lot of words were merged, which reduced the dimension of the problem. Stop words are the most common and most frequent words in the text, such as “a”, “the”, etc. Such words are useless in the text and cannot provide useful information for comment classification. Therefore, such words are deleted to save processing time. The use of punctuation marks is common among users to avoid grammatical errors. Therefore, we delete the comma, exclamation mark, question mark, etc. to further maintain the consistency of the content.
The useful features calculated from the data set are divided into four categories, namely, emotion, language, content similarity, and time features.
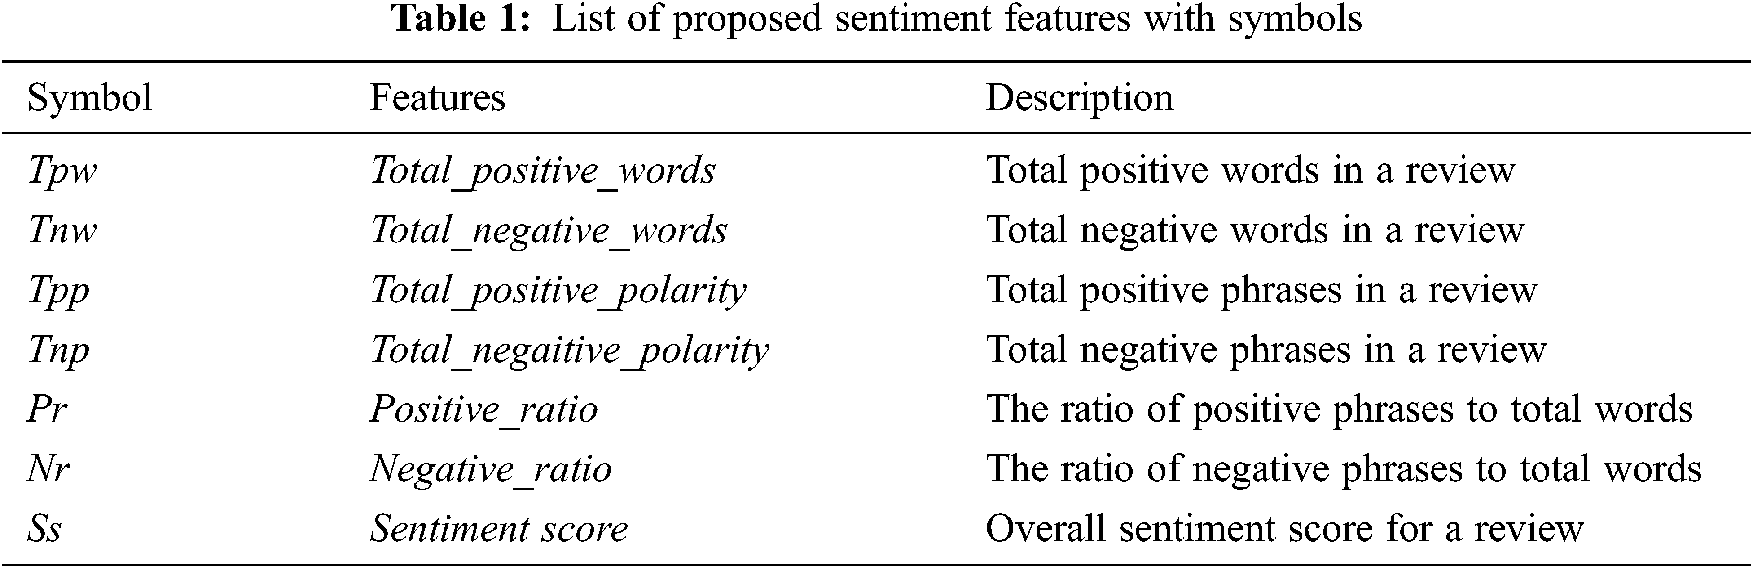
We perform sentiment analysis on text comments to obtain the user’s positive or negative sentiment towards the application. The sentiment score ranges from –1 to + 1, with 0 in the middle. A score from 0 to + 1 indicates the positivity of the application, and the higher the value, the more positive the evaluation. Similarly, a score from 0 to –1 indicates a negative impact on the application, and a lower value indicates a greater negative impact in the review. We use the Python NLTK suite to calculate the features in the comment dataset-in addition to sentiment features, we also use the following general features related to sentiment in the comments represented in the Tab. 1.
We first identify the positive and negative words in the reviews by Eq. (1), and then use the Eq. (2) to calculate the polarity of the number of reviews as follows:
We calculate the sentiment score by subtracting the ratio of positive polarity and negative polarity in the following,
3.3.2 Content Similarity Features
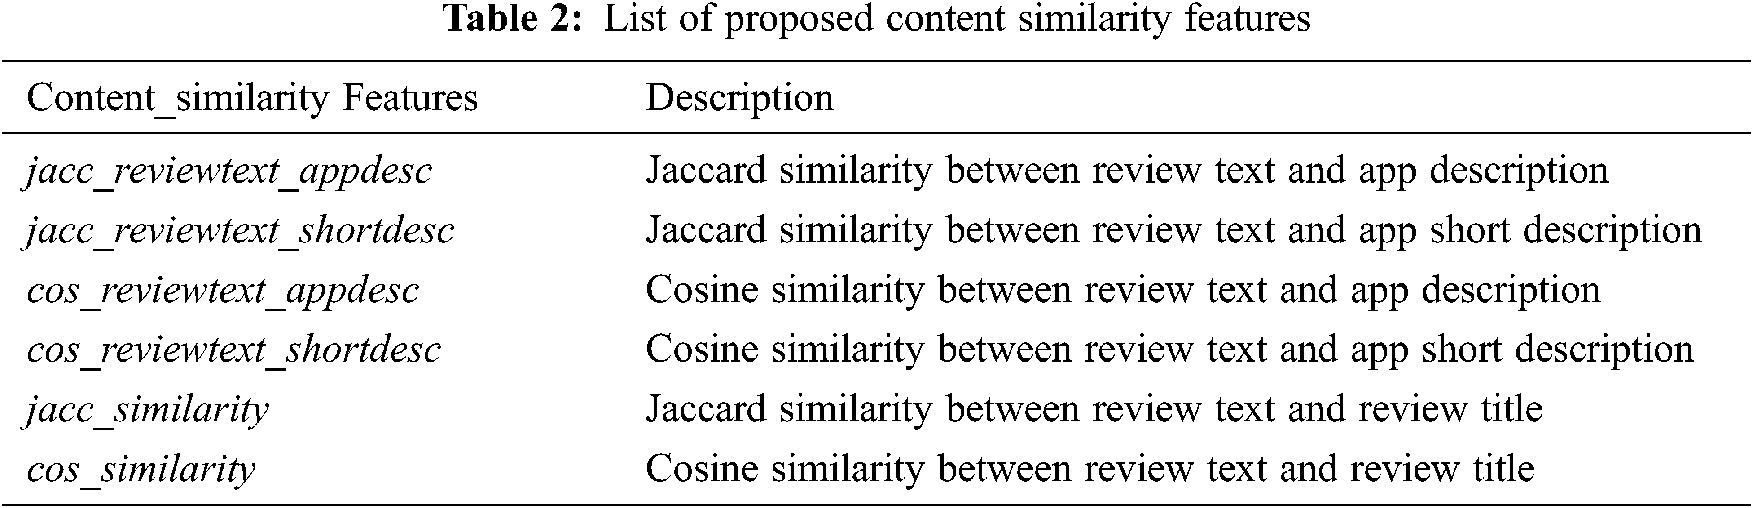
The content similarity is determined by a similarity measure that reflects the closeness between two documents or texts. The similarity measure calculates the similarity based on terms in the text. For this purpose, we use the Jaccard and Cosine similarity measures to estimate the similarity of the review content. The similarity is calculated between the comment text and the comment title. Just as the title of the review is “Great Radar”, the text of the review is “Great Basic Radar”, and it is also calculated between the review text and the application description. Jaccard similarity is calculated by dividing the total weight of shared terms by the total weight of unique terms in the review, as follows:
Cosine similarity is measured by matching similar reviews by common methods, regardls of their size in a multi-dimensional space. Each dimension represents a term that has its weight in the report, and the weight is non-negative. The similarity is determined, by the angle between the number of reviews or the cosine of the angle, which corresponds to the correlation between the vectors, in the following:
where
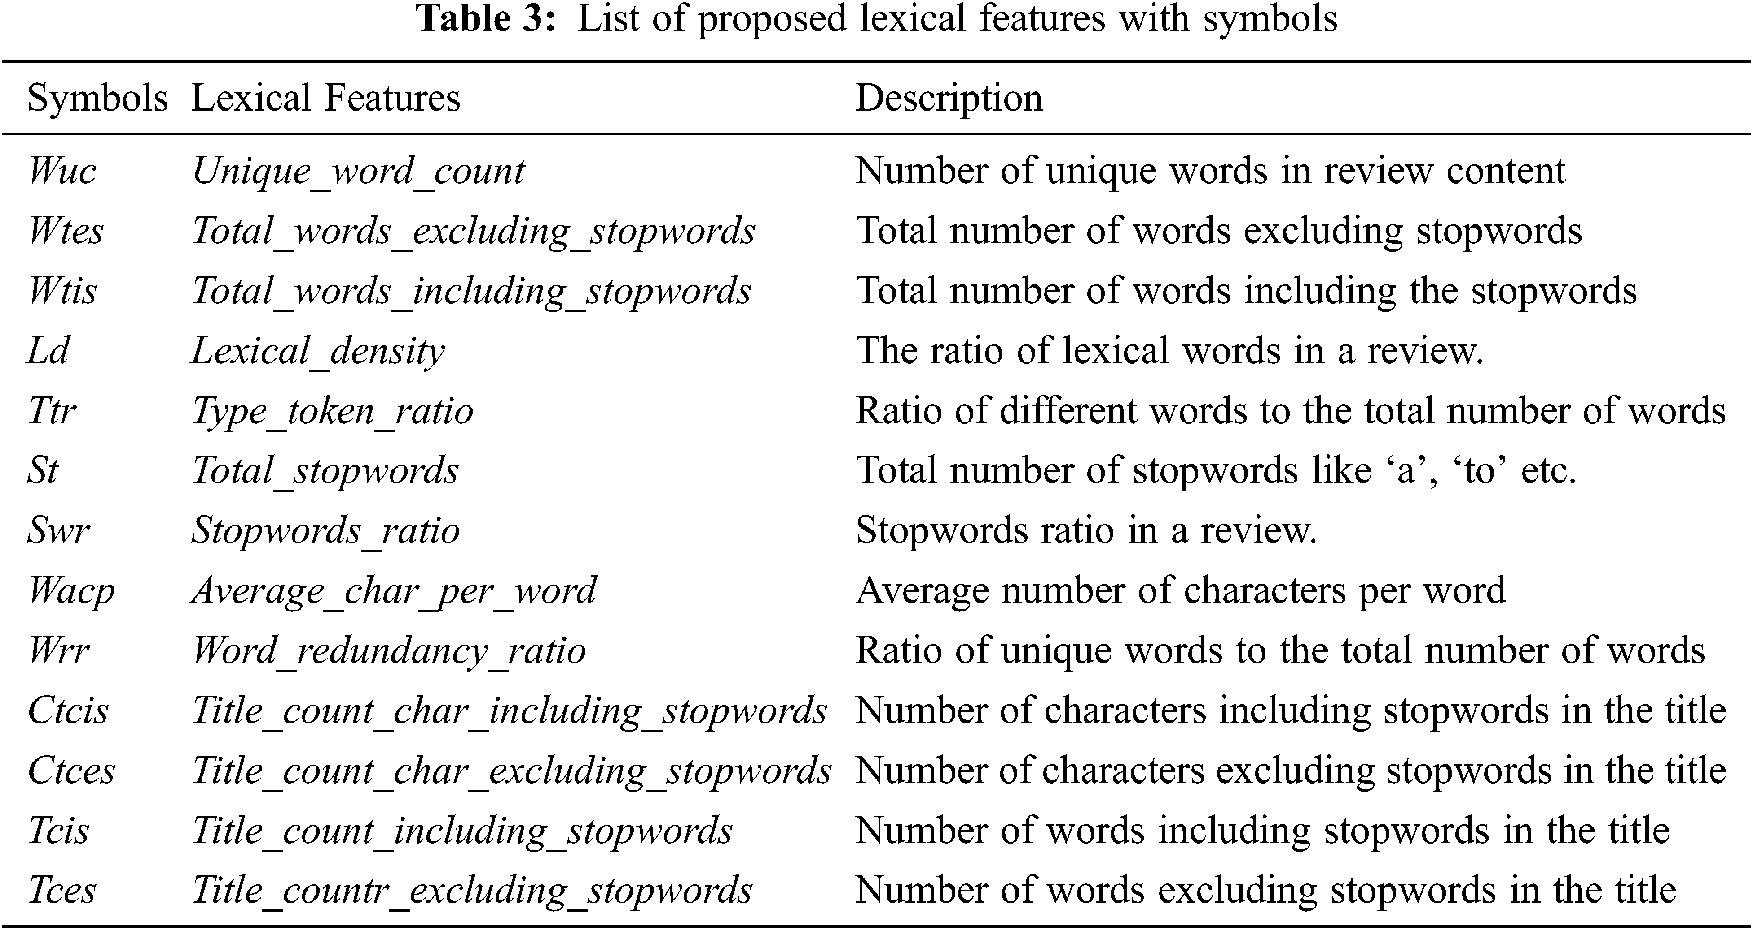
We extract language features from comment content. Since spam and fake comments are mainly created by users and robots for financial gain, language features equivalent to different writing styles are used to detect such comments. Therefore, in order to capture such comments, the commonly used language features are: 1) lexical features; and 2) syntactic features. Lexical features capture character-level and word-level features, such as unique word count, total words, word redundancy ratio, etc. The general lexical features calculated with symbols and descriptions are shown in Tab. 3.
In Eq. (6) Wacp for the review text is calculated by dividing the
Unique and stopwords ratio is given by the Eqs. (6)–(7) as follows,
Word redundancy ratio in the content is mathematically defined in Eq. (9),
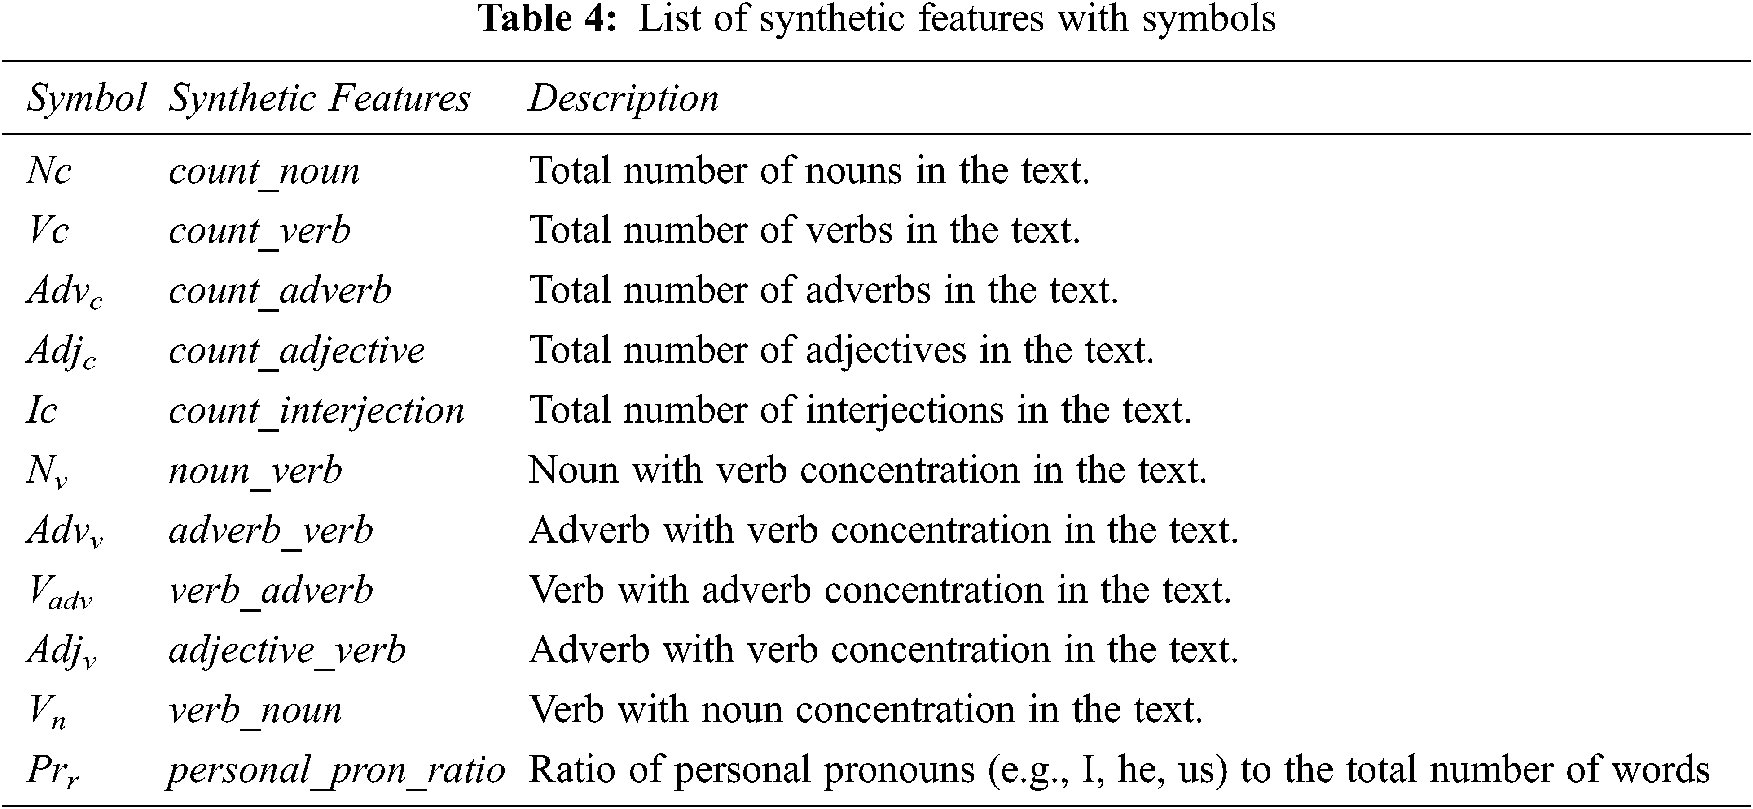
We calculate synthetic features to identify words or phrases from user comments on the quality and functionality of the application. Therefore, part-of-speech (POS) tagging features are calculated to identify such noun words and phrases. Synthetic features represent sentence-level features, including the frequency of function words, POS tags, such as noun concentration, count noun, count adj, etc. The general synthetic characteristics are shown in Tab. 4.
Features that are related to or change over time are considered temporal. The time interval is the basic highlight of setting up fake reviews and ratings for apps to promote them to high rankings (such as safely and quickly raising or lowering the position of the app). Spammers usually use various names to post a large number of comments with high or low ratings. In a specific time frame, if a spam attack occurs, the amount of comments may increase sharply, and the score may increase or decrease at the same time [29], so the pattern between the two can be detected to highlight such issues and published applications. Comments posted together or posted between the comment given and the developer’s response. The general time characteristics are shown in Tab. 5.

At this stage, data transformation techniques are applied to the preprocessed data set, transforming it into a structure suitable for the classification process. Therefore, the different size values need to be changed to a predetermined range to obtain useful data about the prepared data set. We use the following method to transform the data into an appropriate form. The preprocessed data set and the calculated features are modified in a structure suitable for the classification process. We use data normalization process, for example, min-max normalization is used to normalize the data feature values within a certain range. All features values must be normalized to obtain the uniform quality of each data value. The formula for min-max normalization is given by the following.
The data set used for investigation may contain multiple attributes, and a large number of attributes may be unnecessary or redundant for the mining task. Although it may be feasible to select a part of the useful functions of the region, it can be a cumbersome and time-consuming task, mainly when the behavior of the information is not significant. It may be disadvantageous to forget the applicable features or keep the irrelevant features. Therefore, feature reduction reduces the size of information by removing these features from it. A technique called information gain is applied to reduce the data size.The goal of information gain is to locate the smallest attribute set.The resulting probability distribution of the data class is as close as possible to the abnormal dispersion obtained by using all the attributes. Mining the reduced feature set has an additional advantage, which is to improve the accuracy and reduce the complexity of the proposed model. The information gain formula follows the following:
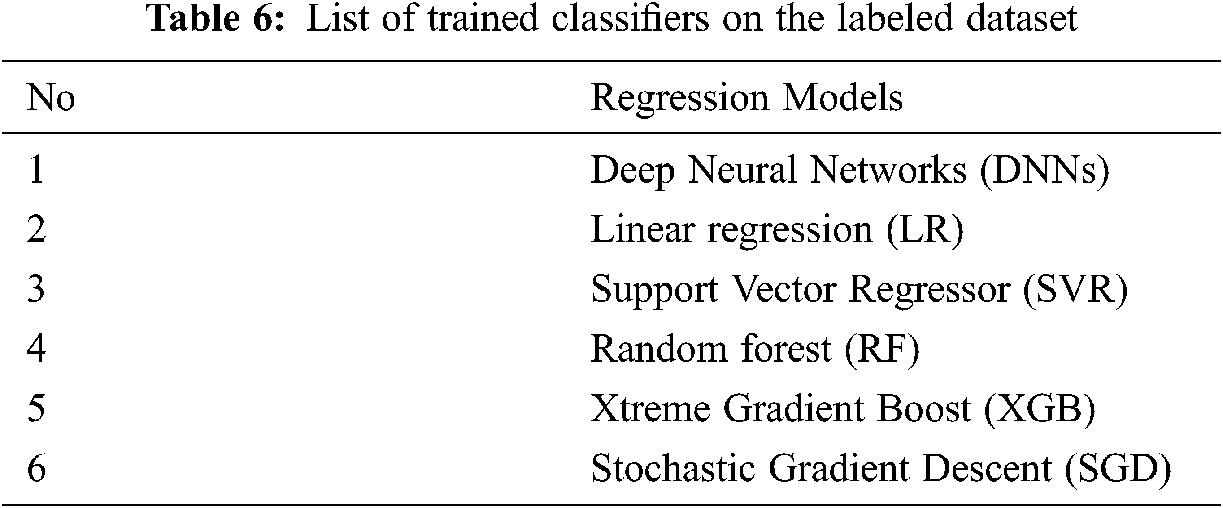
We use various machine learning (ML) regression models to predict the quality of Google Play Store apps, as shown in Tab. 6. In this section, we investigated the most commonly used indicators for regression problems, as well as the basic workflow of the classifiers used.
We implemented the ML regression model in Python, and tested and verified them on the prepared data set to obtain accurate prediction results. Different statistical techniques can be used to split the data set into a training set and a test set [30,31]. We split the preprocessed data set into two subsets, such as the training set and the test set. Therefore, 75% of the prepared data set is used to train the regression model, and the remaining 25% of the data instances have been used for testing purposes. This method helps to avoid the possibility of data overfitting and gives accurate prediction results. We define classification limits to mark application quality so that the predictions of each implemented regression model can be divided into two categories, such as low quality and high quality. If the predicted score is higher than the threshold, it indicates a “high-quality application”; a value below the threshold is designated as a “low-quality application”. The classification threshold (T) of the proposed model is by the following:
We use mean square error (MSE), mean absolute error (MAE), and root mean square error (RMSE) to determine the validity of the regression model. The average absolute error is used for evaluation. It measures the deviation between the actual value and the predicted value. It is obtained by taking the difference between the predicted value and the target value and is given by,
MSE measures the average of the squared difference between the estimated value and the actual value; take the square to remove any negative values; the equation is given by
RMSE is used to find the error rate of the regression model and check whether the size of the error is the same as the size of the target. It is determined by the square root of the MSE given by followings,
In this section, we introduce the experimental setup, results and discussion of the proposed regression model. The comparison highlights the performance of different implemented regression models in terms of MAE, MSE, and RMSE. Fig. 2a shows the error rate of the implemented regression model; it can be observed that all regression models perform well and effective in predicting regression model.

Figure 2: Rate of the regression models: (a) MAE; (b) MSE; (c) RMSE
It can be observed that the DNN model performs well compared with all implemented regression models, with a smaller MAE value of 3.1. Fig. 2b visualizes the MSE error rate based on the implemented regression model; it can be observed that all regression models perform well and effective in predicting application scores with low error rates. It turns out that compared with all other implemented models, the MSE of the DNN model is smaller, only 0.4.
Fig. 2c shows RMSE highlight the error rate in the prediction process. We observe that RMSE of the DNN model is lower than 6.1 compared to all other implemented models. Therefore, the prediction result of DNNs model is the best among all applied regression models. Because the RMSE value of the test data is small, it shows that our model is most suitable for the model data. Fig. 3 shows the relationship between MAE loss and epoch. It can be observed that the MAE value decreases as it moves to the target value, and the prediction rate of the DNN model increases as the number of epochs increases. In each epoch, the MAE value decreases and the prediction accuracy improves.

Figure 3: Loss value analysis of DNN model
Tab. 7 shows the actual and predicted scores of ten randomly selected wearable applications. The prediction results presented are obtained using implemented regression models such as DNN, RF, LR, SGD, SVR, and XGB. The actual score and predicted score for each application are between 0 and 1. Fig. 4 shows the predicted scores obtained for each Google Play store application using RM. It can be clearly shown that, except for the DNNs model, the prediction score of each regression model is higher than 0.5. In Fig. 5, the predicted score of the DNN model is close to the expected score. In Fig. 5, the comparative analysis of Google Store apps is based on actual and predicted scores using DNN models. According to the defined classification threshold, if the expected score is higher than or equal to the threshold (T) value, the application is classified as a high-quality application; otherwise, it is a low-quality application. Tab. 8 shows the results of the classification application based on defined thresholds and actual class quality values. It can be clearly seen that the DNN model accurately predicts the application score compared with other implemented regression models. In [32], the author uses a dataset of user reviews to predict app star ratings, in which multiple linear regression model and support vector machines are used. The author reports the predicted results of MSE of 0.67 and 0.927. The regression model we proposed uses the DNN model to achieve the most promising prediction results. Our model performs well with a low error rate of 0.40 MSE. Tab. 9 compares the results of the proposed model with the existing models. It is found that compared with the previous method, the proposed model can effectively predict the quality of the apps.
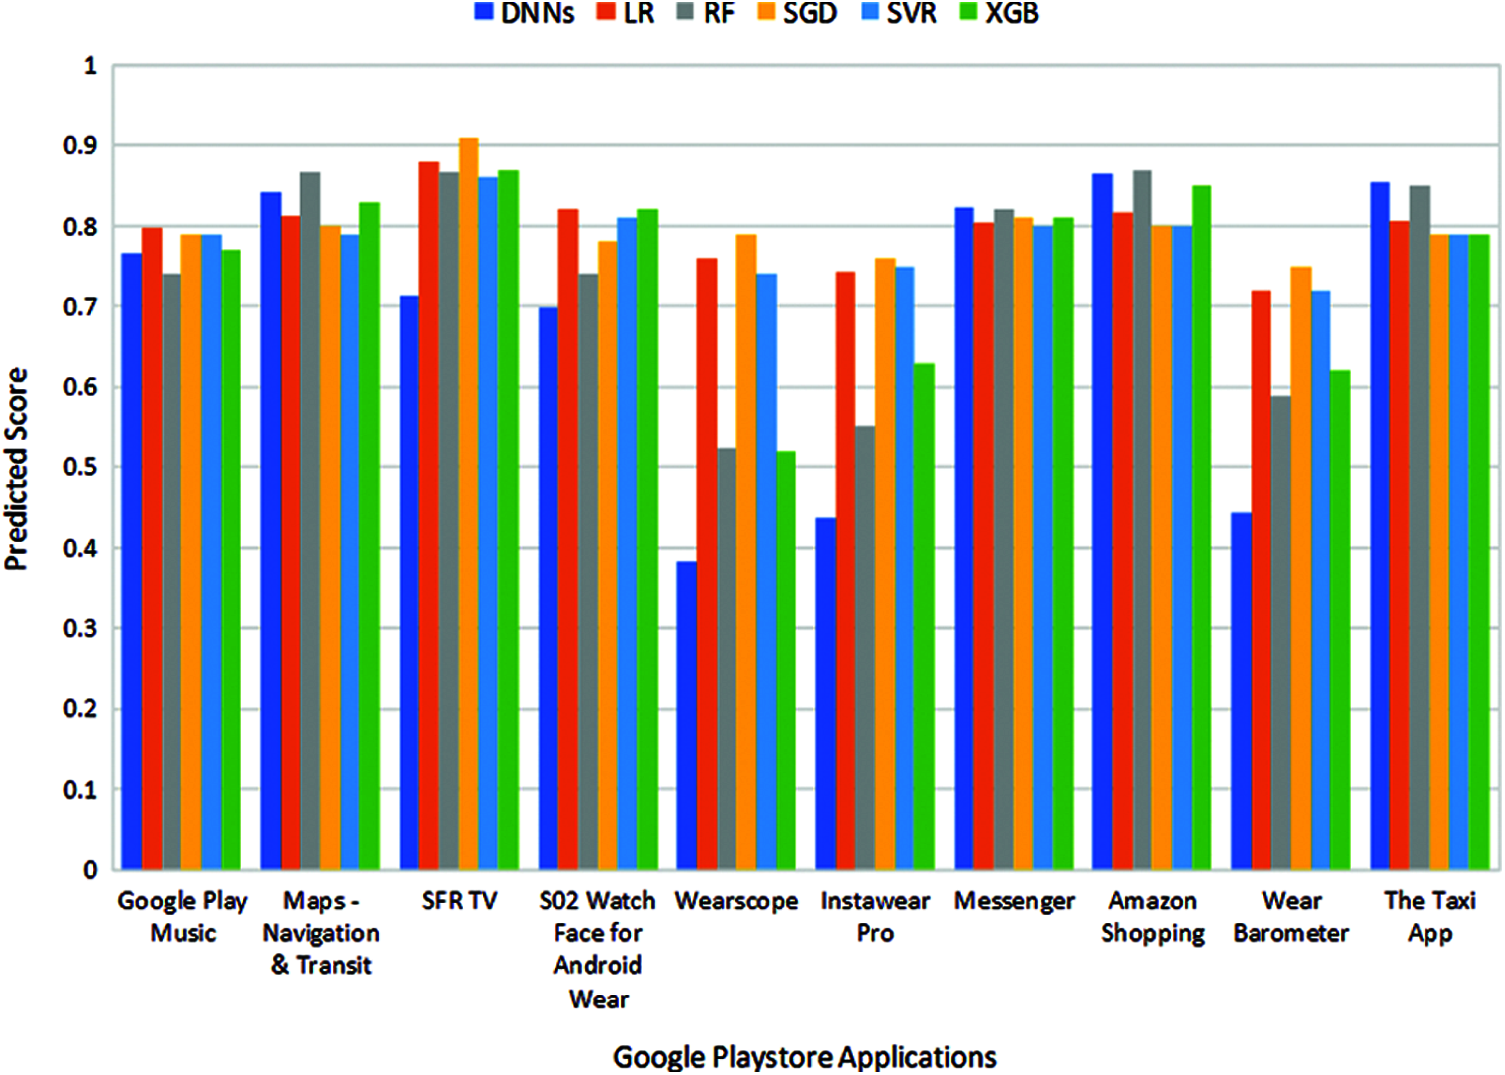
Figure 4: Predicted score of the applications using regression models analysis
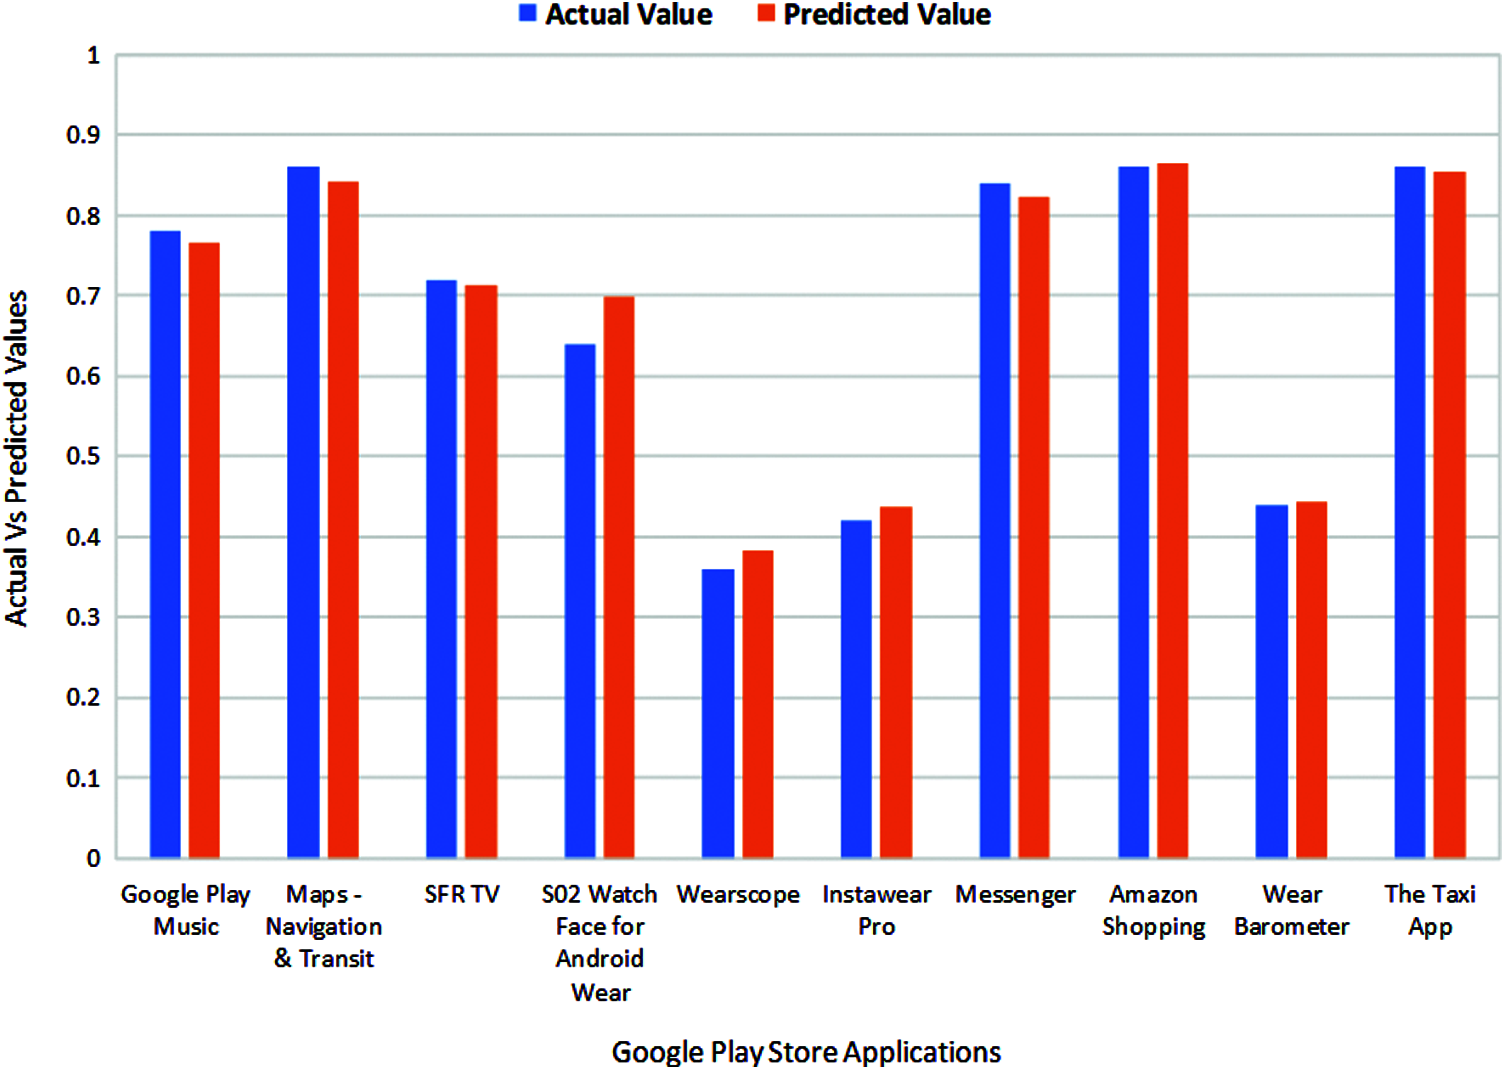
Figure 5: Actual and predicted score values of the applications using DNN model


We propose a novel regression model to predict and classify the quality of the application. This article describes the entire structure of the model from data acquisition to App classification. Our regression model is developed through feature engineering, involving multiple features, such as emotion, language, content similarity, and temporal features. These features combine to form a hybrid model. We validated our model by applying different advance machine learning algorithms like DNNs, LR, RF, SVR, SGD, and XGB to a large dataset of reviews collected for the number of wearable apps. The proposed regression model uses various performance indicators, such as MAE, MSE, and RMSE, to evaluate the performance of all regression models. The experimental results show that the DNNs model performs well in terms of MAE, MSE, and RMSE of 3.10, 0.40, and 6.10, respectively. Our proposed hybrid feature set is most suitable for predictive models, and the proposed model performs well from existing working models and state-of-the-art technologies in predicting the quality of wearable applications.
Acknowledgement: The authors thank Taif University Research Supporting Project number (TURSP-2020/239), Taif University, Taif, Saudi Arabia.
Funding Statement: This work was supported by Taif University Research Project number (TURSP-2020/239), Taif University, Taif, Saudi Arabia.
Conflicts of Interest: The authors declare that they have no conflicts of interest to report regarding the present study.
1. T. Rachad and A. Idri, “Intelligent mobile applications: Asystematic mapping study,” Mobile Information Systems, vol. 2020, no. 1, pp. 1–17, 2020. [Google Scholar]
2. J. Chauhan, S. Seneviratne, M. A. Kaafar, A. Mahanti and A. Seneviratne, “Characterization of early smartwatch apps,” in Proc. Int. Conf. on Pervasive Computing and Communication Workshops, Sydney, Australia, pp. 1–6, 2016. [Google Scholar]
3. D. Li and D. Song, “Detecting low rating android apps before they have reached the market,” arXiv preprint arXiv:1712.05843, 2017. [Google Scholar]
4. S. Banerjee, S. Bhattacharyya and I. Bose, “Whose online reviews to trust? understanding reviewer trustworthiness and its impact on business,” Decision Support Systems, vol. 96, no. 1, pp. 17–26, 2017. [Google Scholar]
5. B. Guo, Y. Ouyang, T. Guo. L. Cao and Z. Yu, “Enhancing mobile app user understanding and marketing with heterogeneous crowd sourced data: A review,” IEEE Access, vol. 7, no. 2019, pp. 68557–68571, 2019. [Google Scholar]
6. Y. Ouyang, B. Guo, X. Tang, X. He, J. Xiong et al.., “Mobile app cross-domain recommendation with multi-graph neural network,” ACM Transactions on Knowledge Discovery from Data, vol. 15, no. 4, pp. 1–21, 2021. [Google Scholar]
7. P. Rodrigues, I. Silva, G. Barbosa, F. Coutinho and F. Mourão, “Beyond the Stars: Towards a Novel Sentiment Rating to Evaluate Applications in web Stores of Mobile Apps,” in Proc. World Wide Web, Perth, Australia, pp. 109–117, 2017. [Google Scholar]
8. C. Sangani and S. Ananthanarayanan, “Sentiment analysis of app store reviews,” Methodology, vol. 4, no. 1, pp. 153–162, 2013. [Google Scholar]
9. H. Zhu, H. Xiong, Y. Ge and E. Chen, “Discovery of ranking fraud for mobile apps,” IEEE Transactions on Knowledge & Data Engineering, vol. 27, no. 1, pp. 74–87, 2014. [Google Scholar]
10. J. Liu, M. K. Sarkar and G. Chakraborty, “Feature-based sentiment analysis on android app reviews using SAS® text miner and SAS® sentiment analysis studio,” in Proc. Statistical Software Suite Global Forum, San Francisco, CA, pp. 1–7, 2013. [Google Scholar]
11. W. Luiz, F. Viegas, R. Alencar, F. Mourão, T. Salles et al., “A feature–oriented sentiment rating for mobile app reviews,” in Proc. World Wide Web, Lyon, France, pp. 1909–1918, 2018. [Google Scholar]
12. E. Guzman and W. Maalej, “How do users like this feature? a fine grained sentiment analysis of app reviews,” in Proc. Int. Requirements Engineering Conf., Karlskrona, Sweden, pp. 153–162, 2014. [Google Scholar]
13. Z. Xie and S. Zhu, “Appwatcher: unveiling the underground market of trading mobile app reviews,” in Proc. Security & Privacy in Wireless and Mobile Networks, New York, NY, USA, pp. 1–10, 2015. [Google Scholar]
14. M. Rahman, M. Rahman, B. Carbunar and D. H. Chau, “Search rank fraud and malwareDetection in google play,” IEEE Transactions on Knowledge & Data Engineering, vol. 29, no. 6, pp. 1329–1342, 2017. [Google Scholar]
15. N. Abu-El-Rub, A. Minnich and A. Mueen, “Anomalous reviews owing to referral incentive,” in Proc. Advances in Social Networks Analysis and Mining, Sydney, Australia, pp. 313–316, 2017. [Google Scholar]
16. A. A. Damaini and G. S. Nugroho, “Fraud crime mitigation of mobile application users for online transportation,” International Journal of Interactive Mobile Technologies, vol. 12, no. 3, pp. 153–167, 2014. [Google Scholar]
17. S. Seneviratne, A. Seneviratne, M. A. Kaafar, A. Mahanti and P. Mohapatra, “Early detection of spam mobile apps,” in Proc. World Wide Web, Florence, Italy, pp. 949–959, 2015. [Google Scholar]
18. H. Zhu, H. Xiong, Y. Ge and E. Chen, “Ranking fraud detection for mobile apps: a holistic view,” in Proc. Information & Knowledge Management, San Francisco, California, USA, pp. 619–628, 2013. [Google Scholar]
19. V. Sandulescu and M. Ester, “Detecting singleton review spammers using semantic similarity,” in Proc. World Wide Web, Florence Italy, pp. 971–976, 2015. [Google Scholar]
20. D. Arp, M. Spreitzenbarth, M. Hubner, H. Gascon, K. Rieck et al., “Drebin: effective and explainable detection of android malware in your pocket,” in Proc. Network and Distributed System Security, San Diego, California, USA, pp. 23–26, 2014. [Google Scholar]
21. B. Fu, J. Lin, L. Li, C. Faloutsos, J. Hong et al., “Why people hate your app: making sense of user feedback in a mobile app store,” in Proc. Knowledge Discovery and Data Mining, Chicago, USA, pp. 1276–1284, 2013. [Google Scholar]
22. R. Ghai, S. Kumar and A. C. Pandey, “Spam detection using rating and review processing method,” In Smart Innovations in Communication and Computational Sciences, 1st ed., vol. 670, Singapore, Springer, pp. 189–198, 2019. [Google Scholar]
23. C. Gao, J. Zeng, M. R. Lyu and I. King, “Online app review analysis for identifying emerging issues,” in Proc. Int. Conf. on Software Engineering, New York, NY, USA, pp. 48–58, 2018. [Google Scholar]
24. W. Maalej and H. Nabil, “Bug report, feature request, or simply praise? on automatically classifying app reviews,” in Proc. Requirements Engineering Conf., Ottawa, ON, CA, pp. 116–125, 2015. [Google Scholar]
25. E. Platzer, “Opportunities of automated motive-based user review analysis in the context of mobile app acceptance,” in Proc. Information and Intelligent Systems, Varazdin, Croatia, pp. 309, 2011. [Google Scholar]
26. M. Khalid, M. Asif and U. Shehzaib, “Towards improving the quality of mobile app reviews,” International Journal of Information Technology and Computer Science, vol. 7, no. 10, pp. 35–41, 2015. [Google Scholar]
27. R. Vasa, L. Hoon, K. Mouzakis and A. Noguchi, “A preliminary analysis of mobile app user reviews,” in Proc. Australian Computer-Human Interaction Conference, Melbourne, Australia, pp. 241–244, 2012. [Google Scholar]
28. S. Mujahid, G. Sierra, R. Abdalkareem, E. Shihab and W. Shang, “Examining user complaints of wearable apps: a case study on android wear,” in Proc. Mobile Software Engineering and Systems, Buenos Aires, Argentina, pp. 96–99, 2017. [Google Scholar]
29. S. Xie, G. Wang, S. Lin and P. S. Yu, “Review spam detection via temporal pattern discovery,” in Proc. Knowledge Discovery and Data Mining, New York, NY, USA, pp. 823–831, 2012. [Google Scholar]
30. R. J. May, H. R. Maier and G. C. Dandy, “Data splitting for artificial neural networks using SOM-based stratified sampling,” Neural Networks, vol. 23, pp. 283–294, 2010. [Google Scholar]
31. K. Shu, A. Sliva, S. Wang, J. Tang and H. Liu, “Fake news detection on social media: A data mining perspective,” ACM Special Interest Group on Knowledge Discovery in Data, vol. 19, no. 1, pp. 22–36, 2017. [Google Scholar]
32. B. Gaska, C. Gniady and M. Surdeanu, “MLStar: machine learning in energy profile estimation of android apps,” in Proc. Mobile and Ubiquitous Systems: Computing, Networking and Services, New York, NY, USA, pp. 216–225, 2018. [Google Scholar]
33. D. Monett and H. Stolte, “Predicting star ratings based on annotated reviews of mobile apps,” in Proc. Federated Conf. on Computer Science and Information Systems, Gdansk, Poland, pp. 421–428, 2016. [Google Scholar]
 | This work is licensed under a Creative Commons Attribution 4.0 International License, which permits unrestricted use, distribution, and reproduction in any medium, provided the original work is properly cited. |