DOI:10.32604/iasc.2022.021946
| Intelligent Automation & Soft Computing DOI:10.32604/iasc.2022.021946 | |
| Article |
Energy Aware Seagull Optimization-Based Unequal Clustering Technique in WSN Communication
1Department of Computer Science and Engineering, Panimalar Engineering College, Chennai, 600 123, India
2Department of Computer Science and Engineering, Vel Tech Rangarajan Dr. Sagunthala R&D Institute of Science and Technology, Chennai, 600 062, India
3Department of Mechanical Engineering, Vignan’s Foundation for Science Technology and Research, Guntur, 522213, India
4Department of Computer Science and Engineering, SRM Institute of Science and Technology, Ramapuram, Chennai, 600 089, India
5Department of Electronics and Communication Engineering, Arya College of Engineering and Information Technology, Jaipur, 302 028, India
6Department of Electronics and Communication Engineering, Aarupadai Veedu Institute of Technology, Vinayaka Mission’s Research Foundation, Paiyanoor, 603 104, India
*Corresponding Author: D. Anuradha. Email: anuradhad2680@gmail.com
Received: 21 July 2021; Accepted: 02 September 2021
Abstract: Wireless sensor network (WSN) becomes a hot research area owing to an extensive set of applications. In order to accomplish energy efficiency in WSN, most of the earlier works have focused on the clustering process which enables to elect CHs and organize unequal clusters. However, the clustering process results in hot spot problem and can be addressed by the use of unequal clustering techniques, which enables to construct of clusters of unequal sizes to equalize the energy dissipation in the WSN. Unequal clustering can be formulated as an NP-hard issue and can be solved by metaheuristic optimization algorithms. With this motivation, this paper presents a novel seagull optimization (SGO) based unequal clustering (SGOBUC) model to attain energy efficiency in WSN. The SGO algorithm is mainly inspired by the migrating and attacking behaviour of seagulls. They are formulated in a mathematical way and designed to highlight exploration as well as exploitation in a provided searching area. The SGOBUC technique derives a fitness involving different parameters in such a way that energy efficiency can be accomplished. A comprehensive simulation analysis takes place to showcase the enhanced outcomes of the SGOBUC technique. The simulation outcomes highlighted the betterment of the SGOBUC technique over the recent techniques interms of different dimensions.
Keywords: Wireless communication; wsn; energy efficiency; seagull optimization; unequal clustering; hot spot problem
Wireless Sensor Networks (WSN) is a type of self-configurable network which comprises of a massive number of compact sensor nodes. The sensors out the data transmission amongst themselves in the communication range and are deployed to recognize, sense, and observe the physical parameters exist in the real-time platform [1]. WSN composed of a limitless amount of sensors which could observe the region and interact with each other or to external BS transceiver. The optimal feature of this WSN includes low cost, small size, multifunctional (could carry out routing, sensing, data processing, and so on.), easy communication within short distances, and low computation power. In harsh environment, it is hard to recharge the power source of the sensors [2,3]. But many techniques and research works are conducted to preserve energy in sensor nodes for extending the lifespan of network [4]. Reliable data transfer, extended network lifespan, scalability, and energy preservation in sensors are the essential needs for WSN applications. Due to various limitations in the sensor nodes, WSN possessing many problems like network lifetime, coverage area, data aggregation, and scheduling. WSN nodes utilize excessive amount of energy for transmission and the needed energy based on battery power for transmitting the packets would vary amongst the communications regarding the distance among the receiver and sender nodes; hence the multihop transmission is suggested [5]. Data transmission through hierarchical routing rises the WSN lifespan by grouping several nodes to the cluster. Later, a head node is chosen for all the clusters are called as cluster head (CH) for collecting the data from its cluster member (CM) and transfer to the BS with a minimal cost of multi-hop communication. Fig. 1 shows the outline of unequal clustering in WSN.
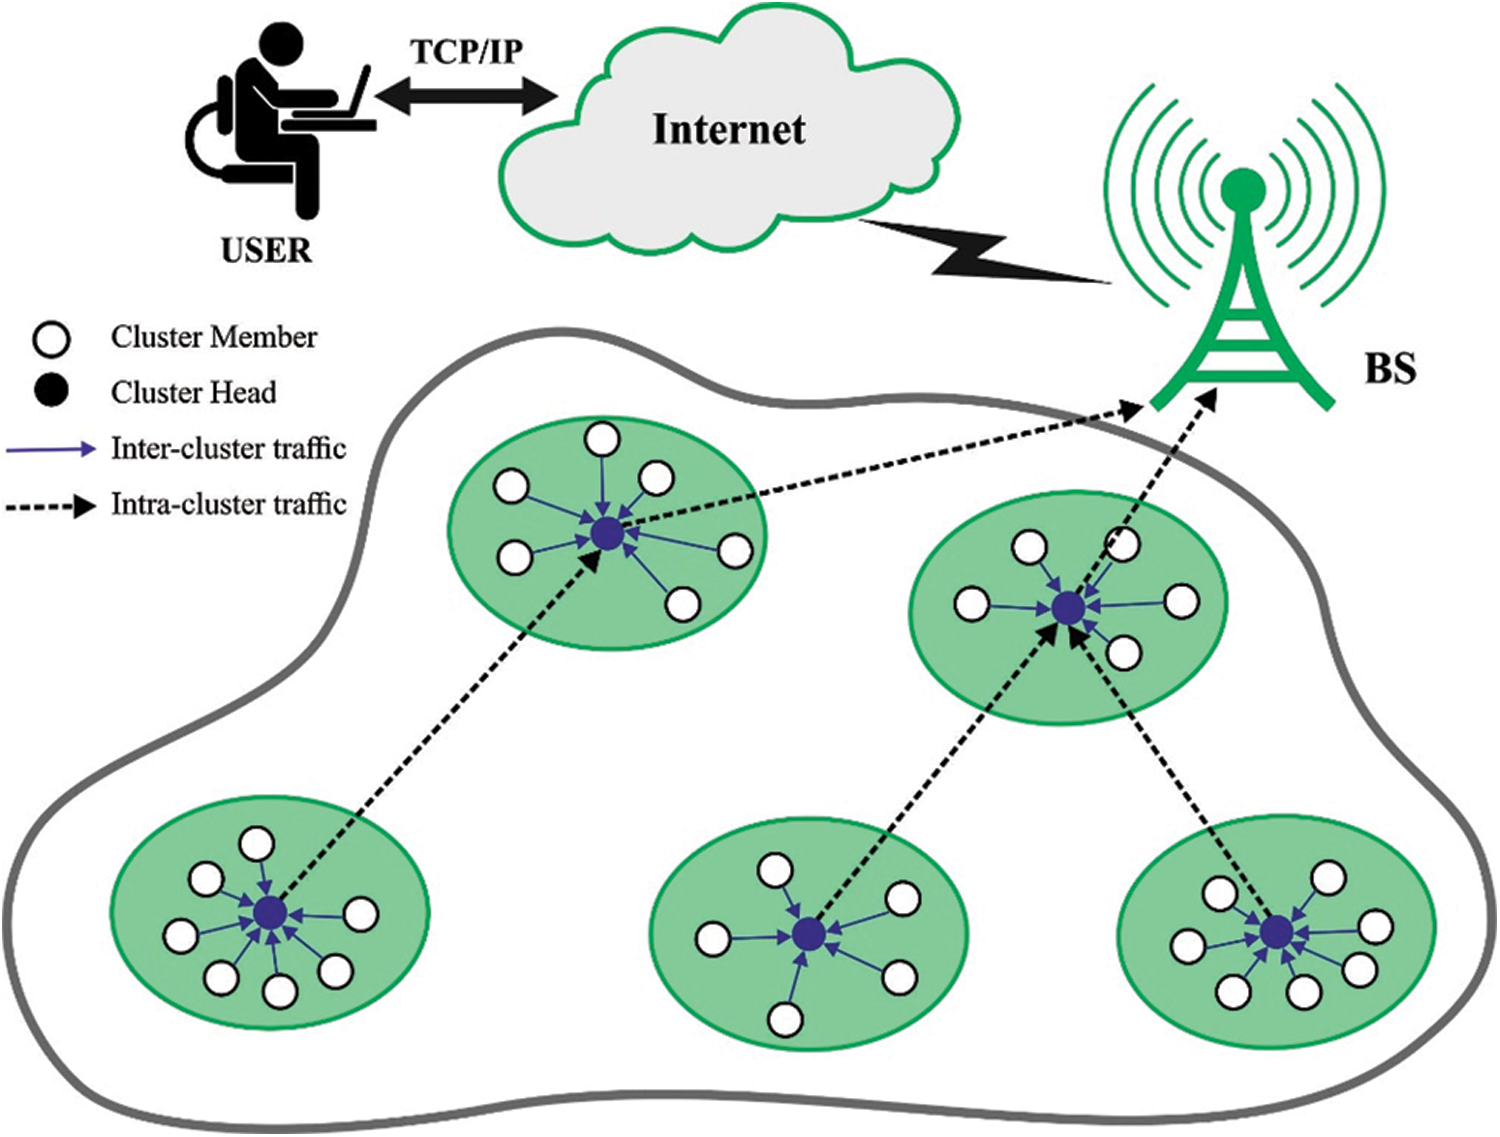
Figure 1: Overview of unequal clustering in WSN
Clustering and unequal clustering methods were utilized for the energy effective WSN. The clusters in WSN are produced by organizing the sensors in distinct sets. Each node in the divided region is chosen as a CH, which gathers data from the CMs [6,7]. The energy utilization of the CHs nearby the BS is exceeding the CHs far from the BS. It implies CHs near to the BS are burdened with more traffic load owing to the intracluster traffic from its data aggregation, CMs, and intercluster traffic from other CHs for transmitting data to the BS [8]. It interrupts the network connection, and the clusters near the BS create connectivity problems that are named hot spot problems [9]. The unequal clustering method is the effective method for handling hot spot issues since it could be utilized for load balancing amongst the CHs [10].
Unequal clustering organizes the clusters based on the sizes where the sizes gets decreased nearer to the BS. It implies that the cluster sizes are equivalent to the intercluster distance. A small cluster nearby the BS represents a small amount of CMs and lesser intracluster traffic [11]. Thus, the small clusters could pay considerable attention to intercluster traffic, and the CH doesn’t exhaust energy more rapidly. When the DBS is high, then, the cluster size also gets increased. When the group holds an essential amount of CMs, they would expend high energy on intracluster traffic. Since the cluster becomes far away from the BS, they hold lesser intercluster traffic and don’t have to spend extra energy on intercluster routing [12]. Unequal clustering enforces each CH to expend similar quantity of energy utilization, and hence the CHs nearby the BS and the CHs far away from the BS spend equivalent amounts of energy. Also, the cluster construction procedure might create 2 level hierarchies with lower and higher levels [13,14]. The CHs create the high-level cluster, and the CMs creates the low-level cluster. The sensors regularly transfer the data to the respective CHs. The CH carries out data aggregation of each data attained from the CM and forwards the aggregated data to the BS through single/multi-hops. The CH has the data of its CMs like energy level, node id, and position. If a node moves/dies to other clusters, the modifications are instantly recorded and the CH notifies the BS, and re-clustering takes place to preserve the network topology efficiently. The amount of transmission and the overall network load gets decreased considerably.
To resolve the hot spot problem in WSN, this paper designs a new seagull optimization (SGO) based on unequal clustering (SGOBUC) technique to accomplish energy efficiency and maximum lifetime. The SGOBUC technique aims to construct clusters of unequal sizes and elect proper set of CHs. In addition, the SGOBUC technique involves three phases namely initialization phase, neighboring data collection phase, and finally, cluster construction phase. The SGOBUC technique constructs clusters based on a fitness function involving different input parameters. The application of unequal clustering technique assists to uniformly balance the energy dissipation throughout the network. An Wireless Sensor Networks (WSN) that self-configures, making use of less infrastructure, and is deployed via wireless sensor networks is referred to as a WSN. When you utilize a sink or base station, you are establishing an interface with the network. Injecting queries and receiving results from the sink allow one to access necessary information from the network. Sensor networks can range from hundreds of thousands of sensor nodes to millions of sensor nodes. They can communicate via radio signals, which enables them to monitor each other. An Internet of Things sensor node has a radio transceiver, a power supply, and sensing and processing components.
Guleria et al. [15] proposed a new unequal clustering technique using ant colony optimization algorithm. The fusion of data from the CHs to the intermediary node is known as Rendezvous node which decreases the packet broadcasts and therefore the energy spent by the nodes is minimal. The neighbour discovery stage and the link maintenance via ACO method chooses optimum paths among the nodes rises the packet delivered to the end. The estimation of the optimum paths and the CH election utilizing ACO algorithm and unequal clustering decreased the energy utilization efficiency. Arikumar et al. [16] proposed an EELTM method that utilizes smart approaches like PSO and FIS. Moreover, they proposed an optimum CH–CR selection technique in this method utilizes the fitness values evaluated by the PSO method to define 2 optimum nodes in all the clusters for performing CH and CR. The chosen CH completely collects the data from its CM, while the CR is responsible for getting the collected data from the CH and transmitting to the BS. Moussa et al. [17] proposed an ECRP-UCA method, which splits the network into unequal clusters on the basis of distance to BS, neighboring node count, RE, and a novel variable called amount of backward relay nodes in an earlier rounds to appropriately manage the load between CHs. Also, they proposed a batch-based clustering technique which permits the WSN to operate various iterations with no control overhead to configure it. Rao et al. [18], proposed CSO based method, also known as CSO-UCRA. Firstly, the CH selection method was introduced that depends on CSO based method, then allocates the non-CH sensor nodes to CHs on the basis of elected CH proficiency function. Lastly, a CSO-based routing method was introduced. Effective particle encoding systems and new FF were established for this method.
Pan et al. [19] proposed a new optimization method such as cBA, for using the class of optimization issues comprising devices that have constrained hardware resources. A real-valued prototype vector is utilized in the probabilistic operation to generate candidate solutions of cBA optimization. Anand et al. [20] proposed a method to improve lifespan of networks with the help of PSO based clustering and Harmony Search (HS) based routing technique in WSN. Here, the global optimum CH are chosen and gateway nodes are presented for reducing energy utilization of the CH when transmitting accumulated data to the BS. Then, the HS based local searching approach detects an optimal routes for gateway node to the BS. In Sefati et al. [21], the optimized black hole method is applied for selecting an optimum CH from the sensors. The choice of CHs can be optimized using distance, free buffer of nodes, and remaining energy level. The route from the CHs to BS are recognized with the help of ACO method.
Zhu et al. [22] proposed an energy effective routing protocol that adapts unequal clustering techniques for solving the hot spot problems and proposed double CH approach for reducing the energy utilization of CHs in the cluster. Additionally, to uniformly manage the energy utilization among CMs and CHs, a hybridized CH rotation approach depends on energy driven and time driven is projected that could create the timing of rotation highly moderate and the energy utilization highly effective. Arjunan et al. [23] present an method called FL based unequal clustering, ACO based Routing, and Hybrid protocol for WSN to remove hot spot problems and also enlarged the lifespan of network. This process includes cluster maintenance, CH selection, and intercluster routing. The FL selects CH effectively and partitions the network into unequal clusters on the basis of DBS, RE, node centrality, distance to its neighbours, and node degree. It utilizes ACO based routing method for reliable and effective intercluster routing from CH to BS.
Consider an unequal clustering in WSN with several nodes effectively to organize the sensors, balances load distribution and avoids hot spot issue [24]. But, the equal clustering method frequently has cluster size i.e., the similar over the network. Indeed, in unequal clustering, the size of the cluster is established on the basis of DBS. The cluster size is shorter in case of smaller DBS and the size gets increased with a rise in DBS. The wireless radio transceiver in the network is based on distinct variables, for example, distance and energy utilization. The description is interrelated to the energy utilization and the communication range of the nodes. The distance among the receiver and transmitter followed on the reduced trans-receiving power exponentially reduces with increased distance. A threshold splits the multipath and free space models. Fig. 2 illustrates the first order radio energy model.
Whereas ε_fs, ε_mp denotes power loss for free space and multipath modules, correspondingly, and d_0 denotes a threshold of space module. The broadcasting l bits for energy spent on distance d is expressed by:
Whereas E denotes the power utilization of the node, Tx indicates broadcasting subscript elec, amp indicates electronic, and amplify for modulating, digital coding, spreading signal, and filtering. The energy utilization for getting the messages could be formulated by:
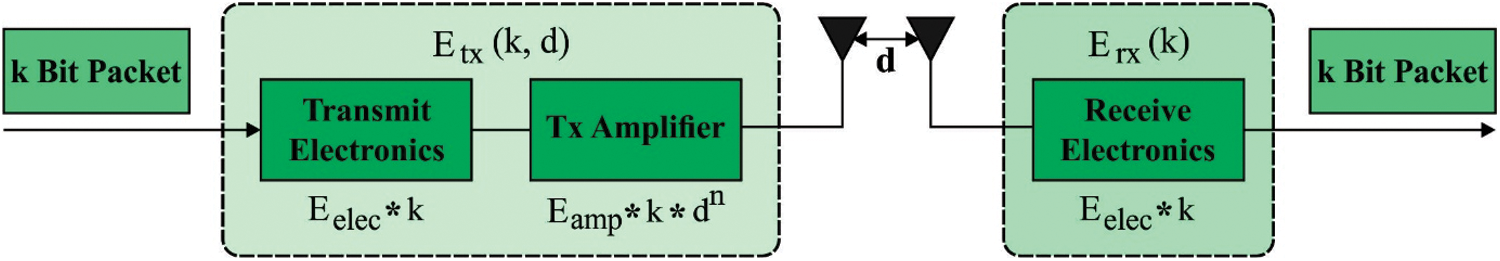
Figure 2: First order radio energy Model
WSN considered a set of N nodes in the 2D region of M
Whereas N/k−1 denotes the average CMs in a cluster. E_CH and E_members indicates the dissipated spent for CH and CMs. The estimated energy consumption for the CHs and CMs are given in Eqs. (6) and (7).
The overall expended energy for a WSN can be expressed from the power transceiver and energy procedure as:
Whereas E_p denotes the power utilization of the microcontroller. It doesn’t affect the optimizing procedures. Therefore, the power utilization of E_frame optimized is depends only on distance for the cluster optimization.
4 The Proposed SGOBUC Technique
The workflow involved in the SGOBUC technique is exhibited in Fig. 3. The SGOBUC technique involves three phases namely initialization phase, neighboring data collection phase, and finally, cluster construction phase. At first, the nodes are arbitrarily placed in the WSN and are initialized together. Then, the information about the neighboring nodes is fathered in the network. Followed by, the SGOBUC technique gets executed to optimally choose CHs and cluster sizes. Finally, data transmission process takes place from CMs to BS via the chosen CHs.
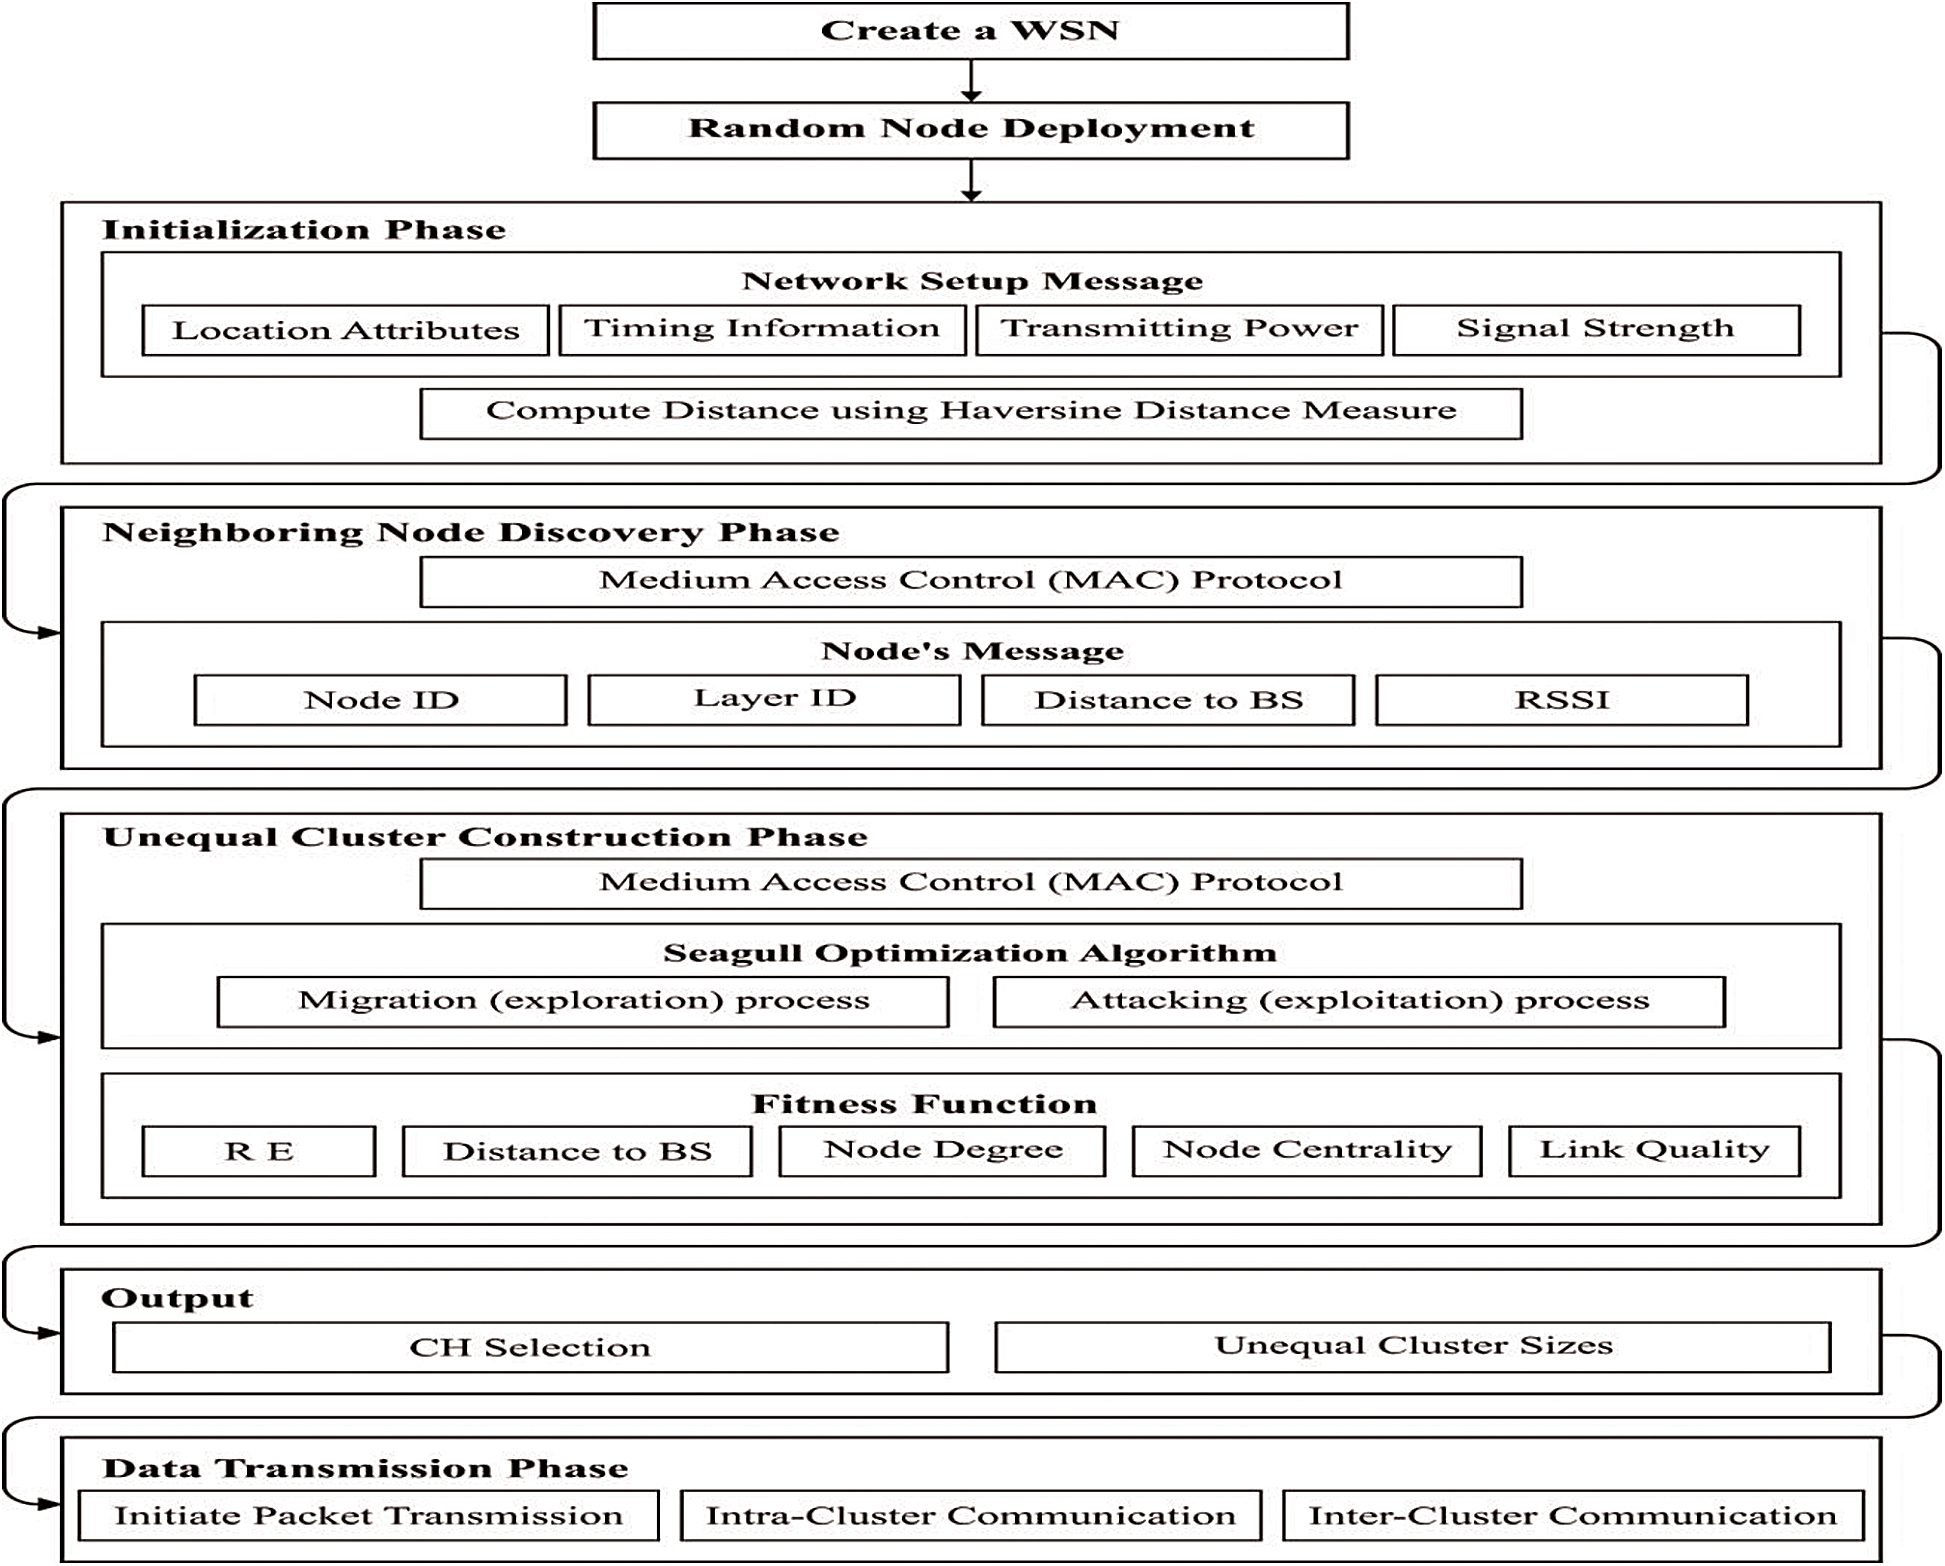
Figure 3: Overall process of proposed model
The BS in the WSN starts the network setup message using the timing information, location details, broadcasting signal strength, and power. The node existing in the network calculates its distance from the BS according to the Haversine distance equation. The position of the nodes can be anticipated by the analyses of signals received and transmitted. The Global Positioning System (GPS) discovers the node position by gathering the longitude and latitude data. The latitude data from the GPS is presented in seconds, degrees and minutes as given below:
The main concept of the Haversine performance is that the earth is in sphere shape instead of ellipse. The numerical formulation of Haversine distance calculation is given below,
Whereas ∂ —distance, dlt, dlg—Deviation values of longitude and latitude, αn,—Nodes latitude data, and αreq—requested latitude data. The distance calculation from the coordinates (11) is arithmetically given by,
Whereas R—Radius of the earth. The energy utilization of the hops near the BS rises to the maximal level. Hence the amount of packet communication between the nodes rise and entire efficiency of the WSN reduces.
4.2 Neighboring Data Collection Phase
The node exploits the Medium Access Control (MAC) protocol for finding the nearby nodes. Initially, the node transmits its information to the network via the node details message which contains Node_ID, layer_ID, distance to BS, and RSSI. Because of the non-functioning of nodes and link failures, the neighbour node manually alters on the basis of network topology. In order to create the presented method as dynamic to node failures, this stage is continued on the particular amount of simulations. The node termination is because the energy consumption creates the neighbour finding stage to be repeated and thus the packet transmission gets increased.
4.3 Unequal Cluster Construction Phase
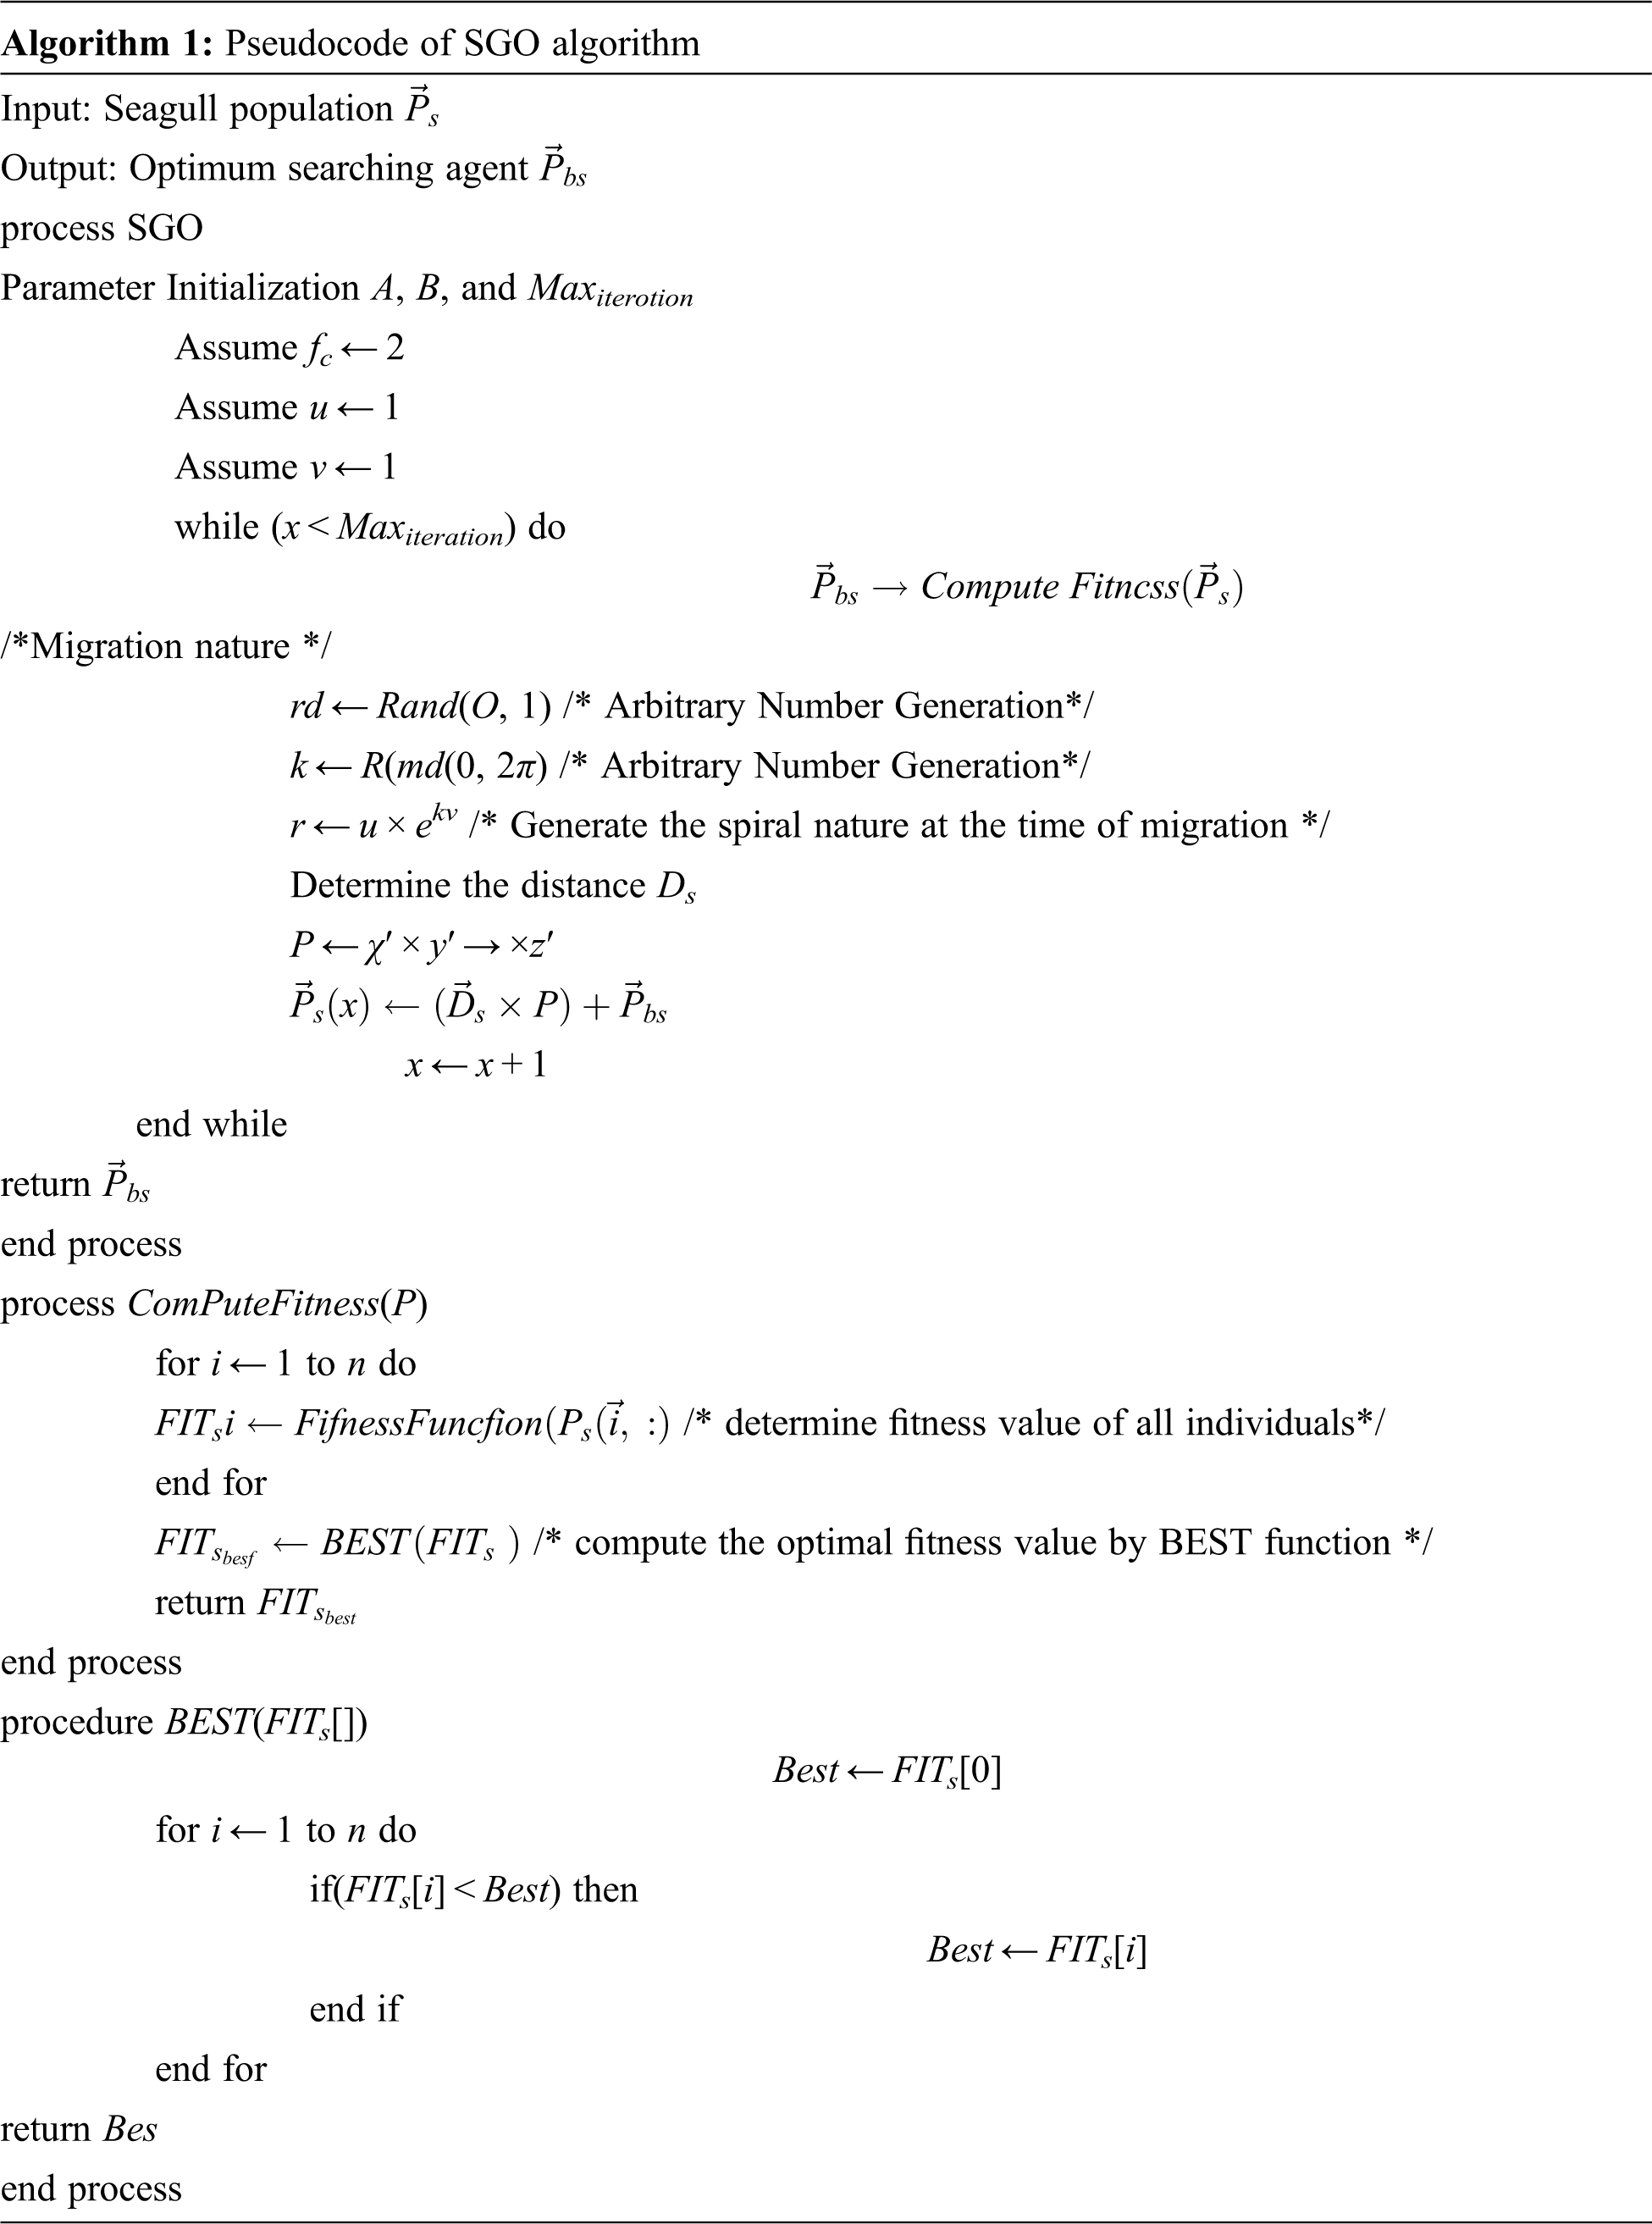
Once the sensor nodes gathered the information, the SGOBUC technique gets executed to elect CHs and cluster sizes. Seagull perform migration process, where they migrate from one position to other for finding most abundant and richest food sources that would provide sufficient energy. Such behaviors are given in the following section:
a) At the time of migration, they move within a group. The early position of seagulls is distinct to evade the collisions among them.
b) With their groups, they move in the course of optimal survival fittest seagull, viz., when a fitness value is lower than others.
c) According to the fittest seagull, another seagull could upgrade their early position.
They often attacks migrating birds on the ocean while migrating from one position to other. It could create their spiral natural shape motion at the time of attacking. Such behaviours are related to the objective function to be optimized. This can enable to development of a novel optimization method. This study emphases on 2 natural behaviours of the seagull. The mathematical model of migrating and prey attacking processes are mentioned below. At the time of migration, this method inspires the way that the seagulls travel from one place to other. A seagull must fulfil 3 criteria as given below:
In order to evade the collision among neighboring ones (viz., another seagull), a further parameter A is applied for calculating novel searching agent location.
Whereas
where
Afterward evading the collision among neighboring ones, the searching agent is traveling in the direction of optimal neighbor.
Whereas
Whereas rd denotes an arbitrary amount in the range of zero & one. Finally, the searching agent could upgrade its location regarding optimal searching agent.
In which
These behaviors in, y, and z plane is given below.
Whereas r denotes the radius of every turn of the spiral, k indicates an arbitrary amount in range [0 ≤ k ≤ 2π]. u and v represent constant to determine the spiral shape. The upgraded location of searching agent is evaluated by Eqs. (17)–(21).
where
(1) Link Quality (
The initial level, all the nodes are allocated to LQ value of one. The LQ of nodes are demonstrated in Eq. (23):
(2) Distance(Dx) of nx
The distance of sensors to their adjacent nodes are signified as
(3) Degree (Degx) of nx
At time t, the amount of adjacent nodes, for instance, the node degree is signified as:
where N(x) = {ny/dist(x, y) < transrange} x ≠ y, and dist(x, y) signifies the distance amongst 2 nodes nx and ny, transrange refers the coverage area.
(4) Residual energy (RE)
The RE of sensors on broadcast of k bit data to node
where E signifies the present energy level of nodes, ET implies the energy spent for transferring data.
where Ee refers the energy of electrons and Ea implies the required amplified energy,
(5) Node centrality Nc
The centrality of the node Nc is defined below:
(it, jt) and (it, jt, jt−1) represents the coordinates at the time t and t − 1 correspondingly.
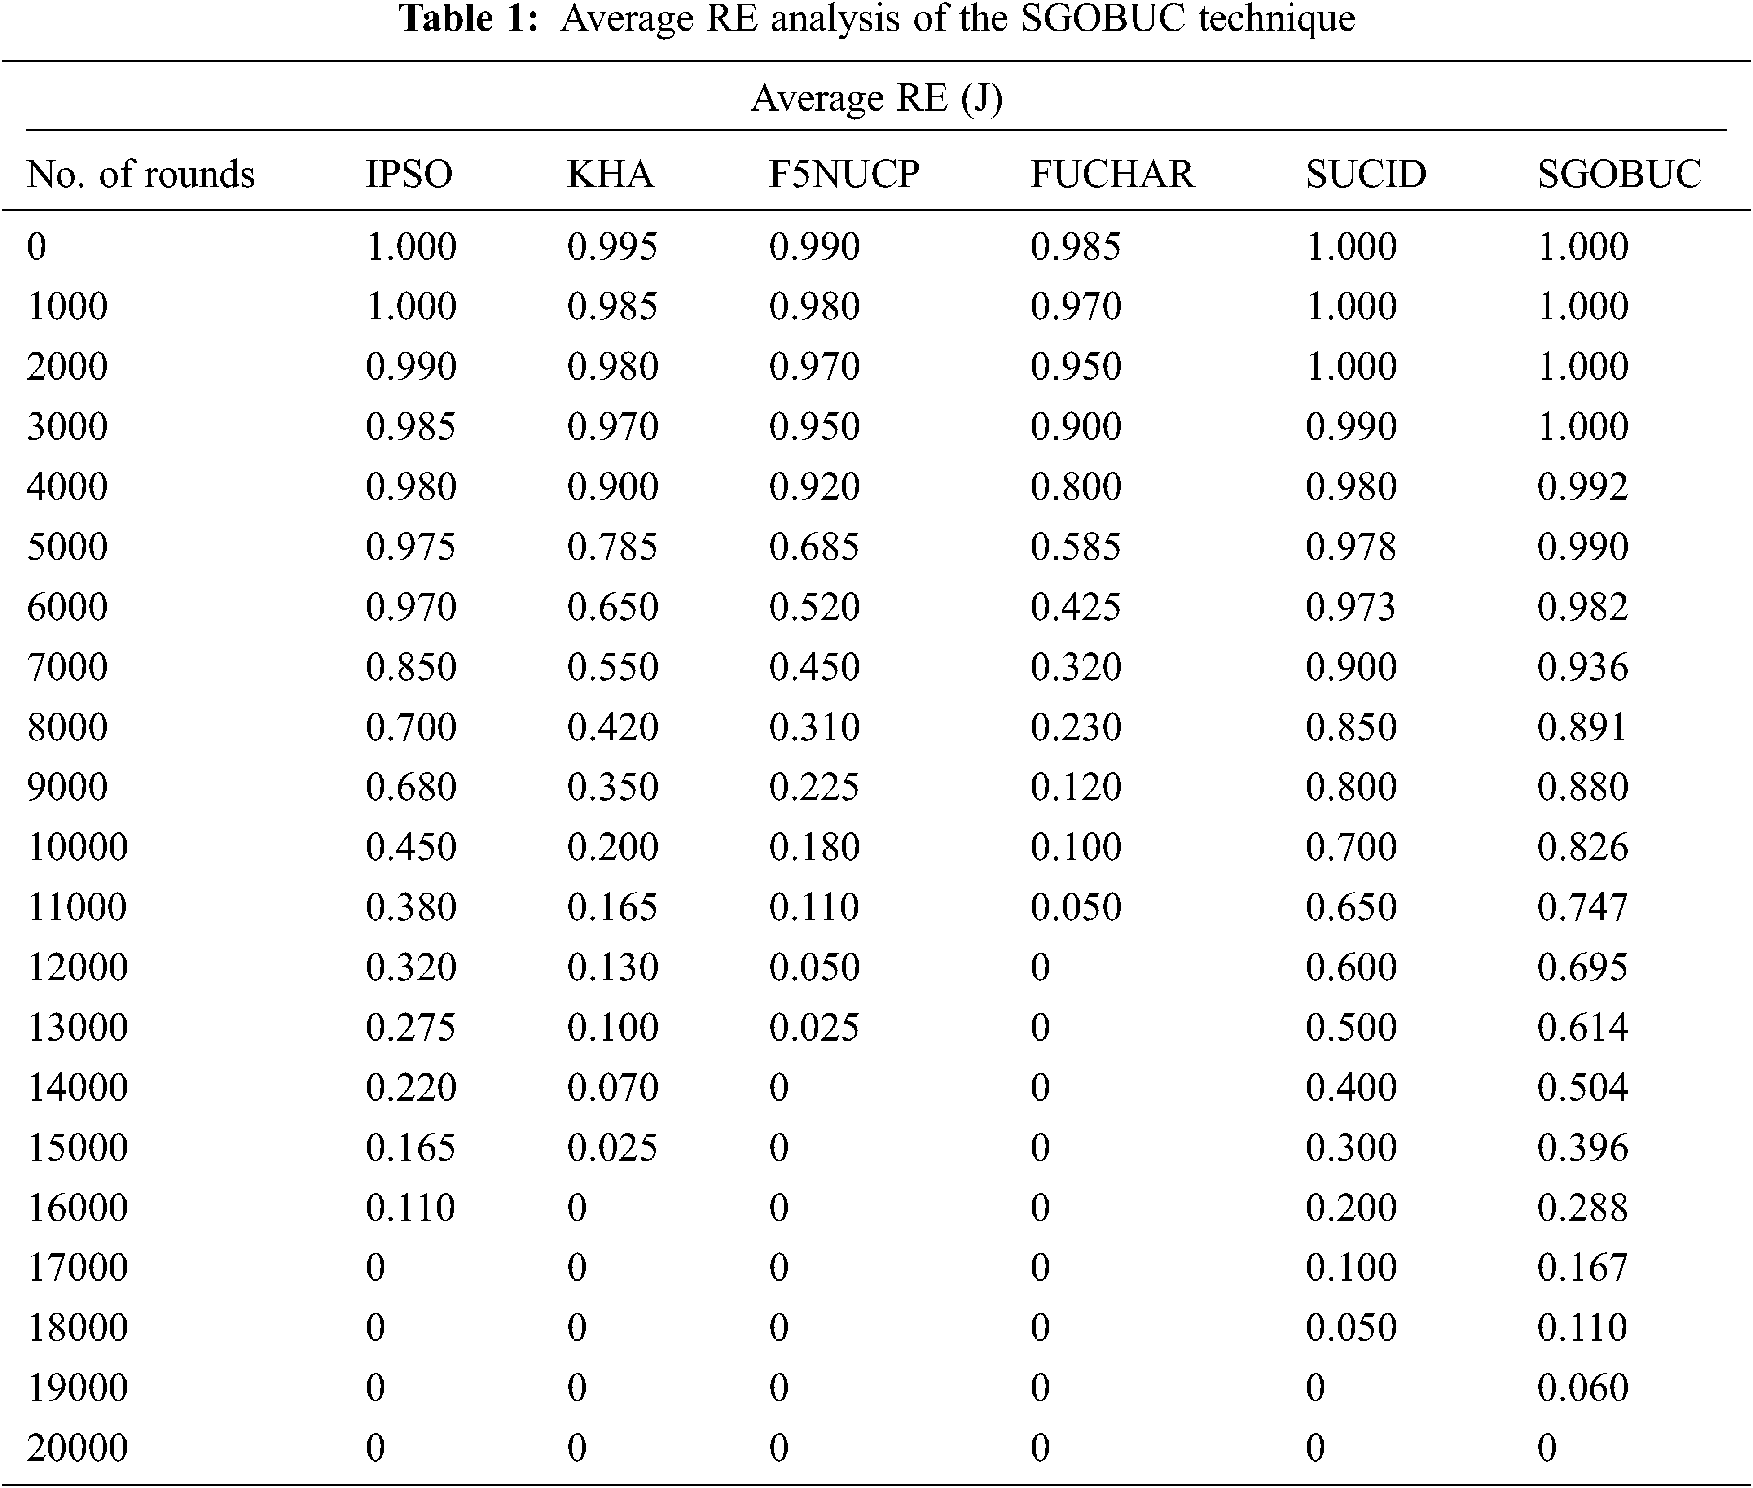
The proposed model is simulated using MATLAB tool. The results are examined interms of different measures namely average RE, average delay, packet delivery ratio (PDR), number of alive nodes, and network lifetime. Tab. 1 and Fig. 4 exhibits the average RE analysis of the SGOBUC technique with other existing techniques. From the obtained results, it is obvious that the SGOBUC technique has gained maximum average RE over the other existing techniques. For instance, with round 5000, the SGOBUC technique has offered a higher average RE of 0.990 J whereas the IPSO, KHA, F5NUCP, FUCHAR, and SUCID techniques have obtained a lower average RE of 0.975 J, 0.785 J, 0.685 J, 0.585 J, and 0.978 J respectively. Likewise, with round 10000, the SGOBUC manner has offered a superior average RE of 0.826 J whereas the IPSO, KHA, F5NUCP, FUCHAR, and SUCID methods have gained a lesser average RE of 0.450 J, 0.200 J, 0.180 J, 0.100 J, and 0.700 J correspondingly. On continuing with, with round 15000, the SGOBUC algorithm has obtainable an improved average RE of 0.396 J whereas the IPSO, KHA, F5NUCP, FUCHAR, and SUCID methodologies have achieved a minimum average RE of 0.165 J, 0.025 J, 0 J, 0 J, and 0.300 J correspondingly. Lastly, with round 19000, the SGOBUC technique has offered a superior average RE of 0.060 J whereas the IPSO, KHA, F5NUCP, FUCHAR, and SUCID approaches have attained a lower average RE of 0 J correspondingly.
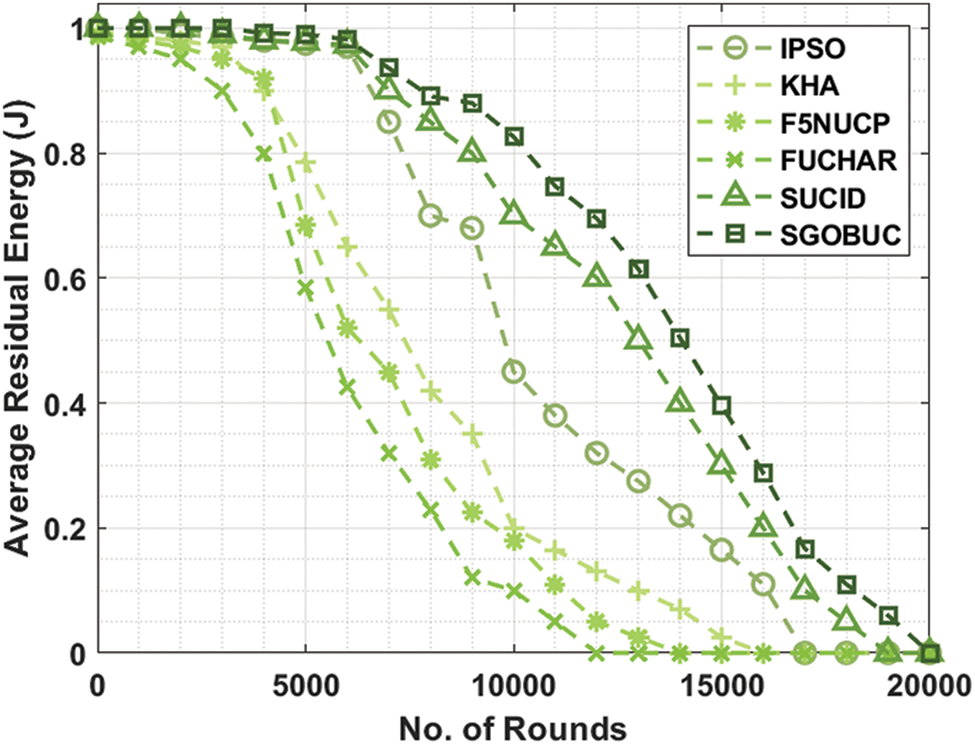
Figure 4: Average RE analysis of SGOBUC model
A brief average delay analysis of the SGOBUC technique with other existing techniques takes place in Tab. 2 and Fig. 5. From the obtained results, it is reported that the SGOBUC technique has shown effectual outcomes with the least average delay under distinct node count. For example, under 100 nodes, the SGOBUC technique has offered a minimal average delay of 86 ms whereas the IPSO, KHA, F5NUCP, FUCHAR, and SUCID techniques have attained a maximum average delay of 135 ms, 127 ms, 110 ms, 97 ms, and 90 ms respectively. Meanwhile, under 400 nodes, the SGOBUC approach has offered a minimum average delay of 115 ms whereas the IPSO, KHA, F5NUCP, FUCHAR, and SUCID methods have gained an improved average delay of 160 ms, 155 ms, 147 ms, 130 ms, and 118 ms correspondingly. Eventually, under 800 nodes, the SGOBUC approach has accessible a lesser average delay of 149 ms whereas the IPSO, KHA, F5NUCP, FUCHAR, and SUCID methodologies have obtained an improved average delay of 225 ms, 205 ms, 194 ms, 160 ms, and 152 ms correspondingly. At last, under 1000 nodes, the SGOBUC technique has offered a minimal average delay of 151 ms whereas the IPSO, KHA, F5NUCP, FUCHAR, and SUCID methods have obtained a maximal average delay of 243 ms, 215 ms, 199 ms, 165 ms, and 158 ms correspondingly.
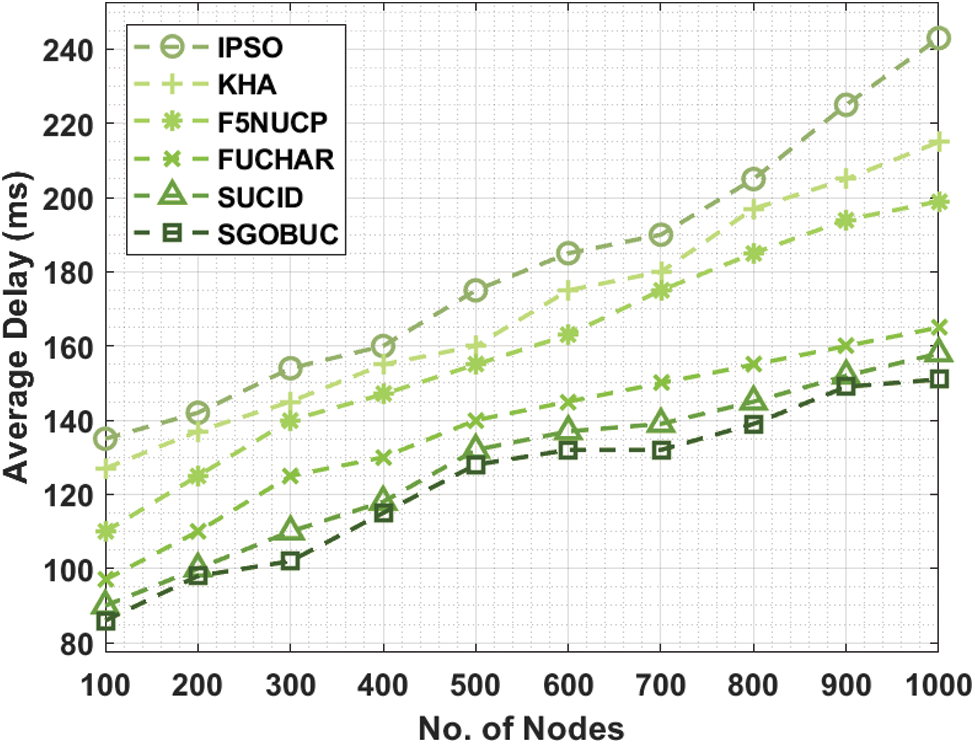
Figure 5: Average delay analysis of SGOBUC model under different nodes

Tab. 3 and Fig. 6 depict the PDR analysis of the SGOBUC approach with other existing methods. From the attained outcomes, it can be clear that the SGOBUC method has attained maximal PDR over the other existing methods. For instance, with round 100, the SGOBUC manner has offered a superior PDR of 0.9850% whereas the IPSO, KHA, F5NUCP, FUCHAR, and SUCID manners have obtained a lower PDR of 0.8000%, 0.8540%, 0.8700%, 0.9000%, and 0.9700%.
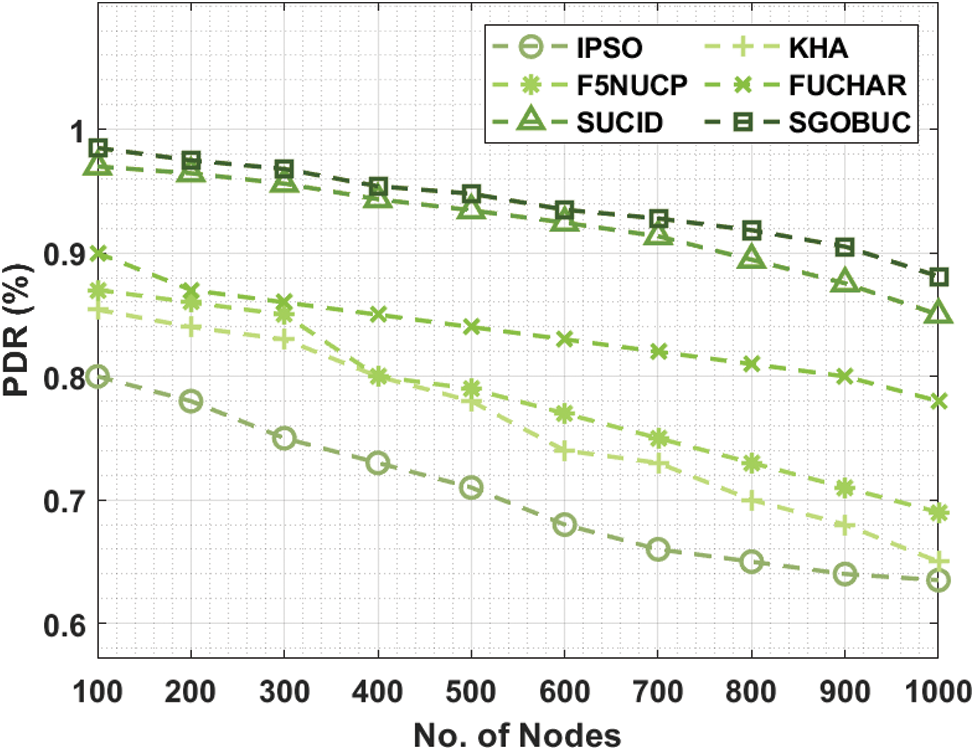
Figure 6: PDR analysis of SGOBUC model under number of nodes

Also, with round 400, the SGOBUC algorithm has offered a higher PDR of 0.9540% whereas the IPSO, KHA, F5NUCP, FUCHAR, and SUCID techniques have obtained a lower PDR of 0.7300%, 0.8000%, 0.8000%, 0.8500%, and 0.9435% correspondingly. Along with that, with round 700, the SGOBUC method has existing an improved PDR of 0.9279% whereas the IPSO, KHA, F5NUCP, FUCHAR, and SUCID methods have reached a least PDR of 0.6600%, 0.7300%, 0.7500%, 0.8200%, and 0.9135% correspondingly. Eventually, with round 1000, the SGOBUC technique has offered a higher PDR of 0.8810% whereas the IPSO, KHA, F5NUCP, FUCHAR, and SUCID methodologies have reached a minimum PDR of 0.6350%, 0.6500%, 0.6900%, 0.7800%, and 0.8500% correspondingly.
Fig. 7 exhibits the Number of alive nodes (NAN) analysis of the SGOBUC algorithm with other recent manners. From the attained outcomes, it can be revealed that the SGOBUC technique has gained maximal NAN over the other existing techniques. For sample, with round 1000, the SGOBUC method has offered an improved superior NAN of 1000 whereas the IPSO, KHA, F5NUCP, FUCHAR, and SUCID techniques have reached a minimum NAN of 1000, 985, 980, 970, and 1000 correspondingly. Next, with round 10000, the SGOBUC method has existed an increased NAN of 731 whereas the IPSO, KHA, F5NUCP, FUCHAR, and SUCID techniques have obtained a least NAN of 450, 200, 180, 100, and 700 respectively. At the same time, with round 15000, the SGOBUC algorithm has offered an improved NAN of 392 whereas the IPSO, KHA, F5NUCP, FUCHAR, and SUCID techniques have attained a minimal NAN of 165, 25, 0, 0, and 300 correspondingly. Finally, with round 19000, the SGOBUC methodology has obtainable a superior NAN of 37 whereas the IPSO, KHA, F5NUCP, FUCHAR, and SUCID techniques have gained a lesser NAN of 0 correspondingly.
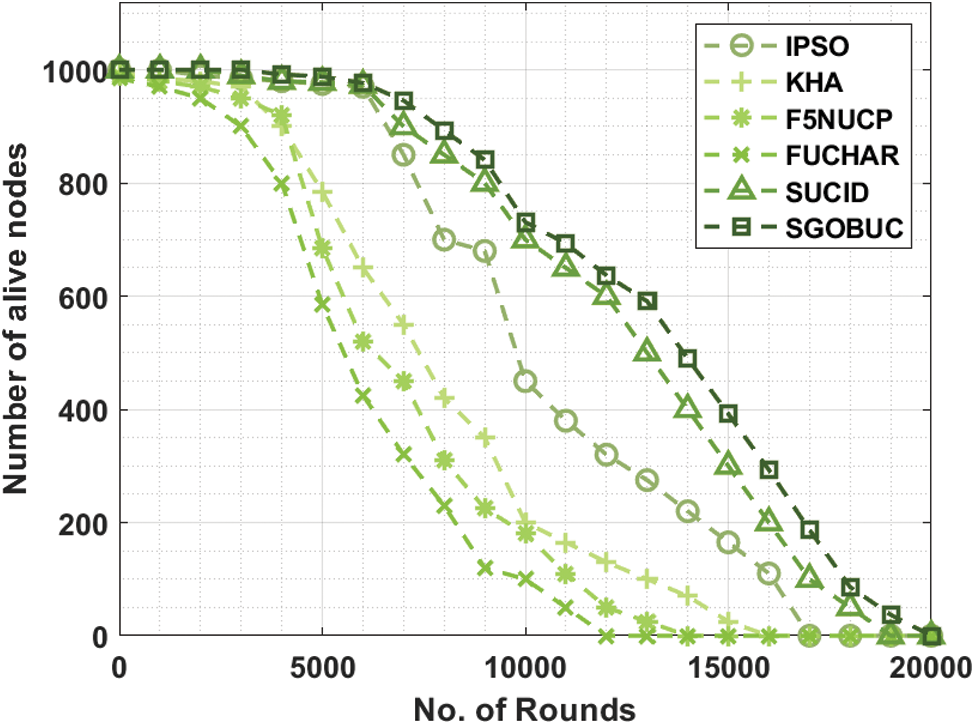
Figure 7: NAN analysis of SGOBUC model under distinct nodes
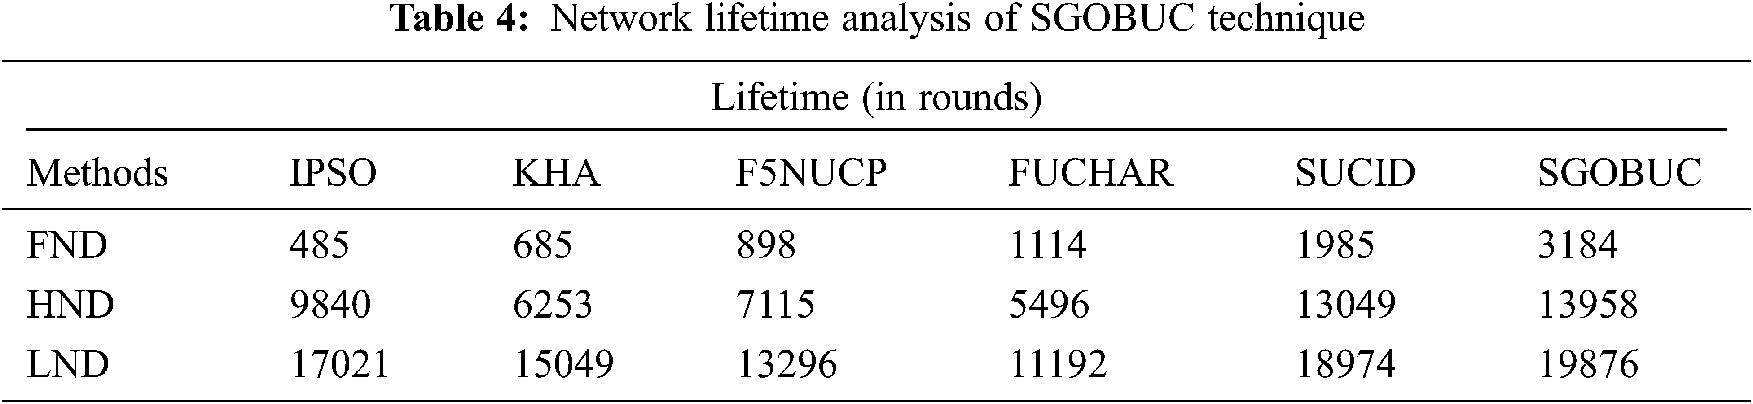
Finally, a brief network lifetime analysis of the SGOBUC technique is performed in Tab. 4 and Fig. 8. The experimental outcomes pointed out that the SGOBUC technique has accomplished better network lifetime over the other methods with the maximum FND, HND, and LND. For instance, the proposed SGOBUC technique has obtained a higher FND of 3184 rounds whereas the IPSO, KHA, F5NUCP, FUCHAR, and SUCID techniques have demonstrated a lower FND of 485, 685, 898, 1114, and 1985 rounds respectively. Next to that, the presented SGOBUC manner has gained a maximum HND of 13958 rounds whereas the IPSO, KHA, F5NUCP, FUCHAR, and SUCID algorithms have outperformed a minimum HND of 9840, 6253, 7115, 5496, and 13049 rounds correspondingly. At last, the projected SGOBUC method has achieved an improved LND of 19876 rounds whereas the IPSO, KHA, F5NUCP, FUCHAR, and SUCID methodologies have showcases a lesser LND of 17021, 15049, 13296, 11192, and 18974 rounds correspondingly.
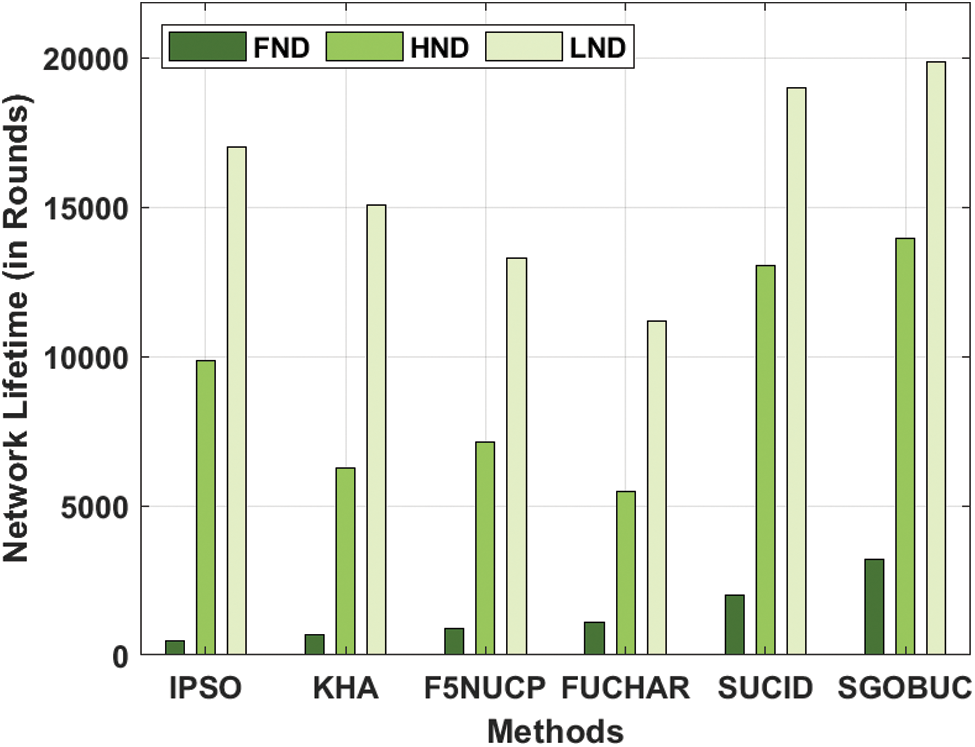
Figure 8: Network lifetime analysis of SGOBUC model
By looking into the above-mentioned results analysis, it is ensured that the SGOBUC technique has accomplished improved outcome over the other existing techniques with the maximum energy-efficiency and network lifetime.
This paper has devised an effective SGOBUC technique to eradicate the hot spot issue in WSN. The SGOBUC technique involves three phases namely initialization phase, neighboring data collection phase, and finally, cluster construction phase. The SGOBUC technique derives a fitness involving different parameters in such a way that the energy efficiency can be accomplished The application of unequal clustering technique assist to uniformly balance the energy dissipation throughout the network. An extensive experimental validation process is performed to ensure the enhanced outcomes of the SGOBUC model. The experimentation values highlighted the better performance of the SGOBUC technique over the other techniques interms of different evaluation parameters. In future, novel routing discovery and route planning strategies can be designed for WSN. Moreover, effective data aggregation and MAC scheduling techniques can be designed to further optimize the resource utilization in the network.
Funding Statement: The authors received no specific funding for this study.
Conflicts of Interest: The authors declare that they have no conflicts of interest to report regarding the present study.
1. V. Devi, T. Seedha and T. Ravi, “Cluster based data aggregation scheme for latency and packet loss reduction in WSN,” Computer Communications, vol. 149, pp. 36–43, 2020. [Google Scholar]
2. C. Ramalingam, “Addressing semantics standards for cloud portability and interoperability in multi cloud environment,” Symmetry, vol. 13, no. 2, pp. 317, 2021. [Google Scholar]
3. S. Neelakandan and S. Muthukumaran, “Transformation-based optimizations framework (tof) for workflows and its security issues in the cloud computing,” International Journal of Engineering and Computer Science, vol. 4, no. 08, pp. 13746–13753, 2015. [Google Scholar]
4. G. Anastasi, M. Conti, M. Di Francesco and A. Passarella, “Energy conservation in wireless sensor networks: A survey,” Ad Hoc Networks, vol. 7, no. 3, pp. 537–568, 2009. [Google Scholar]
5. S. Arjunan and S. Pothula, “A survey on unequal clustering protocols in wireless sensor networks,” Journal of King Saud University-Computer and Information Sciences, vol. 31, no. 3, pp. 304–317, 2019. [Google Scholar]
6. T. Nguyen, T. Dao, F. Horng and C. Shieh, “An energy-based cluster head selection algorithm to support long-lifetime in wireless sensor networks,” Journal of Network Intelligence, vol. 1, no. 6, pp. 23–37, 2016. [Google Scholar]
7. A. A. Abbasi and M. Younis, “A survey on clustering algorithms for wireless sensor networks,” Computer Communication, vol. 30, no. 2, pp. 2826–2841, 2017. [Google Scholar]
8. S. Neelakandan, “Large scale optimization to minimize network traffic using mapreduce in big data applications,” Int. Conf. on Computation of Power, Energy Information and Communication IEEE, pp. 193–199, 2016. [Google Scholar]
9. H. Xia, R. H. Zhang, J. Yu and Z. K. Pan, “Energy-efficient routing algorithm based on unequal clustering and connected graph in wireless sensor networks,” International Journal of Wireless Information Networks, vol. 23, no. 4, pp. 141–150, 2016. [Google Scholar]
10. T. Ravichandran, “An efficient resource selection and binding model for job scheduling in grid,” European Journal of Scientific Research, vol. 81, no. 4, pp. 450–458, 2012. [Google Scholar]
11. T. Priyadharshini and S. Neelakandan. “An efficient cache consistency scheme in mobile networks,” Wireless Communication, vol. 3, no. 4, pp. 604–609, 2011. [Google Scholar]
12. S. Arjunan, S. Pothula and D. Ponnurangam, “F5 N based unequal clustering protocol for wireless sensor networks,” International Journal of Communication Systems, vol. 31, no. 17, pp. e3811, 2018. [Google Scholar]
13. W. B. Heinzelman, A. P. Chandrakasan and H. Balakrishnan, “An application-specific protocol architecture for wireless microsensor networks,” IEEE Transaction on Wireless Communication, vol. 1, no. 3, pp. 660–670, 2002. [Google Scholar]
14. R. Farah Sayeed, S. Princey and S. Priyanka, “Deployment of multicloud environment with avoidance of ddos attack and secured data privacy,” International Journal of Applied Engineering Research, vol. 10, no. 9, pp. 8121–8124, 2015. [Google Scholar]
15. K. Guleria and A. K. Verma, “Meta-heuristic ant colony optimization based unequal clustering for wireless sensor network,” Wireless Personal Communications, vol. 105, no. 3, pp. 891–911, 2009. [Google Scholar]
16. K. S. Arikumar, V. Natarajan and S. C. Satapathy, “Eeltm: An energy efficient lifetime maximization approach for wsn by pso and fuzzy-based unequal clustering,” Arabian Journal for Science and Engineering, vol. 45, no. 12, pp. 10245–10260, 2020. [Google Scholar]
17. N. Moussa and A. E. B. El Alaoui, “An energy-efficient cluster-based routing protocol using unequal clustering and improved aco techniques for wsns,” Peer-to-Peer Networking and Applications, vol. 14, no. 3, pp. 1334–1347, 2021. [Google Scholar]
18. P. S. Rao, P. Lalwani, H. Banka and G. S. N. Rao, “Competitive swarm optimization based unequal clustering and routing algorithms for wireless sensor networks,” Multimedia Tools and Applications, vol. 80, no. 17, pp. 1–27, 2021. [Google Scholar]
19. J. S. Pan and T. K. Dao, “A compact bat algorithm for unequal clustering in wireless sensor networks,” Applied Sciences, vol. 9, no. 10, pp.1973, 2019. [Google Scholar]
20. V. Anand and S. Pandey, “Particle swarm optimization and harmony search based clustering and routing in wireless sensor networks,” International Journal of Computational Intelligence Systems, vol. 10, no. 1, pp. 1252–1262, 2017. [Google Scholar]
21. S. Sefati, M. Abdi and A. Ghaffari, “Cluster based data transmission scheme in wireless sensor networks using black hole and ant colony algorithms,” International Journal of Communication Systems, vol. 34, no. 9, pp. e4768, 2021. [Google Scholar]
22. F. Zhu and J. Wei, “An energy-efficient unequal clustering routing protocol for wireless sensor networks,” International Journal of Distributed Sensor Networks, vol. 15, no. 9, pp.1550147719879384, 2019. [Google Scholar]
23. S. Arjunan and P. Sujatha, “Lifetime maximization of wireless sensor network using fuzzy based unequal clustering and aco based routing hybrid protocol,” Applied Intelligence, vol. 48, no. 8, pp. 2229–2246, 2018. [Google Scholar]
24. A. Judith Mary and S. B. Priya, “Multiset task related component analysis for ssvep frequency recognition in bci,” Journal of Ambient Intelligence and Humanized Computing, vol. 12, no. 5, pp. 5117–5126, 2021. [Google Scholar]
25. G. Dhiman and V. Kumar, “Seagull optimization algorithm: Theory and its applications for large-scale industrial engineering problems,” Knowledge-Based Systems, vol. 165, pp. 169–196, 2018. [Google Scholar]
 | This work is licensed under a Creative Commons Attribution 4.0 International License, which permits unrestricted use, distribution, and reproduction in any medium, provided the original work is properly cited. |