DOI:10.32604/iasc.2022.022418
| Intelligent Automation & Soft Computing DOI:10.32604/iasc.2022.022418 | |
| Article |
Handling High Dimensionality in Ensemble Learning for Arrhythmia Prediction
Department of Computer Science, King Khalid University, Abha, Kingdom of Saudi Arabia
*Corresponding Author: Fuad Ali Mohammed Al-Yarimi. Email: fuadalyarimi@gmail.com
Received: 06 August 2021; Accepted: 20 October 2021
Abstract: Computer-aided arrhythmia prediction from ECG (electrocardiograms) is essential in clinical practices, which promises to reduce the mortality caused by inexperienced clinical practitioners. Moreover, computer-aided methods often succeed in the early detection of arrhythmia scope from electrocardiogram reports. Machine learning is the buzz of computer-aided clinical practices. Particularly, computer-aided arrhythmia prediction methods highly adopted machine learning methods. However, the high dimensionality in feature values considered for the machine learning models’ training phase often causes false alarming. This manuscript addressed the high dimensionality in the learning phase and proposed an (Ensemble Learning method for Arrhythmia Prediction) ELAP (ensemble learning-based arrhythmia prediction). The proposed method is working as a classification approach that incorporates both supervised and unsupervised learning methods. The experimental study addresses the rise of the proposed method in the prediction accuracy of both labels. The cross-validation statistics of ELAP have been compared to contemporary methods to scale the performance of the ELAP. The proposed method ELAP. Concerning scale, the prediction accuracy, the scope of the false alarm, the robustness of the label prediction, the outcomes of the assessment metrics obtained from 10-fold leave pair out cross-validation performed on proposed ELAP has compared to the corresponding outcomes metrics obtained from the contemporary methods.
Keywords: Cardiovascular diseases; arrhythmia prediction; k-nearest neighbors; differential evolution; cuckoo search
Worldwide every year, 17.9 million people have been affected by CVD (cardiovascular diseases). For the medical analysis, the signal has been considered, detecting the heart’s abnormality by computing electrical muscle and electrical activity. Small electrical impulses have been formed by the cardiac, which spreads all over the entire cardiac-muscle. Here, these impulses have been recognized often with the ECG device. The ECG device has recorded the cardiac electrical action, and this information has been exhibited on the graph sheet of ECG. The provider of healthcare understands the information that is recorded. ECG aims to know the pain and sign in the heart and help perceive abnormal heart defects.
Skilled clinical experts often suggest electrocardiogram tests to diagnose the arrhythmia scope in a patient’s heartbeats. The cardiac disorder, identified by ECG (Electrocardiograms), considers distended heart and abnormal cardiac rhythm. One of the significant cardiac illness diagnostic equipment is ECG. Due to maximal cardiac illness death rate, accurate ECG signals discernment, and initial recognition stands significant on patient action. The cardiogram signals technique would provide prominent research for doctors to examine the recognition and diagnosis of heart illness and categorize the patient abnormality. Cardiogram classification into types of heart diseases provides adequate information to identify the illness of cardiac. The cardiogram signal classification is an intricate issue because of the classification procedure issue. The feature normalization, changeability, lacking, non-existence of optimal classification, unstable graphs, and originality are the critical constraints of classifying electrocardiograms. Moreover, evolving the appropriate classifier, which attained categorizing illness and the ECG signal classifier’s main application, identifies cardiac illness diagnosis.
Over the former decades, numerous schemes have been projected to classify the heartbeat and detect arrhythmia based on automatic ECG. Faezipour et al. [1] explored the wavelet-based ECG beats classification. Chazal et al. [2] introduced an algorithm based on linear discriminant analysis. Kumar et al. [3] present a model based on NN (neural network) to classify the five diversified ECG classes automatically. The models based on SVM have been implemented for ECG signals classification [4–6]. Melgani et al. [5] projected a model based on SVM for classifying the ECG beats automatically and has been compared to the other two classifiers like RFF-NN (Radial basis function NN classifier) and KNN (k-nearest neighbors). Mondejar-Guerraa et al. [4] projected a novel model for classifying the ECG based on the SVM classifier.
The most prominent ML techniques are ensemble learning that might be used in diversified issues like regression and classification [7]. Peimankar et al. [8,9] used biomedical and electrical engineering. Each ensemble learning approach comprises three significant parts: (a) forming the training set from the dataset, (b) group of diversified classification algorithms has to be trained, and (c) integrating the classification prediction algorithms. Polikar [7] presents that the required benefits of utilizing ensemble learning possess a more precise classification method by transmitting the single weak-classifier selection.
A set of 26 features have been extracted and utilized as inputs for three classifiers to differentiate among regular heartbeats and four diversified arrhythmia classes. Here, three classification algorithms have been utilized in this contribution are Artificial NN (ANN) [10], Adaboost [11], and RF (Random Forest) [12]. Each of the above stated three single classification algorithms has been trained using 5fold cross-verification schemes. Glenn [13] presents that these algorithms’ outcomes have been accumulated by utilizing DST (Dempster-Shafer theory) to enhance these performance classification algorithms.
Several algorithms have been projected in this review to segmentation heartbeat [14–17] to achieve optimal outcomes in well-recognized MIT-BIH databases [18]. Moreover, in this contribution, researchers concentrated on the last two steps, classification, and extraction of the feature. Several features have been investigated for explaining the heartbeats of ECG, emphasizing the wavelet utilization [19,20], HOS [21], [22], and intervals of heartbeat popularly called RR intervals as stated in [23,24]. For designing the classification method, several former contributions stated the ML algorithms feasibility for the challenge [25]; incorporating models like AdaBoost [26], GA-BPNN (genetic algorithm-back propagation NN) [27], SVM [28–33], MLP (multi-layer perceptron) [19,28,29] and linear discriminant [34].
The ensemble classifiers integrate the individual classifiers’ decisions, which compose them to enhance the final estimation. Dietterich [35] present several schemes in this literature for forming ensemble classifiers. Each classifier is trained by diversified training subset instances such as AdaBoost [36] or Bagging [37]. Dietterichet et al. [38] present an issue that pre-requisites many classes, segmenting the number of outputs in diversified sets and producing an ensemble classifier. Moreover, other contributions train every classifier in a diversified input features subset. Robert et al. [39] performed experimentation and finalized that integrating classifiers trained on diversified feature sets are very resourceful, mainly when single classifiers deliver an optimal performance. Waske et al. [40] developed ensemble SVM classifiers in multi-source cover land classification issues using a balanced dataset. Moreover, training every SVM with a diversified data source prominently enhanced the outcomes when compared with a single SVM that has been trained with entire data sources.
Automatic detection of cardiac arrhythmia (ADCA) using ensemble learning [41] has endeavored to address the constraints of the contemporary methods of machine learning-based arrhythmia prediction. Though the ADCA is an ensemble classification model, it does not address the false alarming caused by the high dimensionality of the values representing the training phase’s features. Our earlier contribution of a classification technique, Electrocardiogram Stream Level Correlated Patterns as Features (ESCPF) [42], addressed a novel feature selection and feature optimization methods to perform heartbeat classification to identify the arrhythmia scope in a given electrocardiogram. However, the false alarm due to dimensionality in feature values has not been addressed by ESCPF.
Concerning addressing the false alarm in arrhythmia prediction caused by the dimensionality in feature values, this manuscript portrayed a novel ensemble classification process that uses signal flow features.
This section explores the methods and materials used in the proposed ensemble learning-based arrhythmia prediction from electrocardiograms. The section includes a detailed description of the data corpus used in the classification process, the features extraction, feature optimization using the Dice Similarity Assessment Scale, the method of handling dimensionality through clustering and cluster optimization by Differential Evolution, the incremental binary classifier, and the method of the classification process.
The dataset was prepared by the integration of diversified datasets EHCD (ECG Heartbeat Categorization Dataset) [43] and MIT-BIH [18] of the records labeled either as positive or negative. Each record considered for the experimental study is positive or negative, as stated in [44]. The records’ count from these records labeled positive is 15000 records, whereas the rest of records 12100 are labeled as benign.
Let the dataset ECG represents the set of electrocardiogram reports of the subjects in digital format (as x, y coordinates), which have been labeled either as negative (no evidence of arrhythmia) or positive (prone to arrhythmia). The input corpus of ECG reports bipartite into two sets pT, nT contains the records labeled as positive (prone to arrhythmia) and negative (normal heartbeat) in respective order. The sequence of cardiogram elements (y-coordinate values projected for a sequence of x coordinates) of size one and above are the considered features, referred to further as the sets fP, fN in respective order of the labels positive and negative. Each feature f represents a sequence of elements (x-coordinates) of size 1 to the record’s size |ri|, with maximum cardiogram elements than any other record of the corresponding set. Each record
3.3 Features Optimization Using Dice Similarity Assessment Scale
The Dice similarity coefficient (DSC) has been used to select optimal labeled records attributes as positive and negative [44]. Also, the use of DSC to choose optimal features has been explored in the coming sections.
Diversity assessment using a distance scale is as follows. It is the variance observed between the values projected for a feature, which is the column of both matrices E, and F. The main scheme for evaluating the variance for the elements is adapting coding theory. Such a scheme is implemented to handle distance among several unique values, which are noticed and the record set attribute tagged as false or true.
Let the ith column of the set E, and set F as vectors Ec, and Fc in respective order, which may be distinct in vector size. Assessment of the diversity by distance scale is as following by (Eq. (1)).
//
3.4 Forming the Initial Clusters
Clusters have been framed separately for both labels, such as positive as well as negative. The proposed cluster from negative and positive labels and values exhibited for framing every given labeled records data has been considered a unique set in respect to this. Every support value has been assessed as a ratio of records having corresponding values against the overall records count. Every record has been weighted by accumulative support values perceived for every value depicted in the corresponding record.
The records have been organized in descending weight sequence, which has been assessed as follows:
Primarily, it depicts average support ratio values avgS and the respective deviation eS of the corresponding set of records. Further, it depicts the absolute difference in average support avgS and deviation deS as a record weight rew. A record average weight has been considered to determine the centroid threshold, as explored in the following description.
The record’s average weight is denoted as 〈rew〉 and deviation of the corresponding transaction’s weight detw, indicated by RMSE of corresponding record weights for the specified training corpus. Also, consider the accumulative of record average weight 〈rew〉 and representation of the threshold deviation value detw of centroid cet.
The initial cluster count has been signified by the count of records having records weight greater than cet. Also, clustering has been implemented. One or more cluster records can exist in other clusters if the distance amid record and corresponding centroid cluster is greater than the threshold dit.
Further, assesses the distance amid each pair of clusters; if the distance is less than the distance threshold, it replaces both clusters with a new cluster that results from the union of the corresponding pair of clusters.
The Differential Evolution (DE) [46] is a reliable evolutionary method to perform optimization routines. The DE concept is approximately identical to GA, as stated in [47]. Even though the fluctuation from GA considers unique genotypes moreover, among these inputs (parent) and resultant (child) chromosomes, the fittest pair of chromosomes survive, and the rest evades.
The primary clusters have been deliberated to be input chromosomes set; further, DE (Differential evolution) has been performed on every set of chromosomes that leads to a new pair of chromosomes. Moreover, the following subsection explores the function of fitness used in the DE process.
Specified cluster input has been considered as a dataset, and average record weights have been recognized. Moreover, identify cluster level utility-scale exhibited for multiple attributes values.
Cluster Optimization:
With cluster formation process completion, organize records in diminishing dataset sequence at the transaction utility level, and DE has been performed and attained high fitness as follows:
Let CLS signifies set, which depicts total possible clusters,
Let TCLS indicates a set, which includes novel formed clusters.
For each cluster
For each cluster
CHRS = null //The vacant set has been considered to preserve the novel chromosomes generated from the crossover procedure.
For each crossover
Let representation lcli signifies a subset cli containing total transactions that exist as predecessors towards the crossover crsk.
Let representation rcli signifies a subset cli containing total transactions that exist as a successor towards the crossover crsk.
Let representation lclj signifies a subset clj containing total transactions that exist as predecessors towards the crossover crsk.
Let representation rclj signifies a subset clj containing total transactions that exist as predecessors towards the crossover crsk.
End
Identify fitness entry in CHRS, as stated in Section 3.5.1
Organize set CHRS in reducing order for utility level cluster and count of optimal records for manifold attributes values.
End
End
CLS ← TCLS // transmit entire entries in a set TCLS to set CLS
End
End
Further, these clusters are used for training the classifier such that the cluster must be formed individually, and a binary-classifier has been trained.
The work [48] presents a cuckoo search-based incremental binary classifier that enhanced binary classifier has been modified for performing sentiment analysis. The above-stated classifier is optimum for performing binary classification compared with other existing intricate classification approaches. Moreover, the label and training prognosis states of classifiers have been explained in the following description. The work [49] diabetes is predicted using significant attributes, and the relationship of the differing attributes is also characterized. Various tools are used to determine significant attribute selection and for clustering, prediction, and association rule mining for diabetes.
Sometimes individual classifiers would deliver excellent outcomes in the classification of ECG heartbeat. These excellent instances can be good results, extreme or bad results. Prominently, diversified outcomes have been attained when such classifiers have extended to other kinds of datasets. The ensemble classifier has better capabilities in general. Additionally, the ensemble classifier error rate has usually been less than an individual one. Thus, optimal and ensemble classifier has offered several balanced outcomes for entire categories. The ensemble classifier comprises numerous device learners that might be integrated and constructed as the ensemble classifier.
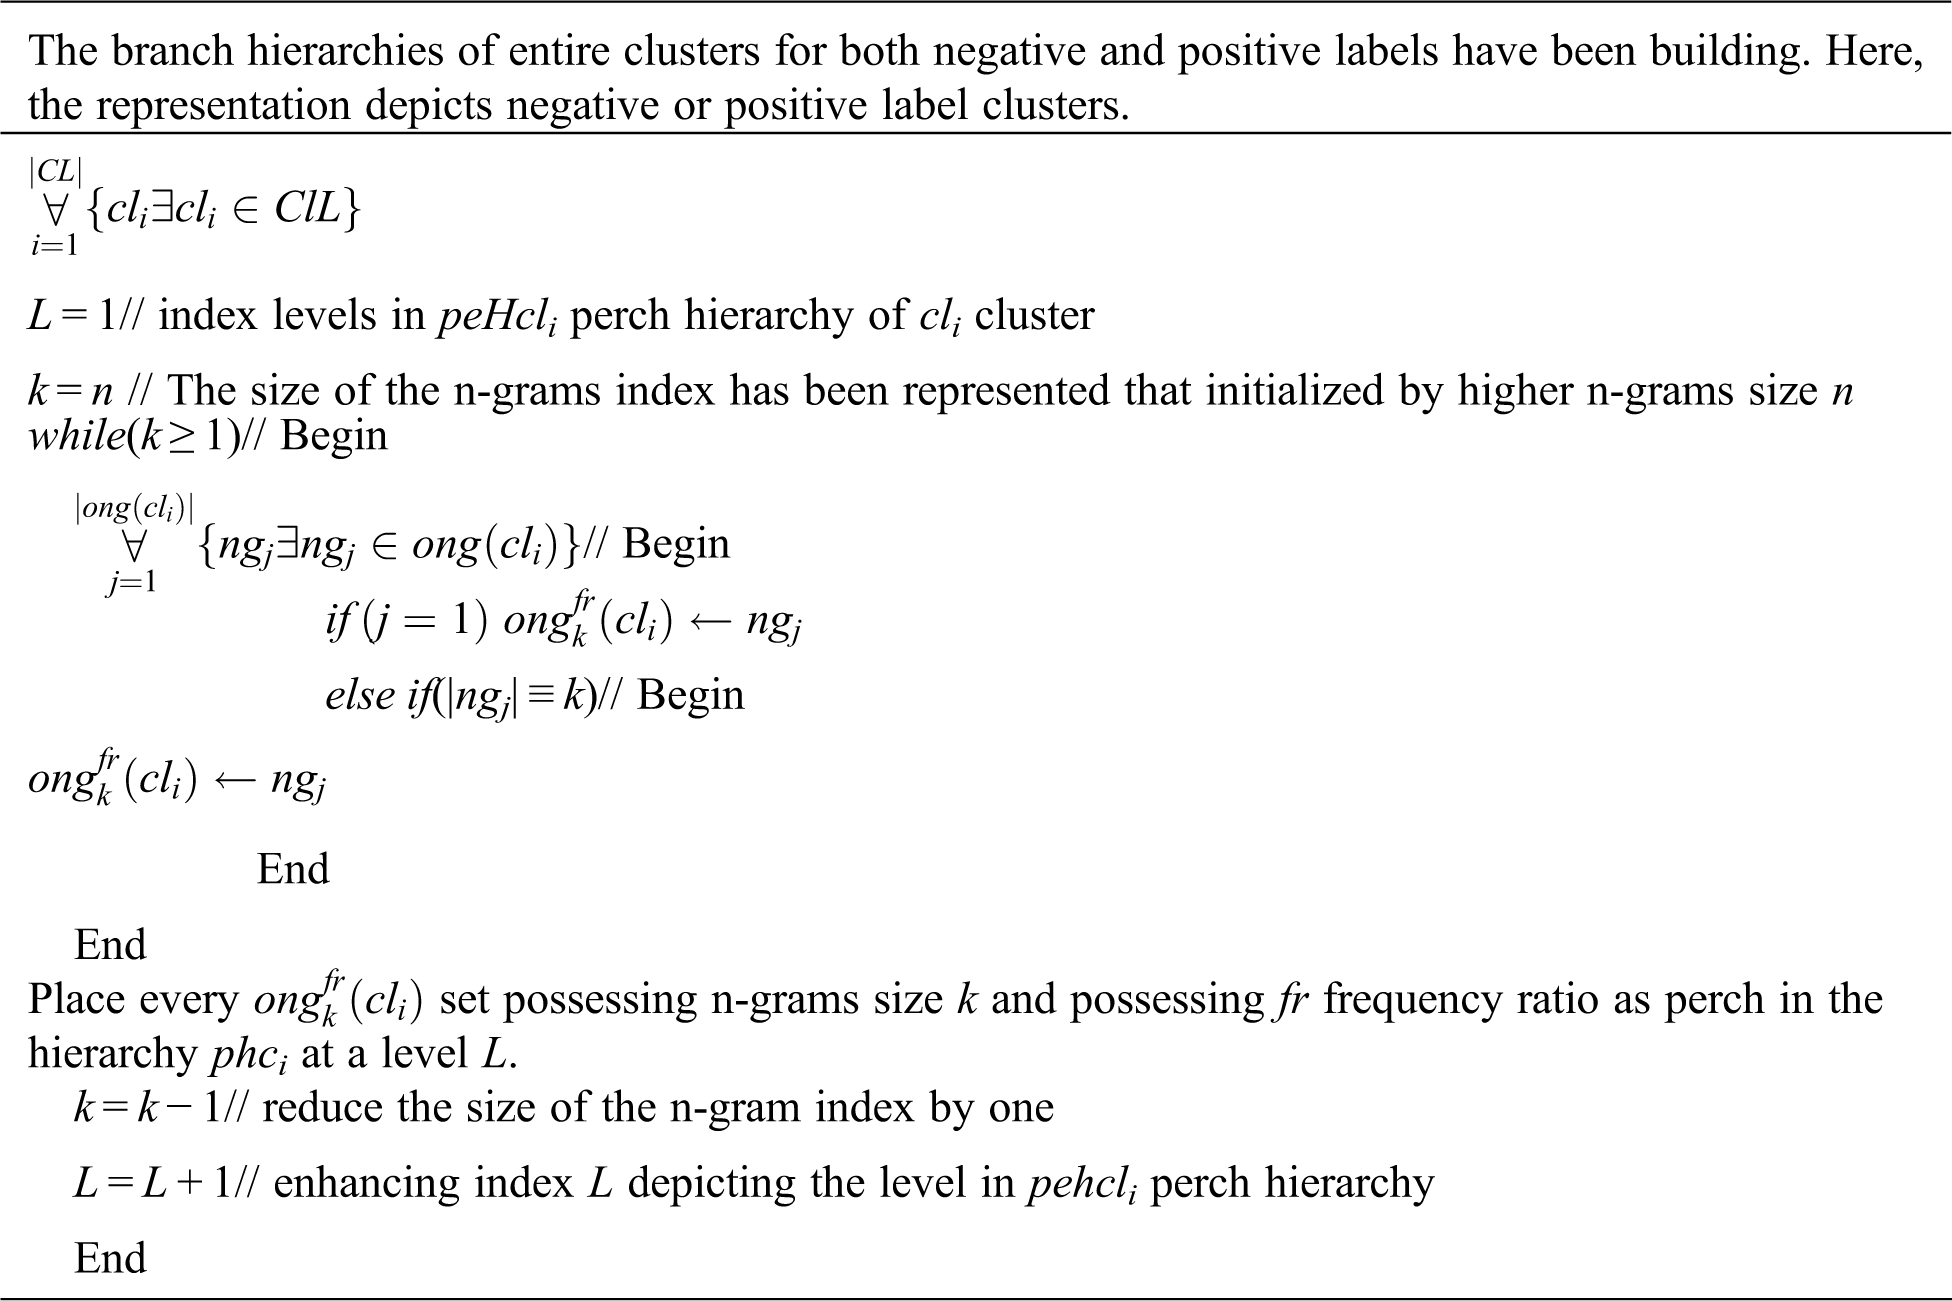
The binary classifier designed on cuckoo search (CS) has two stages. Here, the primary step called training builds a hierarchy of nest so that every level comprises various perches more than the amount of predeceasing level perches if there are any. Moreover, the training step builds two hierarchies for both negative and positive labels. The branches formed in each level of both hierarchies are in the following:
For sentiment polarity labels, the patterns of n-gram have been discovered in the form of optimum features from respective label training corpus has to be organized in decreasing sequence of size. Moreover, n-gram features with maximum size n must be segmented into clusters so that similar size n-grams possess the same frequency that might present in one cluster. Each cluster with n-grams of n size needs to keep as branches in the respective hierarchy’s primary level
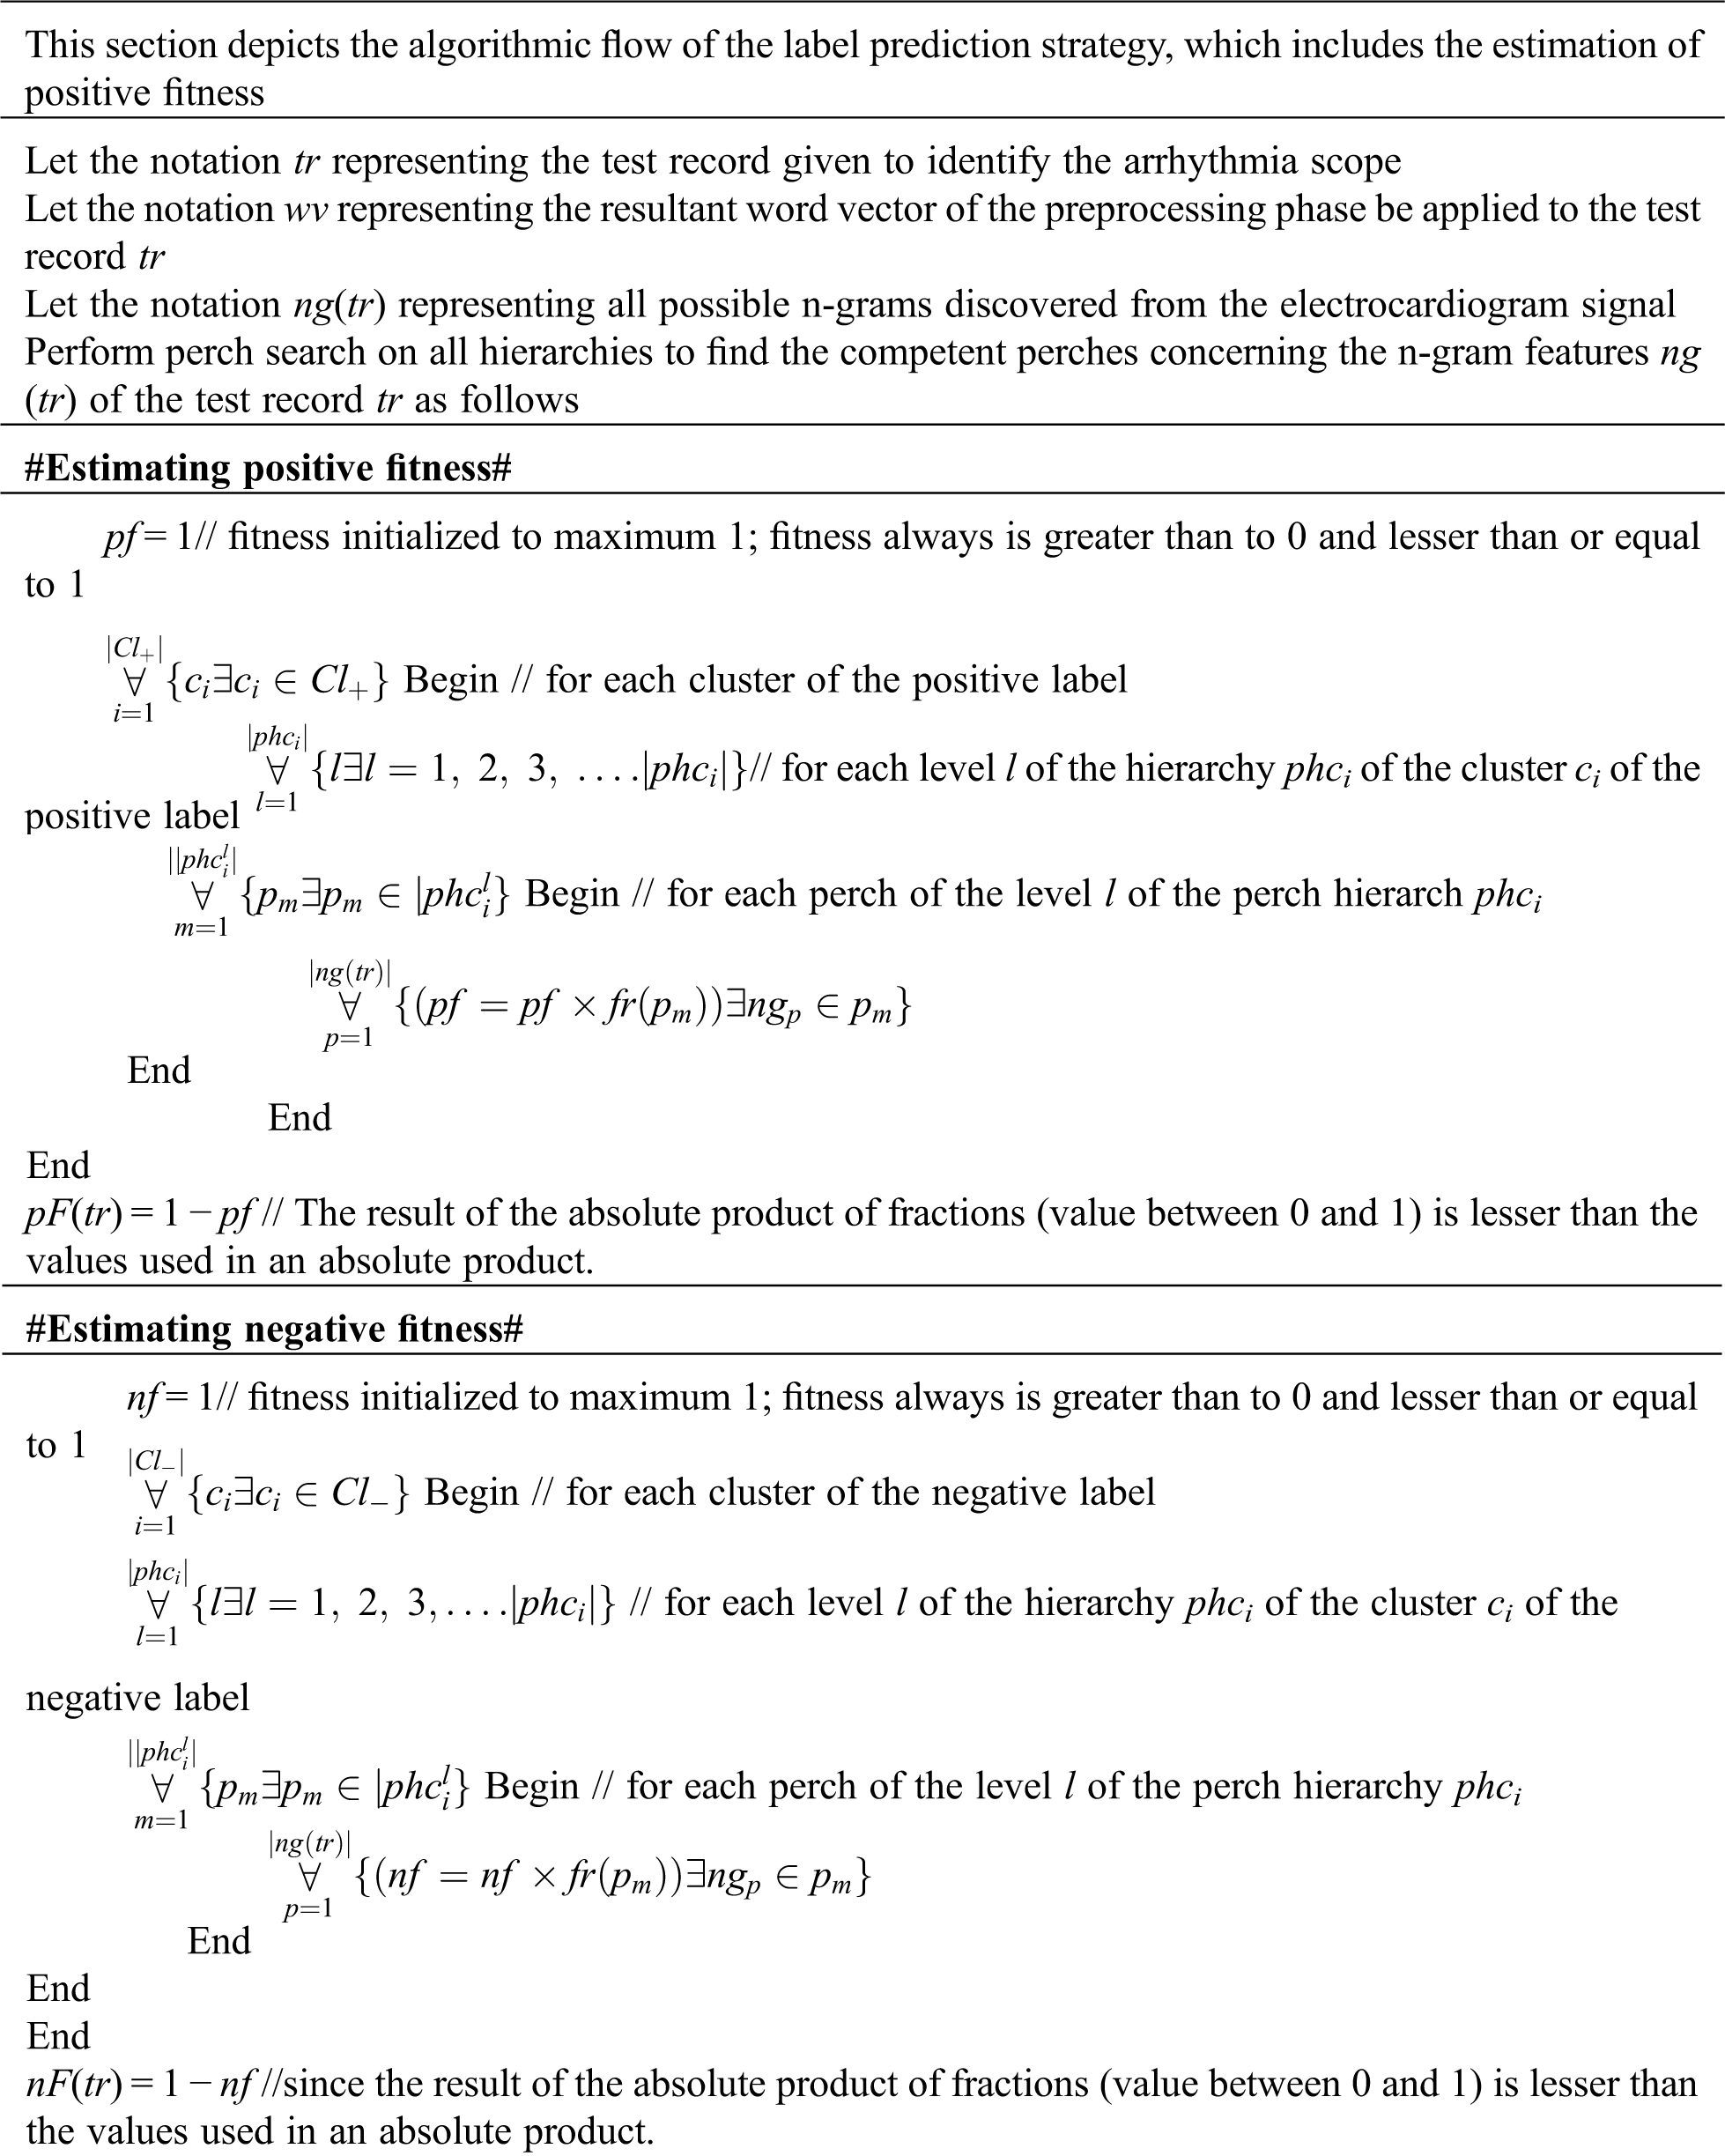
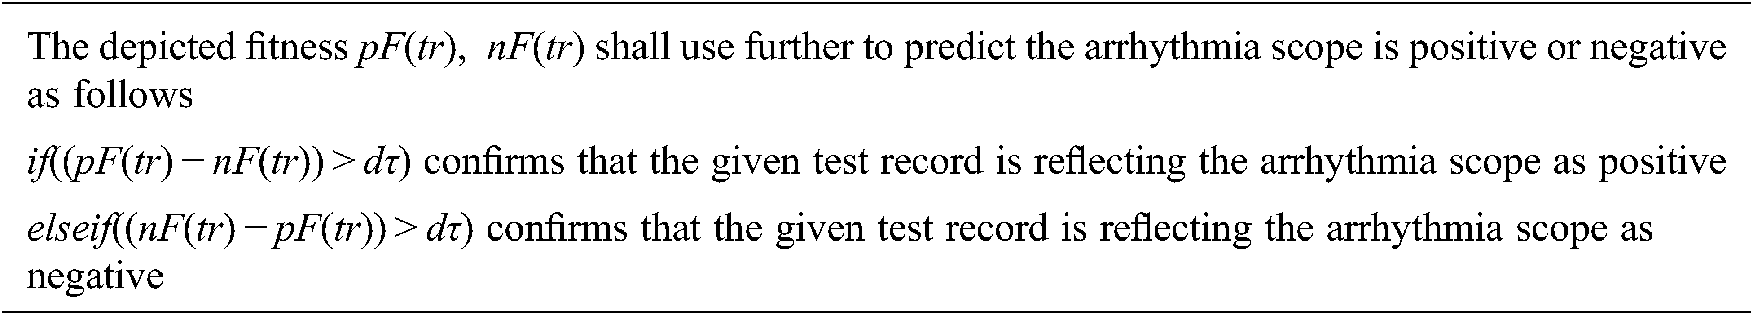
The record R shall be labeled as either prone to arrhythmia or not by measuring the average record fitness R concerning diversified records clusters labeled positive and fitness average for diversified records clusters labeled negative & their corresponding RMSD. By utilizing the conditions determined below, the labeled record has been determined as prone to arrhythmia or not.
The total number of labeled records considered for the experimental study is 81614, comprising 46103 records labeled as positive and 35511 records labeled as negative. The k-fold Leave-Pair-Out Cross-Validation (LPOCV) [50] has been used to scale the proposed method’s performance. The cross-validation metrics have considered assessing the performance of the proposed method ELAP (ensemble learning-based arrhythmia prediction). Concerning scale, the prediction accuracy, the scope of the false alarm, the robustness of the label prediction, the outcomes of the assessment metrics obtained from 10-fold leave pair out cross-validation performed on proposed ELAP has compared to the corresponding outcomes metrics obtained from the contemporary methods. Investigates the recovery and death factors that contribute to schistosomiasis disease preprocessed dataset, collected from Hubei, China. A computerized learning method, association rule mining (Apriori), is used to spot factors [51]. Automatic Detection of Cardiac Arrhythmias (ADCA) Using Ensemble Learning [41] and Electrocardiogram Stream level Correlated Patterns as Features (ESCPF) [42].
Fig. 1 addresses the significance of the precision observed from ELAP compared to the precision observed from ADCA and ESCPF. Though the ESCPF is most similar to the ELAP concerning feature extraction and optimization, it ranked last about precision due to the curse of dimensionality in a training corpus. Though the method ADCA performing an ensemble learning process, it is evincing low precision compared to the precision observed from ELAP.
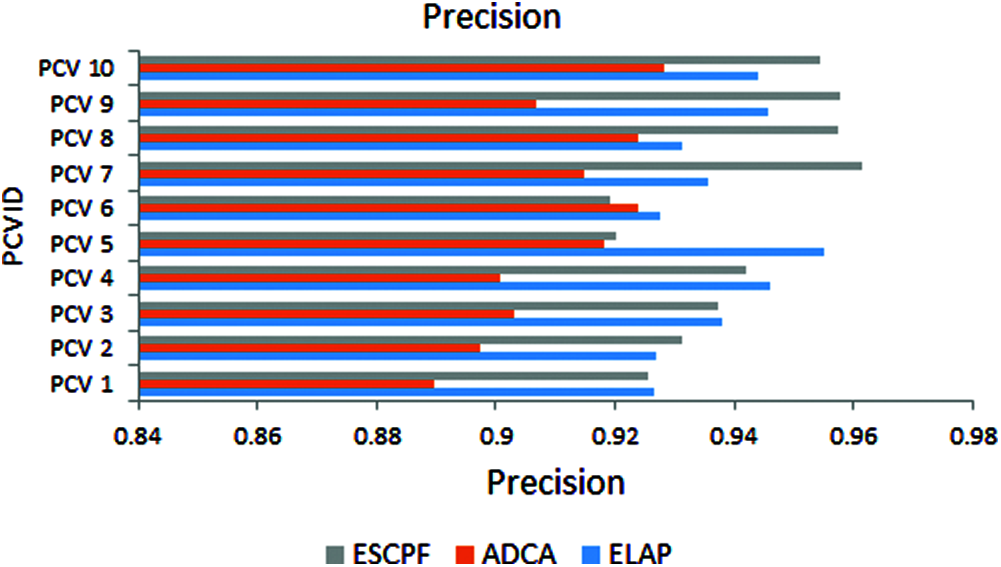
Figure 1: Precision exhibited by 10-fold leave pair out cross-validation of ELAP, ADCA, and ESCPF
The graph has been plotted among metric specificity and ten folds of leave pair out cross-validation performed on ELAP, ADCA, and ESCPF models, as shown in Fig. 2. The metric specificity is also called selectivity. It has been envisioned from the above figure that the performance of specificity ELAP is better than the ADCA and ESCPF models.
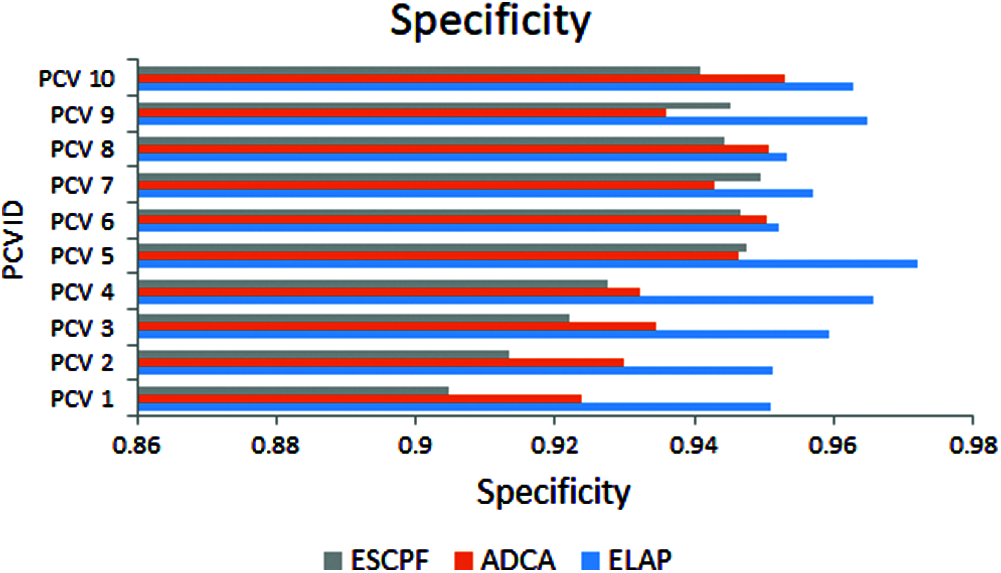
Figure 2: Specificity exhibited by 10-fold leave pair out cross-validation of ELAP, ADCA, and ESCPF
Fig. 3 addresses the metric sensitivity, also called recall, observed from ELAP, ADCA, and ESCPF models. The method ELAP outperforming the ADCA and ESCPF towards sensitivity. Among the three methods compared, ELAP, ADCA, and ESCPF ranked in corresponding order since the contemporary methods lagged in handling the curse of dimensionality in a training corpus.
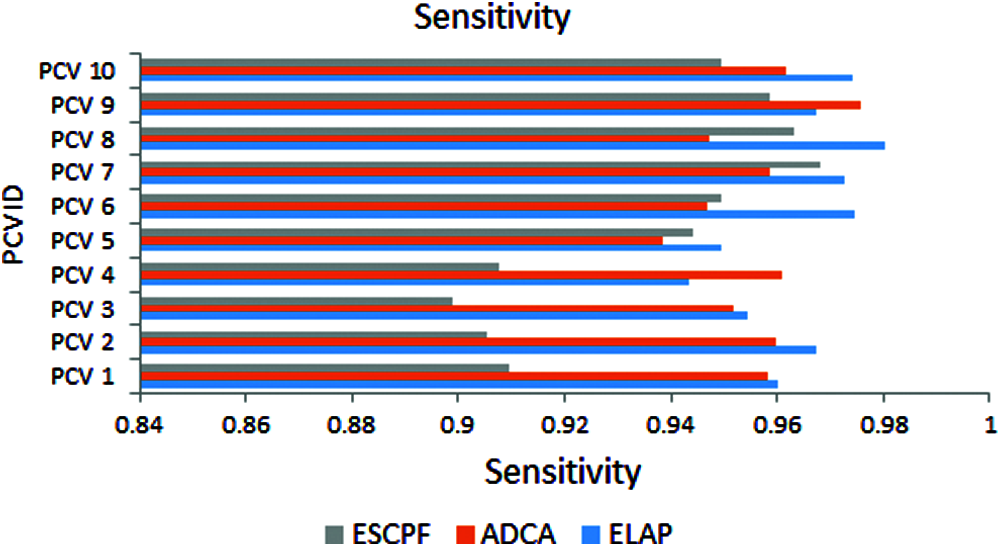
Figure 3: Sensitivity exhibited by 10-fold leave pair out cross-validation of ELAP, ADCA, and ESCPF
The graph has been plotted among metric accuracy and ten PCV IDs over the proposed ELAP model and ADCA and ESCPF models, as shown in Fig. 4. It has been envisioned from the above figure that the accuracy performance for the ELAP is better when compared to the ADCA and ESCPF models.
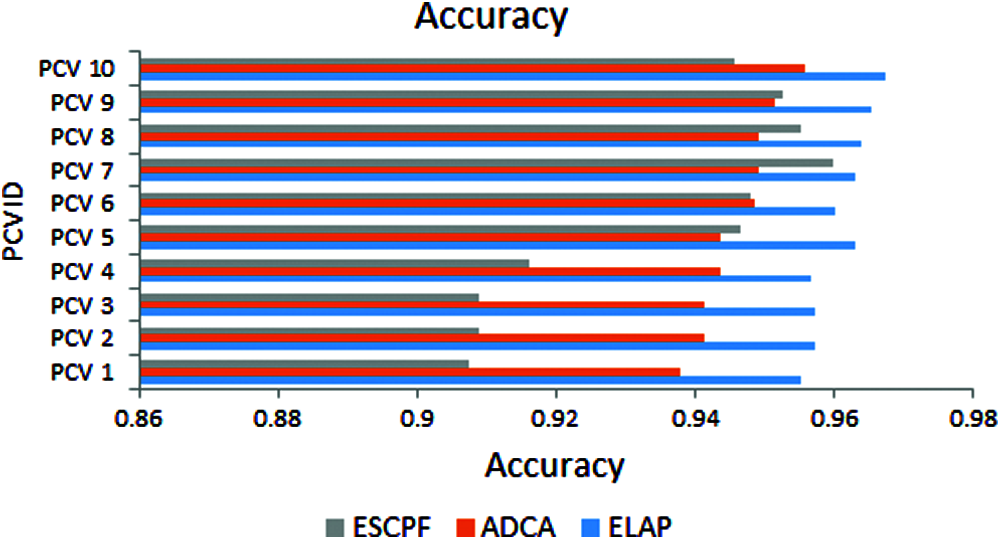
Figure 4: Accuracy exhibited by 10-fold leave pair out cross-validation of ELAP, ADCA, and ESCPF
In Fig. 5, the metric F-measure is also called as F1score. The graph represents the f-measure observed from tenfold leave pair out cross-validation performed on ELAP and contemporary ADCA and ESCPF. The ELAP has been compared with ADCA and ESCPF models. These statistics exhibit that ELAP is outperforming the contemporary methods ADCA and ESCPF.
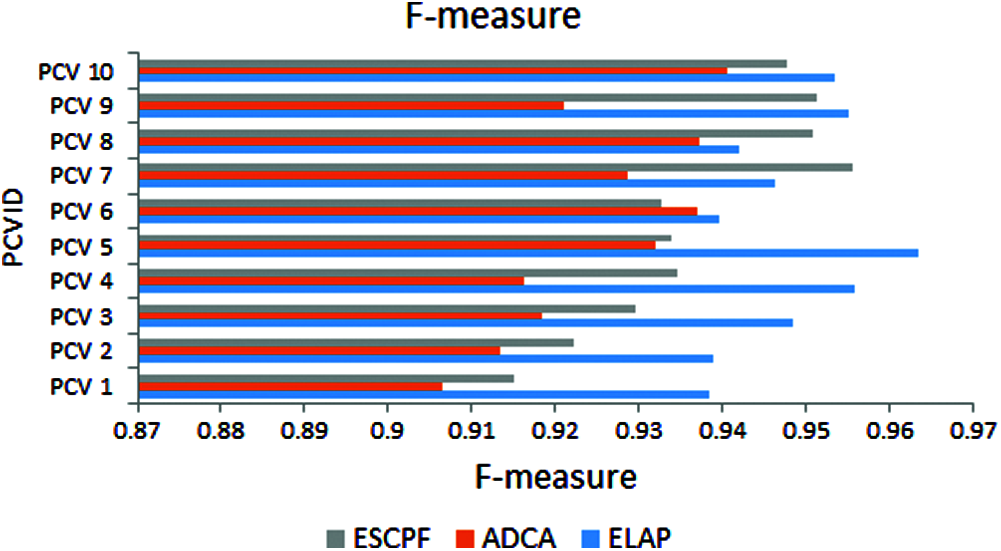
Figure 5: F-measure exhibited by 10-fold leave pair out cross-validation of ELAP, ADCA, and ESCPF
The graph has been plotted among metric MCC and ten PCV IDs over the proposed ELAP model and ADCA and ESCPF models, as shown in Fig. 6. This metric MCC has been used as a measure to assess the performance of the binary classification. It is envisioned from the above figure that the MCC observed from the projected model is better when compared to the ADCA and ESCPF models.
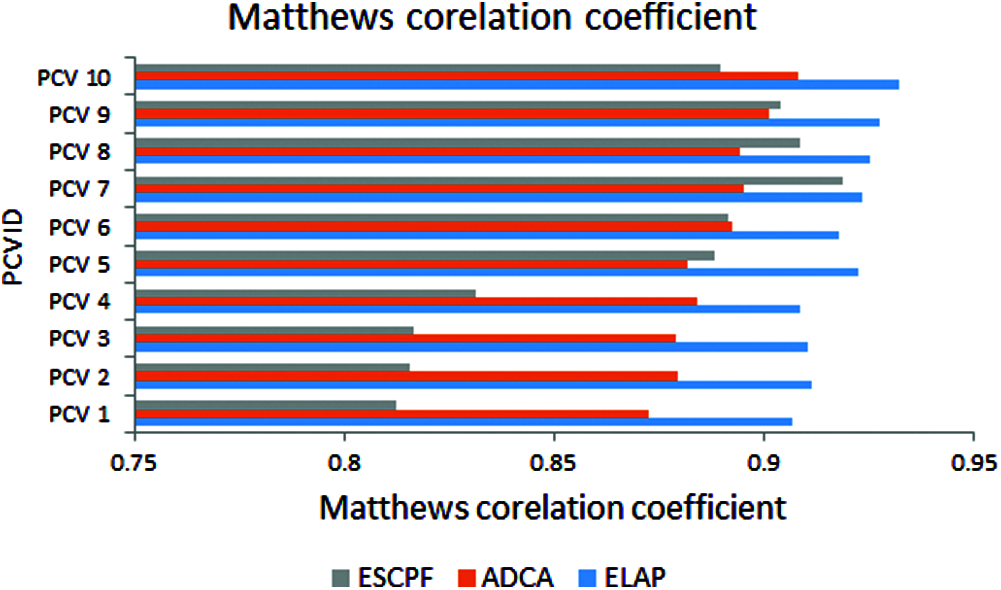
Figure 6: Matthews’s correlation coefficient exhibited by 10-fold leave pair out cross-validation of ELAP, ADCA, and ESCPF
The arrhythmia prediction by ensemble classification using sequence patterns of the electrocardiogram signals has been addressed in this manuscript. Unlike the contemporary models, which are specific to train the different classifiers on the same feature values, the proposed method is partitioning the training corpus into multiple clusters. The entries of one cluster may occur in one or more other clusters. It treats each cluster as a different corpus and discovers sequence patterns of the corresponding cluster’s electrocardiogram signals as features. The discovered features of each cluster are used further to train the classifier. The training phase uses different objects of the same classifier for different clusters. The experimental study performed on proposed and other contemporary methods exhibits the significance and performance optimality of ELAP to identify arrhythmia scope compared to other contemporary methods ADCA and ESCPF. Future research can introduce the fusion of feature optimization methods and classification methods to improve arrhythmia prediction accuracy.
Acknowledgement: The authors extend their appreciation to the Deanship of Scientific Research at King Khalid University for funding this work through the General Research Project under Grant Number (R.G.P1/155/40).
Funding Statement: The authors extend their appreciation to the Deanship of Scientific Research at King Khalid University for funding this work under Grant Number (R.G.P1/155/40/2019), Received by Fuad A. Al-Yarimi. https://www.kku.edu.sa.
Conflicts of Interest: The authors declare that they have no conflicts of interest to report regarding the present study.
1. M. Faezipour, A. Saeed, S. Bulusu, M. Nourani and H. Minn, “A patient-adaptive profiling scheme for (ecg) beat classification,” IEEE Transactions on Information Technology in Biomedicine, vol. 14, no. 5, pp. 1153–1165, 2010. [Google Scholar]
2. P. Chazal and R. Reilly, “A patient-adapting heartbeat classifier using (ecg) morphology and heartbeat interval features,” IEEE Transactions on Biomedical Engineering, vol. 53, no. 12, pp. 2535–2543, 2006. [Google Scholar]
3. M. Kumar and S. Ari, “ECG beats classification using mixture of features,” International Scholarly Research Notices, vol. 2014, pp. 1–12, 2014. [Google Scholar]
4. V. Mondejar-Guerraa, J. Novo, J. Rouco, M. Penedo and M. Ortega, “Heartbeat classification fusing temporal and morphological information of ecg’s via ensemble of classifiers,” Biomedical Signal Processing and Control, vol. 47, pp. 41–48, 2019. [Google Scholar]
5. F. Melgani and Y. Bazi, “Classification of electrocardiogram signals with support vector machines and particle swarm optimization,” IEEE Transactions on Information Technology in Biomedicine, vol. 12, no. 5, pp. 667–677, 2008. [Google Scholar]
6. C. Ye, B. Vijaya and M. Coimbra, “Heartbeat classification using morphological and dynamic features of (ecg) signals,” IEEE Transactions on Biomedical Engineering, vol. 59, no. 10, pp. 2930–2941, 2012. [Google Scholar]
7. R. Polikar, “Ensemble based systems in decision making,” IEEE Circuits and Systems Magazine, vol. 6, no. 3, pp. 21–45, 2006. [Google Scholar]
8. A. Peimankar, S. Weddell, T. Jalal and A. Lapthorn, “Evolutionary multi-objective fault diagnosis of power transformers,” Swarm and Evolutionary Computation, vol. 36, pp. 62–75, 2017. [Google Scholar]
9. L. Shi, L. Xi, X. Ma, M. Weng and X. Hu, “A novel ensemble algorithm for biomedical classification based on ant colony optimization,” Applied Soft Computing, vol. 11, no. 8, pp. 5674–5683, 2011. [Google Scholar]
10. S. Haykin, “Neural networks: A comprehensive foundation,” Upper Saddle River, N.J.: Prentice Hall PTR, 2nd Edition, 1994. [Google Scholar]
11. Y. Freund and R. Schapire, “A decision-theoretic generalization of on-line learning and an application to boosting,” Journal of Computer and System Sciences, vol. 55, no. 1, pp. 119–139, 1997. [Google Scholar]
12. L. Breiman, “Random forests,” Machine Learning, vol. 45, no. 1, pp. 5–32, 2001. [Google Scholar]
13. S. Glenn, “A mathematical theory of evidence,” Princeton University Press, 1976. [Online]. Available: https://www.amazon.com/Mathematical-Theory-Evidence-Glenn-Shafer/dp/069110042X. vol. 42. [Google Scholar]
14. J. Pan and W. Tompkins, “A real-time (qrs) detection algorithm,” IEEE Transactions on Biomedical Engineering, vol. BME-32, no. 3, pp. 230–236, 1985. [Google Scholar]
15. Y., Yc and W. Wang, “Qrs complexes detection for (ecg) signal: The difference operation method,” Computer Methods and Programs in Biomedicine, vol. 91, no. 3, pp. 245–254, 2008. [Google Scholar]
16. H. Li, X. Wang, L. Chen and E. li, “Denoising and R-peak detection of electrocardiogram signal based on (emd) and im-proved approximate envelope,” Circuits, Systems and Signal Processing, vol. 33, no. 4, pp. 1261–1276, 2014. [Google Scholar]
17. H. Li and X. Wang, “Detection of electrocardiogram characteristic points using lifting wavelet transform and hilbert transform,” Transactions of the Institute of Measurement and Control, vol. 35, no. 5, pp. 574–582, 2013. [Google Scholar]
18. G. Moody and R. Mark, “The impact of the (mit-bih) arrhythmia database,” IEEE Engineering in Medicine and Biology Magazine, vol. 20, no. 3, pp. 45–50, 2001. [Google Scholar]
19. T. Mar, S. Zaunseder, J. Martnez, M. Llamedo and R. Poll, “Optimization of (ecg) classification by means of feature selection,” IEEE Transactions on Biomedical Engineering, vol. 58, no. 8, pp. 2168–2177, 2011. [Google Scholar]
20. A. Al-Fahoum and I. Howitt, “Combined wavelet transformation and radial basis neural networks for classifying life-threatening cardiac arrhythmias,” Medical & Biological Engineering & Computing, vol. 37, no. 5, pp. 566–573, 1999. [Google Scholar]
21. S. Osowski and T. Linh, “Ecg beat recognition using fuzzy hybrid neural network,” IEEE Transactions on Biomedical Engineering, vol. 48, no. 11, pp. 1265–1271, 2001. [Google Scholar]
22. G. de Lannoy, D. Francois, J. Delbeke and M. Verlysen, “Weighted svm’s and feature relevance assessment in supervised heart beat classification,” in Biomedical Engineering Systems and Technologies Communications in Computer and Information Science, vol. 127, Berlin, Heidelberg: Springer, 2010. [Google Scholar]
23. C. Lin and C. Yang, “Heartbeat classification using normalized (rr) intervals and morphological features,” in Int. Symp. on Computer, Consumer and Control, pp. 650–653, 2014. [Google Scholar]
24. S. Chen, W. Hua, J. Li and X. Gao, “Heartbeat classification using projected and dynamic features of (ecg) signal,” Biomedical Signal Processing and Control, vol. 31, pp. 165–173, 2017. [Google Scholar]
25. E. Luz, W. Schwartz, G. Camara and D. Menotti, “Ecg-based heartbeat classification for arrhythmia detection: A survey,” Computer Methods and Programs in Biomedicine, vol. 127, pp. 144–164, 2016. [Google Scholar]
26. K. Rajesh and R. Dhuli, “Classification of imbalanced (ecg) beats using re-sampling techniques and adaboost ensemble classifier,” Biomedical Signal Processing and Control, vol. 41, pp. 242–254, 2018. [Google Scholar]
27. H. Li, D. Yuan, X. Ma, D. Cui and L. Cao, “Genetic algorithm for the optimization of features and neural networks in (ecg) signals classification,” Scientific Reports, vol. 7, 2017. [Google Scholar]
28. H. Khorrami and M. Moavenian, “Comparative study of (dwt(cwt) and (dct) transformations in (ecg) arrhythmias classification,” Expert Systems with Applications, vol. 37, no. 8, pp. 5751–5757, 2010. [Google Scholar]
29. R. Martis, U. Acharya, K. Mandana, A. Ray and C. Chakraborty, “Application of principal component analysis to (ecg) signals for automated diagnosis of cardiac health,” Expert Systems with Applications, vol. 39, no. 14, pp. 11792–11800, 2012. [Google Scholar]
30. E. Houssein, A. Ewees and M. Abd Elaziz, “Improving twin support vector machine based on hybrid swarm optimizer for heartbeat classification,” Pattern Recognition and Image Analysis, vol. 28, no. 2, pp. 243–253, 2018. [Google Scholar]
31. Z. Zhang, J. Dong, X. Luo, K. Choi and X. Wu, “Heartbeat classification using disease-specific feature selection,” Computers in Biology and Medicine, vol. 46, pp. 79–89, 2014. [Google Scholar]
32. L. Honggaiang, X. Feng, L. Cao, E. Li, H. Liang et al., “A new (ecg) signal classification based on wpd and apen feature extraction,” Circuits, Systems, and Signal Processing, vol. 35, no. 1, pp. 339–352, 2016. [Google Scholar]
33. L. Hongqiang, H. Liang, C. Miao, L. Cao, X. Feng et al., “Novel (ecg) signal classification based on (kica) nonlinear feature extraction,” Circuits Systems, and Signal Processing, vol. 35, no. 4, pp. 1187–1197, 2016. [Google Scholar]
34. P. de Chazal, M. O’Dwyer and R. Reilly, “Automatic classification of heartbeats using ECG morphology and heartbeat interval features,” IEEE Transactions on Biomedical Engineering, vol. 51, no. 7, pp. 1196–1206, 2004. [Google Scholar]
35. T. Dietterich, “Ensemble methods in machine learning,” in Int. Workshop on Multiple Classifier Systems, Berlin, Heidelberg: Springer Berlin Heidelberg, ISBN 978-3-540-45014-6, pp. 1–15, 2000. [Google Scholar]
36. J. Friedman, H. Hastie and R. Tibshirani, “Additive logistic regression: A statistical view of boosting (with discussion and a rejoinder by the authors),” The Annals of Statistics, vol. 28, no. 2, pp. 337–407, 2000. [Google Scholar]
37. L. Breiman, “Bagging predictors,” Machine Learning, vol. 24, no. 2, pp. 123–140, 1996. [Google Scholar]
38. T. Dietterich and G. Bakiri, “Solving multiclass learning problems via error-correcting output codes,” Journal of Artificial Intelligence Research, vol. 2, no. 1, pp. 263–286, 1995. [Google Scholar]
39. W. Robert and D. Tax, “Experiments with classifier combining rules. in: multiple classifier systems,” in Int. Workshop on Multiple Classifier Systems, Berlin, Heidelberg: Springer Berlin Heidelberg. ISBN 978-3-540-45014-6, pp. 16–29, 2000. [Google Scholar]
40. B. Waske and J. Benediktsson, “Fusion of support vector machines for classification of multisensor data,” IEEE Transactions on Geoscience and Remote Sensing, vol. 45, no. 12, pp. 3858–3866, 2007. [Google Scholar]
41. A. Peimankar, M. Jajroodi and S. Puthusserypady, “Automatic detection of cardiac arrhythmias using ensemble learning,” in TENCON, IEEE Region 10 Conf. (TENCONOsaka International Convention Center, Osaka, Japan, 2019. [Google Scholar]
42. F. Al-Yarimi, N. Munassar and F. Al-Wesabi, “Electrocardiogram stream level correlated patterns as features to classify heartbeats for arrhythmia prediction,” Data Technologies and Applications, vol. 54, no. 5, pp. 685–701, 2020. [Google Scholar]
43. https://www.kaggle.com/shayanfazeli/heartbeat, 2018. [Google Scholar]
44. P. Cunningham, “A taxonomy of similarity mechanisms for case-based reasoning,” IEEE Transactions on Knowledge and Data Engineering, vol. 21, no. 11, pp. 532–1543, 2009. [Google Scholar]
45. Jech, Thomas. Set Theory, Springer Science & Business Media, Springer-Verlag Berlin Heidelberg, 2013. [Google Scholar]
46. R. Storn and P. Kenneth, “Differential evolution–a simple and efficient heuristic for global optimization over continuous spaces,” Journal of Global Optimization, vol. 11, no. 4, pp. 341–359, 1997. [Google Scholar]
47. M. Mitchell, J. Holland and S. Forrest, “The royal road for genetic algorithms: Fitness landscapes and (ga) performance,” in Proc. of the First European Conf. on Artificial Life, Paris, France, 1991. [Google Scholar]
48. A. Ali, and M. Padma, “CS-Ibc: Cuckoo search based incremental binary classifier for data streams,” Journal of King Saud University-Computer and Information Sciences, vol. 31, no. 3, pp. 367–377, 2019. [Google Scholar]
49. T. Alam, M. Atif, Y. Ali, A. Wahab, S. Liaz et al., “A model for early prediction of diabetes,” Informatics in Medicine Unlocked, vol. 16, 2019. [Google Scholar]
50. A. Antti, “An experimental comparison of cross-validation techniques for estimating the area under the (roc) curve,” Computational Statistics & Data Analysis, vol. 55, no. 4 pp. 1828–1844, 2011. [Google Scholar]
51. Y. Ali, A. Faroqqq, T. Alam, M. Faroq, M. Awan et al., “Detection of schistosomiasis factors using association rule mining,” IEEE Access, vol. 7, pp. 186108–186114, 2019. [Google Scholar]
 | This work is licensed under a Creative Commons Attribution 4.0 International License, which permits unrestricted use, distribution, and reproduction in any medium, provided the original work is properly cited. |