DOI:10.32604/iasc.2022.022501
| Intelligent Automation & Soft Computing DOI:10.32604/iasc.2022.022501 | |
| Article |
Aquarium Monitoring System Based on Internet of Things
1Department of Electrical Engineering, National Chin-Yi University of Technology, Taichung, 411030, Taiwan
2Department of Information Technology, Takming University of Science and Technology, Taipei City, 11451, Taiwan
*Corresponding Author: Sung-Jung Hsiao. Email: sungjung@gs.takming.edu.tw
Received: 10 August 2021; Accepted: 13 October 2021
Abstract: With the ever-increasing richness of social resources, the number of devices using the Internet of Things is also increasing. Currently, many people keep pets such as fish in their homes, and they need to be carefully taken care of. In particular, it is necessary to create a safe and comfortable environment for them and to maintain this environment continuously. An adverse environment can affect the growth of fish and may even result in their death. This study used the LinkIt 7697 module and the BlocklyDuino editor to produce a control system for a smart aquarium. The purpose of this system is to monitor the temperature, light intensity, and water level in an aquarium, as well as to provide alerts to presence of intruders; therefore, temperature, light, ultrasonic, and infrared sensing modules are used. The system has set aquarium environment thresholds, and it processes the signals obtained by the sensors to control and optimize the outputs to loads using data fusion calculations so that the aquarium has the most comfortable environment for the fish. An automatic feeder is also included in the system, and this uses a servo motor. The data from the system is uploaded to a back-end computer through the built-in Wi-Fi system of the LinkIt 7697 module. The Cloud Sandbox platform is used to display the results in real time, achieving the purpose of remote network monitoring.
Keywords: Internet of things; linkIt 7697; cloud sandbox; Wi-Fi; blocklyDuino editor
In modern society, many people keep pets to accompany them. However, in contrast to large pets such as cats and dogs, which need to spend time outdoors, pet fish only need to be fed each day and periodically have their water changed. Pet fish can provide decoration for a home and be psychologically comforting; watching them can help people to relax, and as a result many people now keep them. In a survey in the United States in 2020, it was found that of all pets, the proportion of people keeping pet fish was the largest, as shown in Fig. 1.
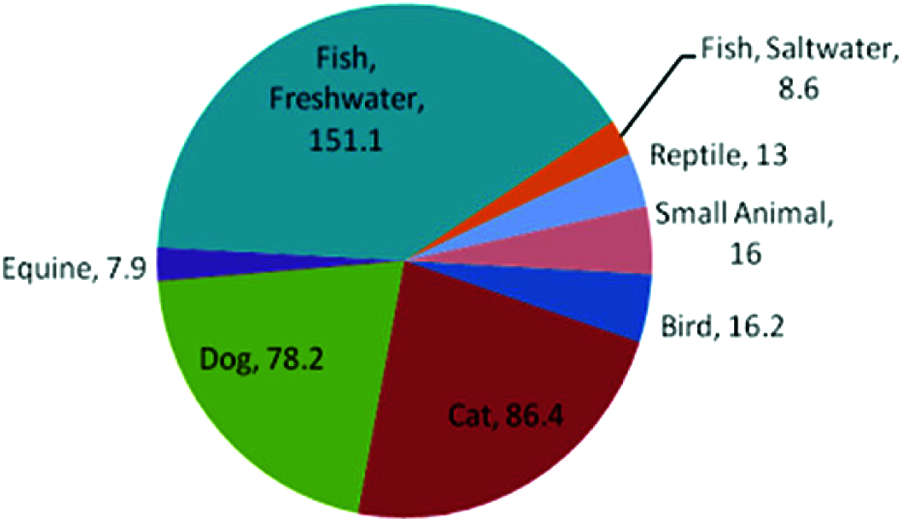
Figure 1: Proportions of different kinds of pets kept by people in the USA in the period 2017–2020
People usually spend a proportion of their time out of the home. During these periods, it is not generally possible to know whether their aquarium is experiencing an abnormal situation. In this study, Internet of Things (IoT) technology combining many environment-monitoring sensors was applied to promote the understanding of environmental changes in aquariums [1].
A threshold must be set to define the limit range of the sensed values for each sensor so that the aquarium can automatically control the value detected by the sensor according to the environment. In this way, it is possible to achieve an optimal environment for the pet fish to be in the most comfortable conditions, and the owner will not have to worry that the fish may be in danger from environmental changes. In terms of hardware, the system design uses a servo motor for automatic timing and triggering of the feeding mechanism [2]. An automatic feeding mechanism is used because if the owner overfeeds, the uneaten feed will cause water pollution; using the automatic system, the amount of feed can be appropriately controlled, neither underfeeding nor overfeeding. If the owner is out for work or traveling, they will not have to worry about the death of their fish due to hunger.
This research demonstrates, in the experimental stage, that the proposed remote aquarium monitoring system is easy to construct this system, has a low cost, and is easy to use. It can be placed in any aquarium, and it operates automatically. With the development of wireless communication technology and the IoT, people have become accustomed to using various communication products [3]. In this study, Wi-Fi was used in conjunction with a cloud-computing platform, Cloud Sandbox. With this system, users can record and observe changes in the aquarium environment at any time, and a web-based system can be used to display the data in various forms such as charts and line graphs. This allows users to understand whether the aquarium environment is abnormal. If an abnormal situation occurs, this can also be remedied immediately through the controller.
When this system is breeding fish, an owner must pay attention to the water temperature, light, feeding, and water level in the aquarium. These factors often affect fish growth [4]. If the temperature is not appropriate, it may directly affect the growth, digestion, and food absorption of the fish and it may even affect the development of embryos. Ensuring the correct water temperature can increase the activity levels of the fish [5]. When the light level is insufficient, this can cause the bodies of fish to darken and lose their luster, and some of their markings may even fade completely, decreasing their ornamental value [5]. In addition, if the water level is too high, the more active fish may jump too high in their search for food, which could cause them to jump out of the aquarium. Conversely, if the water level is too low, the fish will be affected by having a restricted range of movement, which may make them feel nervous and hit the sides of the aquarium. To avoid these problems, an appropriate water level should be configured to avoid unnecessary accidents.
In this research, a remote monitoring system for the aquarium environment was constructed using IoT technologies. This system uses a MediaTek LinkIt 7697 as the main control development platform, and its remote monitoring components include temperature, illuminance, water level, and passive infrared sensor modules. The system transmits and calculates the acquired physical sensing signals via a wireless sensor network (WSN). BlocklyDuino, the web-based visual programming editor for Arduino, was used to compile the program and transmit it to the built-in Wi-Fi communication module of the LinkIt 7697. The back-end computer displays the results on the Cloud Sandbox platform. Through this platform, it is possible to see the environmental information obtained by each sensor in real time. The system needs to maintain a comfortable environment for the fish in the aquarium. There are relays to control a heating rod, an LED light bar, two pumps for the water level, and a servo motor for the feeder. These controllers will adjust their parameters according to the best living environment for the fish and achieve the most stable and comfortable state. This information is continuously stored in a computer database, allowing users to track and record the growth of their fish [6].
For smart aquariums with IoT technology, the main focus is to maintain the environmental safety of the fish and to make timely adjustments to any changes in the environment. Therefore, the system should function automatically, stably adjusting relevant controllers to respond to environmental changes. The automatic feeding is the most important aspect of the system for keeping the fish alive. In addition to the development of automatic feeding, some monitoring functions for smart aquariums have been developed, such as monitoring of temperature, light brightness, and water level and these development projects have their advantages and disadvantages. The IoT smart aquarium monitoring system in the present work integrates these previous technology developments and improves their sensing using data fusion computing technology. Accurate calculations allow the system to reach the best possible state [7]. Tab. 1 shows a summary of previous research related to intelligent aquarium monitoring systems using the IoT.
Coetzee et al. introduced smart aquariums into the broader concept of IoT applications, making aquarium control increasingly advanced. The technology in this area can be summarized as follows: physical and virtual objects are identified and linked; the system has independent data perception and acquisition from these objects; and the data is transmitted through a wireless network. Such a smart aquarium achieves a convenient way to access data and control systems. People can apply the concept of the IoT to any field of interest. As technology becomes increasingly abundant, the IoT is also extremely important for communication. With the globality of the Internet, IoT automation has become widely used. Even compared with the original development of TCP/IP technology, the output value of the IoT will develop infinitely into the future.
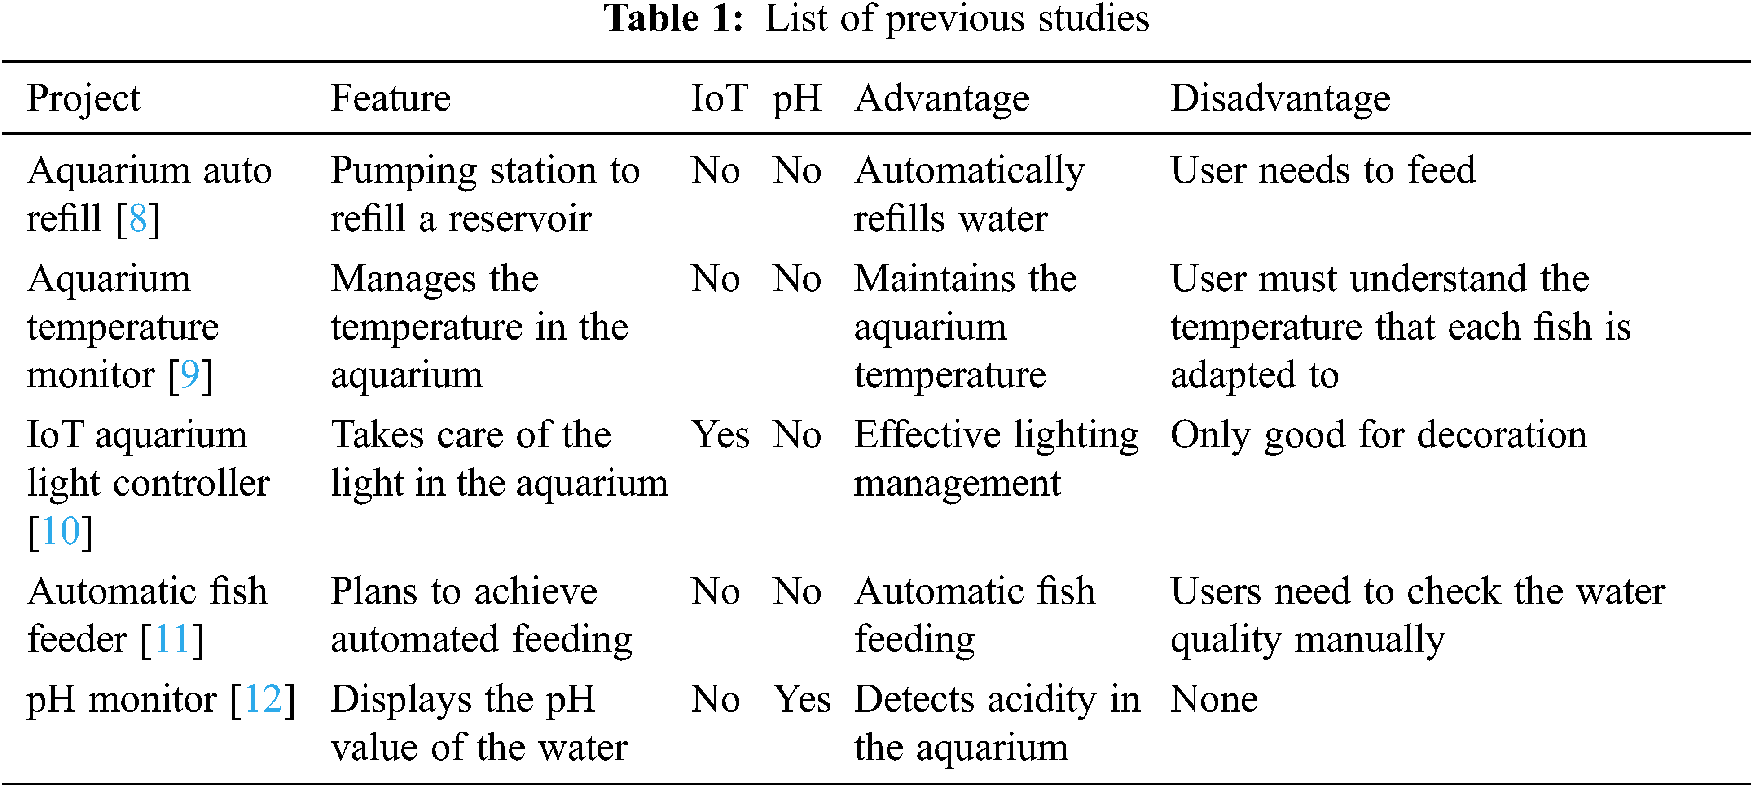
Many new products use IoT technology, and this will increase their value [13]. In addition, cloud computing platforms are becoming very widely used; they can be applied to the basic network of the IoT and can record monitoring data and provide long-term statistics. In the strict definition of the IoT, the entire architecture is a three-tier system through which the components are interconnected. These three layers are the perception layer, the network layer, and the application layer, as shown in Fig. 2. According to the current trend of the IoT being increasingly advanced, the type of number of IoT devices is becoming increasingly diverse. This is an area that many people will use for product calculation, technology development, and intelligent decision-making. There are three characteristics in the application of the IoT: observation control, big data evaluation, and information-sharing projects. These characteristics present product application and technical challenges for realizing the IoT. Let people live in the IoT era that the surrounded by big data [14].
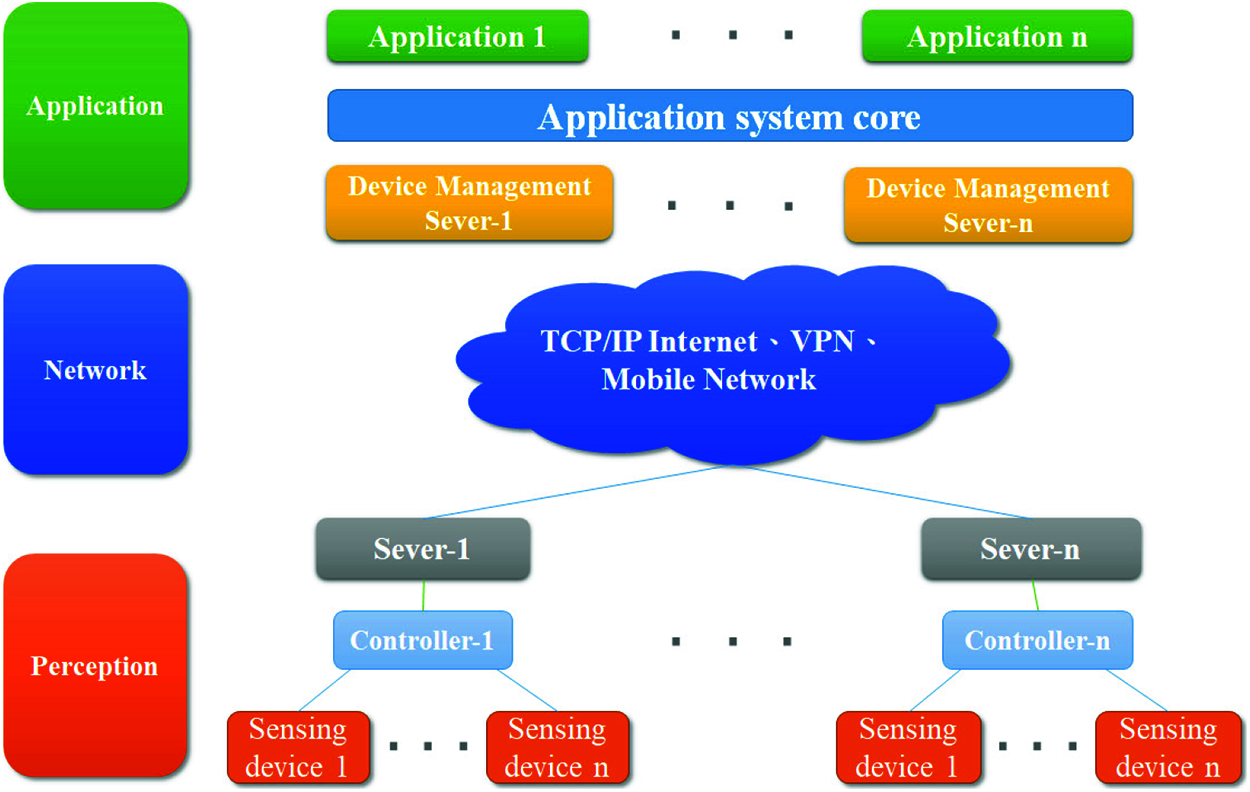
Figure 2: The three layers of the IoT
2.2 Automatic Feeder Development
As early as April 4, 1985, the concept of the first automatic feeder was designed and patented by David C. Smeltzer. In his design, a variety of high-precision feed portion sizes can be distributed. The device can achieve this by adjusting the balance, which can change the amount of water needed and produce a distribution action, while adjusting the vibration of the feeder to distinguish and distribute the amount of food. The system can control the frequency and quantity of feeding by balancing the weight. In addition, the flow of water and its speed water through the valve and water supply pipeline can be adjusted. Adding a water container and measuring the amount of water in it allows better setting of frequency parameters to improve the feeding accuracy. Faridi et al. noted that there are two types of automatic feeders, namely fixed feeders and mobile feeders. A fixed feeder is relatively practical for users who have only one pond or aquarium. A mobile feeder is more useful for those who own two or more ponds or aquariums. An automatic feeder can also be installed in a buoy on the ocean, and this can lead to detection of a wide variety of sea Life Sea using a camera and microphone or other suitable sensors. Therefore, this research refers to this technology to successfully develop an automatic feeder [15].
2.3 Wireless Communication Technologies
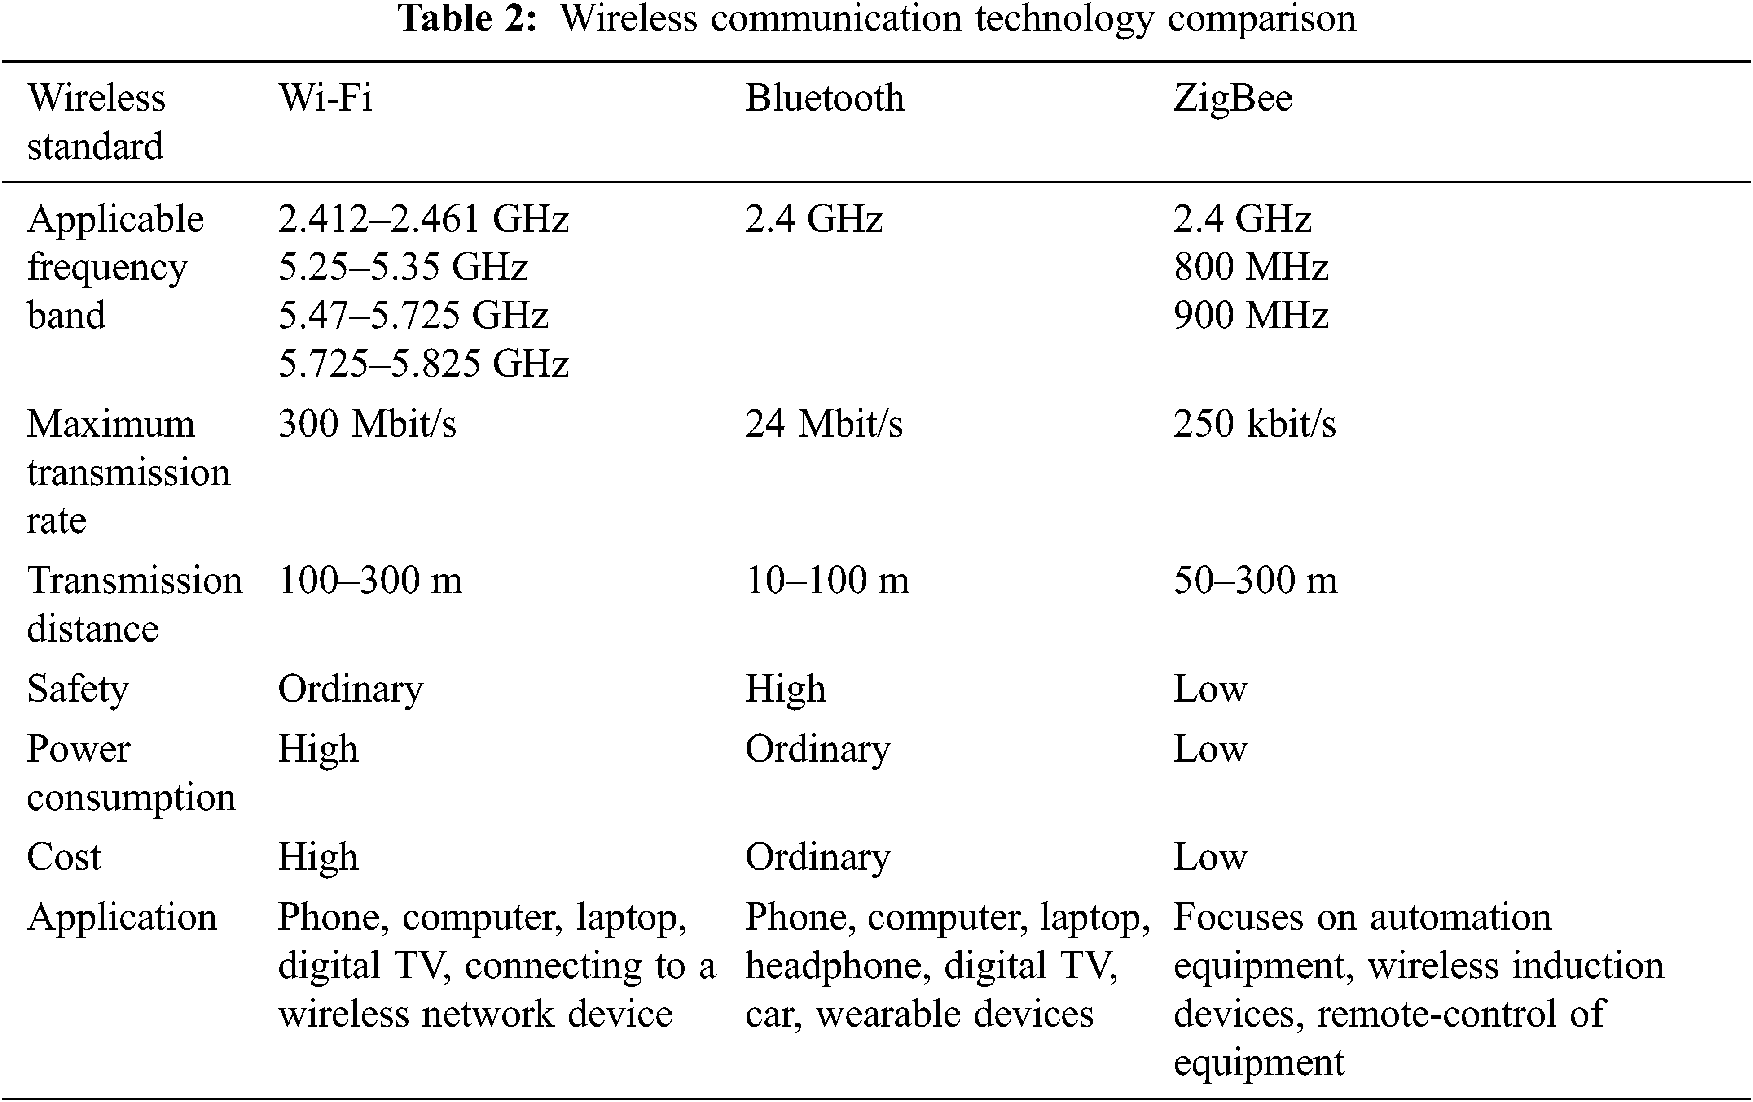
A WSN is a network system that combines one or more wireless data collectors and many sensors to communicate between components wirelessly. In the framework of WSNs, the design of sensors takes low cost as a consideration. Current wireless communication technology applications include ZigBee, Bluetooth, and Wi-Fi. The network implemented in this study used Wi-Fi for its wide-area signal transmission. The Wi-Fi specifications are the most rigorous, Wi-Fi has had the most investment from manufacturers, and its market has the largest application foundation. The Wi-Fi specifications include low-frequency 2.4 GHz, high-frequency 5 GHz, and ultra-high frequency 60 GHz, covering a wide range of applications and devices. Compared with other wireless communication technologies, Wi-Fi has a long transmission distance and a high transmission rate. In recent years, Wi-Fi has also developed towards low-power consumption. Each wireless communication technology has its own advantages and disadvantages. The three major wireless communication technologies are compared in Tab. 2.
Cloud Sandbox is a cloud platform that was adapted from the core functions of the MediaTek Cloud Sandbox (MCS), MediaTek’s IoT cloud platform. Its purpose is to develop cross-platform lightweight desktop applications that can be used on Windows, Linux, MacOS, and other common operating systems. This platform can help developers realize the technical concepts of the IoT. Cloud Sandbox can be installed quickly and is easy to use, allowing a private IoT cloud platform to be built rapidly. On the web dashboard interface of the cloud platform, the functions for collecting information from the hardware (RESTful API) can be viewed. The system provides users with a way to control devices connected to the IoT through commands issued from the dashboard. Cloud Sandbox also has a mobile application through which users can control hardware devices from anywhere. This cloud platform is an IoT service platform. Users can communicate with each other through IoT devices on the network, and they can record the collected sensing data, adjust parameters using trial and error, and then subsequently adopt remote-control strategies.
2.5 Data Fusion Based on Machine Learning
An artificial neural network (NN) is a way of abstracting and simulating the human brain to study its intelligence. Kohonen defines an NN as “a widely interconnected and parallel network composed of simple units, which can be analogous to the interactive reflection of the biological nervous system to the real world.” The most basic component of an artificial NN is therefore defined as a neuron, which is a non-linear component with multiple inputs and a single output. The neurons in an artificial NN can be connected in multiple ways to form different types of network. This study used a unidirectional propagation, multi-layer forward network, which is a relatively mature approach. Specifically, a back-propagation (BP) NN was used to study its application to data fusion. In most deep-learning NNs, BP is the current approach to updating the gradient. The basic principle of most NNs is the same, but different model designs will cause the gradient to move in different directions.
In the forward method, an input vector is given to the NN and a predicted value is output. Then, this predicted value is examined and a “loss” is calculated. This loss expresses the distance between the modeled value and the real value, and we aim for this loss to be as small as possible. The weights in the NN can be imagined as a way to adjust the loss, and we seek to understand how these weights influence it. That is, the gradient and the parameters will affect the size of the loss. The core purpose of BP is to generate the gradient and update methods. The number and the gradient affect the size of the loss. A schematic of the structure of a BPNN is shown in Fig. 3 [16].
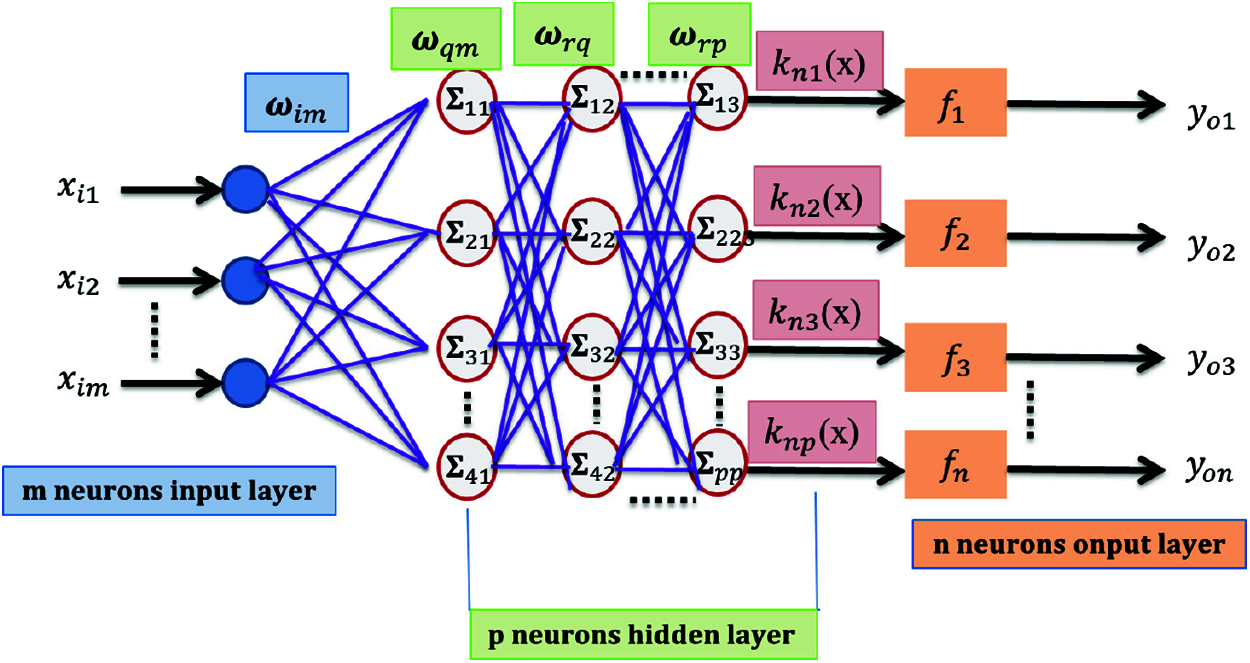
Figure 3: Schematic structure of a back-propagation neural network
Assuming that the input layer has m neurons, the hidden layer has P neurons, and the output layer has n neurons, the steps of the BPNN algorithm are as follows.
(1) Information-forwarding process.
Suppose the weight between any two nodes i and j in different layers is wij. The threshold of node j is bj, and the input node i has no threshold. The input value of node xj is then:
where f is the activation function, which is usually a Sigmoid function:
Error information reverses the transmission process.
The main function of this stage is to use the minimum error function E to continuously adjust the weights and thresholds. According to the gradient descent method, the starting function is derived, the weight wij between two nodes is adjusted as shown in Eq. (4), and dj represents the results of the output:
The threshold value bj for the output node is adjusted using:
The weight value of the node between the input layer/hidden layer and the hidden layer/output layer is then adjusted using:
and threshold adjustment of the input node is:
The steps of the data fusion process using the BPNN are as follows.
(1) Preprocessing of sensor data. Here, this mainly refers to normalization of the data to be input into the NN.
(2) Determining the numbers of nodes in the input layer, hidden layer, and output layer.
(3) Using the forward information-transfer process in the BPNN algorithm to determine the transfer function.
(4) Using the error information reverse-transmission process in the BPNN algorithm to determine the rules.
In summary, the data recognition and fusion processes can be completed at the same time, therefore the algorithm is not overly complicated and the fusion efficiency is high. However, due to the need to continuously advance the minimum error function, this method is highly dependent on the original data. In particular, a large number of training samples is required to obtain a better degree of recognition. In IoT data fusion algorithms, BPNNs are widely used for feature extraction and classification of node data. In solving the problem of slow convergence in a BPNN, it is easy to fall into local optimal values and achieve poor generalization, affecting the data fusion. Here, we propose to integrate deep learning into the BP data fusion algorithm; that is, the number of hidden layers is set to P, and the BPNN is replaced by a deep learning model based on stacked auto encoders. The experiments in this study show that the proposed data fusion algorithm has roughly the same energy consumption. In this case, the system also has a higher rate of correct feature extraction and classification [17–19].
The system can be divided into three parts: environmental sensing, load control, and the terminal computer. Environmental sensing includes circuit modules such as those for temperature sensing, ultrasonic distance sensing, human infrared sensing, and illumination sensing. The load-control part includes the heating rods, pump motors, LED lighting, buzzer warning mechanism, and automatic feeder. The system transmits the environmental data sensed by the smart aquarium to the terminal computer through Wi-Fi, BlocklyDuino is used in the terminal computer to compile these data, and it is then uploaded to Cloud Sandbox. Finally, the results of the measured environmental parameters are displayed in real time, and a general user can use a smart mobile device to obtain current environmental information about the smart aquarium at any time and in any place. In the subsequent stage, the system records the acquired environmental data and stores it in the terminal computer for the user to perform subsequent queries and analysis, providing the user with a direction for subsequent decision making. A schematic of the system architecture is shown in Fig. 4.
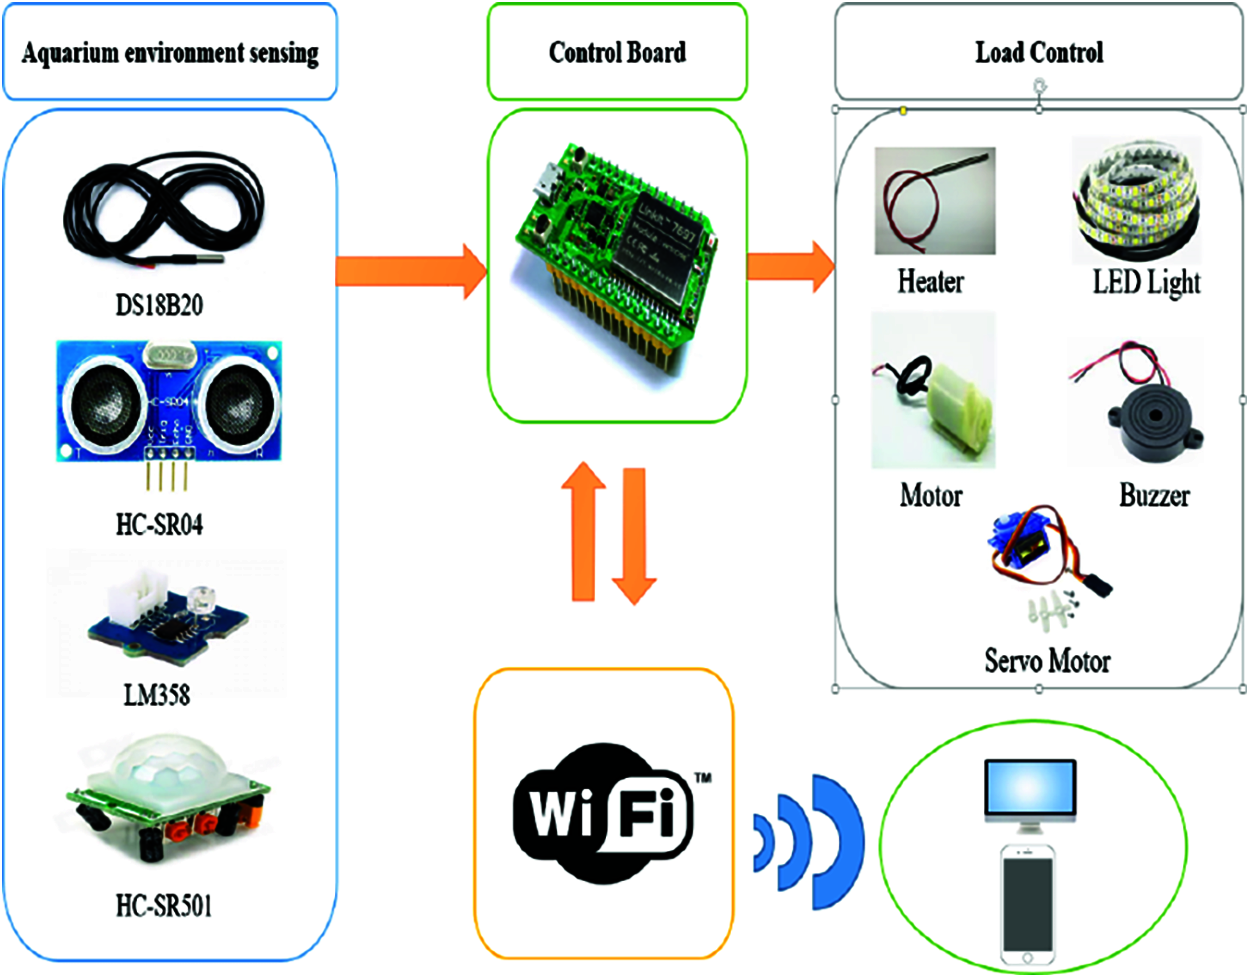
Figure 4: Schematic of the system architecture
Fig. 5 shows a complete flow chart of the system, representing its overall working procedure. As noted earlier, the programming system used in this study was BlocklyDuino. Before the program starts, first, the sensors are initialized, and then the water temperature of the smart aquarium is sensed and a signal is sent to the LinkIt 7697 chip. In the design of the program, the system requires a set temperature threshold. The temperature of the aquarium is usually set between 22°C and 28°C, as this is the most comfortable environmental range for pet fish. If the temperature is lower than 22°C, the system will activate the heating rod through a relay and the water will be heated until it reaches the set range. The system uses an ultrasonic sensor for water-level sensing. This is fixed on the top edge of the aquarium, and a distance threshold of 15 cm was set. When the distance measured by the ultrasonic sensor is greater than 15 cm, the system turns on a water pump using a relay and fills up the water to the proper level. This system additionally uses the setting of the illuminance sensor, the purpose of which is to set the environmental brightness to a comfortable range for the fish (750–1500 lux). When the light around the smart aquarium is lower than 750 lux, the system will turn on the LED tube to the appropriate level. When the surrounding light is greater than 1500 lux, the brightness of the LED tube will be reduced to maintain a stable and suitable light source for the fish.
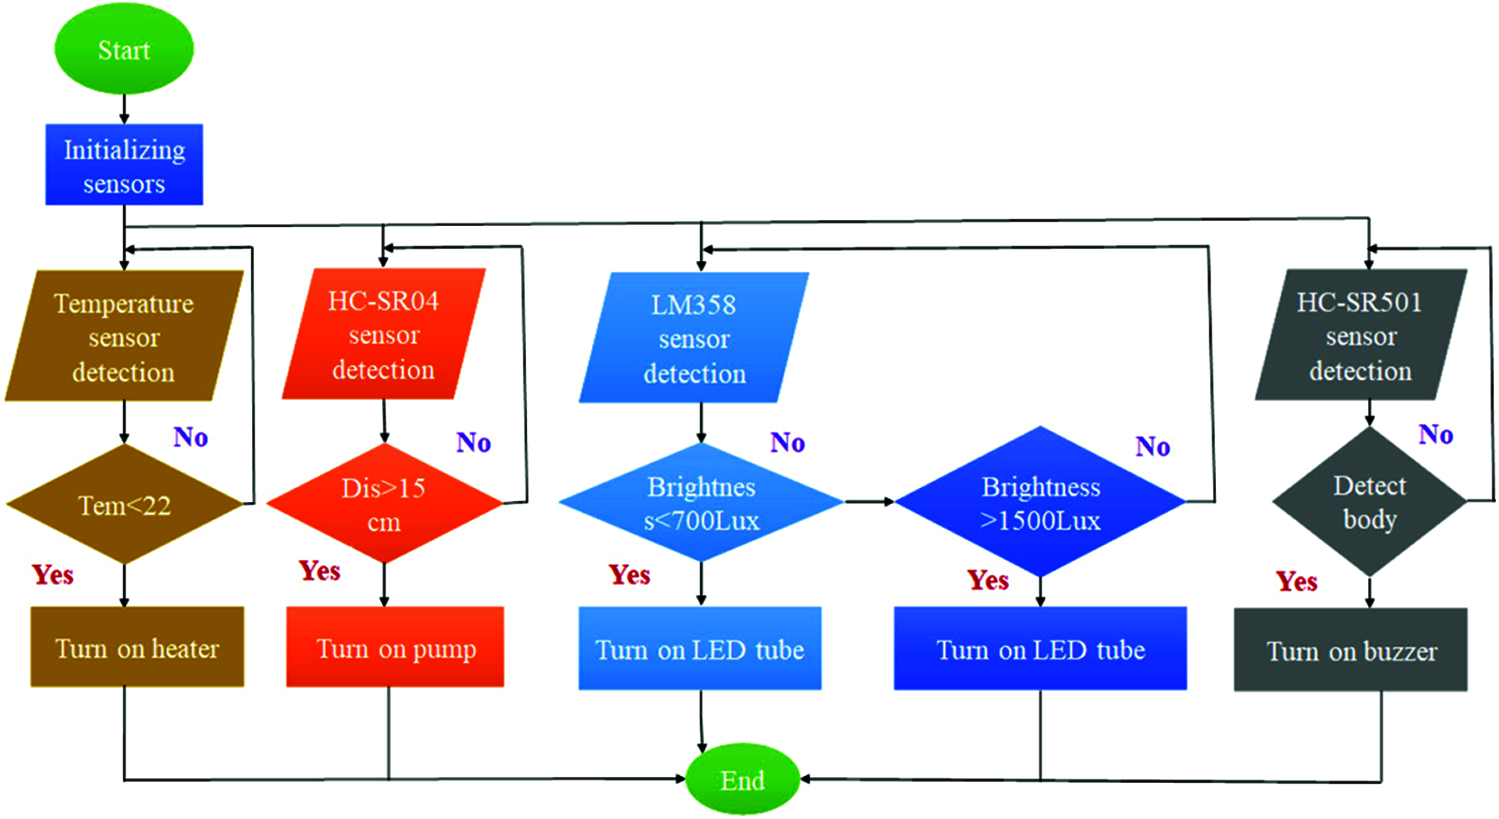
Figure 5: System flowchart
The system is also equipped with a passive infrared sensor, and this is set to monitor the area around the aquarium. When the system detects movement around the aquarium, a warning sound will notify the user. The object of this sensor is mainly to prevent the fish in the aquarium being stolen or affected by foreign objects in the water when the owner is out or resting at night. In addition, the system is equipped with the function of automatic feeding. The feeding system has a servo motor installed on the feed box, and two set times are provided for feeding, specifically noon and evening. When the feeding time comes, the servo motor will rotate 180° to release feed. Released into the aquarium, the number of rotations will be set at three times; this is to avoid falling too much food, leading to deterioration of water quality and waste of feed [20].
3.2.1 LinkIt 7697 Expansion Board
As noted, the main development version of the LinkIt 7697 was used in this work. This is based on the MT7697 system single-chip module, as shown in Fig. 6a. This circuit module has an ARM Cortex-M4 microcontroller with floating-point arithmetic functions, and it integrates an 802.11b/g/n Wi-Fi wireless network controller and Bluetooth 4.2 with low-power functions [21].

Figure 6: (a) LinkIt 7697 single-chip system (b) linkIt 7697 expansion board
As this system is an experimental development version, the LinkIt 7697 has a UART TX LED serial port. When new data is transmitted to the computer, the LED light will flash, and the system can establish whether the data has been successfully transmitted. This is connected to the computer via a Micro-USB cable, which is mainly used to download programs or print logs. The LinkIt 7697 can also be programmed through the additional expansion connection in the experiment. There is an additional Micro-USB port above the expansion board for connection. A single board using the LinkIt 7697 only needs the Micro-USB port to be connected, as shown in Fig. 6b. As noted, the LinkIt 7697 microcontroller has built-in Wi-Fi and Bluetooth. In this study, Wi-Fi was used to capture the data measured by each sensor; the system uses the Wi-Fi to upload the data to the computer for recording and analysis of the environmental status of its aquarium. Control commands are also transmitted by Wi-Fi from the computer to the LinkIt 7697 development version. The system has the ability to activate every piece of control hardware as required and to perform subsequent control actions.
For most fish, temperature is a very important environmental factor. If the temperature is too high or too low, it will affect their growth. When the water temperature be changed by a large amount, the damage to the fish will be greater, so the temperature of the aquarium needs to be set within an optimal range. The temperature sensor used in this study was a DS18B20, which is waterproof and has high thermal conductivity. Its structure uses sealant potting to ensure high sensitivity and a minimum sensing time delay, as shown in Fig. 7a. This temperature sensor supports single-wire transmission on the “1-Wire” interface, therefore only a single wire is needed to receive the temperature data, which greatly improves the anti-interference performance of the system. Compared with other temperature sensors, the DS18B20 is suitable for field temperature measurements in harsh environments as it has a wide temperature measurement range (−55°C to 125°C). Between −10°C and 85°C, its temperature measurement accuracy is ±0.5°C. Its working voltage is 3.0–5.5 V [22].

Figure 7: (a) DS18B20 sensor (b) HC-SR501 sensor module
The HC-SR501 passive infrared sensor used for motion detection is one of the most common components used in such systems, and an example of this board is shown in Fig. 7b. This device detects the movement of objects through changes in infrared radiation in its field of view. Human and animal bodies emit infrared radiation over a relatively large area, so they are easy to detect. This module has a photosensitive R-L function that allows it to work in the dark, only operating when triggered, which can save battery life. This sensor also has a temperature-compensation function. On the board, at the position marked RT, there is a welded thermistor, and its resistance will change with the surrounding temperature. When the temperature is higher than 32°C, using the thermistor can improve the sensing performance of the module. The module has two variable resistors that can be used to adjust the sensitivity and the delay time. When an object enters the sensing range, the sensor will output a high potential. When the object leaves the sensing range, this high potential will automatically be turned off after the delay and a low potential will be output. Therefore, this sensor is very suitable for prevention of theft and detection of intrusion by foreign bodies.
An HC-SR04 ultrasonic sensor was used for water-level sensing, as shown in Fig. 8a. Ultrasound is high-frequency sound that cannot be heard by the human ear. Ultrasonic sensing in this device is conducted using ultrasonic transmitting and receiving control circuits, as shown in Fig. 8b. When the sensor is triggered, it emits a series of 40 kHz sound waves and receives an echo from the object closest to it. The time taken for the sound to travel back and forth between the sensor and the object is then measured and this is converted into a distance. Therefore, the ultrasonic sensor was placed on the top of the aquarium to measure the current water level.

Figure 8: Ultrasonic sensor: (a) HC-SR04 circuit board, and (b) HC-SR04 principle
A GY-30 illuminance sensing module is used in the system to measure light levels. As shown in Fig. 9, this module is based on the BH1750FVI chip. It uses the I2C communication mode and has a built-in 16-bit analog-to-digital converter. It can directly output digital data and analyze and detect whether the light intensity changes within the range set by the system using the collected light-intensity data. The working voltage of this sensor is 4.5 V, and the measuring range of the mask intensity is 0–65 525 lux.
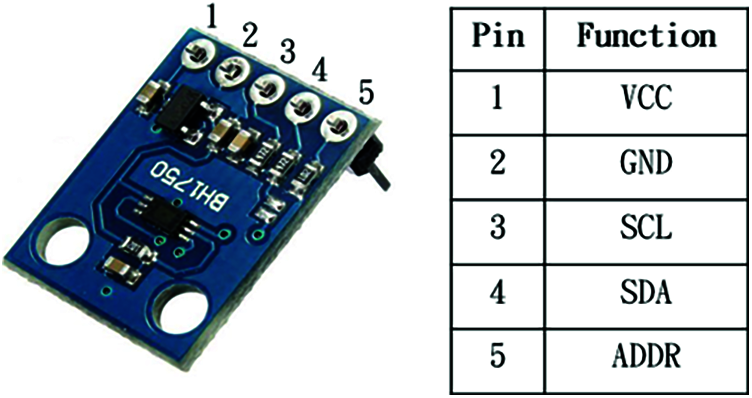
Figure 9: GY-30 illuminance sensor and its pin connections
Many owners make the mistake of overfeeding. When an excessive quantity of feed is added to a tank, the uneaten feed settles down after a period of time and causes the water to become polluted. Feeding is only needed twice a day, and an appropriate amount of feed should be given each time to prevent the water from becoming polluted. The automatic feeder, as shown in Fig. 10a, controls the amount of feed and its timing.

Figure 10: (a) Feeder hopper, (b) aquarium heater, (c) water pump, (d) LED light, (e) buzzer alarm
The purpose of the heater in this system Fig. 10b is to stabilize the temperature in the water. The ambient temperature required by the fish must be maintained throughout the smart aquarium. When the weather is relatively cold, a heater is needed to increase the water temperature. If the temperature of the water falls outside the set range, this can easily cause damage to the fish. Therefore, a heater is required to keep the water temperature within the set range.
Miniature direct-current (DC) water pumps, as shown in Fig. 10c, have water outlets and inlets. Over time, the water in the aquarium will usually evaporate or its oxygen content will decrease. This will limit the activities of the fish in the water and potentially affect their survival. Therefore, when the water evaporates or the oxygen content drops to a certain level, a water pump is required to return the water to a set level, and the water is exchanged in a cycle. The working voltage of the water pump used in this study is 3–5 V DC, its maximum rated current is 0.2 A, and its flow rate is 1.2−1.6 L/min.
The lighting of the smart aquarium will affect the natural growth of some algae and fish. Furthermore, it also affects the overall appearance of the aquarium. If the light is too bright or too dark, this will affect the performance, growth, and viability of the fish. Even worse, it may cause the brighter markings on their bodies to be lost and decrease their original value. Therefore, in aquarium environments for different types of fish, the system will use an LED strip, as shown in Fig. 10d, to adjust the illumination to the appropriate value.
In many cases, when the owner is not near the aquarium and they have more valuable fish, they may be vulnerable to theft or the intrusions of cats and dogs. As such, an alarm mechanism is needed to notify the owner. Naturally, when the owner is at home, this alarm mechanism will be turned off, but the alarm system can be activated when the owner is not near the aquarium. This can avoid regrettable incidents. Here, a buzzer, as shown in Fig. 10e, is used as an alarm device.
The LinkIt 7697 BlocklyDuino editor was used for the software design in this study. The development of this software meets the requirements of LinkIt 7697, the MCS cloud service, and the peripheral vision program editor. Developers can create applications through modules, and the system block area has many functions for users to give instructions, as shown in Fig. 11a. The blocks can also be converted into an Arduino compiler program to directly design the actual flow of the program, as shown in Fig. 11b. If a more advanced design method is required, the Arduino IDE can be used to compile the program. The BlocklyDuino software can also simplify more complicated Wi-Fi settings or Bluetooth connections; MCS cloud service connections, and peripheral load control. This means that easy-to-understand, practical building blocks can be constructed, and the system is thus very suitable for interactive learning with basic hardware. This is the initial stage for users to learn how to design an IoT system [23].

Figure 11: (a) BlocklyDuino compiler environment, and (b) converting blocklyDuino to arduino code
When all the programs are compiled, the user can observe the values sensed in the module through a PuTTY window, as shown in Fig. 12a. Wi-Fi can also be used to connect to the MCS cloud platform, as shown in Fig. 12b, and data can be displayed in real time on a web page. The data channels of the MCS platform are divided into two: the control channel (controlling the development board from the cloud) and the display channel (after collecting the data on the development board, uploading the data to the cloud and displaying it). Each test device has a unique DeviceId and DeviceKey, and the software running on the development board connects to the cloud device using these values, as shown in Fig. 12c. The DeviceId and DeviceKey will be applied to important data of big data during development.

Figure 12: (a) PuTTY data display, (b) Wi-Fi and MCS connection, and (c) MCS cloud platform
4 Analysis of Experimental Results
After the hardware construction and programming are completed, the data measured by each sensor can be obtained on the MCS platform. Through these data, the smart aquarium monitors the water temperature, water level, and illuminance, as shown in Fig. 13a. This system also uses passive infrared sensors to monitor the surroundings of the smart aquarium, and it automatically controls the load corresponding to each sensor so that the system can achieve a stable and suitable environment for the activities of the fish. In addition, the collected sensing values can be converted into line graphs for visual recording of long-term trends. The following information can be observed from the recorded data. As shown in Fig. 13b, the part of the water temperature framed in red indicates that the results of the measurement during this time are relatively unstable, while the temperature is maintained at about 25°C during other times. This experiment also included data from lower-temperature conditions. In the tests, when the aquarium was placed in an air-conditioned space, it can be seen that the temperature was successfully maintained at a certain level. As such, this experimental project demonstrates that the temperature-control system can produce a stable temperature, as shown in Fig. 13c.

Figure 13: (a) MCS sensor data, (b) relatively unstable data, and (c) stable MCS measurement effect
Regarding the water level, we can observe that the black frame in Fig. 14a shows extraction of water from the aquarium, and the red frame shows the pump increasing the water level to almost full. Regarding the illuminance, since the aquarium is usually placed at the entrance and exit of a room, when someone leaves, the indoor lights will be turned off, and when someone comes in, they will be turned on again. As such, it can be seen that the line graph of illuminance Fig. 14b is relatively uneven.

Figure 14: (a) Water level (b) illumination when people are present (c) illumination when people are resting
Each controller is used to maintain the best environmental conditions in the smart aquarium. When people are preparing to rest at night, they will be likely to turn off the lights in the aquarium. It can be seen in Fig. 14c that the illumination detected by the sensor during this time is relatively low.
As noted earlier, the water temperature suitable for most pet fish is in the range 22°C–28°C. In this study, the water temperature threshold was set at 28°C. When the water temperature of the aquarium is lower than 28°C, the heater is automatically turned on through a relay, and the water temperature is heated to 28°C. When the water temperature reaches 28°C, the heater is turned off. This setting can keep the smart aquarium within a set range without the problem of excessive temperature differences. Regarding the application of the ultrasonic sensors, the water level of the aquarium should not be too low, as this will limit the living environment of the pet fish. Furthermore, the water level should not be too high; otherwise the fish will be able jump out of the tank when feeding. Therefore, an ultrasonic sensor was installed at the top of the aquarium, and the water level was set to a reference value of about 10 cm. When the water level sensed by the sensor is greater than 10 cm, the load pump motor will automatically turn on and adjust the water level until it reaches the reference position. Regarding the lighting, if it is too dark or too bright, this will affect the growth of the fish and possibly even their appearance. The normal indoor illuminance range (750–1500 lux) is also the illuminance required by some pet fish. Therefore, when the illuminance is less than 750 lux, the LED load will automatically be turned on, and when the illuminance is greater than 15 000 lux, the LED load will automatically be turned off. Next is the automatic feeder experiment. As noted, many owners will make the mistake of feeding their fish several times a day. The first reaction of the fish when they see the food is to eat it, but too much feeding will cause food residue to sink to the bottom. This will lead to the aquarium needing to be cleaned. Therefore, the inclusion of an automatic feeding component is appropriate. In fact, pet fish can go without eating for several days without dying. In this study, the automatic feeding was divided into two periods, namely noon and evening. At the appropriate times, the feeder will automatically turn on and release the right amount of feed to avoid contamination of the smart aquarium. The last experiment regards the use of passive infrared sensors to detect whether people or foreign objects invade the smart aquarium. When the owner is working or resting, the automatic detection function will be activated. When something approaches the aquarium, the infrared sensor will trigger the buzzer. This can also be indicated through the cloud platform.
Finally, the data captured by the sensors and the activations of loads are stored every half hour so that the state of the system can be analyzed over long periods to judge whether it is stable. First, it can be seen from Fig. 15 that the temperature is maintained between 26°C and 28°C; when the temperature is lower than 28°C, the heater will automatically turn on. According to the actual measurement results of the system, it can be judged that the system can automatically deal with problems when they are encountered. The further statistical graphs of system measurements shown in Fig. 15 can be used to verify the stability of the proposed smart aquarium system and the data fusion method based on machine learning.

Figure 15: Aquarium environmental data: (a) temperature, (b) illuminance, (c) water level, (d) controller, (e) alarm and feeder, (f) long-term record in the cloud database
In this study, we added aquarium monitoring systems to the broader concept of the IoT, using many sensors and the LinkIt 7697 as a development board. Through the low-power Wi-Fi included on the development board, the water temperature, water level, and illuminance of the aquarium, are monitored, along with infrared detection of movement in the vicinity of the aquarium, and the data monitored by these sensors is uploaded to the MCS cloud platform where it can be saved. This allows users to analyze long-term stored data and to understand the current environmental status of the smart aquarium in real time. This system controls load devices according to the environmental conditions required by the smart aquarium, matching the data collected by each sensor, using its program to compile the parameters of the environment and control them according to the required functions of the system. Therefore, when problems are encountered, the system can automatically solve them, achieving a stable environment. This research, which uses data fusion based on machine learning, has achieved a low-cost design and effectively realized the remote monitoring of smart aquariums using the IoT.
Although these items can effectively reduce costs, it is hoped that more sensor modules can be added, such as a pH sensor and image-recognition functions. This would be very useful for monitoring the water quality and feeding the fish. It would also help to improve the overall monitoring of the smart aquarium environment. In future work, we intend to gradually expand the experimental system and make timely equipment improvements so that the smart aquarium system will have more functions and features, making it easier for users to operate and maintain it.
Acknowledgement: This research was supported by the Department of Electrical Engineering at National Chin-Yi University of Technology. The authors would like to thank the National Chin-Yi University of Technology, Takming University of Science and Technology, Taiwan, for supporting this research. We thank Cwauthors (https://www.cwauthors.com) for its linguistic assistance during the preparation of this manuscript.
Funding Statement: The authors received no specific funding for this study.
Conflicts of Interest: The authors declare that they have no conflicts of interest to report regarding the present study.
1. Y. B. Lin, Y. W. Lin, C. M. Huang, C. Y. Chih and P. Lin, “IoT talk: A management platform for reconfigurable sensor devices,” IEEE Internet Things, vol. 4, no. 5, pp. 1152–1562, Oct. 2017. [Google Scholar]
2. J. H. Chen, W. T. Sung and G. Y. Lin, “Automated monitoring system for the fish farm aquaculture environment,” in Proc. 2015 IEEE Int. Conf. on Systems, Man, and Cybernetics(SMCHong Kong, China, pp. 1161–1166, 2015. [Google Scholar]
3. A. K. P. M. Daud, N. A. Sulaiman, Y. W. M. Yusof and M. Kassim, “An IoT-based smart aquarium monitoring system,” in Proc. 2020 IEEE 10th Symp. on Computer Applications & Industrial Electronics (ISCAIEMalaysia, pp. 277–282, 2020. [Google Scholar]
4. Y. Kim, N. Lee, B. Kim and K. Shin, “Realization of IoT based fish farm control using mobile App,” in Proc. 2018 Int. Symp. on Computer, Consumer and Control (IS3CTaichung, Taiwan, pp. 189–192, 2018. [Google Scholar]
5. Y. Wen, M. Li and Y. Ye, “Mapreduce-based BP neural network classification of aquaculture water quality,” in Proc. 2020 Int. Conf. on Computer Information and Big Data Applications (CIBDAGuiyang, China, pp. 132–135, 2020. [Google Scholar]
6. S.-J. Hsiao and W.-T. Sung, “Building a fish–vegetable coexistence system based on a wireless sensor network,” IEEE Access, vol. 8, pp. 192119–192131, 2020. [Google Scholar]
7. H. V. Bjelland, M. Føre, P. Lader, D. Kristiansen, I. M. Holmen et al., “Exposed aquaculture in Norway,” in Proc. OCEANS 2015-MTS/IEEE Washington, Washington, DC, USA, pp. 1–10, 2015. [Google Scholar]
8. A. Faroqi, M. A. Ramdhani, L. Kamelia, C. Hidayat and A. Rofiq, “Automatic water clarity monitoring and filtration system using light dependent resistor based on arduino uno,” in Proc. 2018 4th Int. Conf. on Wireless and Telematics (ICWTNusa Dua, Bali, Indonesia, pp. 1–4, 2018. [Google Scholar]
9. M. A. Hye, M. M. Akter, A. M. Jahangir and H. U. Zaman, “A novel design and implementation of automated feeding mechanism in fish aquariums,” in Proc. 2018 2nd Int. Conf. on Electronics, Materials Engineering & Nano-Technology (IEMENTechKolkata, India, pp. 1–7, 2018. [Google Scholar]
10. N. H. Harani, A. S. Sadiah and A. Nurbasari, “Smart fish feeder using arduino uno with fuzzy logic controller,” in Proc. 2019 5th Int. Conf. on Computing Engineering and Design (ICCEDSingapore, pp. 1–6, 2019. [Google Scholar]
11. K. N. Hairol, R. Adnan, A. M. Samad and F. A. Ruslan, “Aquaculture monitoring system using arduino mega for automated fish pond system application,” in Proc. 2018 IEEE Conf. on Systems, Process and Control (ICSPCMelaka, Malaysia, pp. 218–223, 2018. [Google Scholar]
12. F. Budiman, M. Rivai and M. A. Nugroho, “Monitoring and control system for ammonia and pH levels for fish cultivation implemented on raspberry pi 3b,” in Proc. 2019 Int. Seminar on Intelligent Technology and Its Applications (ISITIASurabaya, Indonesia, pp. 68–73, 2019. [Google Scholar]
13. M. J. M. Autos, S. K. S. Falculan, J. J. A. Fortin, J. F. Mendoza, A. L. F. Sigue et al., “Automated aquaponics system and water quality monitoring with SMS notification for tilapia industry,” in Proc. 2020 IEEE Region 10 Conf. (TENCONOsaka, Japan, pp. 367–372, 2020. [Google Scholar]
14. J. H. Han, Y. S. Shin and S. H. Lee, “A smart mobility creating smart space: 3D smart aquarium bus,” in Proc. 2019 IEEE Transportation Electrification Conf. and Expo, Asia-Pacific (ITEC Asia-PacificSeogwipo, Korea (Southpp. 1–5, 2019. [Google Scholar]
15. K. J. Shin and A. V. Angani, “Development of water control system with electrical valve for smart aquarium,” in Proc. 2017 Int. Conf. on Applied System Innovation (ICASISapporo, Japan, pp. 428–431, 2017. [Google Scholar]
16. K. J. Shin, A. Varma Angani and M. Akbar, “Fully automatic fluid flow control system for smart vertical aquarium,” in Proc. 2017 Int. Conf. on Applied System Innovation (ICASISapporo, Japan, pp. 424–427, 2017. [Google Scholar]
17. M. A. Islam, D. T. Anderson, A. J. Pinar, T. C. Havens, G. Scott et al., “Enabling explainable fusion in deep learning with fuzzy integral neural networks,” IEEE Transactions on Fuzzy Systems, vol. 28, no. 7, pp. 1291–1300, 2020. [Google Scholar]
18. W. Wang and M. Zhang, “Tensor deep learning model for heterogeneous data fusion in internet of things,” IEEE Transactions on Emerging Topics in Computational Intelligence, vol. 4, no. 4, pp. 32–41, 2020. [Google Scholar]
19. N. Kussul, A. Shelestov, M. Lavreniuk, I. Butko and S. Skakun, “Deep learning approach for large scale land cover mapping based on remote sensing data fusion,” in Proc 2016 IEEE Int. Geoscience and Remote Sensing Symp. (IGARSSBeijing, China, pp. 198–201, 2018. [Google Scholar]
20. H. N. Vishwas and S. Ullas, “Remotely monitored energy efficient method for aquaculture using smart devices,” in Proc. 2019 Int. Conf. on Advances in Computing, Communication and Control (ICAC3Mumbai, India, pp. 1–6, 2019. [Google Scholar]
21. R. Harianja, N. Pangaribuan, L. Sinaga, E. R. Sembiring, P. Siagian et al., “Smart monitoring apps for salvaging neolissochillus thienemanni sumateranus (batak heritage) from extinction,” in Proc. 2017 Int. Conf. on Electrical Engineering and Computer Science (ICECOSPalembang, pp. 56–60, 2017. [Google Scholar]
22. J. Liang, Z. Fu, X. Lei, X. Dai and B. Lv, “Recognition and classification of ornamental fish image based on machine vision,” in Proc. 2020 Int. Conf. on Intelligent Transportation, Big Data & Smart City (ICITBSVientiane, Laos, pp. 910–913, 2020. [Google Scholar]
23. N. Mahfuz and S. M. Al-Mayeed, “Smart monitoring and controlling system for aquaculture of Bangladesh to enhance robust operation,” in Proc. 2020 IEEE Region 10 Symp. (TENSYMPDhaka, Bangladesh, pp. 1128–1133, 2020. [Google Scholar]
 | This work is licensed under a Creative Commons Attribution 4.0 International License, which permits unrestricted use, distribution, and reproduction in any medium, provided the original work is properly cited. |