DOI:10.32604/iasc.2022.023261
| Intelligent Automation & Soft Computing DOI:10.32604/iasc.2022.023261 | |
| Article |
Research on Thunderstorm Identification Based on Discrete Wavelet Transform
1Nanjing University of Information Science & Technology, Nanjing, 210044, China
2Engineering Research Center of Digital Forensics, Ministry of Education, Nanjing, 201144, China
3Nanjing University (Suzhou) high and New Technology Research Institute, Suzhou, 215123, China
4Jiangsu Union Technical Institute, Wuxi, 214145, China
5Department of Electrical and Computer Engineering, University of Windsor, Windsor, N9B 3P4, Canada
*Corresponding Author: Jin Han. Email: hjhaohj@126.com
Received: 01 September 2021; Accepted: 28 October 2021
Abstract: Lightning has been one of the most talked-about natural disasters worldwide in recent years, as it poses a great threat to all industries and can cause huge economic losses. Thunderstorms are often accompanied by natural phenomena such as lightning strikes and lightning, and many scholars have studied deeply the regulations of thunderstorm generation, movement and dissipation to reduce the risk of lightning damage. Most of the current methods for studying thunderstorms focus on using more complex algorithms based on radar or lightning data, which increases the computational burden and reduces the computational efficiency to some extent. This paper proposes a raster-based DWT (discrete wavelet transform) method for thunderstorm identification, this method uses DWT, CFSFD (clustering algorithm for fast search and finding density peaks) algorithm and ADTD (active divectory topology diagrammer) lightning location data for thunderstorm identification. The advantage of this method is that it supports different spatial resolutions and can identify any shape and number of thunderstorms at the same time and in the same area. It is effective in eliminating some of cluttered, scattered lightning data and extracting dense areas of thunderstorms. Furthermore, the method has a time complexity of O(n), and the computational efficiency is significantly better than the current TITAN (thunderstorm identification, tracking, analysis, and nowcasting) algorithm, which provides a good basis for subsequent extrapolation studies of thunderstorms.
Keywords: Thunderstorm identification; dwt; clustering algorithm
Thunderstorms are a kind of localized strong convective weather, commonly found in tropical and temperate regions, and their occurrence is often accompanied by natural phenomena such as lightning strikes and lightning. This has resulted in many irreparable economic losses, which are increasing year by year. Therefore, the forecasting of thunderstorm activity has received wide attention from meteorological industry and community. So far, the vast majority of lightning prediction methods have tried to find the relationship between relevant meteorological factors and lightning occurrence, and use this relationship to predict the occurrence of thunderstorms. The study of thunderstorms is divided into three main areas: identification, tracking, and extrapolation prediction of thunderstorms. The basis for making extrapolation predictions is the accurate identification of thunderstorms and tracking. Currently, two major areas of research on thunderstorms are based on machine learning algorithms and deep learning [1]. Different research methods use different data to study thunderstorms. The radar echo extrapolation method is widely used in proximity forecasting, which is based on radar data. Lightning data itself is also a valuable reference factor, because thunderstorm activity is always accompanied by strong discharge phenomena. Lightning data can record the specific moment and location of lightning, allowing a macroscopic view of the distribution and direction of lightning, and it well reflects the change of strength and movement trend of thunderstorm activity. In this paper, we propose a thunderstorm identification algorithm based on rasterized data, using DWT, CFSFD algorithm and lightning data to perform thunderstorm identification. The method casts lightning location data into the cut geographic raster data and combines DWT and CFSFD algorithm to extract dense thunderstorm areas. The method not only improves the accuracy of thunderstorm identification at the same time and under the same area, but also breaks the limitations of previous research methods in terms of shape and number. This method differs from other methods in that:
1. The method uses the DWT to process lightning localization data, combined with CFSFD algorithm, and the experiment proves that this method has the highest recognition accuracy compared with existing thunderstorm recognition algorithms.
2. The method is significantly more computationally efficient than some existing methods with higher complexity, with time complexity of O(n).
3. In addition, the method supports different spatial resolutions for thunderstorm identification and can achieve good results. It provides a good basis for the subsequent extrapolation research on thunderstorms.
The arrangement of the rest of the paper is as below. Section 2 provides a brief overview of relevant work on thunderstorm identification. Section 3 proposes a DWT-based thunderstorm identification method. Section 4 introduces core data and schemes employed in the experiments, presents an analysis of results and evaluates the performance of the method. Finally, we discuss and conclude in Section 5.
Given the powerful destructive power and suddenness of thunderstorm weather, which brings inconvenience and loss to people's lives in all aspects, it is a current priority to study the fine meteorological disaster weather warning of thunderstorms gale and improve short-time forecasting capability in an in-depth and effective way. So far, many scholars at home and abroad have made some achievements in the research of thunderstorms and windy weather.
Numerous researchers have used radar data for effective identification, tracking and extrapolation of thunderstorms. Dixon et al. [1] first proposed TITAN algorithm for thunderstorm identification, they mainly use radar body sweep information to first identify thunderstorms, then new thunderstorms will appear over time, the new thunderstorms are matched with original thunderstorms, finally, the geometric inference is performed to deal with merging and splitting; Based on radar-based data from the Beijing Observatory, Yang et al. [2] used machine learning methods to establish a model for early identification and proximity prediction of thunderstorms, but misjudgment rate would be relatively high for individual storm forecasts, and there was no attempt to use the entire radar observation data of a long time series for the study; Shi et al. [3] take a deep learning approach and propose a radar echo extrapolation method based on a dynamic convolutional neural network with input, which is different from the traditional radar echo extrapolation method, this method improves the accuracy of prediction by establishing a correlation between convolution kernel and input image based on the strong correlation between radar echo images at adjacent moments; Yan et al. [4] used ground-based Doppler weather radar emissivity factor data and an improved DBSCAN(Density-Based spatial clustering of application with noise) algorithm to investigate the three-dimensional structure identification and feature volume of thunderstorm monoliths; HOU et al. [5] proposed an algorithm for automatic identification, tracking and proximity forecasting of thunderstorms using a tree structure representation of radar reflectivity images, the algorithm uses a region tree structure to represent intensity regions and their spatial relationships in radar reflectivity images, and identifies thunderstorms by clustered regions in the region tree structure; ROSSI et al. [6] proposed a probabilistic short-time forecasting method for convective thunderstorms to address the problem of uncertainty in short-time forecasting. The method begins with a two-dimensional radar thunderstorm identification and tracking algorithm combined with Kalman filtering of noise measurements from the storm's center of mass using a continuous white noise acceleration model, and then the resulting smoothed estimates of storm center of mass and velocity components and their error covariance values applied to the proximity forecasting of thunderstorm generation; ZOU et al. [7] further optimized a new algorithm based on TREC(tracking a radar echo by cross-correlation) algorithm and named BTREC(Barnes filter-based tracking of radar echoes by cross-correlation), which is an effective objective analysis method for smoothing radar echo motion vector and can better correct the inconsistency of noise and TREC vectors.
In Addition, some scholars have made some efforts to identify, track and extrapolate thunderstorm predictions based on lightning data. In order to accurately predict the movement trend of thunderstorms, Huang et al. [8] introduced kernel density estimation and weighted Euclidean distance to improve the clustering algorithm for clustering analysis of real-time ground flash data, lightning density is calculated by least-squares fitting of the quadratic trajectory of the thunderstorm motion based on the change in the time-shifted position of the thunderstorm center and kriging interpolation. Zhou et al. [9] combined CFSFD algorithm with Kalman filter algorithm to analyze, track, and extrapolate thunderstorm activity in South China based on lightning data; Hou et al. [10] used DBSCAN algorithm for spatial cluster analysis to construct a lightning cluster identification and proximity forecasting system for strong thunderstorm weather in the Jiangsu region; Tuomi et al. [11] proposes a new algorithm for thunderstorm identification that uses Spatio-temporal thresholds to distinguish lightning clusters and thus identify and track thunderstorms; Kohn et al. [12] cited lightning location data in the WDSS-II (Warning Decision Support System) and used lightning density threshold to accomplish the identification and tracking of thunderstorms, and achieved good short-term forecasting results; Bonelli et al. [13] combined radar data and lightning location data to set Spatio-temporal thresholds for thunderstorm path identification, tracking and extrapolation; Lu et al. [14] proposed a thunderstorm identification, tracking and extrapolation algorithm based on radar, satellite and lightning data. The algorithm can identify the lightning occurrence region, track it using a period of monitoring information, and finally predict center location coordinates of the region using Holt's two-parameter linear exponential smoothing method.
In summary, there are three shortcomings in the research of thunderstorm identification. Firstly, in terms of algorithm complexity, most of the thunderstorm identification algorithms proposed by meteorologists do not do well in terms of complexity, for example, two representative algorithms in the development history of thunderstorm identification tracking - TITAN algorithm and SCIT (storm cell identification and tracking) algorithm [15], which increase the computational burden to a certain extent and have disadvantages of long computation time and low computational efficiency. Secondly, some related studies are lacking for different spatial resolutions and different scales of thunderstorm identification. Some studies have excellent results for small-scale thunderstorm identification and poor results for large-scale thunderstorm identification. Lastly, noisy data in the lightning data can also have an impact on the final recognition results. Some studies have been unable to avoid the effects of this noise, resulting in poor recognition accuracy.
In this paper, we propose a thunderstorm identification method based on rasterized data and ADTD lightning location data, in which DWT is used to denoise ADTD lightning location data, and then CFSFD algorithm is used for efficient clustering to achieve the purpose of thunderstorm identification. The experimental results show that the recognition accuracy of the method is higher than some other methods in the identification of thunderstorms with different spatial resolutions. The method is also the best in identifying any shape and number of thunderstorms at the same time and in the same area under the same conditions.
3 Thunderstorm Identification Method
The thunderstorm identification method proposed in this paper is based on ADTD lightning location data, which mainly includes area rasterization and generation of quantization space, DWT for data preprocessing, then feature mapping transform to restore original feature space, and CFSFD algorithm for efficient clustering to achieve the purpose of thunderstorm identification.
The core of the thunderstorm identification algorithm proposed in this paper lies in transforming the lightning data within the geographic raster using DWT, then clustering them using an efficient CFSFD algorithm, and identifying thunderstorms at last. The specific idea is as follows: we divide the geospatial region into
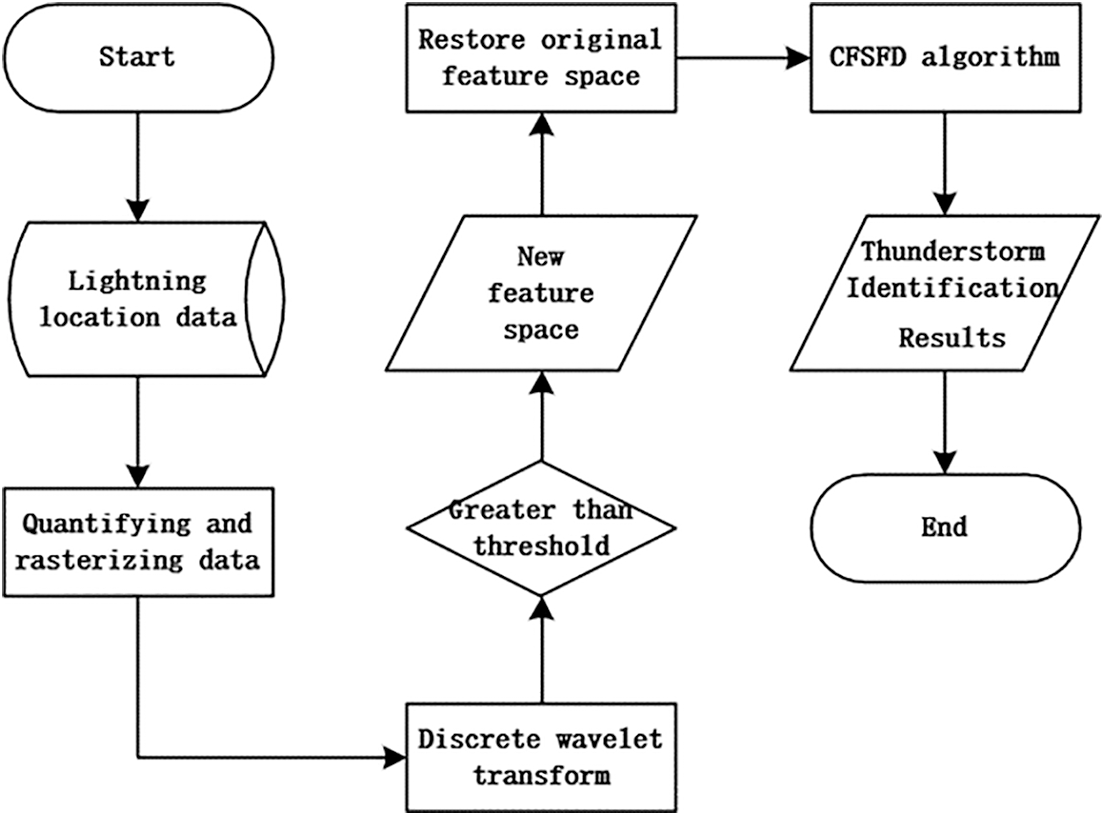
Figure 1: Thunderstorm identification flow chart
In order to reflect the differences of different regions, rasterizing the lightning data is the method used in this paper. The ADTD lightning locating data used in this paper is provided by Hunan Meteorological Disaster Defense Technology Center, with 5 km * 5 km as the resolution of raster cutting, the whole province of Hunan is cut into more than 8000 grids, in order to determine the location and area of each grid, the diagonal of grids are respectively by latitude and longitude positioning, this method aims to analyze the lightning characteristics of each grid area, thus making thunderstorm identification more accurate (Fig. 2).
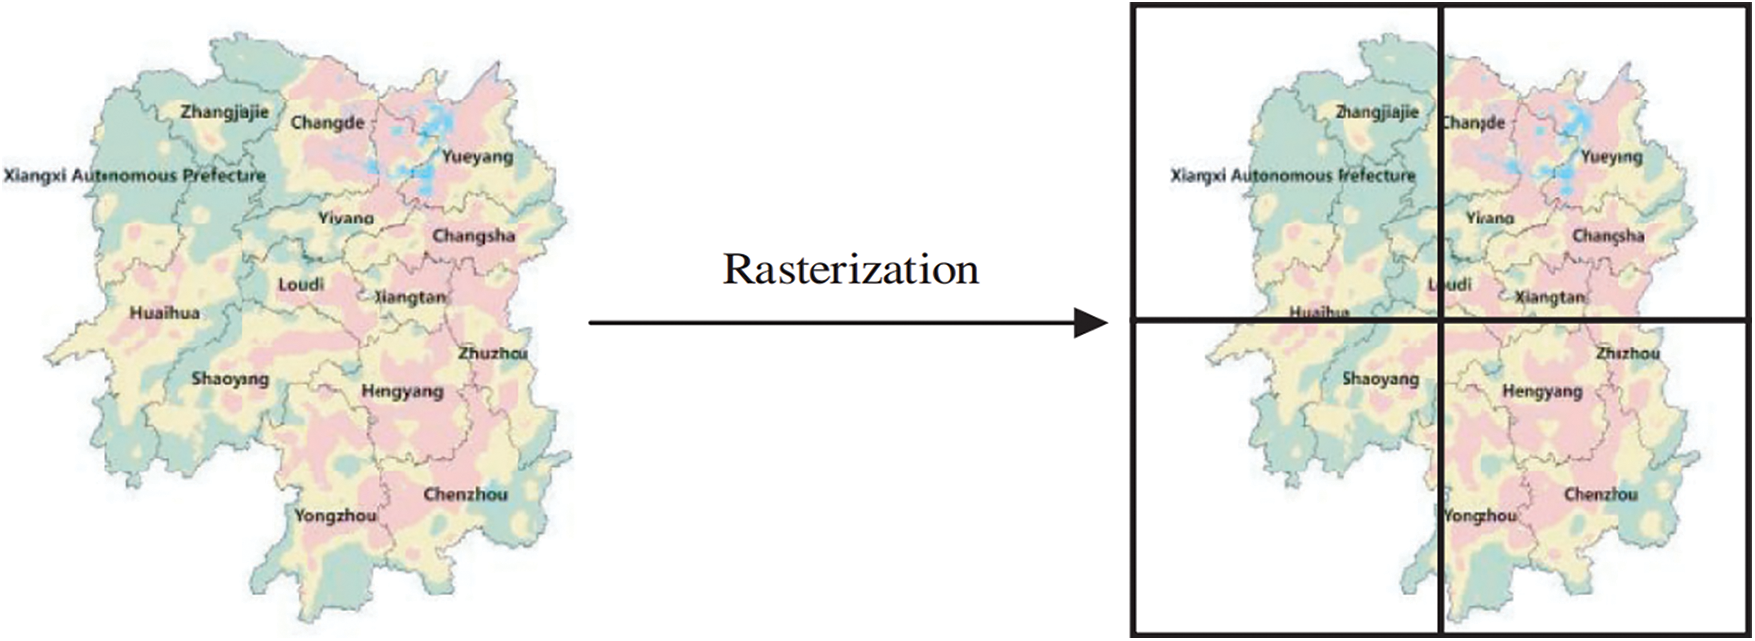
Figure 2: Geographical area rasterization
In order to obtain the data structure required in the experiment, data needs to be pre-processed and the specific steps carried out are as follows:
In order to reflect the differences of different regions, this paper uses ArcGIS to slice the whole province of Hunan into more than 8000 geographic rasters with a raster resolution of 5 km * 5 km.
The number of lightning streaks in each raster can be determined based on the geographic extent of the raster after slicing with latitude, longitude, and lightning data.
After putting lightning data into raster, the number of lightning in each raster can be determined according to the actual situation, marking each lightning data as 1, n lightning in the raster as n, indicating a positive sample area, and no lightning in the raster as 0, indicating a negative sample area.
3.3 Discrete Wavelet Transform
Wavelet transform is a signal transformation from the time domain to frequency domain, and is a multi-scale analysis method for signals, also known as multi-resolution analysis. Wavelets are widely used as a denoising method based on the DWT because of their low entropy, multi-resolution, de-correlation, and flexibility in base selection [16]. In real production life, noise is everywhere. Noise may exist in the data collection process or in the surrounding environment, and the information to be expressed by the data itself is often obscured by the presence of noise, so data noise abatement is a key step in the data pre-processing process. In the study of thunderstorm identification, some scattered lightning data in the raster will affect overall identification effect in the clustering process, and we compare these lightning data which will affect the effect to the “noise” in the experimental data. The DWT is a discretization of the scale and translation of the fundamental wavelet and is commonly used in digital image processing. Binary wavelets are often used as wavelet transform functions in image processing. Set
For
When
where
As DWT is simpler to compute and more suitable to be applied to lightning localization data, DWT is selected in this paper for noise reduction of lightning data to remove the data that have an impact on the experimental results. In order to obtain satisfactory denoising results, it is crucial to determine some of the parameters used in the wavelet denoising algorithm, such as the type of wavelet basis function, the number of decomposition layers, threshold value and threshold function, etc. Different wavelet basis functions will produce different effects in denoising. The better the regularity of the wavelet basis function, the higher resolution. Some of the commonly used wavelet basis functions are Haar, Daubechies, Symlets and Coiflets [17]. The choice of wavelet coefficients also has a significant impact on the denoising effect, and narrowing the wavelet coefficients is a useful denoising method [18]. The wavelet decomposition is performed using the fast algorithm of wavelet transform-Mallat algorithm. The approximate and detailed coefficients obtained from the decomposition can be obtained using two analysis filters. The low-pass filter (H) outputs the approximate coefficients of the low-frequency part and the high-pass filter (G) outputs the detail coefficients of the high-frequency part, after thresholding, the final reconstruction is carried out and the reconstruction data is the original noisy data after denoising [19]. The decomposition algorithm is as follows.
The specific steps are as follows:
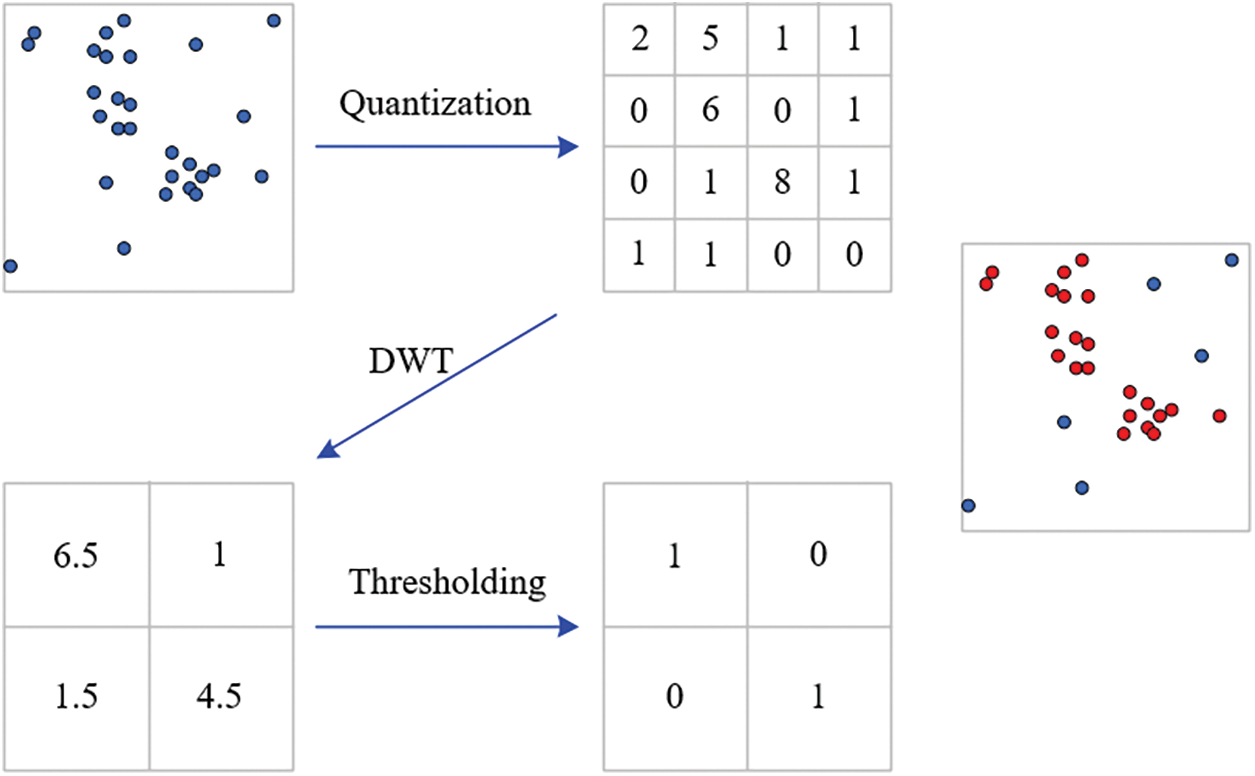
Figure 3: Example of DWT thunderstorm identification algorithm
3.4 Thunderstorm Identification
After the above-mentioned data pre-processing and discrete wavelet transform, the next step is to perform thunderstorm identification. Given that the occurrence of a strong convective weather like thunderstorms is often accompanied by lightning, the lightning data are linked into dense clusters that can be used for representing thunderstorms, and the use of a clustering algorithm can achieve thunderstorm identification. At present, there are many existing clustering algorithms and improved clustering algorithms, but each of them has its own advantages and disadvantages. As compared with traditional K-means clustering and classical clustering algorithms such as DBSCAN [20], clustering by fast search and find of density (CFSFD) can be more efficient and better for the clustering of lightning, so CFSFD algorithm is used in this paper. It is a simple and straightforward density clustering algorithm and finds possible cluster centers and distances by quickly searching and finding density peaks for clustering and defining local densities and distances [21]. CFSFD eliminates the need to pre-specify the centers of clusters and the hyperparameters K values, and also enables better recognition of thunderstorms with non-spherical shapes. One of the advantages of this algorithm is the low complexity of the algorithm when compared to traditional algorithms, because instead of considering vector space distances, it only takes into account the point-to-point distances, which do not need to be mapped into vector space.
The lightning density is calculated as follows:
In Eq. (5),
Other methods of calculating the lightning density are available, and we can also use the Gaussian kernel function of Eq. (6) to calculate the lightning density. This is justified by the fact that the Gaussian kernel function decays exponentially from the center to the periphery according to the distance, making it easier to determine the unique thunderstorm center.
Define lightning distance:
Depending on the lightning distance defined by Eq. (7), the smallest distance of all other lightning whose lightning density is larger than it is from that lightning is calculated for each lightning, where for the lightning with the largest lightning density, the lightning distance
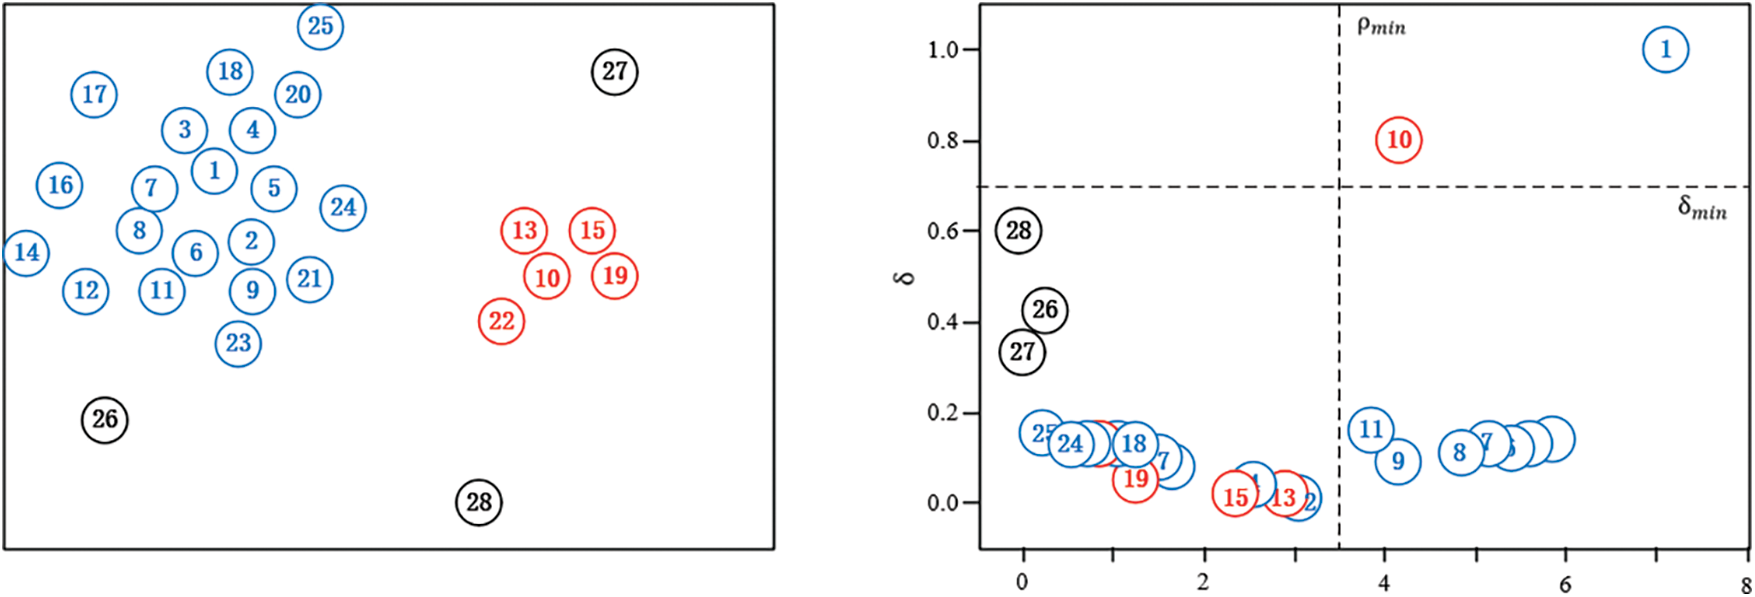
Figure 4: Clustering algorithm diagram
Taking into account, there is a good identification of thunderstorms belonging to small and medium scale weather systems and the effect of actual experimental clustering with
4.1 Presentation to Data Sources
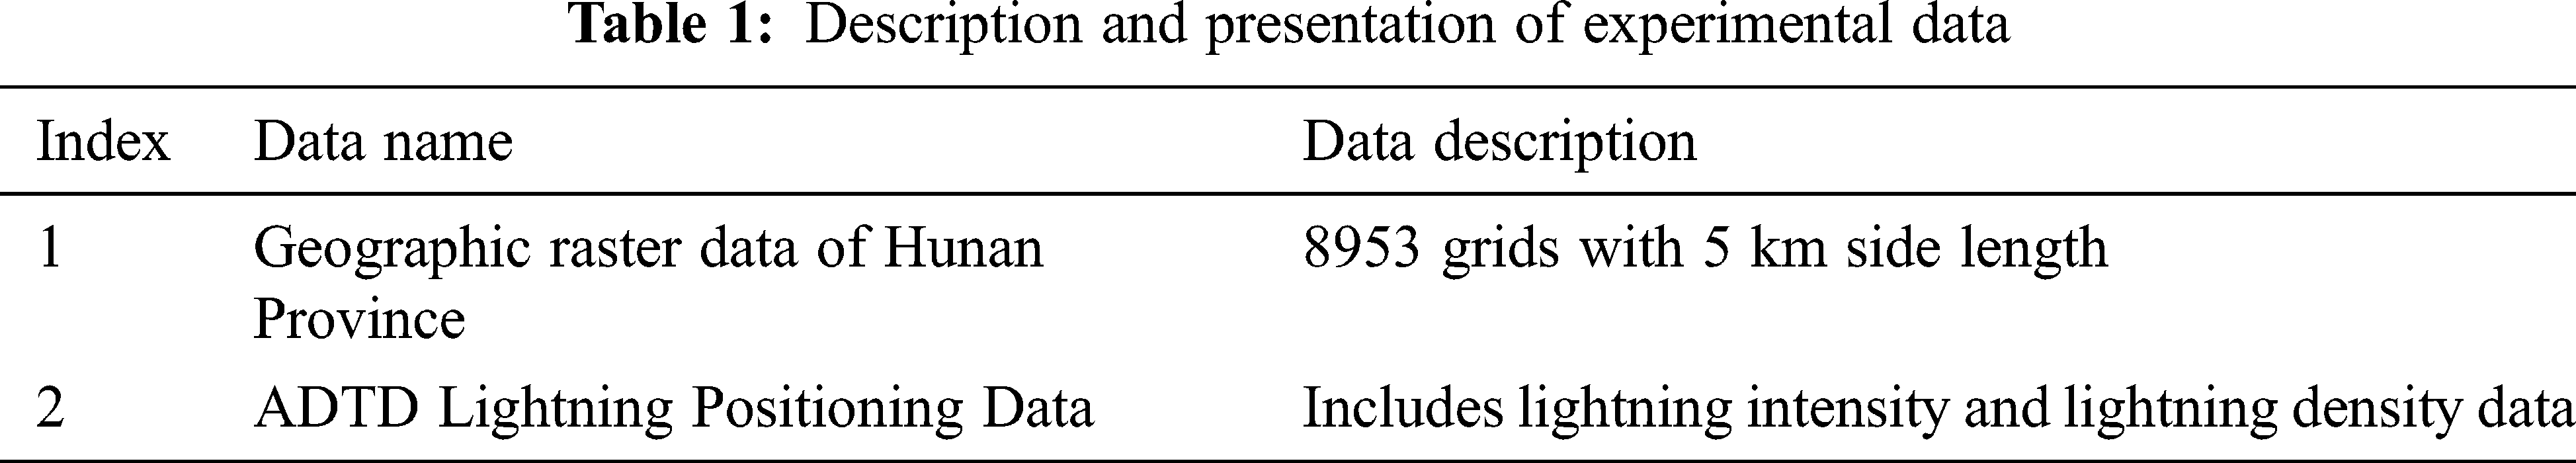
The data from experiments in this paper are of two primary types: geographic raster data of Hunan Province, and ADTD lightning positioning data. Among them, the ADTD lightning location data is the bulk of our data for this experiment. Lightning location data is obtained by a special lightning locator detection network survey, by monitoring the ground flash radiation VLF(Vertical launch facility) signal, after waveform judgment to give the precise time of the lightning signal arrived at the sensor, so as to determine the location of lightning occurrence. In order to better understand the thunderstorm phenomenon and to obtain better experimental results, higher resolution and more detailed data need to be collected [23]. In this experiment, a total of 80,000 lightning data from 2015–2016 in Hunan Province were collected, and the data were provided by the Hunan Meteorological Disaster Defense Technology Center. Geographic raster sliced data is a sliced division of the whole province of Hunan and populated into a geographic raster of Hunan Province based on the latitude and longitude of the lightning location data, which is the process of data rasterization. The data used in the experiments are listed in Tab. 1 below.
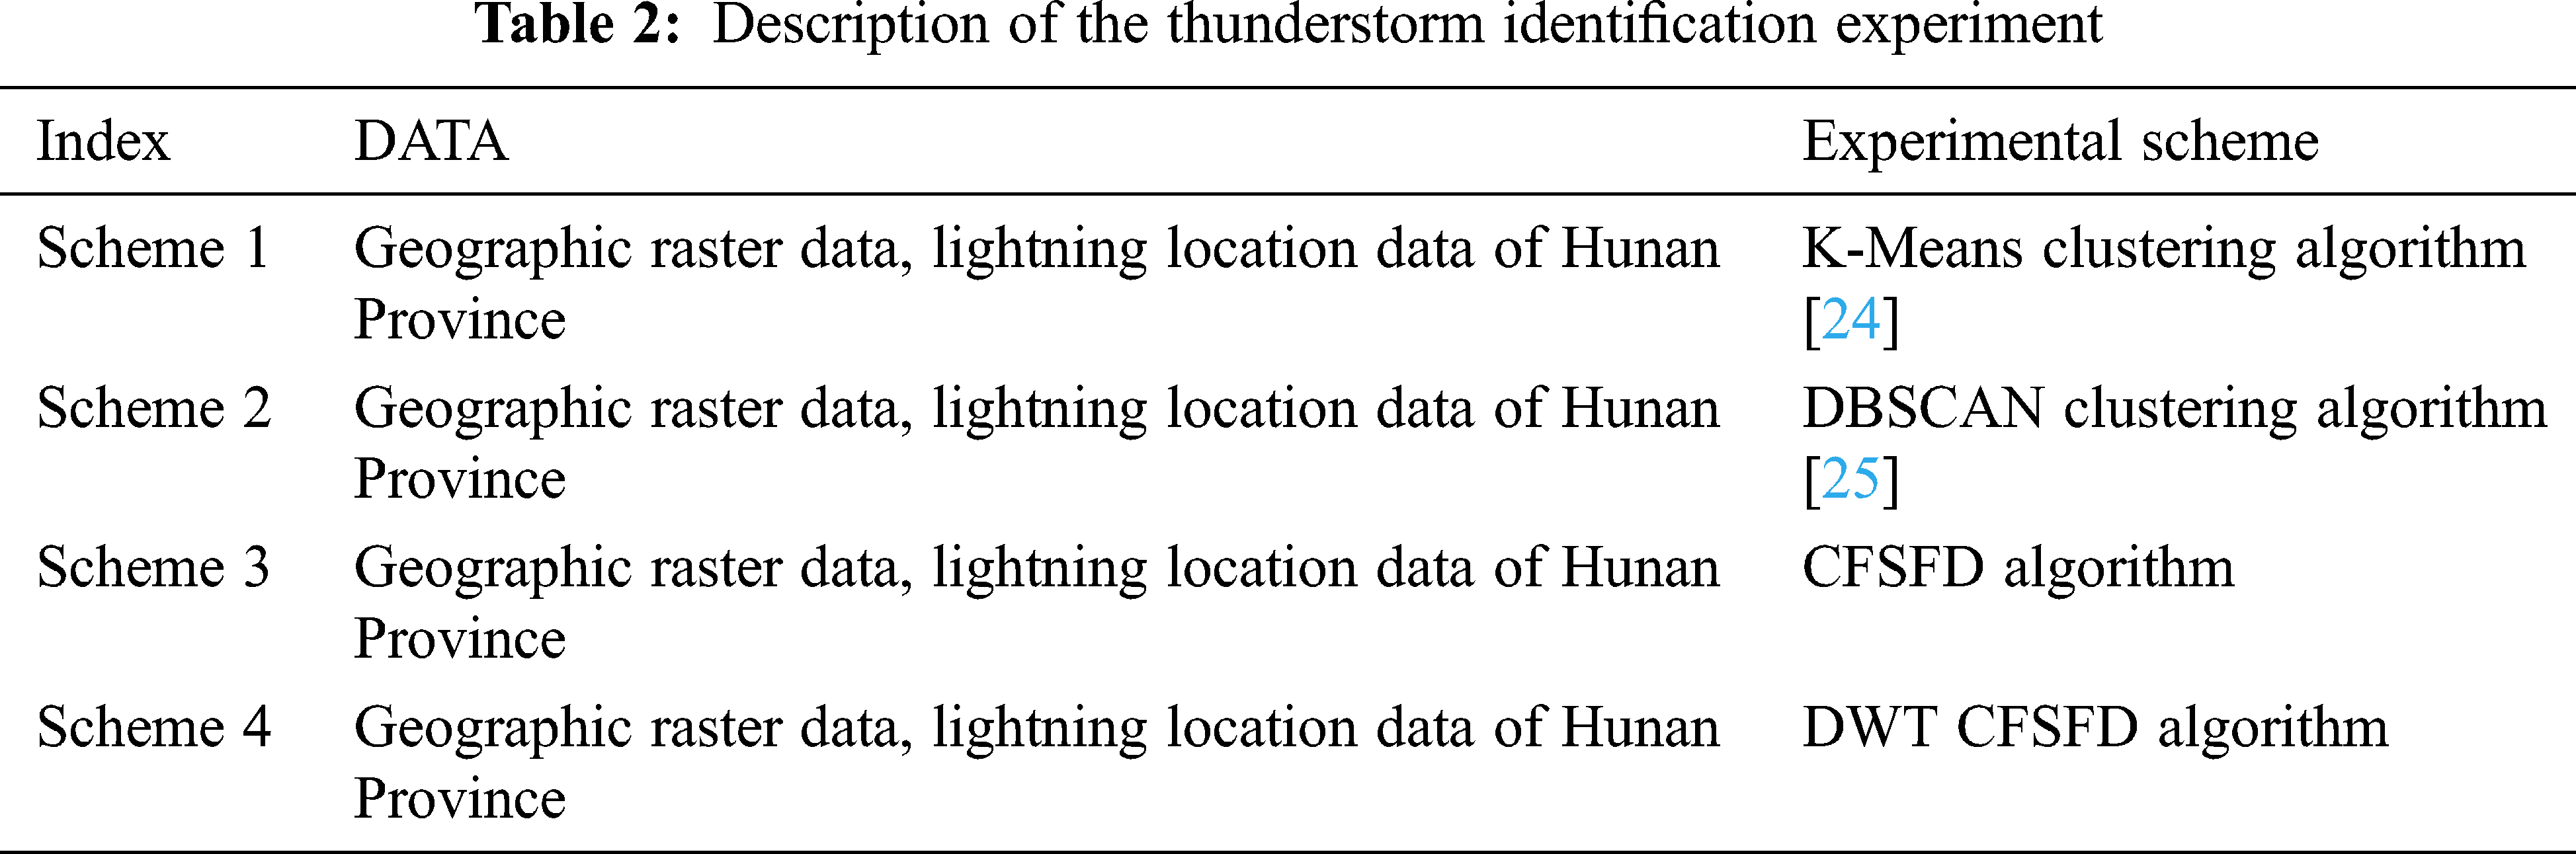
In order to demonstrate the superiority of the thunderstorm identification algorithm proposed in this paper. Four experimental schemes are designed in this experiment to compare with K-means clustering algorithm and DBSCAN clustering algorithm respectively. Different experimental effects are obtained for the four experimental schemes, and the selection of the final data of the DWT and the setting of the parameter threshold are determined according to the experimental results. The experimental scheme designed in this paper is scheme 4 in the following Tab. 2. The details of the schemes are listed in Tab. 2.
After the final recognition results are obtained experimentally, in order to better compare experimental results, the recognition results of thunderstorms are binarized in this paper as follows:
Define R as the label value for each raster, and the value of R for that raster is 1 if the final identified thunderstorm falls within that raster, and 0 if the final identified thunderstorm does not fall within the raster. The accuracy of thunderstorm identification is defined as follows [26].
Where N denotes the number of correctly identified thunderstorms, T denotes the total number of thunderstorms in that time period, and the accuracy P reflects the effectiveness of the DWT identification algorithm.
4.4 Experimental Results and Analysis
Four experimental schemes are designed in this experiment, and the proposed method in this paper is compared with K-means clustering algorithm and DBSCAN clustering algorithm respectively, and all four methods are based on the same laboratory environment and experimental data. The histograms of accuracy for each of the several experimental schemes are illustrated below (Fig. 5).
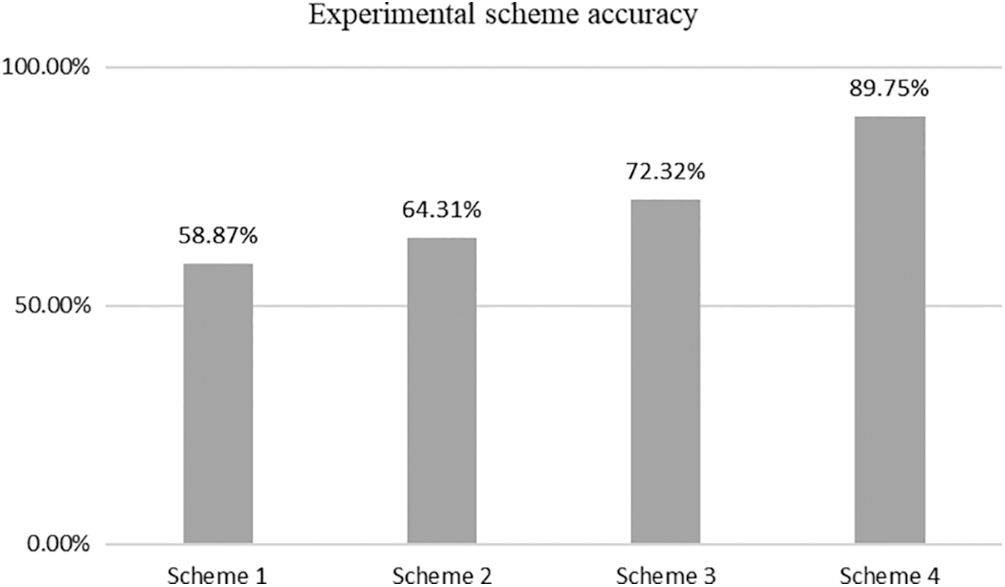
Figure 5: Accuracy of four experimental schemes
After conducting a large number of experiments, the experimental results found that the experimental effect of thunderstorm identification was reduced by about 20% only considering the traditional clustering algorithm without considering the noise of the lightning data itself, specifically, it seems that the K-means clustering algorithm not only has the disadvantage of being difficult to determine the K value, but also is sensitive to noise and anomalies, resulting in its poor application in thunderstorm identification. It is found that the accuracy of K-means clustering algorithm in thunderstorm identification is only about 60% after combining 15 to 19 years of lightning data in Hunan Province; In contrast the experimental effect of the DBSCAN clustering algorithm for thunderstorm identification is 5.44% more accurate than the former, with an accuracy of 64.31%. The DBSCAN clustering algorithm outperforms K-means algorithm in this field benefiting from the fact that it can cluster dense data sets of arbitrary shape and can discover anomalies while clustering and is insensitive to anomalies in the data set; The CFSFD algorithm has about 10% higher recognition accuracy compared to the two previous traditional clustering algorithms because it does not require pre-specified clustering centers. The experiment proves that after processing the noise of the lightning data itself, the lightning data within the geographic raster is transformed using DWT, and then clustered using an efficient CFSFD algorithm, the experimental results are optimal and the accuracy is maintained at more than 85%. The comparative experimental analysis shows that although the lightning data dominates the identification of thunderstorms. But at the same time it is also more sensitive to data itself. Therefore, when analyzing the thunderstorm weather in a certain area, the improvement cannot be made only from the machine learning algorithm. When comprehensive data and reasonable methods are considered, the method is considered relatively stable and accurate.
In this paper, the experiments collected a total of 80,000 lightning data from 2015–2016 in Hunan Province, screened out the moments of frequent lightning, and identified them using the above DWT thunderstorm identification algorithm. The following figure is a selection of some experimental effect pictures for display, the red lightning icon indicates lightning, and it can be seen that the number of identified thunderstorms and the size of thunderstorms in the following four figures are different.
Experimental effects map shows frequent thunderstorms in Changsha. The results of the experiment indicate that the closer the water system is, the more frequent lightning activity is and the higher the probability of a lightning strike. Fig. 6 shows two maps of thunderstorm recognition in Changsha at different times of the day on August 15, and Fig. 7 shows two maps of thunderstorm recognition in Changsha at different times of the day on July 16. Fig. 6a shows that a total of four thunderstorm clusters were identified in Changsha at the same moment, and it can be seen from Fig. 6a that the scales of these four thunderstorms are different, with the first main thunderstorm in the figure occurring in Ningxiang City and having a larger range of influence; In contrast the fourth thunderstorm in the map occurs mainly in Liuyang City, where the thunderstorm is small in scale and has a small area of influence. It can be concluded that the algorithm in this paper is able to identify thunderstorms of different sizes at the same moment. Fig. 6b shows the identification of thunderstorms after half an hour, from Fig. 6b we can see that thunderstorms occurred in five locations in Changsha at the same time, which has changed compared to Fig. 6a half an hour ago. It can be shown that the algorithm can identify different numbers of thunderstorms in the same area and is consistent with the actual number of thunderstorms occurring. Figs. 7a and 7b show the effect of thunderstorm identification after changing the spatial resolution. A total of four thunderstorms are identified in Fig. 7a, with the second one being the largest and the fourth one being the smallest at that moment in time. Fig. 7b shows the number of thunderstorm identifications as 2, with the largest thunderstorms covering the districts of Yuelu, Yuhua and Tianxin. According to Figs. 7a and 7b, it can be seen that this algorithm can identify thunderstorms with high accuracy even at different spatial resolutions. A large number of comparative experiments have shown that the method proposed in this paper is superior to other comparative test methods in terms of accuracy and complexity.
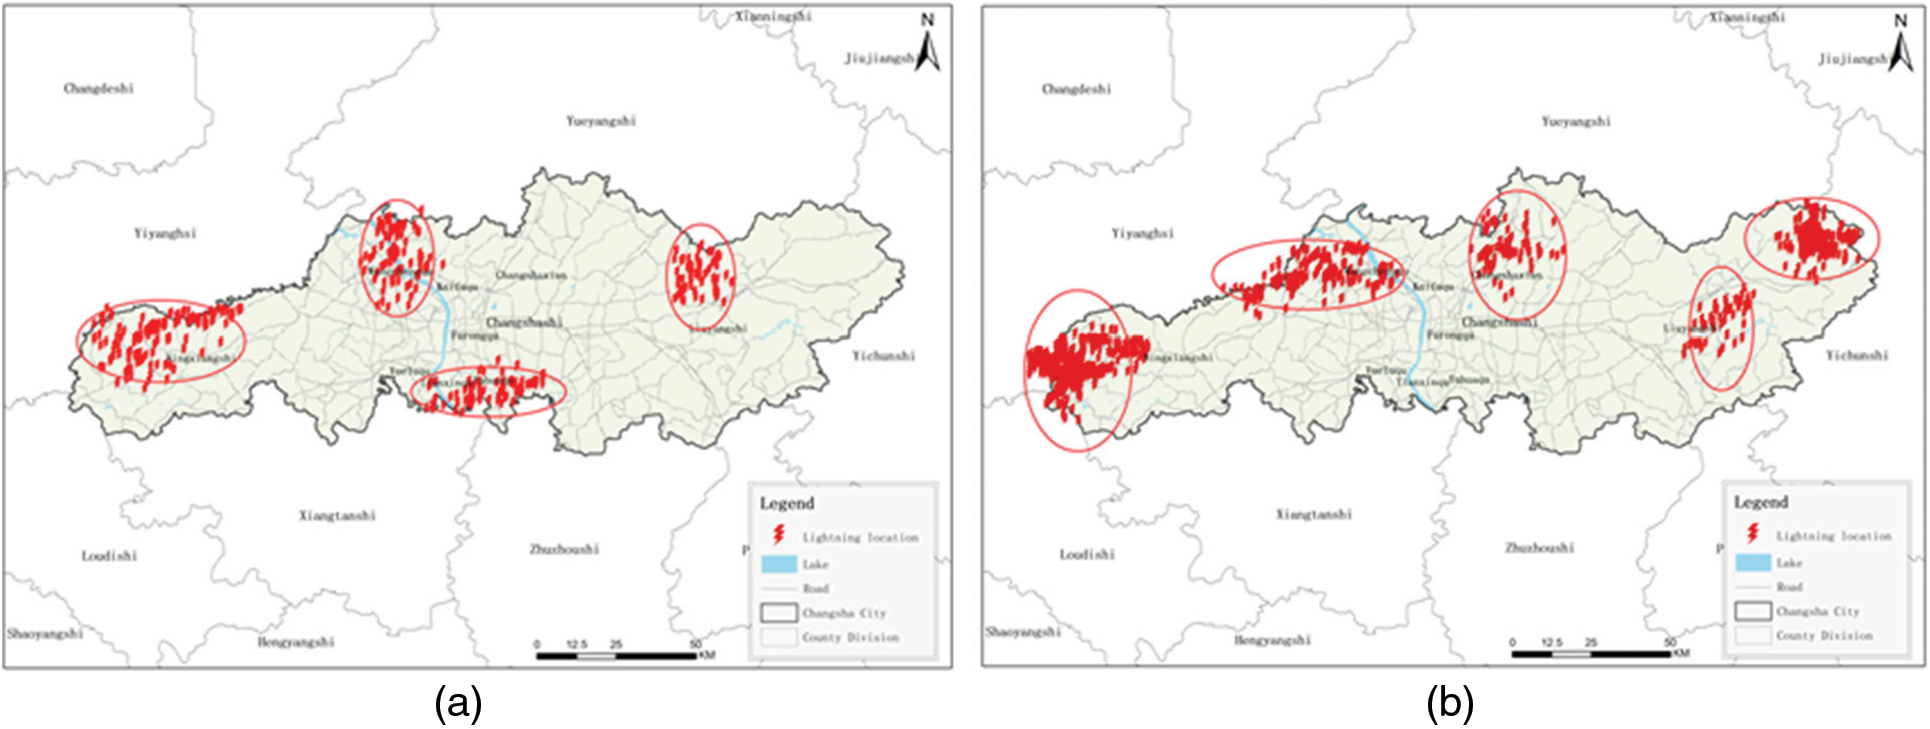
Figure 6: The effect of thunderstorm identification on a day in August 2015 in Hunan Province. (a) shows the effect of thunderstorm identification in Changsha City at 2 pm on a day in August 2015. (b) shows the effect of thunderstorm identification in Changsha City at 4 pm on a day in August 2015
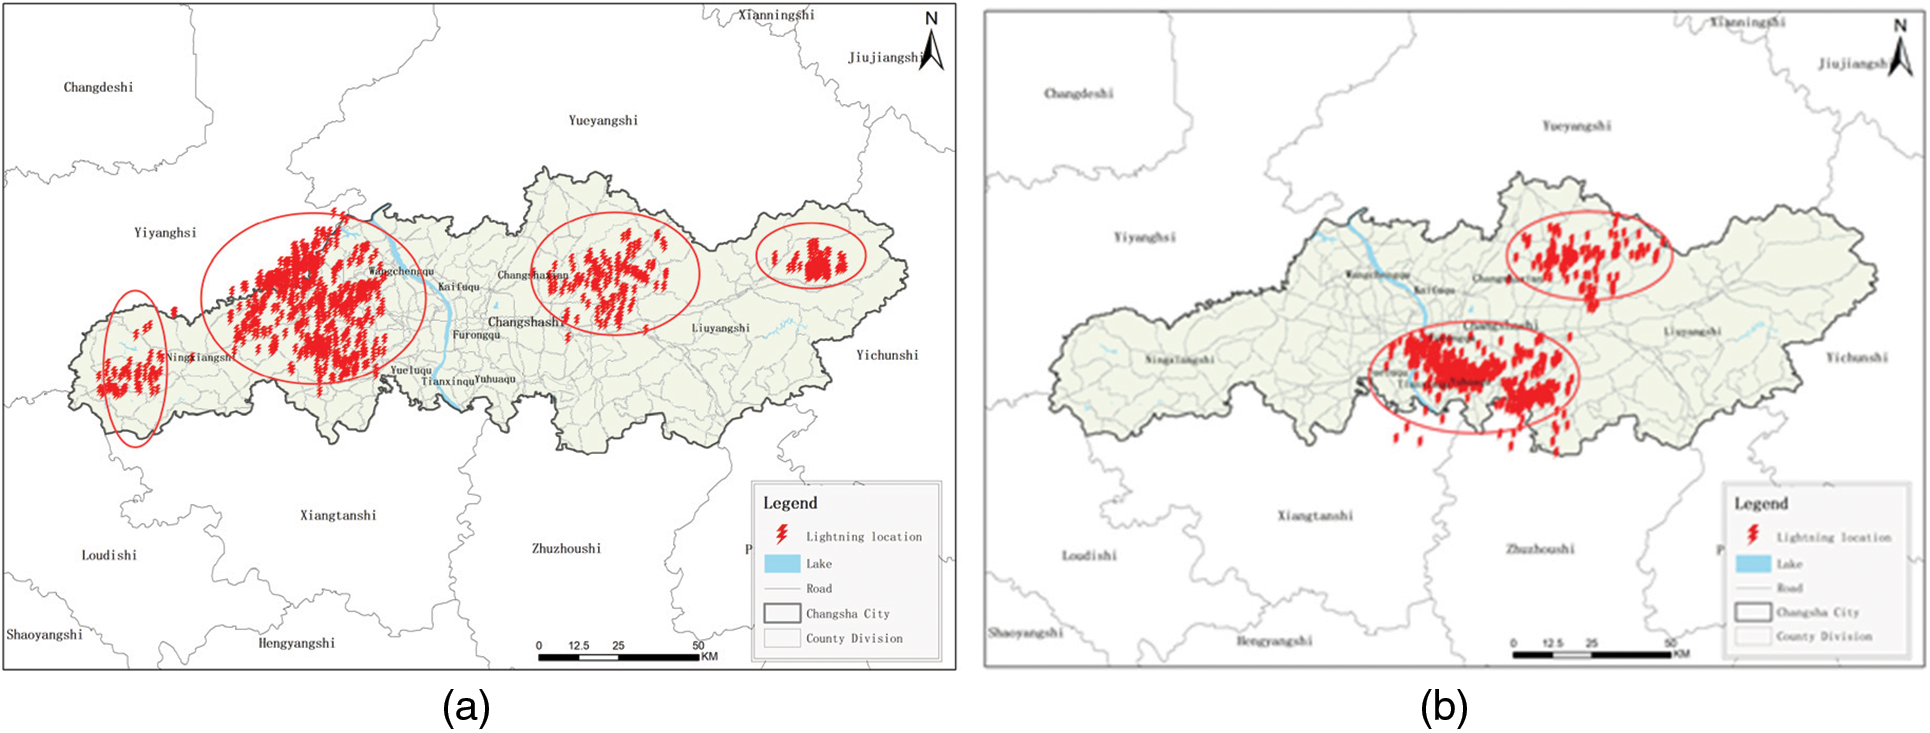
Figure 7: The effect of thunderstorm identification on a day in July 2016 in Hunan Province. (a) shows the effect of thunderstorm identification in Changsha City at 2 pm on a day in July 2016. (b) shows the effect of thunderstorm identification in Changsha City at 4 pm on a day in July 2016
Analysis of the use of lightning location data is of great importance for the identification of thunderstorms. However, the problem is that in previous studies, the data are not well processed before the experiment, which leads to poor recognition, and some previous studies have limited the size as well as the shape of thunderstorm recognition, in addition to the large amount of meteorological data which in turn leads to inefficient recognition algorithms. In this paper, in order to solve the problems existing in the existing research, we propose the method of combining DWT with the CFSFD algorithm. The experiments prove that the method proposed in this paper can effectively process a large amount of lightning positioning data at the same moment while improving the computational efficiency, and eliminate some data that will affect the effect in order to achieve a satisfactory recognition effect. On one hand it can identify thunderstorms of different numbers and scales with high accuracy, which on the other hand also performs well under experimental conditions with different spatial resolutions. Afterward, we will further optimize the method, we will further improve the accuracy of the experiment, and on this basis, we will carry out extrapolation experiments for thunderstorms.
Funding Statement: This work is supported by the National Key R&D Program of China under grant 2018YFB1003205; by the National Natural Science Foundation of China under grant U1836208, U1836110; by the Priority Academic Program Development of Jiangsu Higher Education Institutions (PAPD) fund; by the Collaborative Innovation Center of Atmospheric Environment and Equipment Technology (CICAEET) fund, China.
Conflicts of Interest: The authors declare that they have no conflicts of interest to report regarding the present study.
1. M. Dixon and G. Wiener, “TITAN: Thunderstorm identification, tracking, analysis, and nowcasting—A radar-based methodology,” Journal of Atmospheric and Oceanic Technology, vol. 10, no. 6, pp. 785–797, 1993. [Google Scholar]
2. L. Yang, F. Han, M. X. Chen and J. P. Meng, “Support vector machine based thunderstorm gale identification method,” Journal of Applied Meteorology, vol. 29, no. 6, pp. 680–689, 2018. [Google Scholar]
3. E. Shi, Q. Li, D. Gu and Z. M. Zhao, “Radar echo extrapolation method based on convolutional neural network,” Journal of Computer Applications, vol. 38, no. 3, pp. 661–665, 2018. [Google Scholar]
4. W. H. Yan, X. Y. Huang, Y. J. Zhao, T. Yang and H. B. Ni, “Introduction of thunderstorm monolithic 3D structure identification based on improved DBSCAN clustering algorithm,” Journal of Tropical Meteorology, vol. 36, no. 4, pp. 542–551, 2018. [Google Scholar]
5. J. Y. Hou and P. Wang, “Storm tracking via tree structure representation of radar data,” Journal of Atmospheric and Oceanic Technology, vol. 34, no. 4, pp. 729–747, 2017. [Google Scholar]
6. P. J. Rossi, V. Chandrasekar, V. Hasu and D. Moisseev, “Kalman filtering-based probabilistic nowcasting of object-oriented tracked convective storms,” Journal of Atmospheric and Oceanic Technology, vol. 32, no. 3, pp. 461–477, 2015. [Google Scholar]
7. H. B. Zou, S. S. Wu, J. S. Shan and X. T. Yi, “A method of radar echo extrapolation based on TREC and Barnes filter,” Journal of Atmospheric and Oceanic Technology, vol. 36, no. 9, pp. 1713–1727, 2019. [Google Scholar]
8. L. Z. Huang, S. Su, X. Yang, J. Hu and Z. Y. Liu, “LLS-based proximity prediction of thunderstorm motion trends,” Electric Porcelain Lightning Arrester, vol. 1, no. 1, pp. 76–83, 2019. [Google Scholar]
9. K. H. Zhou, Y. G. Zhen and Y. Lan, “Thunderstorm identification, tracking and extrapolation methods based on lightning data,” Journal of Applied Meteorology, vol. 27, no. 2, pp. 173–181, 2016. [Google Scholar]
10. R. T. Hou, B. Zhu, M. X. Feng, X. M. Shi and Y. Lu, “Lightning proximity forecasting model based on DBSCAN clustering algorithm,” Computer Applications, vol. 32, no. 3, pp. 847–851, 2012. [Google Scholar]
11. T. J. Tuomi and M. Larjavaara, “Identification and analysis of flash cells in thunderstorms,” Quarterly Journal of the Royal Meteorological Society: A Journal of the Atmospheric Sciences, Applied Meteorology and Physical Oceanography, vol. 131, no. 607, pp. 1191–1214, 2005. [Google Scholar]
12. M. Kohn, E. Galanti, C. Price, K. Lagouvardos and V. Kotroni, “Nowcasting thunderstorms in the Mediterranean region using lightning data,” Atmospheric Research, vol. 100, no. 4, pp. 489–502, 2011. [Google Scholar]
13. P. Bonelli and P. Marcacci, “Thunderstorm nowcasting by means of lightning and radar data: Algorithms and applications in northern Italy,” Natural Hazards and Earth System Sciences, vol. 8, no. 5, pp. 1187–1198, 2008. [Google Scholar]
14. W. T. Lu, Y. J. Zhang, Q. Meng, W. Yao, Y. Ma et al., “Lightning proximity warning method and system development,” Meteorology, vol. 35, no. 5, pp. 10–17, 2009. [Google Scholar]
15. J. T. Johnson, P. L. MacKeen, A. Witt, E. D. W. Mitchell, G. J. Stumpf et al., “The storm cell identification and tracking algorithm: An enhanced WSR-88D algorithm,” Weather and Forecasting, vol. 13, no. 2, pp. 263–276, 1998. [Google Scholar]
16. M. N. Ali, E. S. A. El-Dahshan and A. H. Yahia, “Denoising of heart sound signals using discrete wavelet transform,” Circuits, Systems, and Signal Processing, vol. 36, no. 11, pp. 4482–4497, 2017. [Google Scholar]
17. X. F. Cheng and H. Yang, “Analysis and comparison of 5 types of wavelets in heart sound signal processing,” Journal of Nanjing University of Posts and Telecommunications, vol. 35, no. 1, pp. 38–46, 2015. [Google Scholar]
18. P. Vinayagam, P. Anandan and N. Kumaratharan, “Image denoising using a nonlinear pixel-likeness weighted-frame technique,” Intelligent Automation & Soft Computing, vol. 30, no. 3, pp. 869–879, 2021. [Google Scholar]
19. A. Hassan, A. Waris, S. O. Gilani, M. U. Tariq and H. Alquhayz, “Threshold parameters selection for empirical mode decomposition-based EMG signal denoising,” Intelligent Automation & Soft Computing, vol. 27, no. 3, pp. 799–815, 2021. [Google Scholar]
20. B. Y. Xu, J. M. Xu, D. H. Yu, L. H. Hu and L. M. Ye, “Strong echo localization tracking based on DBSCAN clustering method,” Meteorological Research and Applications, vol. 41, no. 3, pp. 61–64, 2020. [Google Scholar]
21. W. Ren, X. Di, Z. Du and J. Zhao, “An adaptive anomaly detection algorithm based on CFSFDP,” Computers, Materials & Continua, vol. 68, no. 2, pp. 2057–2073, 2021. [Google Scholar]
22. A. Rodriguez and A. Laio, “Clustering by fast search and find of density peaks,” Science, vol. 344, no. 6191, pp. 1492–1496, 2014. [Google Scholar]
23. C. Wang, P. Liu, K. Jia, X. Jia and Y. Li, “Identification of weather phenomena based on lightweight convolutional neural networks,” Computers, Materials & Continua, vol. 64, no. 3, pp. 2043–2055, 2020. [Google Scholar]
24. S. Z. Selim and M. A. Ismail, “K-means-type algorithms: A generalized convergence theorem and characterization of local optimality,” IEEE Transactions on Pattern Analysis and Machine Intelligence, vol. 1, no. 1, pp. 81–87, 1984. [Google Scholar]
25. E. Schubert, J. Sander, M. Ester, H. P. Kriegel and X. W. Xu, “DBSCAN revisited, revisited: Why and how you should (still) use DBSCAN,” ACM Transactions on Database Systems (TODS), vol. 42, no. 3, pp. 1–21, 2017. [Google Scholar]
26. Y. Zhang, J. Han, C. Yuan, S. Yang, C. Li et al., “A rasterized lightning disaster risk method for imbalanced sets using neural network,” Computers, Materials & Continua, vol. 66, no. 1, pp. 563–574, 2020. [Google Scholar]
 | This work is licensed under a Creative Commons Attribution 4.0 International License, which permits unrestricted use, distribution, and reproduction in any medium, provided the original work is properly cited. |