DOI:10.32604/iasc.2022.023982
| Intelligent Automation & Soft Computing DOI:10.32604/iasc.2022.023982 | |
| Article |
Real Time Brain Tumor Prediction Using Adaptive Neuro Fuzzy Technique
1Department of Computer Science and Engineering, Rajalakshmi Engineering College, Chennai, 602105, India
2Department of Computer Science and Engineering, Saveetha Institute of Medical and Technical Sciences, Chennai, 600027, India
*Corresponding Author: Duraimurugan Nagendiran. Email: duraimurugan21@outlook.com
Received: 29 September 2021; Accepted: 22 November 2021
Abstract: Uncontrollable growth of cells may lead to brain tumors and may cause permanent damages to the brain or even death. To make early diagnosis and treatment, identifying the position and size of tumors is identified as a tedious and troublesome problem among the existing computer-aided diagnosis systems. Moreover, the progression of tumors may vary among the patients with respect to shape, location, and volume. Therefore, to effectively classify and diagnose the brain tumor images according to severity stages follows the sequence of processing such as pre-processing, segmentation, feature extraction, and classification techniques to carrying out the appropriate treatment. To enhance the performance of brain tumors detection and diagnosis, an adaptive neuro-fuzzy-based suggestion system (ANFSS) is proposed with an effective shape-based feature selection technique. Then, the performance of proposed ANFSS is compared with existing classifier models in terms of brain tumor detection and proposed model achieves 98.8% accuracy in prediction of tumor.
Keywords: Brain tumor diagnosis; neurofuzzy decision system; shape based feature selection; machine learning; magnetic resonance imaging
Brain tumor is recognized as one of the primary cause of cancer-related health issues among the human as per the statistics of Central Brain Tumor Registry, United States [1]. The brain tumor can be basically classified into three types such as malignant (cancerous), pre-malignant (pre-cancerous), and benign (non-cancerous) tumors which made up of either brain cells (neuronal) or support cells (neuroepithelial) [2,3]. A tumor is a solid overflowing accumulation of abnormal tissues called neoplasm which can be classified into major (primary) and minor (secondary) tumor. Major tumor growth is very low and pertains to the nervous system with building-blocks of gliomas and glias cells of the human brain. Then, the minor tumor composed of cells belonging to various other parts of the human body that can spread more quickly than the major tumor. It is more important to monitor the growth rate and shrinking rate of patients’ tumors by the physician to improve the diagnosis and treatment [4].
Usually, benign tumors consist of well-defined boundaries with the formation of slow-growing cells. In the case of malignant tumors, uncontrollable mass growth of cells can be observed and provide more pressure to vital structures that may irritate life-threatening situations due to its invasive and aggressive nature [5]. Nearly, more than twenty percentages of major brain tumors are originated from the common malignant tumors only. Therefore, the tumor can be categorized in the context of localization in the skull, brain, and compartment. In addition, categorization can be done based on the composition of various cells such as meninges, neurons, glila, and germs cells.
To diagnose the brain tumor, the physicians can plan for the patient's surgical removal of tumor tissues, chemotherapy, and radiotherapy according to the segmentation of brain tumors [6]. Mostly, surgical removal is considered to be the more dangerous operation due to the thin-skin around the brain tissue. Sometimes, the combination of all three methods that are executed to properly diagnose high-grade tumors. It is more challenging to effectively segment the tumors due to the heterogeneous appearances such as texture, contrast, and intensity, other variations of tumors such as size, shape, and location within the part of the brain [7,8]. Different types of tumor images can be diagnosed with respect to the location and size by using imaging techniques such as X-Rays, positron emission tomography model, computed tomography scan model, and magnetic resonance imaging (MRI) [9].
According to recent research statistics, the more popular prediction of an American Brain Tumor Association highlights that there are more than eighty thousand brain tumor cases are undergoing diagnosis in the USA [10–12].
The exponential increase in MRI medical data will produce more hectic situations among the neuro-physicians to make precise medical analysis and diagnosing process [13–15].
The next section illustrates the detailed information about the various pre-processing, segmentation, classification, and feature selection approaches exploited in the recent studies. In Section 3, the proposed architecture of ANFSS is explained with appropriate mathematical modeling of segmentation and classification process. Section 4 explores the implementation of the brain tumor diagnosis system with comparative analysis stating the results and discussions. Finally, conclusions and future research directions of this study are highlighted.
Automated brain tumor classification and feature extraction become more challenging among the existing brain tumor detection and diagnosis systems. Classification is the process of extracting the information classes from multi-brand raster images. To analyze the performance of various brain tumor diagnosis systems, the description of existing pre-processing, feature selection, and segmentation techniques are explored in this research study.
The pre-processing helps to make the desired geometric corrections on the original image. This operation makes the necessary improvement in segmentation by removing unwanted noise, non-brain elements, and irregularities present in the actual image. Usually, the segmentation process faces a lot of difficulties due to noise, low contrast, bias field, and partial volume effect of an image. Therefore, image filtering techniques are applied to minimize the image noise and highlight the significant portions with proper display [16–18].
2.2 Brain Tumor Feature Selection Approaches
The feature selection process helps to select the subset of appropriate features from the set of original features that can support the decisions made by the classifier model. To achieve high classification accuracy, many feature selection approaches are explored in the existing brain-tumor detection and diagnosis systems [19–23].
2.3 Brain Tumor Segmentation Approaches
More recently, there is an increasing interest in developing automated brain tumor segmentation systems among the researchers working with computer vision area. Since the segmentation depends on different types of image property, it can be explored with respect to various divisions such as threshold-based, region-based, edge-based, contour-based, atlas-based, and classification-based methods [24,25]. The threshold-based method using speed function follows the simplest form of intensity property that can separate the object from other regions with respect to pixels of dissimilar intensity. In the case of an image expressed with a bi-modal pattern, a global threshold approach is used to separate the object from the background. The case of the image containing more than two regions pertain to dissimilar objects can be handled using the local threshold approach [26–28].
Classification-based methods are more popular among computer-aided brain tumor detection systems. The artificial neural network classifier model is constructed using various information processing units that are more analogous to neurons in the brain. It follows the feed-forward back propagation learning mechanism to classify the MRI into tumor and non-tumor [29–32].
3 Proposed Automated Brain Tumor Segmentation and Diagnosis Systems
The architecture of automated brain tumor segmentation and diagnosis system is proposed as shown in Fig. 1. It consists of two layers such as consumer layer and the prediction layer. In the consumer layer, the medical stakeholders will give the brain tumor MRI image as input to the healthcare system. After the feature selection, the data will undergo the disease recognition process in the proposed ANFSS with the intensity enhanced fuzzy c-means clustering technique. Based on the MRI training data available in the database, the proposed ANFSS makes the appropriate classification of cancerous and non-cancerous brain tumors. According to the severity status of the brain tumor prediction, the medical practitioner will suggest the appropriate diagnosis and assessment monitoring capabilities to the consumers or end-users. Moreover, the telemedicine suggestion and prescription are also provides based on their severity stages observed during the analysis.
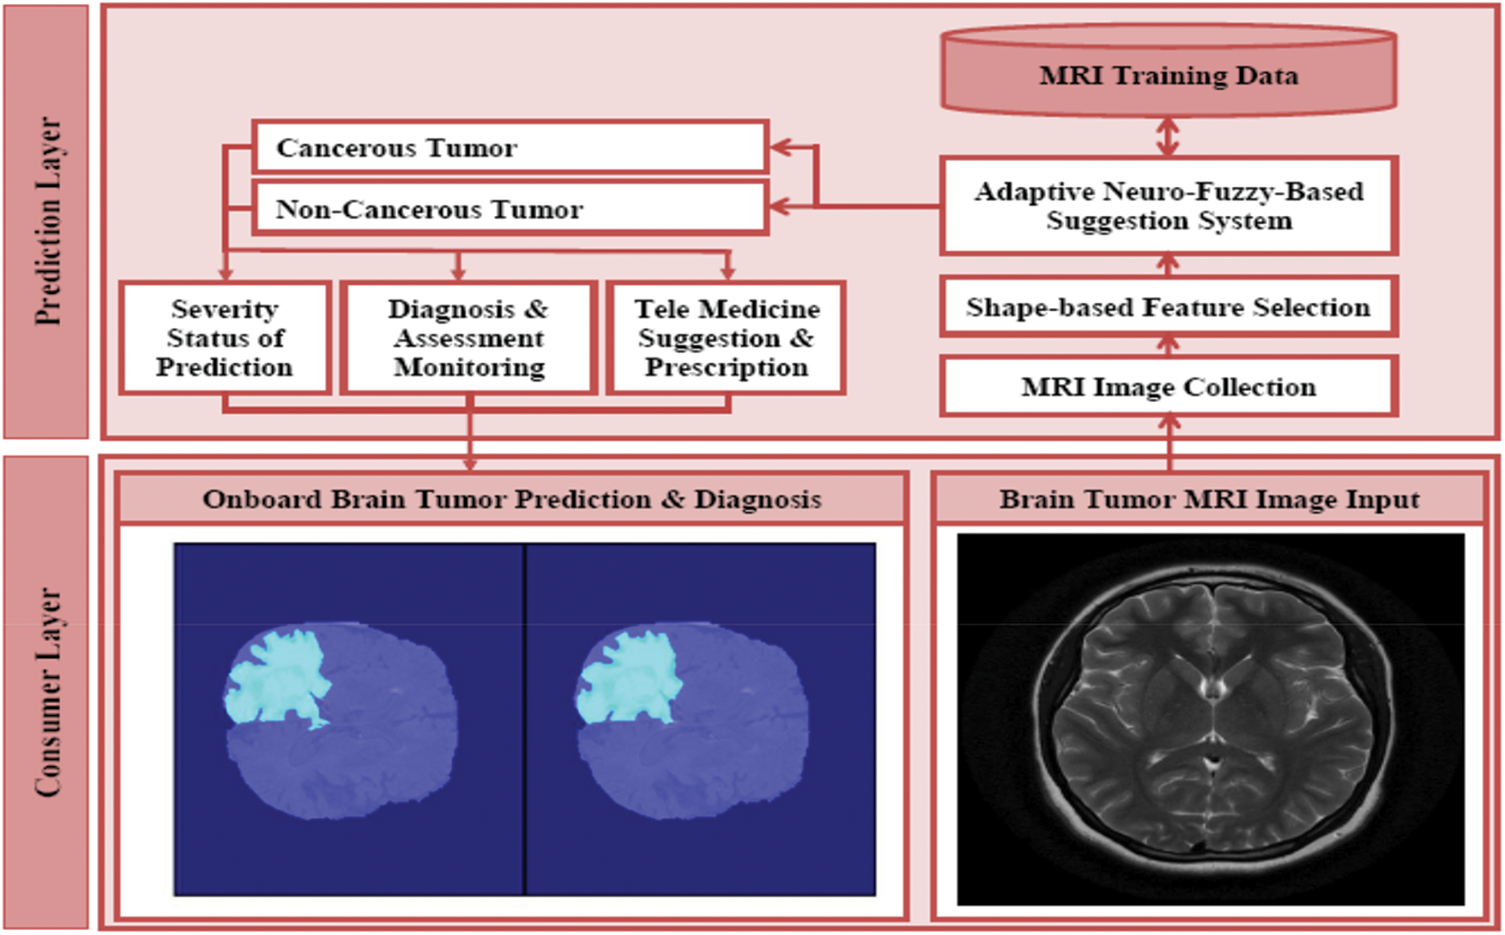
Figure 1: Architecture of automated brain tumor segmentation and diagnosis systems
3.1 Intensity Enhanced Fuzzy C-Means Clustering Technique
Consider the MRI data set y = {y1, y2, …, yn} that consists of n number of data points with the respective input dimension p. The partitioning of data with respect to c number of cluster centers can be represented as v = {v1, v2, …, vc} i.e.,
Let μij be the membership of data yi fit into cluster j,
Usually, the contrast level of MRI varies from one image to another image. Therefore, before taking the classification decision regarding the existence or nonexistence of tumor region, the contrast level of MRI images are to be improved for better detection and diagnosis. To enhance the intensity level of MRI into a uniform level of 0–255, a novel histogram stretching operation is applied as stated in Eqs. (3) and (4).
where
where the fuzzy factor Gij is described by Eq. (6).
Let dar denote the spatial Euclidean distance between yi and yr pixels, and Nv denote the number of neighbors within the window in the order of yi. Here, the value of yr and ujr be the neighbors of yi and uij respectively.
Further, the minimization of fuzzy factor function could be obtained through necessary conditions given in Eqs. (7) and (8).
where yi be the grey value of jth pixel, μij be the fuzzy membership value of ith pixel, N be the quantity of pixels accessible in the grayscale image f = [y1, y2, …, yN], and m be the fuzziness of consequential partition. The noise reduction capability gets improved with respect to fuzzy factors Gij and the corresponding fuzzy partition matrix can be expressed by Eqs. (9) and (10).
The fuzzy factor Gij could control the balance between the image and noise by increasing the computational complexity. There is a contradiction in achieving the enhancement of robustness and minimization of computational complexity simultaneously. Consequently, the membership partition matrix can be modified to minimize the computational complexity as defined by Eq. (11).
Let ujr denote the neighbors of uij, ε denote the grayscale value of the image, and τ denote the smoothness constraint stuck between 0 and 1. Then, the reconstruction of image pertaining to dilation and erosion-based morphological operations could be formulated by Eq. (12).
where
The objective function is given in Eq. (5) can be modified as Eq. (13) due to increased filtering capability and the morphological closing reconstruction.
where μpj correspond to the degree of possible gray value p in the cluster j, εp represent the levels of gray value such that 1 ≤ p ≤ q, and q represent the grey levels presented in ε. Obviously, the modified fuzzy factor can be illustrated as shown in Eq. (14). Here, the value of
As a result, the membership partition matrix can be expressed in the form as U = [upj]c×q. After applying the wiener filter, the partition matrix can be redefined as Ul = wiener[U]. During implementation, select the cluster value c, filtering window size w, fuzzification coefficient value m, and the greatest amount of iterations at the initial stage. Consequently, loop counter value l is initialized to 0 and update the cluster center periodically. Then, the membership partition matrix is initialized randomly and compute the new image with the help of
3.2 Shape Based Feature Selection Approach
The shape-based feature selection approach helps to evaluate the severity levels of brain tumors by exploring the shape distance and shape similarity measurement functions. These features are extracted from the region of interest of the brain tumors lesions. By means of the ANFSS, the classification of brain tumor lesions is progressed through the shape distance and similarity measurement functions.
The chain code in the given space Rk convinces the uniformity class relation against an additional region. Then, the centric of object A is equivalent under transformation C[f(A)] = f[C(A)],
The perpendicular distance from any point (xi, yi) to line y = x tan ∝ +c is the total value of c cos ∝ −ri sin(∝ − ∝ i). To discover the axis of the region, the least-square technique is applied over the boundary point that passes through centric (xg, yg) with respect to angle ∝. Here, the square error denotes the non-negative real numbers as defined by Eq. (23).
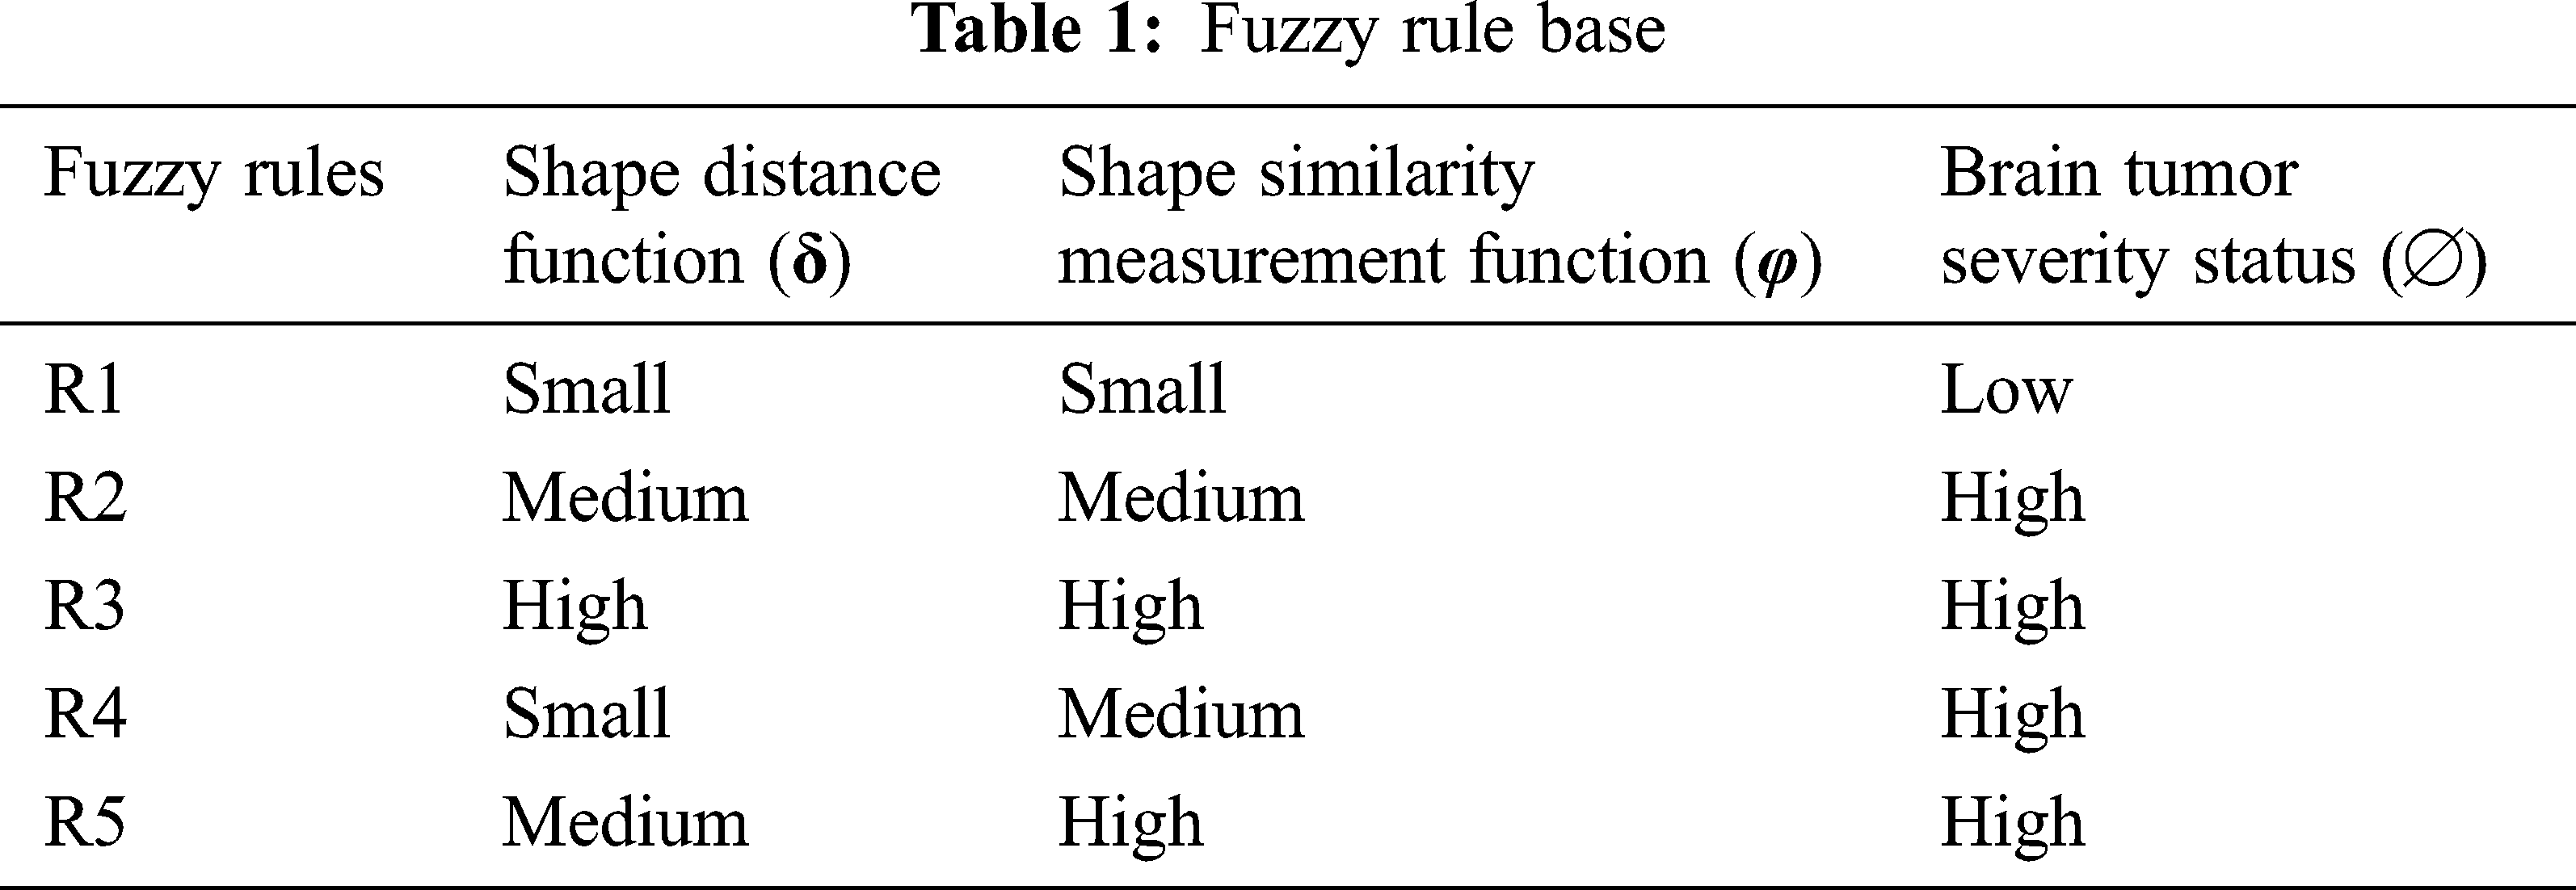
The classification of brain tumor patterns in case of complexity exceeding the threshold limit and also computationally infeasible to construct precise assertions about patient data. This can be controlled through the fuzzy logic controller by converting the linguistic control strategy into an automated process according to expert knowledge. By exploring the fuzzy logic control, the proposed ANFSS makes the classification and early diagnosis of brain tumors lesion. The input variable of fuzzy set forms the triangular membership functions of shape distance such as small (0–0.5), medium (0.4–0.7), and high (0.6–1). The membership functions of shape distance fuzzy sets are defined by Eqs. (24)–(26) respectively.
Similarly, the membership function of shape similarity measurement denoting the fuzzy sets such as small (0–0.4), medium (0.3–0.7), and high (0.6–1) can be defined by Eqs. (27)–(29) respectively.
Here, the shape similarity measurement (φ) among the shapes can be represented as φ = 1 − D/n. Let D be the distance function assessed in the aspects of direction code observed among the line of interest and the given model. Finally, the severity status of brain tumor pattern classification denotes the production variable that has two fuzzy sets such as high (cancerous tumors) and low (non-cancerous tumors). These fuzzy sets can be represented by the membership function expressed in Eqs. (26) and (27) respectively.
Accordingly, the fuzzy rule base of the ANFSS determining the severity stages of brain tumors is expressed in Tab. 1. The rule base plays an significant role in the decision-making process carryout to handle the classification and diagnosis of brain tumors. Moreover, the evaluation of input variables by the ANFSS helps to make an appropriate diagnosis according to its severity status.
Usually, the practitioner decision making regarding the brain tumor treatment completely relay on detection and diagnosis test made with respect to accuracy that is the most essential factor in medical care. Fortunately, the performance evaluation parameters stating the diagnostic tests can be determined in terms of sensitivity, specificity, and accuracy that are widely used statistics to illustrate the test. In particular, the classifier models are trained with respect to data features selected from the T1-weighted, and fluid-attenuated inversion recovery images using the shape-based feature selection method. At the time of testing, the dataset samples are given to the prediction systems such as hybrid kernel-SVM [33], convolution neural network [34], and proposed ANFSS for finding the cancerous tumors in MRI brain images. In this research study, the MRI brain image dataset samples are classified into a training dataset and testing dataset. Here, the training dataset samples are exploited for learning the classifier model and testing dataset samples are exploited to analyze the performance of various prediction systems. The implementation of these prediction system classifier models is carried out using Python codes. The MRI brain images exploited in this research study are taken from the standard database BRATS 2013. The performance results obtained against the T1-weighted, and fluid-attenuated inversion recovery images are presented in Tabs. 2 and 3 respectively.
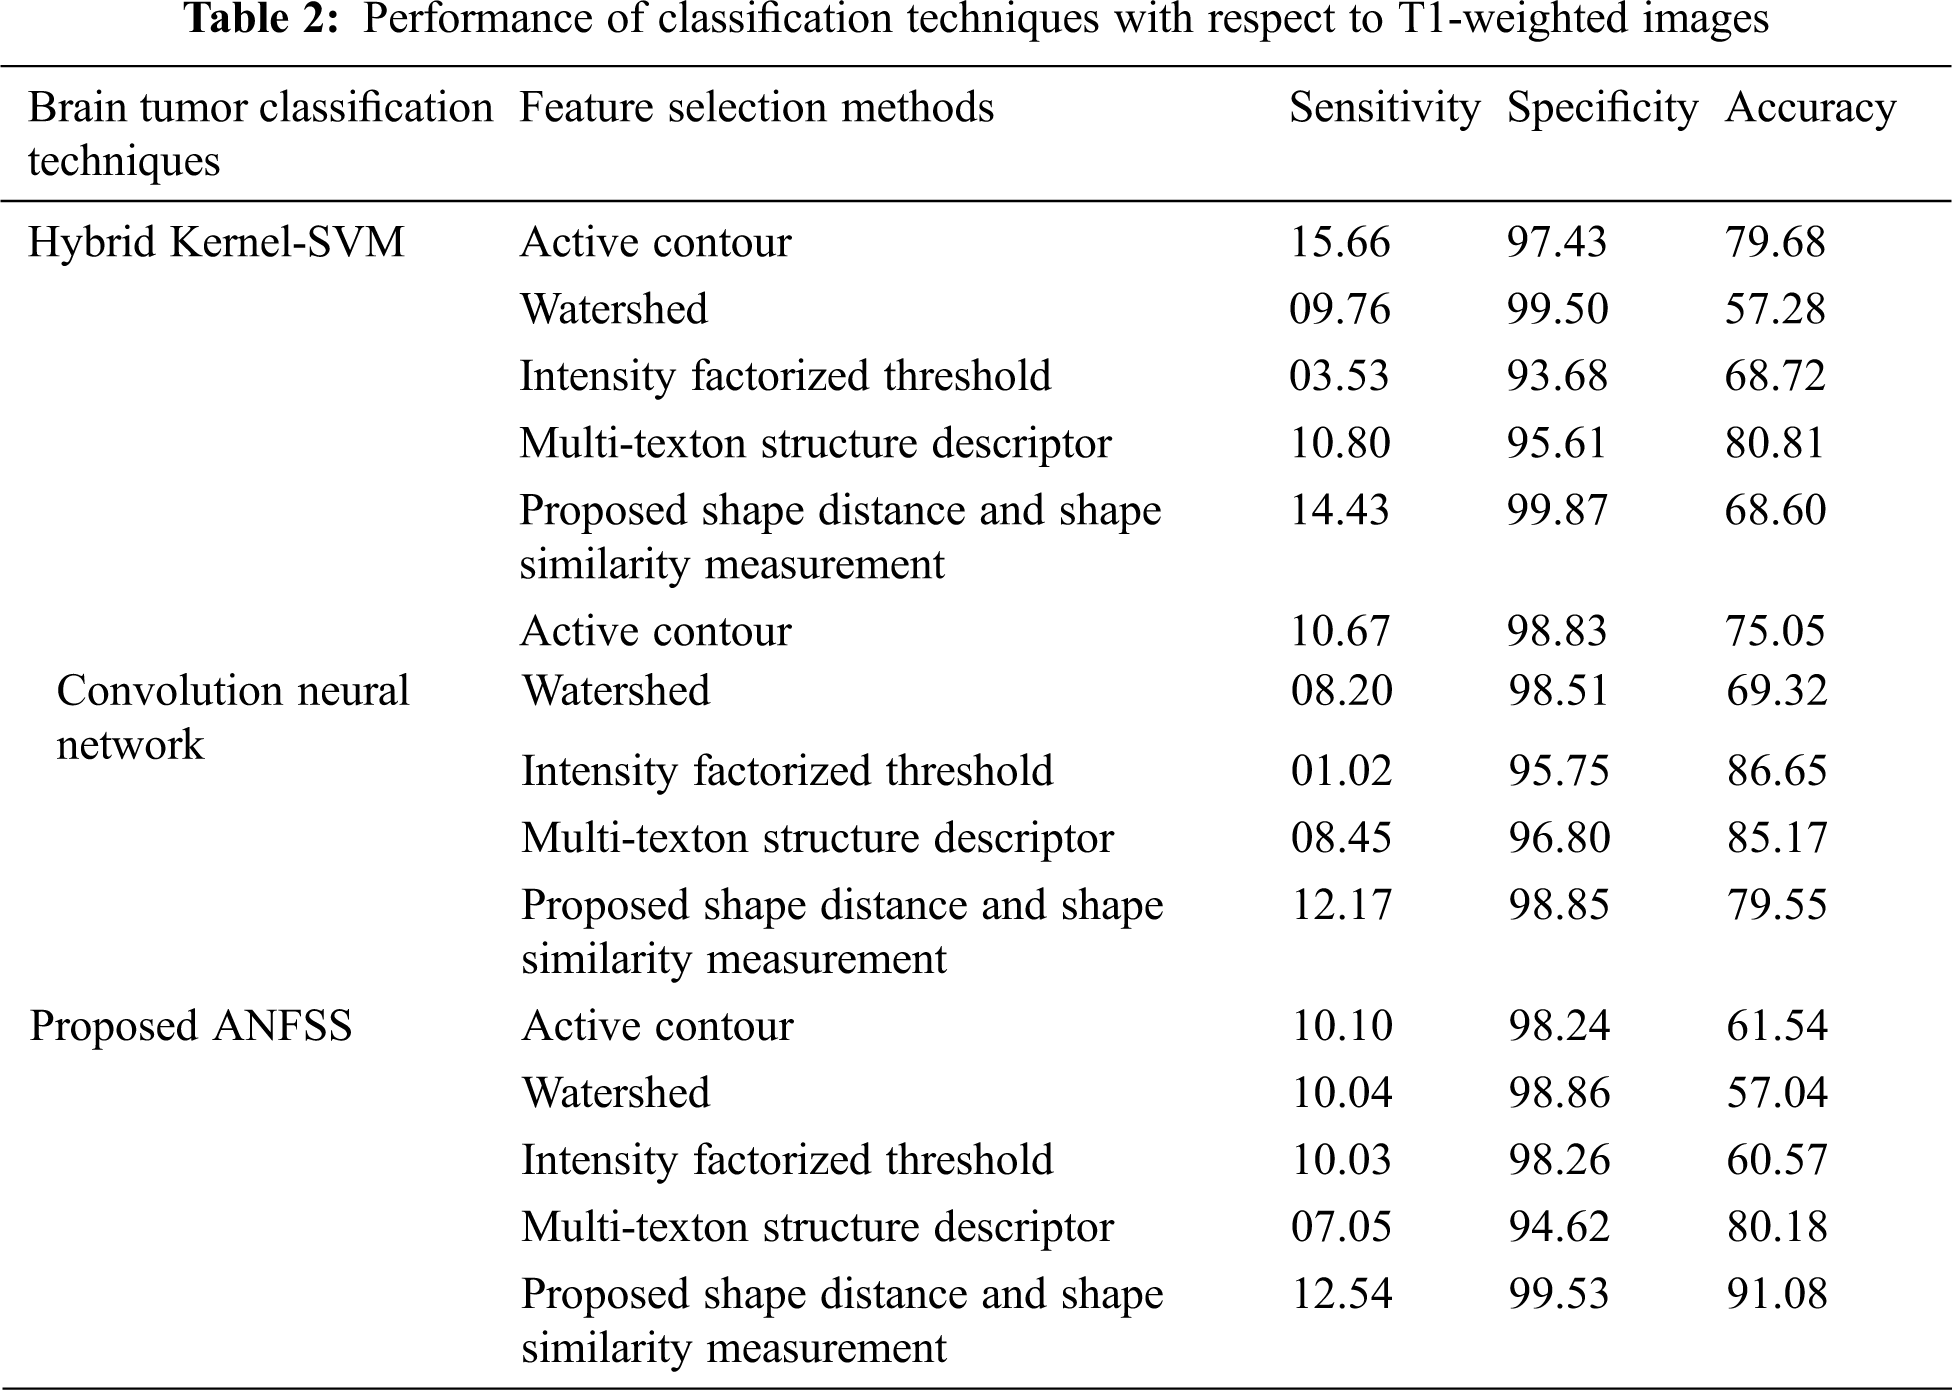
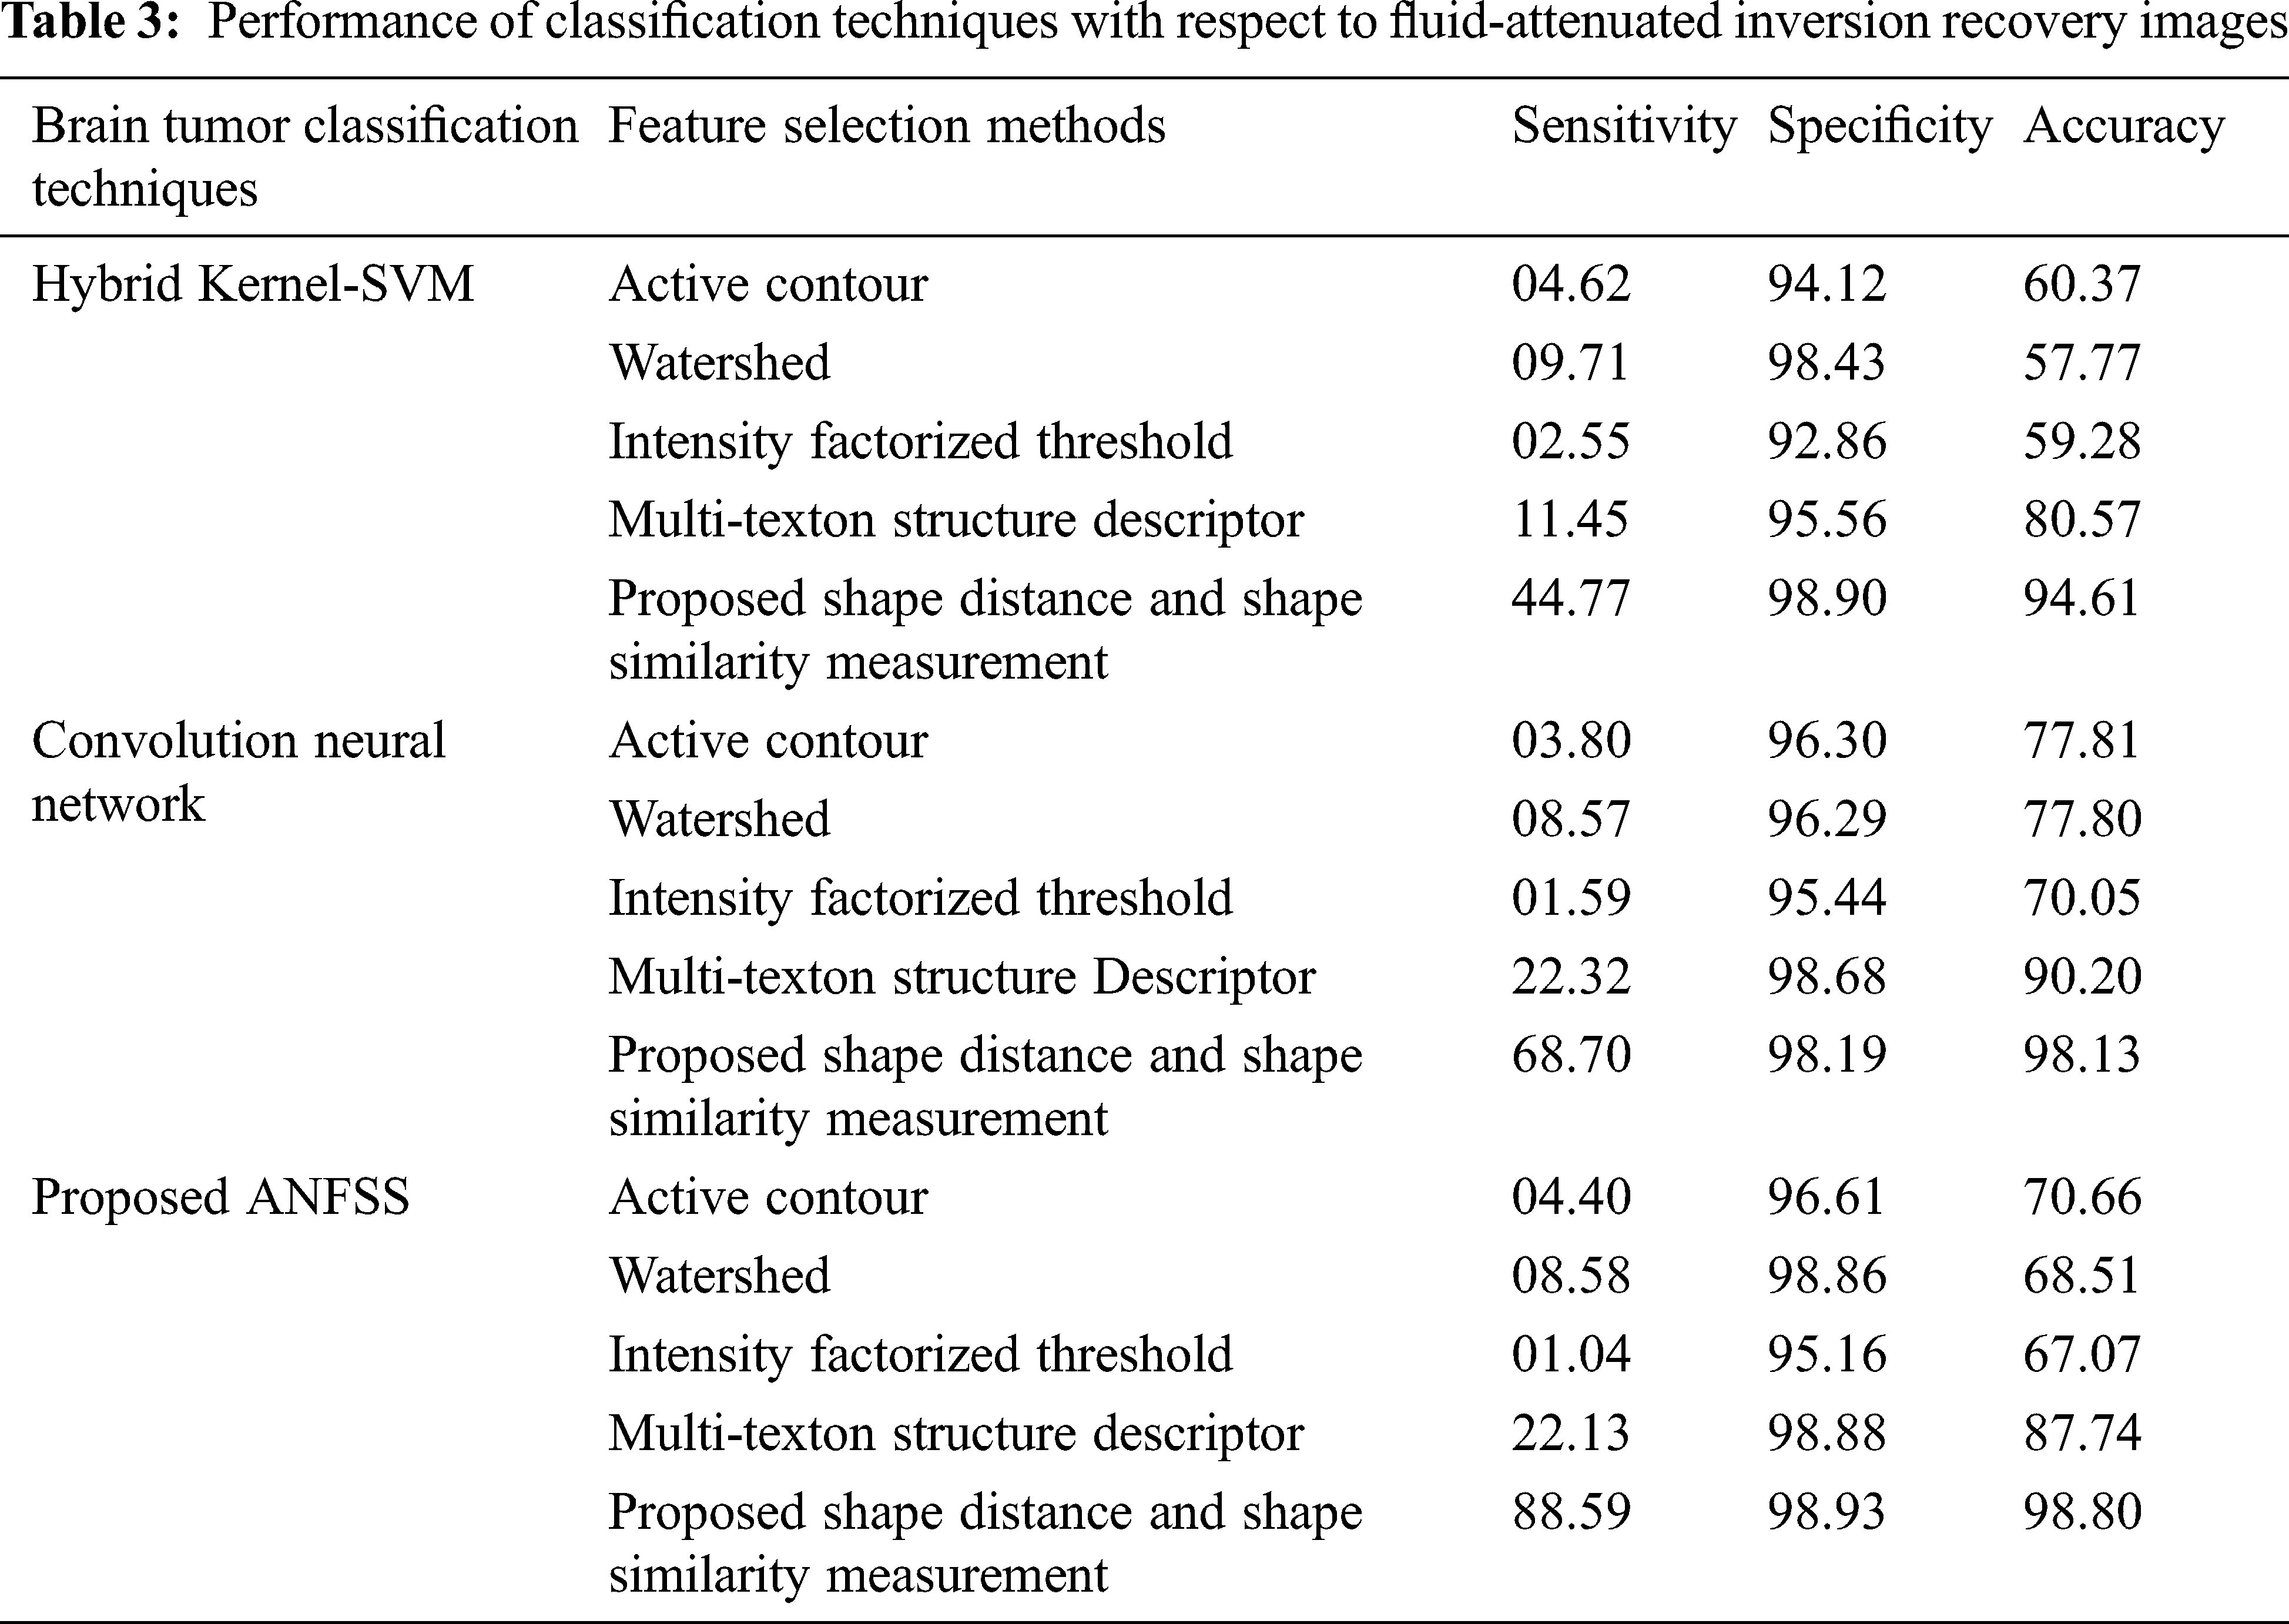
The performance graph is shown in Figs. 2 to 4 indicates the comparison of various classification techniques in terms of sensitivity, specificity, and accuracy against the T1-weighted images dataset. Similarly, the performance graph shown in Figs. 5 to 7 indicates the comparison of various classification techniques in terms of sensitivity, specificity, and accuracy against the fluid-attenuated inversion recovery images dataset. It is more clear from the performance graph, the proposed ANFSS with shape distance and shape similarity measurement feature selection approach outperforms the existing hybrid kernel-SVM, and convolution neural network classifier models with active contour, watershed, intensity factorized threshold, and multi-texton structure descriptor feature selection approaches. On average, the proposed ANFSS always provides better performance on brain tumors classification and diagnosis by improving the performance evaluation metrics such as sensitivity, specificity, and accuracy. In the future, the research study can be enhanced to provide real-time diagnosis and monitoring in the edge-cloud integrated healthcare platforms [35]. The real-time prediction over the cloud-based platform can be enhanced with a negotiation framework to find the optimal service facility to the end-users [36–38]. This can help to make improvised service facility to the end-users with various levels of personalization during diagnosis and monitoring.
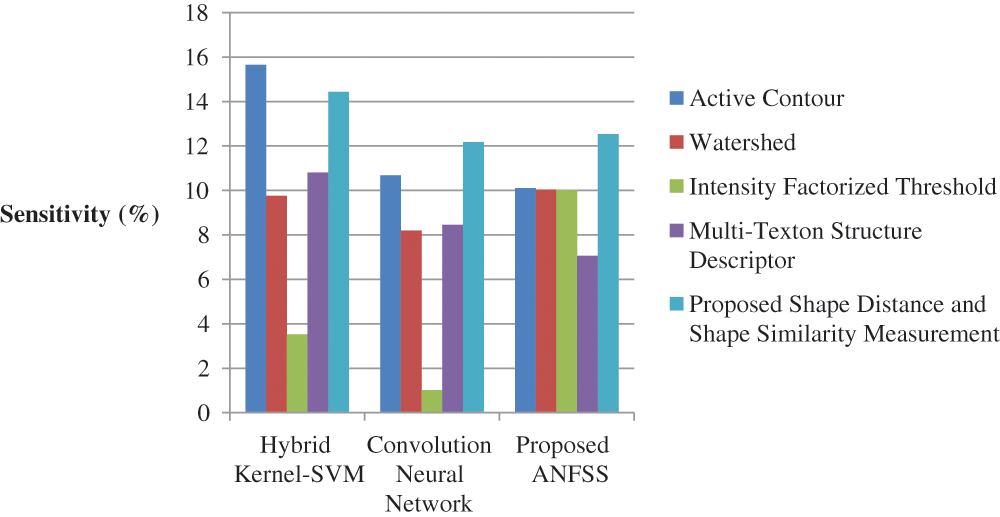
Figure 2: Performance of classification techniques over T1-weighted images in terms of sensitivity
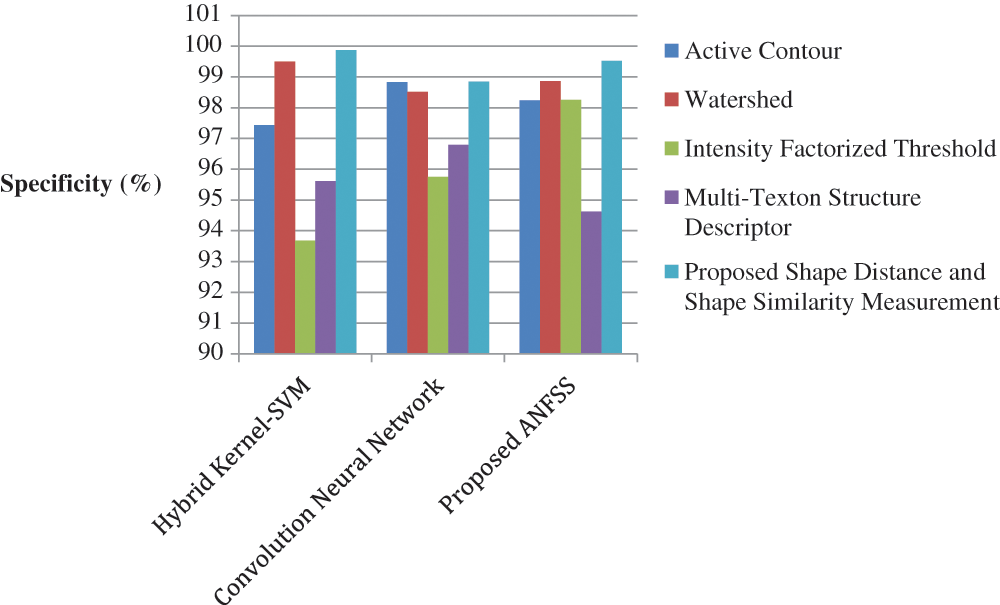
Figure 3: Performance of classification techniques over T1-weighted images in terms of specificity
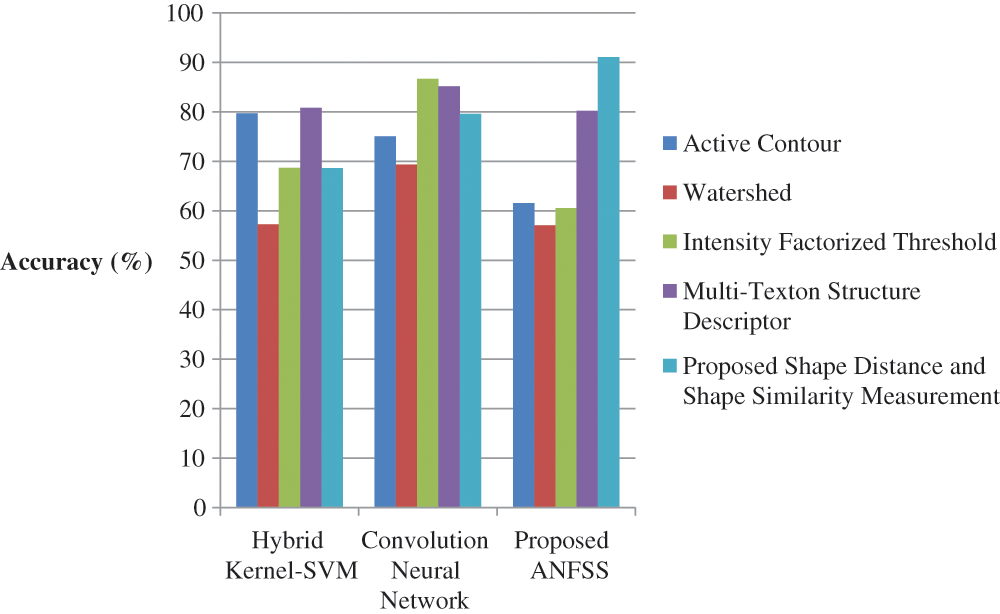
Figure 4: Performance of classification techniques over T1-weighted images in terms of accuracy
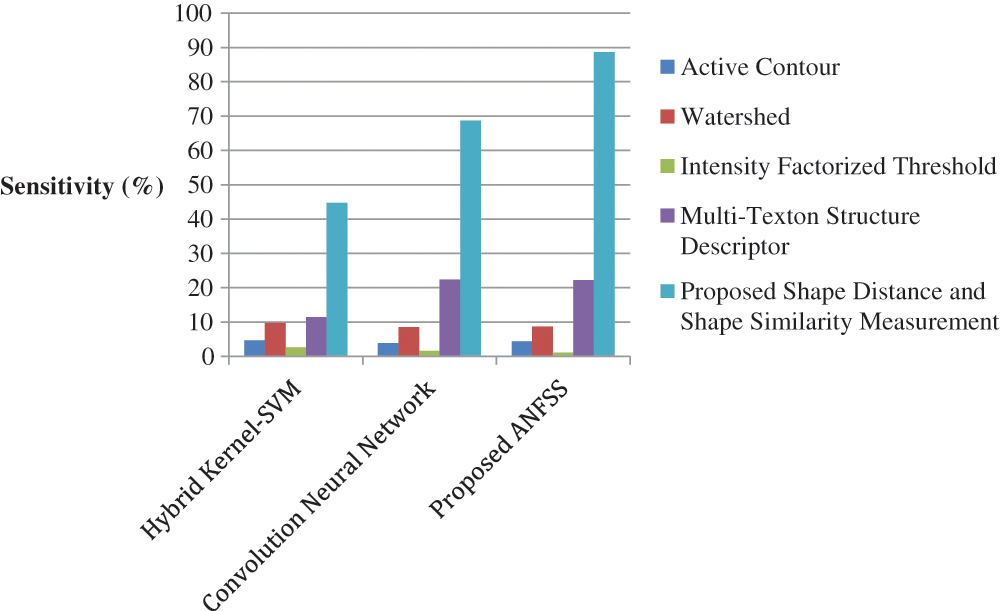
Figure 5: Performance of classification techniques over fluid-attenuated inversion recovery images in terms of sensitivity
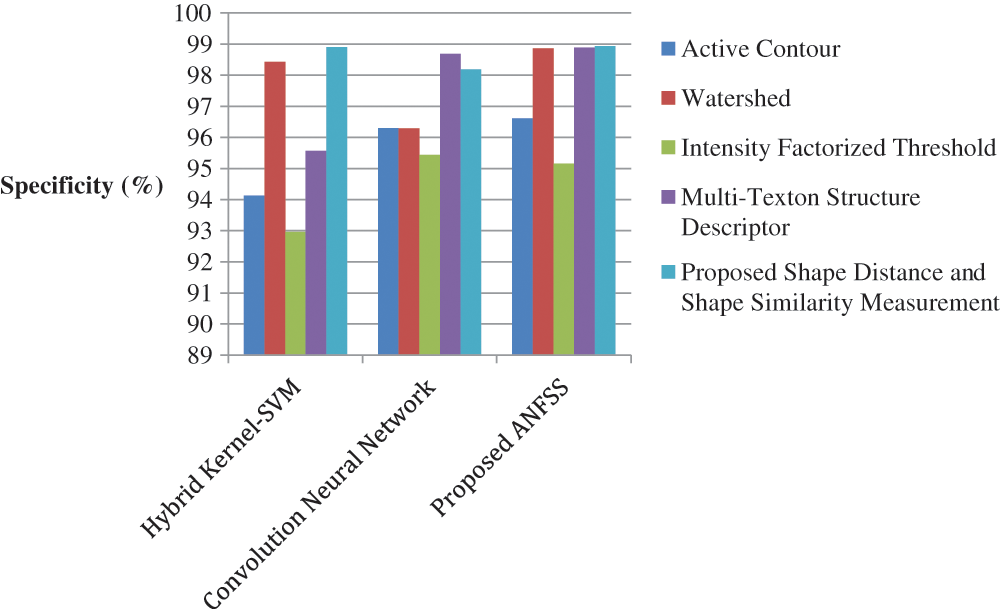
Figure 6: Performance of classification techniques over fluid-attenuated inversion recovery images in terms of specificity
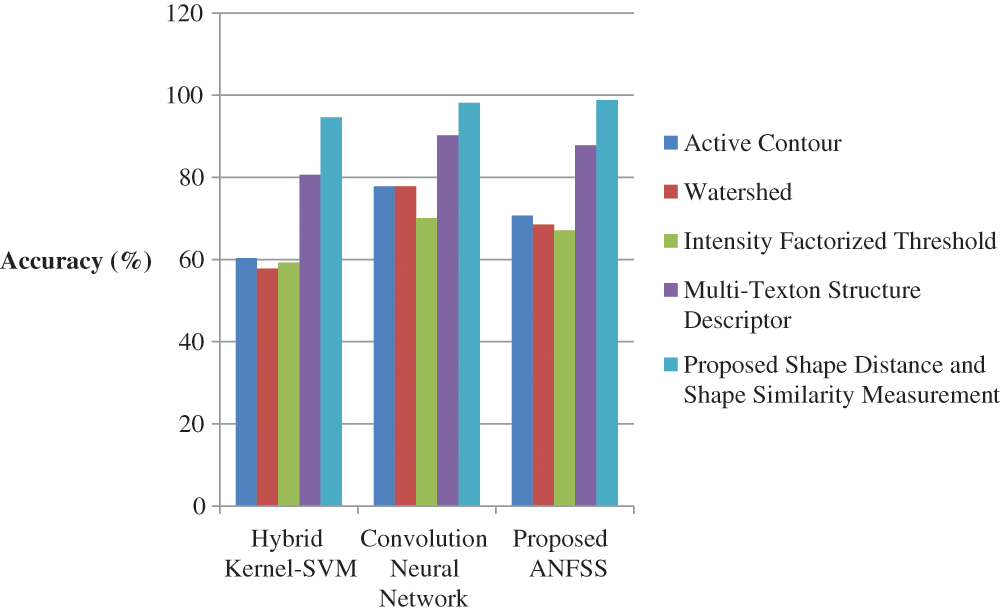
Figure 7: Performance of classification techniques over fluid-attenuated inversion recovery images in terms of accuracy
The present research study has discussed the problems related to brain tumor detection and diagnosis. The ANFSS is able to provide more classification accuracy by applying the intensity enhanced fuzzy c-means clustering technique. This approach helps in minimizing the sum of the distance between the data points. Further, the shape distance and shape similarity measurement functions were explored under the shape-based feature selection method for supporting the early stage of classification. As a result, the performance of the proposed ANFSS improves the prediction time and accuracy of brain tumors. The proposed recognition system makes significant differences in the field of medical science. Moreover, by exploiting this recognition system, the brain tumor disease can be easily recognized at an earlier stage and takes the necessary steps to cure the disease according to the severity stages. In the future, the efficiency of the proposed system can be improved by considering additional feature selection methods and evaluation metrics.
Funding Statement: The authors received no specific funding for this study.
Conflicts of Interests: The authors declare no conflicts of interest regarding the publication of the paper.
1. T. Ostrom, N. Patil, G. Cioffi, K. Waite, C. Kruchko et al., “CBTRUS statistical report: Primary brain and other central nervous system tumors diagnosed in the United States in 2013–2017,” Neuro-Oncology, vol. 22, no. 12, pp. iv1–iv96, 2020. [Google Scholar]
2. A. Anaraki, M. Ayati and F. Kazemi, “Magnetic resonance imaging-based brain tumor grades classification and grading via convolutional neural networks and genetic algorithms,” Biocybernetics and Biomedical Engineering, vol. 39, no. 1, pp. 63–74, 2019. [Google Scholar]
3. M. Mangalleibi and K. Thongam, “Computer aided detection of brain tumor from magnetic resonance images using deep learning network,” Journal of Ambient Intelligence and Humanized Computing, vol. 12, no. 7, pp. 6911–6922, 2020. [Google Scholar]
4. P. G. Rajan and C. Sundar, “Brain tumor detection and segmentation by intensity adjustment,” Journal of Medical Systems, vol. 43, no. 282, pp. 1–13, 2019. [Google Scholar]
5. S. Salma Begum and D. Rajya Lakshmi, “Combining optimal wavelet statistical texture and recurrent neural network for tumour detection and classification over MRI,” Multimedia Tools and Applications, vol. 79, pp. 14009–14030, 2020. [Google Scholar]
6. J. Amin, M. Sharif, M. Yasmin, T. Saba, M. Almas Anjum et al., “A new approach for brain tumor segmentation and classification based on score level fusion using transfer learning,” Journal of Medical Systems, vol. 43, no. 326, pp. 1–16, 2019. [Google Scholar]
7. P. Kaur Chahal, S. Pandey and S. Goel, “A survey on brain tumor detection techniques for MR images,” Multimedia Tools and Applications, vol. 79, pp. 21771–21814, 2020. [Google Scholar]
8. N. Nabizadeh and M. Kubat, “Brain tumors detection and segmentation in MR images: Gabor wavelet vs. statistical features,” Computers and Electrical Engineering, vol. 45, pp. 286–301, 2015. [Google Scholar]
9. S. Chandra and M. Kumar, “Brain tumor detection and segmentation using mesh-free super-diffusive model,” Multimedia Tools and Applications, vol. 79, pp. 2653–2670, 2020. [Google Scholar]
10. C. Helper, “How Much does Brain Surgery Cost?,” 2019. [Online]. Available: https://health.Costhelper.com/brain-surgery.html. [Google Scholar]
11. M. Irfan Sharif, J. Li, J. Amin and A. Sharif, “An improved framework for brain tumor analysis using MRI based on YOLOv2 and convolutional neural network,” Complex & Intelligent Systems, vol. 7, pp. 1–14, 2021. [Google Scholar]
12. S. Polepaka, C. Srinivasa Rao and M. Chandra Mohan, “IDSS-based two stage classification of brain tumor using SVM,” Health and Technology, vol. 10, pp. 249–258, 2020. [Google Scholar]
13. K. Bhatele and S. Bhadauria, “Brain structural disorders detection and classification approaches: A review,” Artificial Intelligence Review, vol. 53, pp. 3349–3401, 2020. [Google Scholar]
14. M. Abd Ellah, A. Awad, A. Khalaf and F. A. Hamed, “A review on brain tumor diagnosis from MRI images: Practical implications, key achievements, and lessons learned,” Magnetic Resonance Imaging, vol. 61, pp. 300–318, 2019. [Google Scholar]
15. R. Hashemzehi, S. Javad Seyyed Mahdavi, M. Kheirabadi and S. RezaKamel, “Detection of brain tumors from MRI images base on deep learning using hybrid model CNN and NADE,” Biocybernetics and Biomedical Engineering, vol. 40, no. 3, pp. 1225–1232, 2020. [Google Scholar]
16. M. Abd Ellah, A. Awad, A. M. Khalaf and F. A. Hamed, “A review on brain tumor diagnosis from MRI images: Practical implications, key achievements, and lessons learned,” Magnetic Resonance Imaging, vol. 61, pp. 300–318, 2019. [Google Scholar]
17. C. Michael, L. Sarah and J. Nelson, “Supervised pattern recognition for the prediction of contrast-enhancement appearance in brain tumors from multivariate magnetic resonance imaging and spectroscopy,” Artificial Intelligence in Medicine, vol. 43, pp. 61–74, 2008. [Google Scholar]
18. B. Chen, L. Zhang, H. Chen, K. Liang and X. Chen, “A novel extended kalman filter with support vector machine based method for the automatic diagnosis and segmentation of brain tumors,” Computer Methods and Programs in Biomedicine, vol. 200, pp. 1–25, 2020. [Google Scholar]
19. M. Togaçar, Z. Cömert and B. Ergen, “Classification of brain MRI using hyper column technique with convolutional neural network and feature selection method,” Expert Systems with Applications, vol. 149, pp. 1–8, 2020. [Google Scholar]
20. F. Gonzale, A. Belanche Munoz, E. Romero, A. Vellido and M. Julia Sape, “Feature and model selection with discriminatory visualization for diagnostic classification of braintumors,” Neurocomputing, vol. 73, pp. 622–632, 2010. [Google Scholar]
21. A. R. Deepa and W. R. Sam Emmanuel, “An efficient detection of brain tumor using fused feature adaptive firefly backpropagation neural network,” Multimedia Tools and Applications, vol. 78, no. 9, pp. 11799–11814, 2018. [Google Scholar]
22. P. Sun, D. Wang, V. Mok and L. Shi, “Comparison of feature selection methods and machine learning classifiers for radiomics analysis in glioma grading,” IEEE Access, vol. 7, pp. 102010–102020, 2019. [Google Scholar]
23. G. Jothi and H. Inbarani, “Hybrid tolerance rough set–firefly based supervised feature selection for MRI brain tumor image classification,” Applied Soft Computing, vol. 46, pp. 639–651, 2016. [Google Scholar]
24. N. Gordillo, E. Montseny and P. Sobrevilla, “State of the art survey on MRI brain tumor segmentation,” Magnetic Resonance Imaging, vol. 31, no. 8, pp. 1426–1438, 2013. [Google Scholar]
25. A. Wadhwa, A. Bhardwaj and V. Verma, “A review on brain tumor segmentation of MRI images,” Magnetic Resonance Imaging, vol. 61, pp. 247–259, 2019. [Google Scholar]
26. S. Taheri, H. Ong and V. F. Chong, “Level-set segmentation of brain tumors using a threshold based speed function,” Image and Vision Computing, vol. 28, pp. 26–37, 2010. [Google Scholar]
27. M. Khaled Abd Ellah, A. Awad, A. M. Khalaf and F. A. Hamed, “A review on brain tumor diagnosis from MRI images: Practical implications, key achievements, and lessons learned,” Magnetic Resonance Imaging, vol. 61, pp. 300–318, 2019. [Google Scholar]
28. S. Chandra and M. Kumar Bajpai, “Brain tumor detection and segmentation using mesh-free super-diffusive model,” Multimedia Tools and Applications, vol. 79, pp. 2653–2670, 2019. [Google Scholar]
29. P. Parveen and A. Singh, “Detection of brain tumor in MRI images, using fuzzy C-means segmented images and artificial neural network,” in Proc. ICRCWCIP, New Delhi, India, pp. 123–131, 2016. [Google Scholar]
30. A. Chaudhary and V. Bhattacharjee, “An efficient method for brain tumor detection and categorization using MRI images by K-means clustering & DWT,” International Journal of Information Technology, vol. 12, no. 1, pp. 141–148, 2018. [Google Scholar]
31. D. Maruthi Kumar, D. Satyanarayana and M. N. Giri Prasad, “MRI brain tumor detection using optimal possibilistic fuzzy C-means clustering algorithm and adaptive k-nearest neighbor classifer,” Journal of Ambient Intelligence and Humanized Computing, vol. 12, pp. 2867–2880, 2021. [Google Scholar]
32. J. Amin, M. Sharif, M. Raza, T. Saba, R. Sial et al., “Brain tumor detection: A long short-term memory (LSTM)-based learning model,” Neural Computing and Applications, vol. 32, no. 20, pp. 15965–15973, 2019. [Google Scholar]
33. A. Jayachandran and R. Dhanasekaran, “Severity analysis of brain tumor in MRI images using modified multi-texton structure descriptor and kernel-SVM,” Arabian Journal for Science and Engineering, vol. 39, pp. 7073–7086, 2014. [Google Scholar]
34. M. Havaei, A. Davy, D. WardeFarley, A. courville, Y. bengio et al., “Brain tumor segmentation with deep neural networks,” Medical Image Analysis, vol. 35, pp. 18–31, 2016. [Google Scholar]
35. R. Rajkumar, R. Sathish Kumar, K. Harimoorthy, P. Nagappan and R. Kanagachidambaresan Ramasubramanian, “IoT-Based smart healthcare video surveillance system using edge computing,” Journal of Ambient Intelligence and Humanized Computing, vol. Inpress, pp. 1–13, 2021. [Google Scholar]
36. R. Rajkumar, M. Thangarathanam, “Agent-based automated dynamic SLA negotiation framework in the cloud using the stochastic optimization approach,” Applied Soft Computing, vol. 101, pp. 1–48, 2021. [Google Scholar]
37. R. Rajkumar, R. Sathish Kumar and G. R. Kanagachidambaresan, “Agent-based cloud service negotiation architecture using similarity grouping approach,” International Journal of Wavelets, Multiresolution and Information Processing, vol. 18, no. 1, pp. 1941015(1–192020. [Google Scholar]
38. R. Rajkumar and M. Thangarathinam, “A negotiation framework for the cloud management system using similarity and gale shapely stable matching approach,” KSII Transactions on Internet and Information Systems, vol. 9, pp. 2050–2077, 2015. [Google Scholar]
 | This work is licensed under a Creative Commons Attribution 4.0 International License, which permits unrestricted use, distribution, and reproduction in any medium, provided the original work is properly cited. |