DOI:10.32604/iasc.2022.024311
| Intelligent Automation & Soft Computing DOI:10.32604/iasc.2022.024311 | |
| Article |
Stock Price Prediction Using Optimal Network Based Twitter Sentiment Analysis
1Department of Computer Science and Engineering, GITAM Institute of Technology, GITAM Deemed to be University, Vishakhapatnam, 530045, India
2Department of Marketing and Corporate Strategy, Tamale Technical University, Tamale, Ghana
3Leanovate Info Solutions, Bengaluru, 560011, India
4Department of Computer Science and Engineering, K. Ramakrishnan College of Engineering, Trichy, 621112, India
5Department of Computer Science and Engineering, Panimalar Engineering College, Chennai, 600123, India
6Department of Electrical Engineering, Model Institute of Engineering and Technology, Jammu, 181122, India
7Department of Computer Science and Engineering, Saveetha School of Engineering, Chennai, 602105, India
*Corresponding Author: Singamaneni Kranthi Kumar. Email: dr.kksingamaneni@gmail.com
Received: 13 October 2021; Accepted: 29 November 2021
Abstract: In recent times, stock price prediction helps to determine the future stock prices of any financial exchange. Accurate forecasting of stock prices can result in huge profits to the investors. The prediction of stock market is a tedious process which involves different factors such as politics, economic growth, interest rate, etc. The recent development of social networking sites enables the investors to discuss the stock market details such as profit, future stock prices, etc. The proper identification of sentiments posted by the investors in social media can be utilized for predicting the upcoming stock prices. With this motivation, this paper focuses on the design of effective stock price prediction using dragonfly algorithm (DFA) based deep belief network (DBN) model. The DFA-DBN technique aims to properly determine the sentiments of the investors from Twitter data and forecast future stock prices. From Twitter data, the DFA-DBN technique attempts to accurately determine the sentiments of investors, as well as predict future stock prices. For accurate stock price prediction, the proposed DFA-DBN model includes the development of a DBN model. The proposed DFA-DBN model involves the design of DBN model for accurate prediction of stock prices. Besides, the hyperparameter tuning of the DBN technique is performed by utilize of DFA and thereby boosts the overall prediction performance. For validating the supremacy of the DFA-DBN model, a comprehensive experimental analysis takes place and the results demonstrate the accurate prediction of stock prices. A predicted DFA-DBN algorithm with a higher accuracy of 94.97 percent is available. On the basis of the data in the tables and figures above, the DFA-DBN approach has been demonstrated to be an effective instrument for anticipating stock price fluctuations.
Keywords: Stock price prediction; Twitter; sentiment analysis; deep learning; hyperparameter optimization
The popularity of microblogging could be described by their distinctive features like accessibility and convenience that enables user to instantaneously disseminate and respond data with no restrictions/with limited on content. Currently, Twitter is the 10th most widespread website around the world with 300 million active users once-a-month. Microblogging is a social media platform that blends short messaging with the creation of content. A microblog can be used to transmit short messages to an online audience in order to enhance interaction. Twitter, Instagram, Facebook, and Pinterest are all popular social media platforms for microblogging. Certain microblogging systems allow users to restrict who has access to their microblogs or to publish entries in ways other than the web-based interface. Texting, instant messaging, e-mail, digital audio, and digital video are all examples of these technologies. Twitter. In the world of microblogging, Twitter is the most well-known platform. The following image is a representation of the popularity of microblogging as a result of its distinguishing characteristics. Microblogging sites are popular because they provide content in formats that are appealing to today’s users. While there are several microblogging platforms available, we’ve determined that Twitter, Pinterest, Tumblr, Instagram, and Facebook are the frontrunners. Additionally, Reddit and LinkedIn are catching up quickly. Twitter has been upgrading hundreds of millions of times a day with contents differing to an individual everyday life update to global events and news [1]. Twitter enables user to make own profiles that other might ‘follow’ or subscribe to, post status update called as ‘tweets’ restricted to 140 characters and for interacting with other people using ‘replies’. Initially, Twitter was setup as a kind of transmission platform designed to permit friends for keeping tabs on each other. A stock API is a programming interface that allows a source to get a stream of real-time stock market data. Many existing brokerage platforms, for example, rely on a stock API to offer real-time data to its investors in order to make buying and selling choices Because of the accessibility of an application programming interface (API), that stores tweet posts which might be accessed by the researcher, and their convenient features like filtering via variables such as keywords and location [2], Twitter has stimulated researchers to be interested and explores their potential away from that of social media [3]. While calculating the structural property of Twitter as social network study has concentrated on users effectively.
Content analysis study has concentrated on exploring the motivation, content, and virality of twitters. Deepak Kumar et al. [4] classified the motivation of twitters into; daily chatter, conversations, reporting news, and sharing information. Sentimental analysis study has concentrated on using Twitter chatter sentiments to predict the behaviors. Satpathy et al. [5] arguing that even though all the tweets represent individual opinions, an aggregate sample must give precise representations of public sentiment. Though it is accepted generally that stock market price depends to a large extent on novel data and follows a random pattern, lot of research has attempted for predicting the stock market behaviors with external stimuli based on behavioral economics which emphasizes the significant part of the sentiment in making decisions.
Stock market predictions aim is to decide the future movement of the stock values of a financial transaction. The precise predictions of stake price movements would lead to additional profit investors could generate [6]. Forecasting how the stock markets would move is the most difficult problem because of the several aspects included in the stock predictions, like economic growth interest, rates, and politics make the stock market very hard and volatile for the accurate prediction [7]. The prediction of share provides high possibility for the profits and is the main objective for studies in this field; knowledge of stock movement within a second might leads to higher profit [8]. As stock investments are a main financial market event, a lack of detailed information and precise knowledge will lead to an unavoidable loss of investments. The stock market prediction is a tedious process since market movement is often subjected to uncertainties [9]. The stock market predictive method is separated into 2 major classes: fundamental and technical analysis. Technical analysis focus on exploring past stock price for predicting future stock value (viz., its focus on the direction of price). At the same time, fundamental analysis are based mainly on exploring unstructured textual data such as earning reports and financial news. Several authors believe that technical analysis approach could forecast the stock market movement [10].
Motivated by the intrinsic relationship between the sentiments and stock prices, this study designs a new stock price prediction using dragonfly algorithm (DFA) based deep belief network (DBN) model. The proposed DFA-DBN technique comprises preprocessing prediction and hyperparameter tuning. Moreover, the DBN technique has been implemented for predicting the upcoming stock prices by analyzing the sentiments in Twitter data. Furthermore, the hyperparameter optimizer using DFA is derived to optimally choose the hyperparameters involves in it. A comprehensive simulation analysis is carried out on Twitter data and the results are inspected under varying aspects.
Generally, Zach [11] proposes that has been restricted proof of direct links among market performance and political events because of its complexity in measuring political alteration. In addition to this, Klibanoff et al. [12] conjecture that the issue with this thread of researches is that generally surveys are retrospective and, thus, determinant of investor behaviors like investment sentiments are no longer observable.
Most recent surveys appear to confirm the presence of relationships among stock market movements and political events and news. The stock market returns (Israeli) are further extreme follows political events, when [13] finding that there is an important relationship among financial crises and political uncertainty afterward controlling their analysis for the aspects like market contagion and difference in economic condition of the sampled nation. Lastly, the relationships among trust in the government and public sentiment are very important for the stock market investor when compared to non-participant, recommending that public moods regarding politics are a factor in making investment decisions [14].
Vinothini et al. [15] construct LSTM based DL networks to forecast the closing prices of the stock and relate the predictive accuracy of the ML model using the LSTM models. Further, we increase the prediction models by incorporating a sentimental analysis model on twitters information for correlating the public sentiments of stock price with the market sentiments. It is made by the twitter sentiments and earlier week closing value for predicting stock price movements for the following weeks.
Jin et al. [16] proposed a DL based stock market predictive method which considers investor sentimental tendency. Initially, proposed to include investor sentiments for predicting stocks that could efficiently enhance the predictive performance. They proposed to decompose gradually the complicated series of stock prices by adapting EMD method that yields improved predictive performance. Next, adapt LSTM model because of its advantage of exploring relationship between time series data via its memory function. In Guo et al. [17], a new social network sentimental analysis method has been presented according to the TSS for realtime predictions of the future stock market price FTSE 100, related to traditional econometric model of investor sentiments based CEFD method. The presented TSS method feature a novel baseline relation method that exhibits better predictive performance, as well as reduces the computational burden, and allows faster decision making without the knowledge of past information. Classification modelling, Polynomial regression, and lexicon based sentimental analysis were conducted.
Gupta et al. [18] explore the Stock Twits content and extract financial sentiments with a collection of text featurization and ML techniques. The correlations among the aggregated everyday sentiments and stock price movements were studied later. Lastly, the sentimental data is utilized as well as the historical stock time series data to enhance the performance of stock price movement predictions. Mohan et al. [19] improved the performance of stock price prediction by collecting a huge number of time series data and analyze it regarding related news articles, with DL methods. The gathered datasets include everyday stock prices for S&P500 Company to 5 years and over 265,000 financial news articles associated with this company.
3 The Proposed Stock Price Prediction Model
In order to accomplish effective stock price prediction using Twitter data, this study has designed a new DFA-DBN model and it operates on three major stages. At the initial stage, the Twitter data is preprocessed to get rid of unwanted data and transform it into a meaningful format. Next, in the second stage, the predictive process using DBN model is carried out. Finally, the parameter tuning of the DBN technique is performed by utilize of DFA and it results in improved prediction results. Fig. 1 demonstrates the overall process of proposed DFA-DBN model.
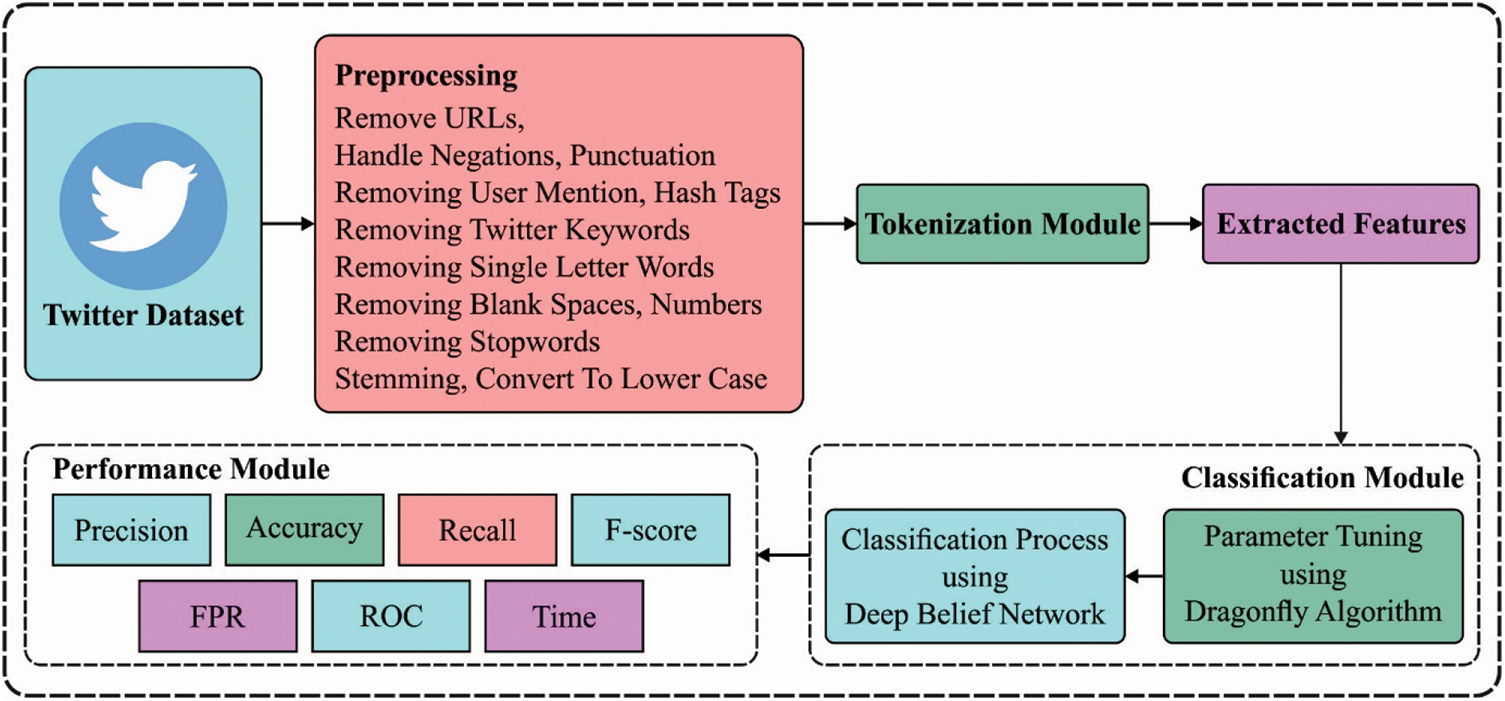
Figure 1: Overall process of DFA-DBN model
3.1 Stage 1: Data Preprocessing
In the preprocessing step, distinct twitter data sets are developed for manipulation. This type of tweet contains several numbers, HTML tags, punctuation, multiple spaces, and single characters. Some functions have been utilized for cleaning datasets in these steps. The symbol ‘⟨⟩’ has been replaced by an empty space. Again, all characters that don’t specify any useful transmission has been replaced by a space correspondingly. Lastly, all multiple spaces have been detached from this tweet. Afterward the preprocessing step, tokenization procedure is utilized for generating a word to index dictionary where every single word is generated as a key in the corpus. Using word embedded was helpful for extracting important words and explore semantic and similarity relations accurately. Lastly, an embedding matrix is produced where every single row number matches with index of words in the corpus. The raw tweet contains text instances that could not deal with ML process. Thus, run tokenization and data preprocessing procedure for making it implementable for classification and clustering computations.
3.2 Stage 2: Prediction Process
The next stage of preprocessing is the prediction process which can be performed by the use of DBN model. DBN is a class of deep generative method which made up of l stack of RBM. The primary objective of DBN is the weight initiation of a DNN method for producing optimal methods compared to the models through an arbitrary weight. This method makes the prediction very efficient. On the other hand, DBN could be efficiently utilized for performing layer-wise pre-training proposed to initiate training of a BP model. The energy based probabilistic method is a general model utilized for making a joint distribution among observed data, x. and hidden variable, h, according to the following formula:
whereas
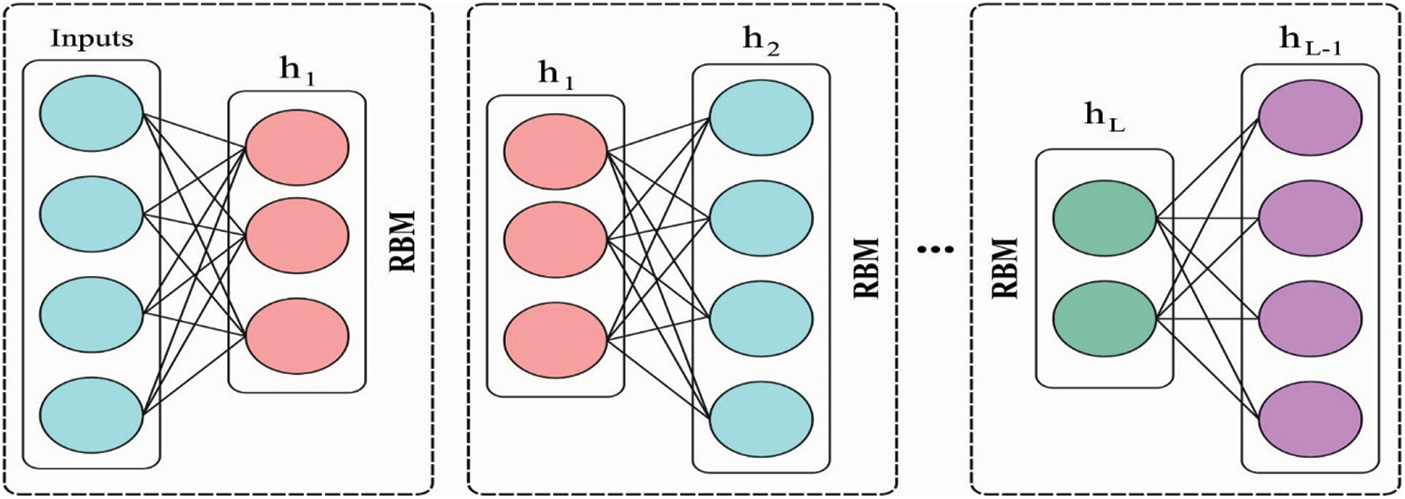
Figure 2: DBN structure
RBM is a type of Boltzmann machine without internal layer connections in the hidden and visible layers. During this method, the likelihood of joint configuration
In which
The derivation of the logarithm of likelihood formula abovementioned is determined by:
Let
In which
Lastly, the hidden units will turn on when the likelihood is higher when compared to the threshold. In order to update visible unit, it is widely used likelihood,
Afterward evaluating the gradient, it is potential to upgrade parameters, bias, and weight. The 2 major variables, momentum learning and rate, could enhance the upgraded parameter based on the prior one. Learning rate is multiplied with
3.3 Stage 3: Hyperparameter Tuning Process
At the final stage, the hyperparameter optimizer using DFA is derived which helps to optimally select the hyperparameters involved in the DBN model. The DFA is dependent upon the swarming performance of dragonflies, which follow 3 fundamental principles:
Separation: Static collision avoidance of individual dragonflies in neighborhoods.
Alignment: The velocity corresponding of individual dragonflies in neighborhoods.
Cohesion: The tendency of individual dragonflies towards neighborhood centers of a mass.
In addition, any swarm of living creatures could follows its survival instinct. Therefore, each dragonfly individual also needs to be attracted towards food source (food attraction) and distract outwards predator (predator distraction). In conclusion, the swarm behaviors of the dragonfly community could be described with these 5 major aspects.
To simulate the swarm behaviors of the dragonfly, the above-mentioned features have to be arithmetically modeled in the following. The separation motion is formulated by:
where
The alignment motion is estimated as:
Let
The cohesion motion is quantified as:
where
Let
where
The integration of above-mentioned motion could forecast the corrective patterns of the individual dragonfly in all iterations. The position of individual dragonfly is upgraded in all iterations with the present location of an individual dragonfly
Let
By interfering with the predator weight, separation, alignment, cohesion, and food attraction
In this section, the performance validation of the DFA-DBN technique takes place on Twitter dataset. The results are examined in-terms of training, validation, and testing dataset. Tab. 1 gives comprehensive outcomes analysis of the DFA-DBN technique under different measures. Fig. 3 portrays the results analysis of the DFA-DBN technique on the applied training dataset. The results reported that the DFA-DBN manner has accomplished effectual results with a precision of 0.9536, sensitivity of 0.9084, specificity of 0.9748, accuracy of 0.9506, F-score of 0.9304, MCC of 0.8928, and FPR of 0.0252.
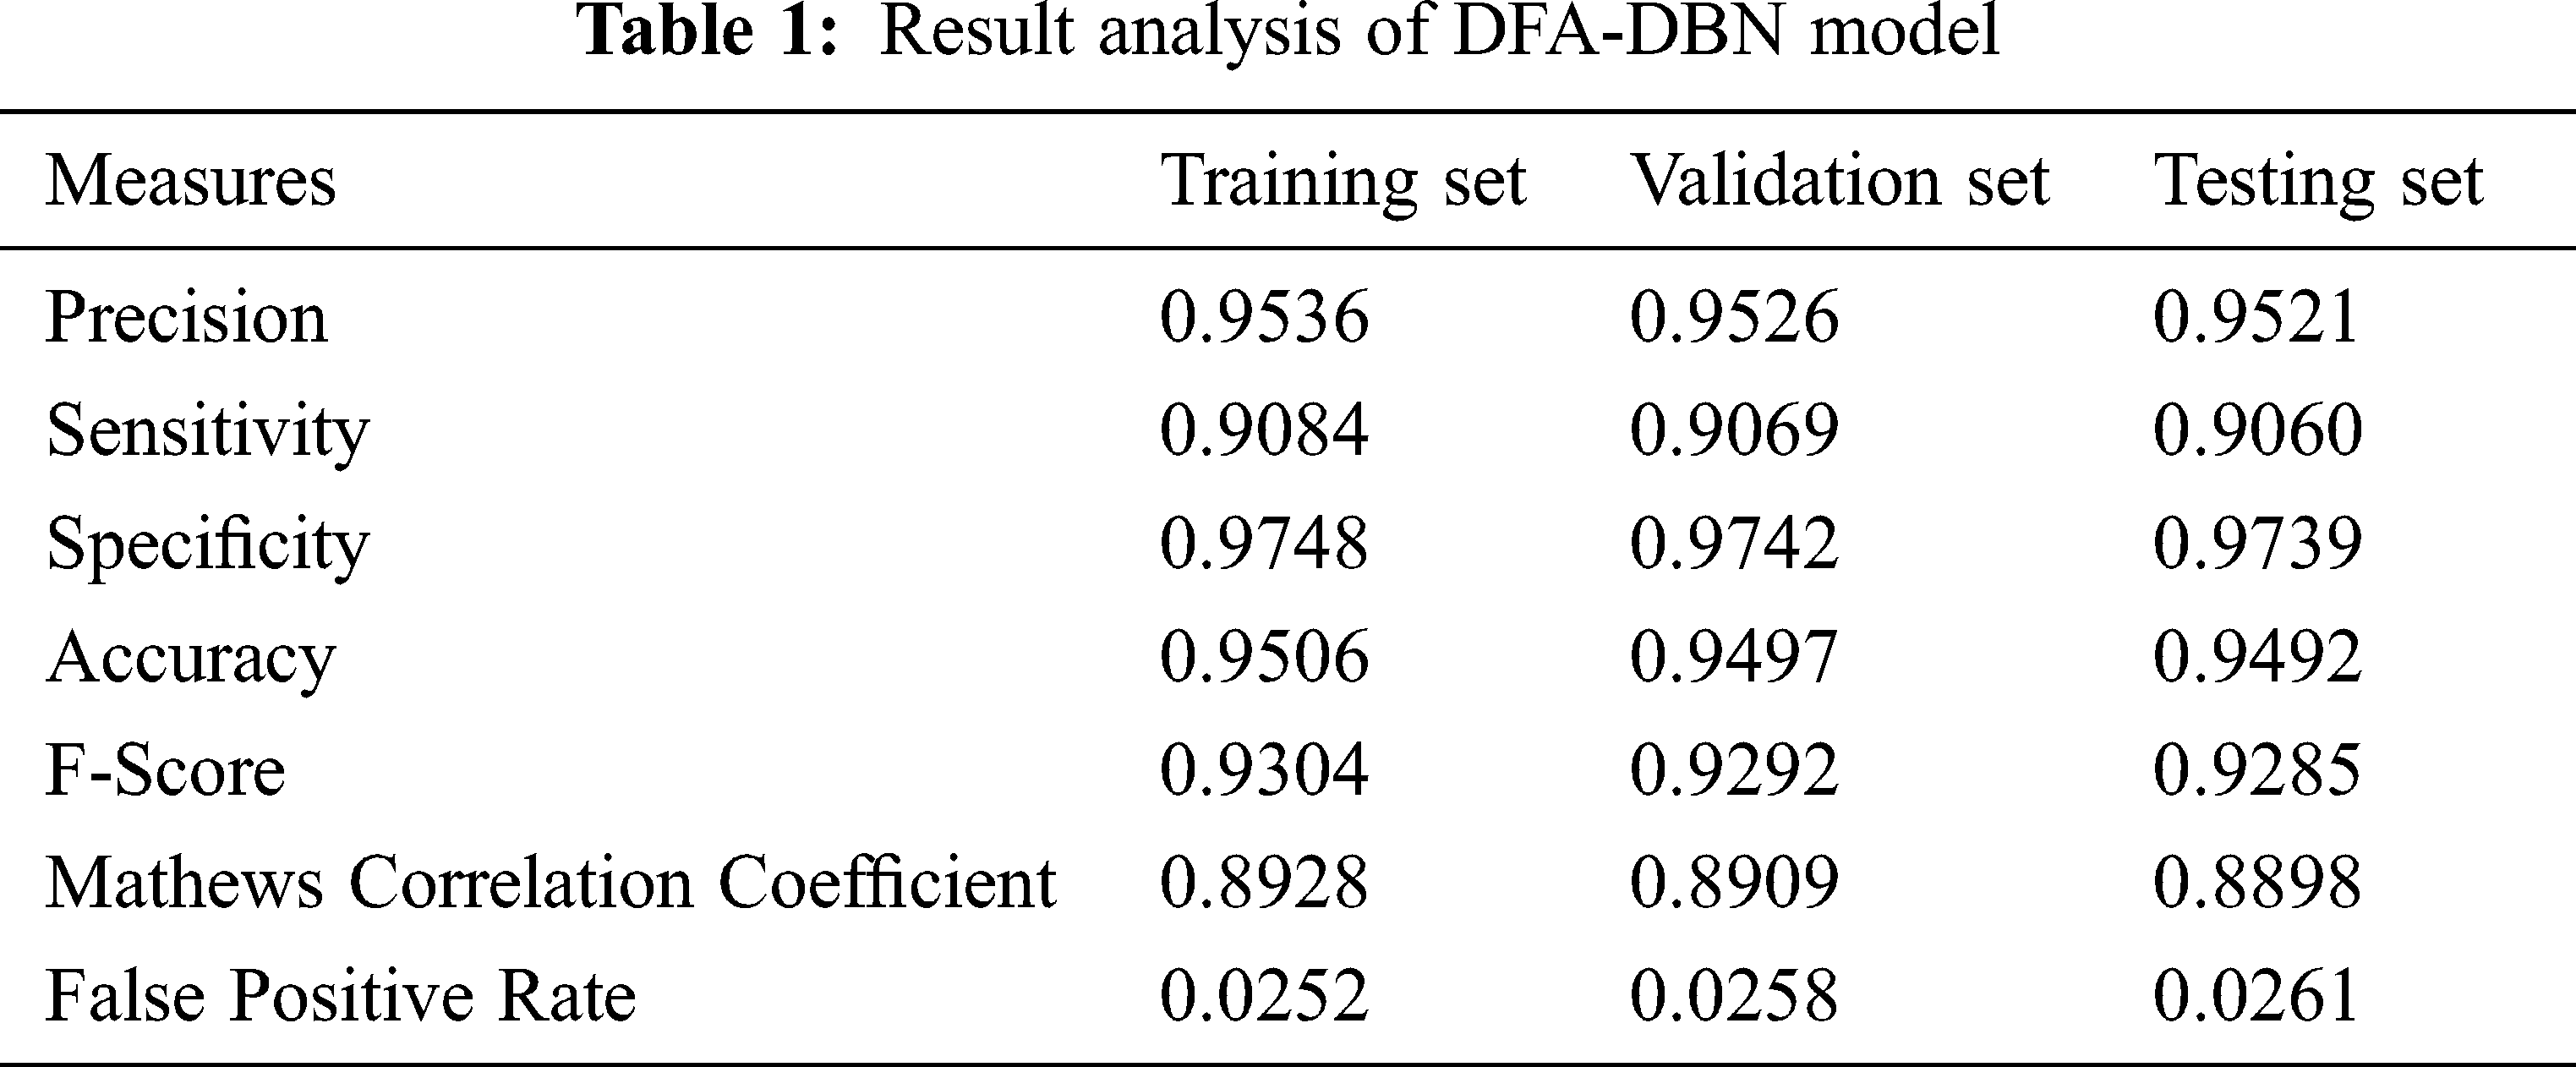
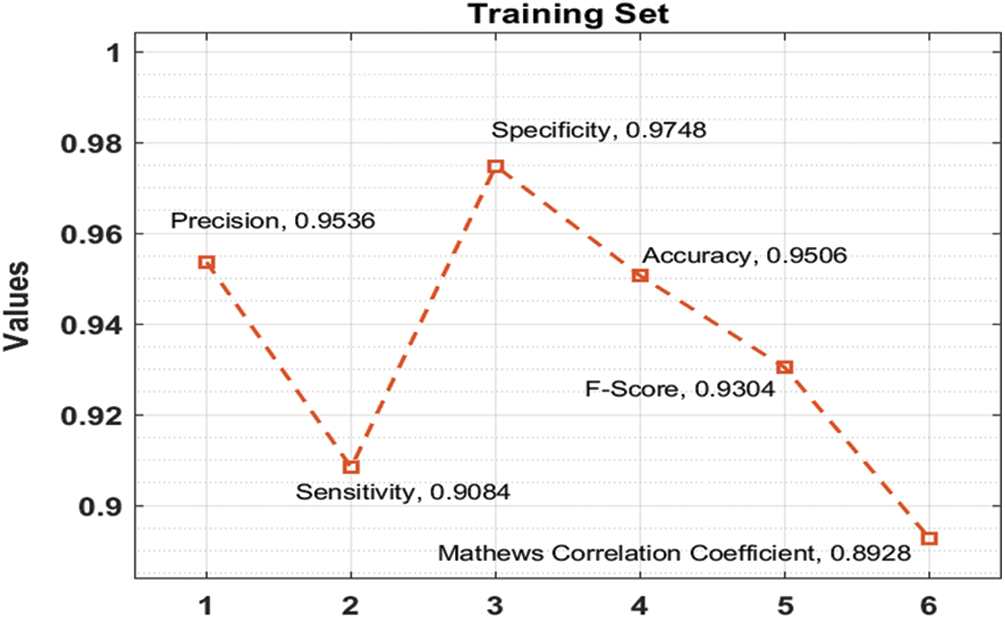
Figure 3: Training set analysis of DFA-DBN model with different measures
Fig. 4 depicts the outcomes analysis of the DFA-DBN methodology on the applied validation dataset. The outcomes portrayed that the DFA-DBN methodology has accomplished efficient results with the precision of 0.9526, sensitivity of 0.9069, specificity of 0.9742, accuracy of 0.9497, F-score of 0.9292, MCC of 0.8909, and FPR of 0.0258.
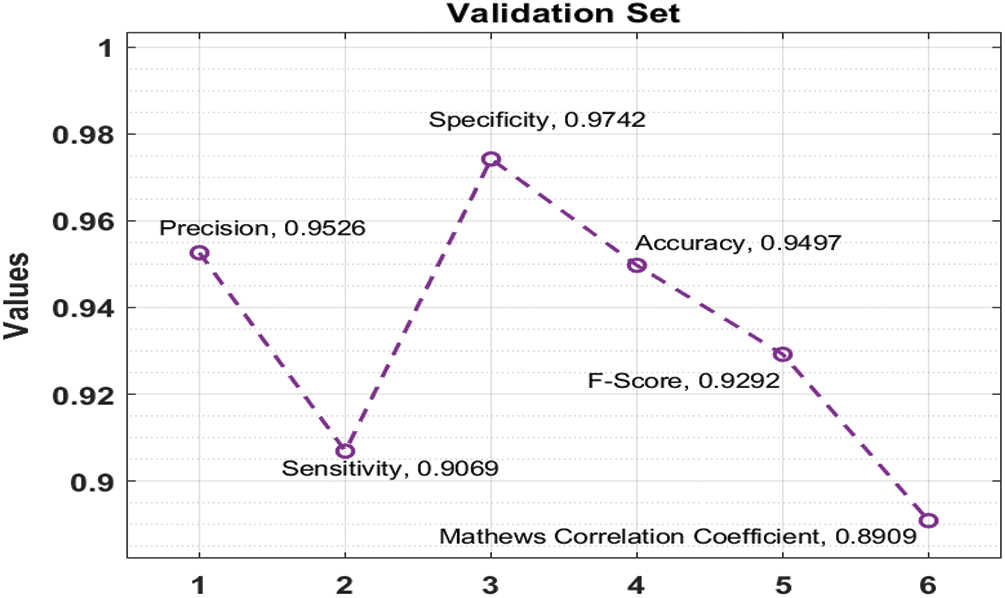
Figure 4: Validation set analysis of DFA-DBN model with different measures
Fig. 5 exhibits the outcomes analysis of the DFA-DBN approach on the applied testing dataset. The outperforms stated that the DFA-DBN algorithm has able effective results with the precision of 0.9521, sensitivity of 0.9060, specificity of 0.9739, accuracy of 0.9492, F-score of 0.9285, MCC of 0.8898, and FPR of 0.0261.
Next, Fig. 6 demonstrates the ROC analysis of the DFA-DBN manner on the applied training, testing, and validation datasets. The figure exhibited that the DFA-DBN technique has accomplished a higher ROC of 99.1091%, 98.1837%, and 98.9783% on the test training, testing, and validation datasets.
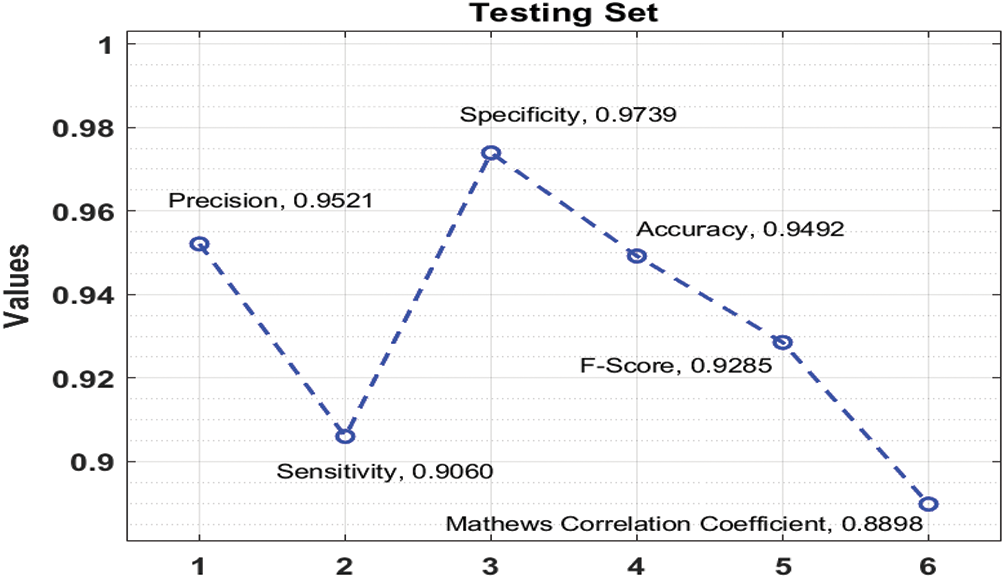
Figure 5: Testing set analysis of DFA-DBN model with different measures
Eventually, a detailed comparative outcomes analysis of the DFA-DBN manner with recent techniques takes place in Tab. 2 [22,23]. The outcomes make sure that the DFA-DBN approach has resulted in maximal performance related to another approach.
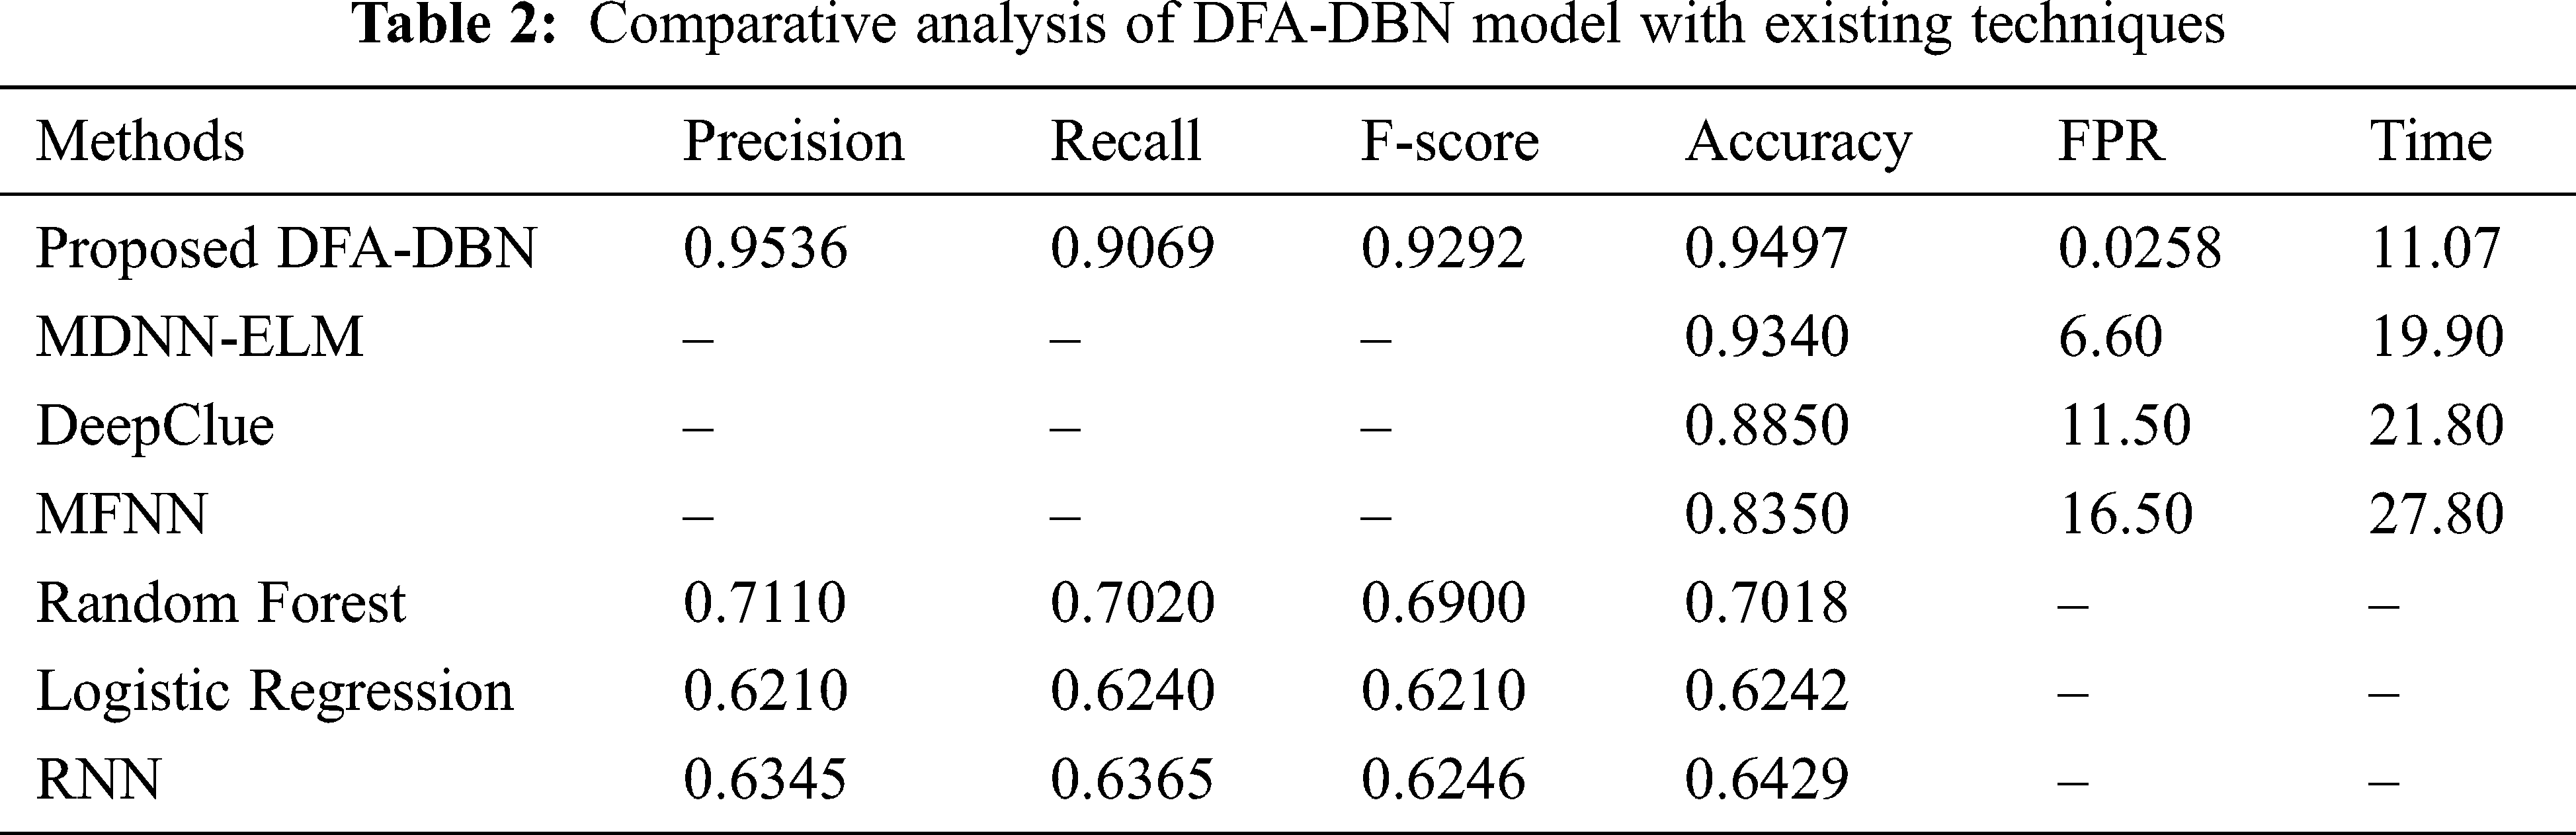
Fig. 6 scrutinizes the accuracy analysis of the DFA-DBN manner with recent approaches. The figure depicted that the RF, LR, and RNN approaches have accomplished to a lesser accuracy of 70.18%, 62.42%, and 64.29% correspondingly. Similarly, the DeepClue and MFNN systems have reached a moderate accuracy of 88.5% and 83.50% correspondingly. Followed by, the MDNN-ELM manner has resulted in a competitive accuracy of 93.40%, the projected DFA-DBN algorithm has exhibited higher with increased accuracy of 94.97%. From the aforementioned tables and figures, it could be stated that the DFA-DBN methodology is established that an appropriate tool to forecast stock prices.
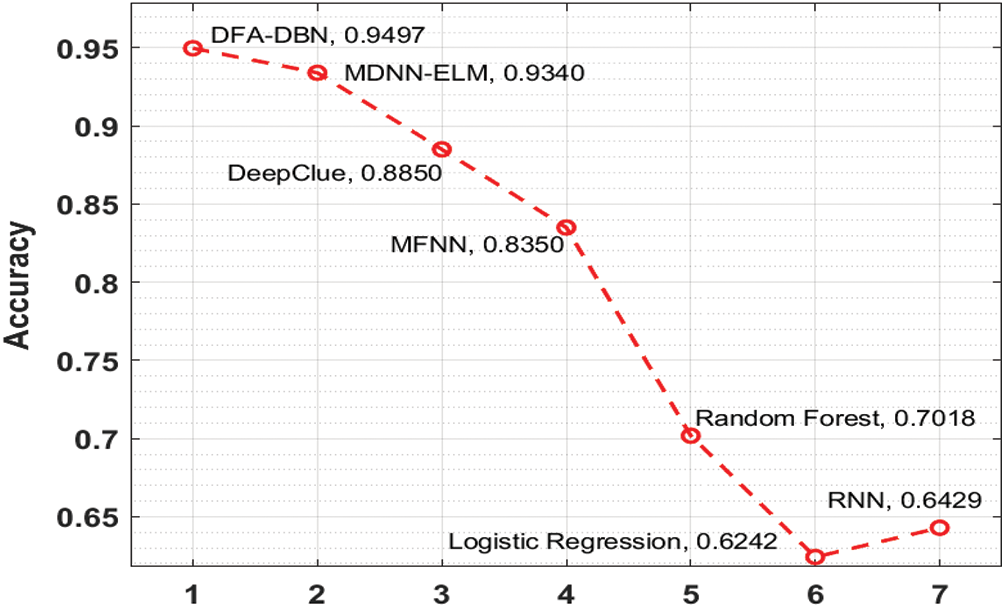
Figure 6: Accuracy analysis of DFA-DBN model with recent methods
This study has presented a DFA-DBN technique to predict future stock prices using Twitter data. The proposed DFA-DBN technique involves preprocessing, DBN based prediction, and DFA based hyperparameter optimization. The application of DFA to properly adjust the hyperparameters involved in the DBN model helps to accomplish maximum prediction results. A comprehensive simulation analysis is carried out on Twitter data and the results are inspected under varying aspects. The resultant comparative analysis demonstrated that the DFA-DBN technique results in improved stock price predictive performance on the other approaches with respect to distinct measures. As a part of future scope, the presented DFA-DBN technique can be deployed in big data environment and validate on large scale real time datasets.
Funding Statement: The authors received no specific funding for this study.
Conflicts of Interest: The authors declare that they have no conflicts of interest to report regarding the present study.
1. T. M. Nisar and M. Yeung, “Twitter as a tool for forecasting stock market movements: A short-window event study,” Journal of Finance and Data Science, vol. 4, no. 2, pp. 101–119, 2018. [Google Scholar]
2. D. Paulraj, “A gradient boosted decision tree-based sentiment classification of twitter data,” International Journal of Wavelets, Multiresolution and Information Processing, World Scientific, vol. 18, no. 4, pp. 1–21, 2020. [Google Scholar]
3. C. Ramalingam, “Addressing semantics standards for cloud portability and interoperability in multi cloud environment,” Symmetry, vol. 13, no. 2, pp. 1–12, 2021. [Google Scholar]
4. J. Deepak Kumar, B. Prasanthi, J. Venkatesh and M. Prakash, “An intelligent cognitive-inspired computing with big data analytics framework for sentiment analysis and classification,” Information Processing & Management, vol. 59, no. 1, pp. 1–15, 2022. [Google Scholar]
5. S. Satpathy, S. Debbarma, S. C. Sengupta Aditya and K. D. Bhattacaryya Bidyut, “Design a FPGA, fuzzy based, insolent method for prediction of multi-diseases in rural area,” Journal of Intelligent & Fuzzy Systems, vol. 37, no. 5, pp. 7039–7046, 2019. [Google Scholar]
6. C. S. Kumar, “An authentication technique for accessing de-duplicated data from private cloud using one time password,” International Journal of Information Security and Privacy, vol. 11, no. 2, pp. 1–10, 2017. [Google Scholar]
7. S. Neelakandan, “An automated learning model of conventional neural network based sentiment analysis on twitter data,” Journal of Computational and Theoretical Nano Science, vol. 17, no. 5, pp. 2230–2236, 2020. [Google Scholar]
8. R. Kamalraj, M. Ranjith Kumar, V. Chandra Shekhar Rao, R. Anand and H. Singh, “Interpretable filter based convolutional neural network (IF-CNN) for glucose prediction and classification using PD-SS algorithm,” Measurement, vol. 183, no. 1, pp. 1–15, 2021. [Google Scholar]
9. C. P. D. Cyril, J. R. Beulah, N. Subramani, P. Mohan, A. Harshavardhan et al., “An automated learning model for sentiment analysis and data classification of Twitter data using balanced CA-SVM,” Concurrent Engineering: Research and Applications, vol. 29, no. 4, pp. 1–18, 2021. [Google Scholar]
10. S. Asadi, E. Hadavandi, F. Mehmanpazir and M. M. Nakhostin, “Hybridization of evolutionary Levenberg-Marquardt neural networks and data pre-processing for stock market prediction,” Knowledge-Based Systems, vol. 35, no. 1, pp. 245–258, 2012. [Google Scholar]
11. T. Zach, “Political events and the stock market: Evidence from Israel,” International Journal of Business, vol. 8, no. 3, pp. 243–266, 2013. [Google Scholar]
12. P. Klibanoff, O. Lamont and T. Wizman, “Investor reaction to salient news in closed-end country funds,” Journal of Finance, vol. 53, no. 2, pp. 673–699, 1998. [Google Scholar]
13. J. Mei and L. Guo, “Political uncertainty, financial crisis, and market volatility,” European Financial and Management, vol. 10, no. 4, pp. 639–657, 2014. [Google Scholar]
14. B. Karthikeyan, T. Sasikala and S. B. Priya, “Key exchange techniques based on secured energy efficiency in mobile cloud computing,” Applied Mathematics & Information Sciences, vol. 13, no. 6, pp. 1039–1045, 2019. [Google Scholar]
15. A. Vinothini and B. P. Sankarlingam, “Survey of machine learning methods for big data applications,” in IEEE Int. Conf. on Computational Intelligence in Data Science (ICCIDS), Chennai, India, pp. 1–5, 2017. [Google Scholar]
16. Z. Jin, Y. Yang and Y. Liu, “Stock closing price prediction based on sentiment analysis and LSTM,” Neural Computing and Applications, vol. 32, no. 13, pp. 9713–9729, 2020. [Google Scholar]
17. X. Guo and J. Li, “A novel twitter sentiment analysis model with baseline correlation for financial market prediction with improved efficiency,” in 2019 Sixth Int. Conf. on Social Networks Analysis, Management and Security (SNAMS), Granada, Spain, pp. 472–477, 2019. [Google Scholar]
18. R. Gupta and M. Chen, “Sentiment analysis for stock price prediction,” in 2020 IEEE Conf. on Multimedia Information Processing and Retrieval (MIPR), Tokyo, Japan, pp. 213–218, 2020. [Google Scholar]
19. S. Mohan, S. Mullapudi, S. Sammeta, P. Vijayvergia and D. C. Anastasiu, “Stock price prediction using news sentiment analysis,” in 2019 IEEE Fifth Int. Conf. on Big Data Computing Service and Applications, Newark, CA, USA, pp. 205–208, 2019. [Google Scholar]
20. F. Ghasemi, A. Mehridehnavi, A. Fassihi and H. Pérez-Sánchez, “Deep neural network in QSAR studies using deep belief network,” Applied Soft Computing, vol. 62, no. 1, pp. 251–258, 2018. [Google Scholar]
21. B. Zolghadr-Asli, O. Bozorg-Haddad and X. Chu, “Dragonfly algorithm,” in Advanced Optimization by Nature-Inspired Algorithms. Singapore: Springer, pp. 151–159, 2020. [Google Scholar]
22. R. Annamalai, S. J. Rayen and J. Arunajsmine, “Social media networks owing to disruptions for effective learning,” Procedia Computer Science, vol. 172, pp. 145–151, 2020. [Google Scholar]
23. M. Lim and C. K. Yeo, “Harvesting social media sentiments for stock index prediction,” in 2020 IEEE 17th Annual Consumer Communications & Networking Conf., Las Vegas, NV, USA, pp. 1–4, 2020. [Google Scholar]
 | This work is licensed under a Creative Commons Attribution 4.0 International License, which permits unrestricted use, distribution, and reproduction in any medium, provided the original work is properly cited. |