DOI:10.32604/iasc.2022.023587
| Intelligent Automation & Soft Computing DOI:10.32604/iasc.2022.023587 | |
| Article |
Segmentation of Cervical Cancer by OLHT Based DT-CWT Techniques
1Department of Computer Science and Engineering, St. Xavier’s Catholic College of Engineering, Nagercoil, 629003, Tamilnadu, India
2Department of Computer Science and Engineering, St. Xavier’s Catholic College of Engineering, Chunkankadai, Nagercoil, 629003, Tamilnadu, India
*Corresponding Author: P. R. Sheebha Rani. Email: sheebaranipapers@gmail.com
Received: 13 August 2021; Accepted: 14 October 2021
Abstract: Every year, cervical cancer (CC) is the leading cause of death in women around the world. If detected early enough, this cancer can be treated, and patients will receive adequate care. This study introduces a novel ultrasound-based method for detecting CC. The Oriented Local Histogram Technique (OLHT) is used to improve the image corners in the cervical image (CI), and the Dual-Tree Complex Wavelet Transform (DT-CWT) is used to build a multi-resolution image (CI). Wavelet, and Local Binary Pattern are among the elements retrieved from this improved multi-resolution CI (LBP). The retrieved appearance is trained and tested using a feed-forward propagation neural network, and the ANFIS classifier is utilized to classify them. The purpose of this classifier is to distinguish between normal and pathological cervical pictures. Sensitivity is 97.52 percent, specificity is 99.46 percent, accuracy is 98.39 percent, precision is 97.48 percent, PPV is 97.38 percent, NPV is 92.27 percent, LRP is 141.81 percent, 0.0946 percent LRN, FPR is 96.82 percent, and NPR is 91.46 percent for the CC detection categorization. The proposed methodology outperforms standard CC identification and classification methodologies.
Keywords: Cervical cancer; classification; ultrasound images; morphological; histogram technique
Cervical cancer is the most common malignancy in women today, with the world’s second-highest fatality rate [1]. Every year, over 2.0 billion new cases of cervical cancer are recorded around the world, with 50% of these cases resulting in death [2]. In India, it is the most common cancer. There are around 285 million women in India above the age of 16. Cervical cancer is a disease that can affect anyone. India is accountable for around a third of all cervical cancer deaths worldwide. Cervical cancer is a lethal disease that primarily affects women in impoverished countries worldwide [3]. Cervical cancer, like many other cancers, develops early in a woman’s life and can endure for more than ten years. Between the ages of 16 and 30, the chance increases, peaking between the ages of 55 and 65. Up to the age of 50, promiscuous women are more likely to contract the HPV virus, which causes cervical cancer [4]. Although an HPV vaccine is available, its efficiency cannot be guaranteed, and the duration of protection cannot be predicted. Image processing techniques are currently being used in a computer-aided automatic diagnosis strategy to detect and identify cervical cancer [5]. Internally, CC affects women and can be identified by scanning the vaginal inner region. The most common cause of CC in women is the Human Papillomavirus (HPV) (NCCC, 2010). This virus affects the inner tissues of the cervix, causing cancer cells to develop in the cervix and spreading across the entire region (Robbins et al., 2009). Cervical cancer affects women who are unable to examine themselves; therefore it is not recognized at an early stage. As a result, the fatality rate among women with cervical cancer is significant. Cancer, often known as a tumor, is the uncontrolled growth of cells in an organ that spreads to nearby tissues. Because certain tumors do not penetrate neighboring tissues, they do not pose a threat to a person’s life [6]. These tumors are non-cancerous. Tumors that have spread throughout the body are known as malignant tumors. In most cases, cervical cancer develops in the transition zone. Squamous epithelium is the most common cause of cancer [7]. Pre-cancerous proliferation, a carcinogenic effect, causes cells in the peripheral region to alter and eventually transform into cancer. Fig. 1 shows the scenario of HPV infection spread.

Figure 1: Scenario of HPV infection spread [8]
The damaged cells in the cervical picture are divided into benign and malignant cells. The benign cells are pre-cancerous, and they haven’t spread to the interior part of the cervix. Malignant cells are cancerous cells that have spread across the inner cervix [8]. Cervical cancer is caused by infection with the human papillomavirus (HPV), the use of birth control pills, or smoking. A long-term HPV infection is the most common cause of cervical cancer [9]. HPV syndrome is a dangerous infection that may not always result in cancer. HPVs that cause cancer in even a small percentage of people are referred to as potentially harmful HPVs. HPVs with a high risk of infection still exists [10]. Furthermore, it causes cervical cells to undergo precancerous alterations. Low-risk HPVs can generate warts that aren’t harmful, but they don’t turn into cancer. A Pap smear test or cervigram is used to detect cancer cells in the cervix. The nucleus regions of the cervix region are checked and diagnosed in the Pap smear test [11]. Cervigram is a method for detecting cancer cells in the cervix region using cervical pictures. Even in its advanced phases, CC can be detected, resulting in a quick death [12,13]. In many cases, cancer-affected women do not experience any irritations or pain in the cervix region, and no symptoms result. The life of a cancer-affected woman can be saved if the cancer is diagnosed early on. As a result, this research suggests a unique way for early detection of CC to save women’s lives [14].
Traditional methods rely on experts and are a time-consuming procedure. Furthermore, due to a scarcity of skilled experts or radiologists in this field, it is not ideal for developing nations with vast populations (Susan et al., 2018). As a result, a fully automated revolutionary cervical cancer screening technology is required. The cervix is the major portion of the cervigram and is found in the central part of the uterus (Song et al. 2015; Sulaimana et al., 2011). Fig. 2 depicts the cervigrams of the normal and atypical cases. This research provides a classification strategy for detecting cervical cancer utilizing an automatic cervical cancer detection methodology.
Figure 2: Graphical representations for the survey on patients with cervical cancer [14]
In a global study, the authors discussed various CC detection and segmentation strategies from the low-income group (Miri et al., 2018). Using Pap smear images, the researchers reviewed cervical cancer diagnosis and screening approaches (Sachan et al., 2018). Different textural features for the detection and segmentation of aberrant spots in cervical regions were discussed by the authors. On cervical images, the authors proposed a CC detection method based on Support Vector Machine (SVM) (Kashyap et al., 2016). The authors employed an independent level set approach to detect and segment the aberrant area on cervical images.
The authors talked about the neural network classification technique that was employed in CI to locate and categorize the cancer region (Devi et al. 2016). To increase cancer segmentation accuracy, the authors combined their suggested method with a technique called region growing segmentation. The authors devised a method for detecting abnormal spots in a patient’s cervix (Kumar and Srivastava 2014). The authors employed biopsy pictures to scan the cervical areas in Computer-Aided Detection (CAD). Soft computing approaches are used to improve the accuracy of the cervical cancer detection system categorization. The authors were able to attain 86 percent sensitivity and 91 percent segmentation accuracy using CAD. Cervical cancer is detected using the Pap smear cell screening procedure (Chen et al., 2014). For cervical classifications, the CI’s energy and textural qualities, as well as the Support Vector Machine (SVM) classifier, were used. For Pap smear classifications, the authors achieved 96.12% of the classification average rate. The biggest drawback of this method is that it is only applicable for high-resolution photos.
• The conventional methods are fit only for high-resolution CI.
• Only the outer region of the cancerous areas is detected.
• For more CC diagnoses, the sensitivity and accuracy rate was not optimal [15,16].
The limitations are overcome by proposing a conventional methodology for CC detection and an ANFIS classifier was used in the classification procedure, which used a feed-forward back propagation neural network. Even when the quality and staining of the cervical cell images are poor, this classification scheme is confirmed to identify the abnormalities of the cervical Pap smear cells. This scheme could also improve classification by combining boundary, texture, intensity, and region-oriented information. This scheme was found to have the disadvantage of inconsistent cell staining and was ineffective in extracting potential information from cervical cells.
The National Cancer Institute (NCI) created Guanacaste as an open-access dataset in 1997. The National Center for Community Colleges and Universities (NCCC) published a report in 2010 Cervical cancer programs in Guanacaste are updated every year [17].
This dataset covers a wide range of cervical pictures, including normal, abnormal lesions that later developed cancer during follow-up, and healthy people who have never had abnormal lesions in the cervix area (CA), according to an experienced radiologist [18–20]. 80 CI are acquired from the Guanacaste open-access dataset in this paper. The 80 cervical pictures are divided into benign (55 images) and cancerous (35 images) patients (25 images) [21–23].
The proposed methodology for detecting, segmenting, and categorizing cervical cancer is shown in Fig. 3. The efficient representation of image structural elements such as edges, patterns, and textures is one of the trickier impacts of image preprocessing [24,25]. As a result, a practical approach based on hyperspatial structure prediction has been created. This structure is used to find the best structural component prediction [26]. In the previously encoded image area, there is compression architecture. By changing the center pixel positions, the Local Histogram Equalization method (LHE) can be converted to oriented LHE. Other than the center, the remaining eight operators are directional and oriented and are referred to as oriented local histogram equalization (OLHE) operators. In LBP the intensities of eight surrounding pixels in a 3 × 3 window are compared to the centre pixel. If a pixel has a higher intensity value than the centre pixel, it will be assigned a pixel value of ‘1,’ otherwise ‘0.’ The binary bit information from all of these results is then concatenated. After that, the concatenated data is converted to decimal data.
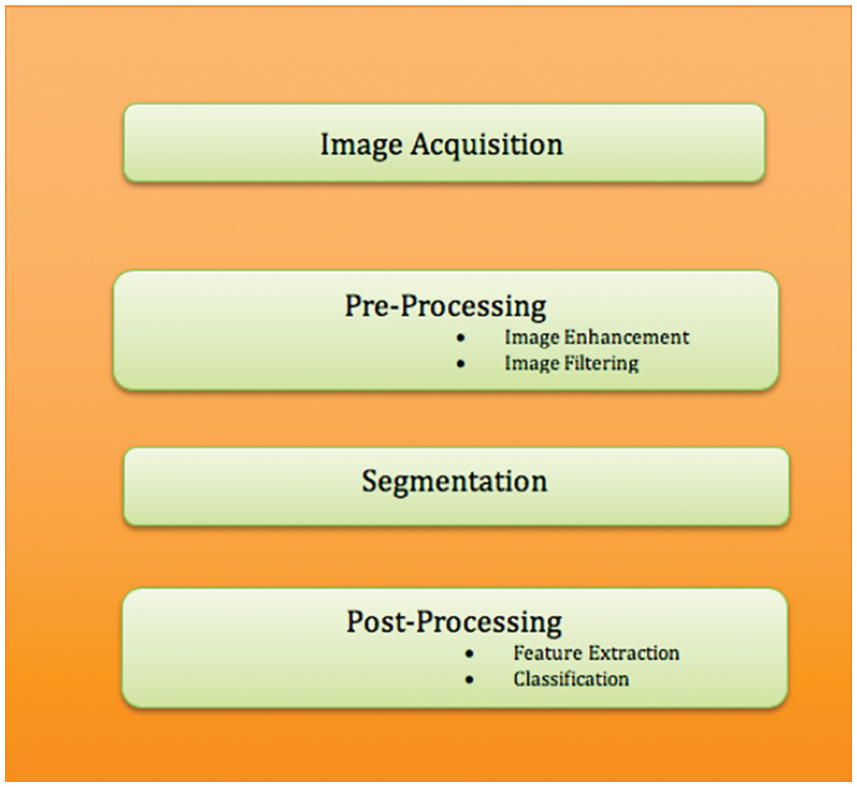
Figure 3: Block diagram for cervical cancer segmentation
Instead of concatenating the images, all of the OLHE results are stored in eight separate images. We can get eight binary images by binarizing those eight OLHE images by thresholding using the centre pixel intensity in that 3 × 3 window and its block diagram is shown in Fig. 4.
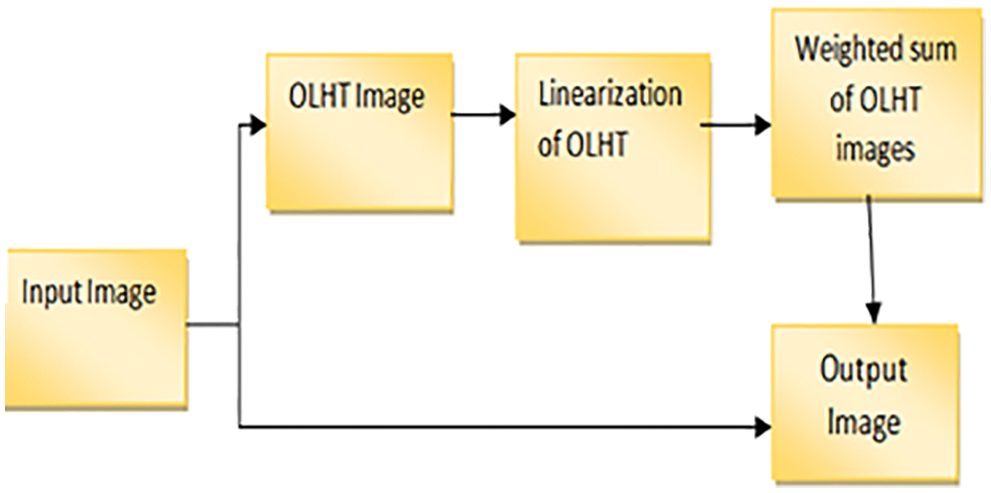
Figure 4: Block diagram for OLHT technique
DTCWT is introduced as a selective invariant and directed variable transformation. Wavelets are good for one-dimensional images; however, the upper scale has some limits in terms of direction and anisotropy [27]. Curvelet conformations necessitate rotation and relate to polar coordinate-based separation of two-dimensional frequency planes [28]. This simplifies the concept of a curve in the continuum but complicates the success of distinct images. In discrete curve shapes, the critical sampling strategy appears to be particularly problematic. A critical sampling of contours is simple to accomplish. NS. Contourlets vary from Curvelets in that the transformation of Contourlets is defined publicly on independent digital rectangular grids [29–31]. Contours will be better suitable for speckle reduction in medical ultrasound pictures since they overcome the constraints of wavelets and curves. When statistical dependencies between wavelet coefficients are taken into account, the noise reduction efficiency can be increased even more. Denoising performance is improved when the covariance structure is defined using the empirical Bayesian technique on a 2D scale complex wavelet transformation. In image reduction, spatial domain-based and transformation-based techniques have had a lot of success. Combining the two domains improves volume reduction performance as well. The recognized spatial domain SVD method can be combined with transformation domain methods like SVD on the discrete cosine transform image to be transformed. For a small number of big coefficients, the standard energy compressing wavelet denaturation method is useful. This type of wavelet method has proven to be an effective image degradation tool. However, the displacement invariance and directional selectivity have an impact on DWT’s reconstruction of noisy pictures. The signal information is not fixed in the subbands when a double shaft of real filter banks is used in parallel to produce a complex wavelet coefficient that is displacement invariant and has an angular resolution.
3.2.1 Dual Tree Continuous Wavelet Transform
A sparse, multiresolution image representation is the complex double-tree wavelet transform. In terms of DWT, it has displacement invariance and directional selectivity, as well as a redundancy factor of 2d for dimension d. This method preserves the original image while using a lot of time and containing modest amounts of high-frequency material. The goal of all noise reduction approaches is to achieve a noise-free image by mathematically minimizing the difference between the original and restored image. As a result, the 2D DTCWT is implemented separately, with two trees for the image’s rows and two trees for the columns. Simple sum and difference operations are used to combine the wavelet coefficients, yielding real and imaginary wavelet coefficients.
The complex wavelet
They are implemented by separable filters along columns and then rows:
The complexity coefficients are calculated by the DTCWT utilizing two independent actual DWTs. The real part of the wavelet coefficient is given by the first real DWT, while the imaginary part of the wavelet coefficient is given by the second real DWT. Real and immutable components are individually immutable in DTCWT. As a result, the subband’s normal VisuShrink is modified to adaptive VisuShrink. To calculate the threshold value, this technique considers both signal variance and noise. DTCWT Excellent directional shift and selection the constant properties played a significant role in signal and process processing for a variety of applications, including compartments. The Denoising threshold is significant because strong data maintains the high value of the threshold and the lowest value of the threshold. A component wavelet transition coefficient is generated from an input noisy image. The real and virtual components are not modified independently, but the size of the complex coefficient does not change. The decomposition scales are implemented using a solid central value estimator to estimate the variable noise variance. DTCWT takes the real and imaginary parts of complex coefficients generated by a double tree of wavelet filters. By applying SVD to the scale of the image’s low sub-bandwidth, the goal is to conserve the signal’s energy and obtain an effective threshold value. The block diagram of DTCWT is shown in Fig. 5.
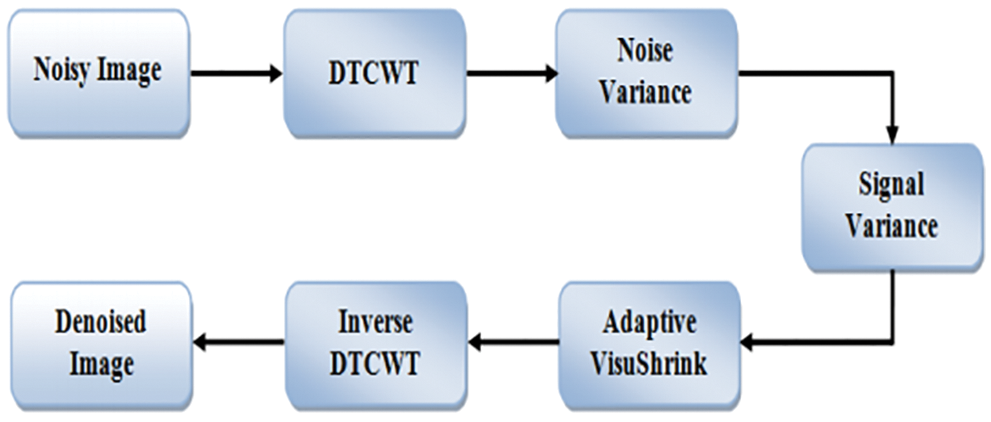
Figure 5: Block diagram for dual-tree complex wavelet transform
The developed denoising method is summarized in three steps as follows
Step 1: Transforming complex double-tree wavelets.
• To solve the problem of the limit value, the noise image is first symmetrically increased.
• To the decomposition level, apply the split-double-tree composite wavelet transformation.
• As a matrix of cells, save the obtained complex wavelet coefficients.
Step 2: Calculate the criterion.
• Using a sophisticated median estimator, calculate the noise variance.
• To find the real and imaginary coefficients of the wavelet, process each sub-band separately in a loop.
• Calculate the signal’s variance using the surrounding coefficients and a 7-point window.
• Determine the best threshold value.
• Subtract this threshold value from the signal’s variance to arrive at a new threshold value.
Step 3: Reconstruction.
• In a loop, process each sub-band separately and threshold each wavelet coefficient.
• Calculate the inverse wavelet transform.
• Take the image and extract it.
Wavelet features, GLCM features, and moment invariant features are used to extract features from the preprocessed image. The collected characteristics are then categorized (cancerous or non-cancerous cervical picture) using the ANFIS classifier, which determines whether or not the cervical cells are affected. To evaluate if the cervical picture was benign or malignant, the ANFIS classifier was utilized. Finally, the average sensitivity, specificity, accuracy, TPR, and FPR are performance measuring criteria for the CI classification performance.
Machine learning and data analytics approaches are widely employed in prediction nowadays, especially in medical diagnosis. Medical diagnosis is one of the most challenging aspects of medical practice. A powerful neural network-based solution for handling component difficulties is the adaptive network-based fuzzy inference system (ANFIS). By using a supervised learning approach to find the mapping set of possible data, and ANFIS determines the appropriate allocation of attribute values. Both artificial neural networks (ANN) and fuzzy logic are used in the ANFIS model (FL). Taking advantage of such a charitable opportunity the modeling in ANFIS is more thorough and less reliant on domain expertise. In total, there are five levels in this inference system. Multiple nodes make up each ANFIS layer. Squares represent parameter sets that are changeable in these nodes, while circles represent parameter sets that are fixed in the system. Several research organizations are working on the development of neural networks in the medical diagnosis of CC all around the world [32–34]. Using an ANFIS classifier, the CI classification accuracy is improved in this research. ANFIS’ architecture is depicted in Fig. 6. The ANFIS Classifier is used to determine whether the source CI is malignant or not. In this study, the ANFIS classifier is used to categorize CI. This categorization has two stages: learning and classification. The properties of malignant and non-cancerous CI are merged in the learning phase of the ANFIS classification to form the learned patterns. The ANFIS classifier with training patterns is used to classify the extracted features from the source test CI. A low or high binary value is generated by the classifier. A non-cancerous CI is represented by a low binary value, while a cancerous CI is represented by a high binary value.
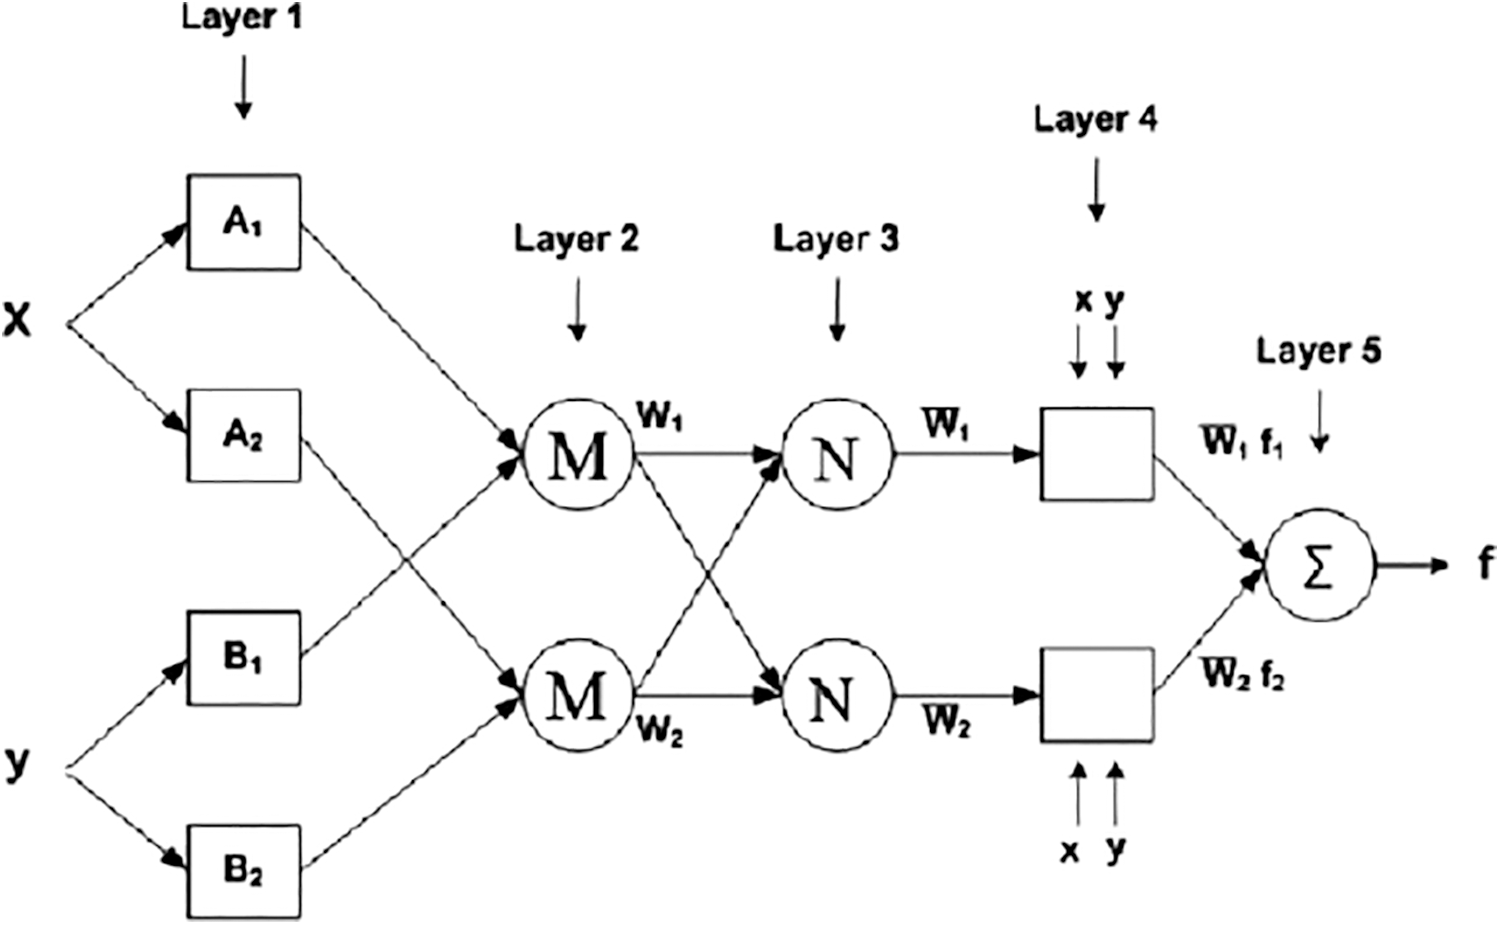
Figure 6: Architecture of ANFIS
The Herlev dataset, developed by Herlev University Hospital and available at http://fuzzy.iau.dtu.dk/download/smear2005 is commonly utilised as the measurement standard in the task of cervical cancer cell categorization.
The Herlev dataset contains 917 cervical cells from seven different categories, including 242 normal cells in three types and 675 aberrant cells in the remaining four. We used a learning momentum, learning rate, and batch size of 0.9 to train Model A for 200 epochs. 0.0001 and 1 are the values, respectively. Models B, C, and D, on the other hand, were trained for 250, 400, and 400 epochs, respectively. In a 8:2 ratio, the dataset was divided into the training and testing sets.
To supplement the training set, we employ random flipping on the internet. The True Positive (TP), True Negative (TN), False Positive (FP), and False Negative (FN) values are generated using truth images provided by an expert radiologist, and the performance of the proposed CC detection system is tested using a confusion matrix of size 22. The following are the performance parameters, essential definitions, and performance metrics.
Accuracy: The classification validity is proportional to the number of photos that were properly categorized (True Negative and True Positive).
Sensitivity: It is a metric for the proportion of properly categorized positive samples. Its value ranges from 0 to 1.
Specificity: This is a metric for the proportion of negative cases that are properly classified.
Positive Predictive Value: It sums the number of positive pixels that go to properly sensed cancer region pixels.
Negative Predictive Value: It counts the number of negative pixels that goes to incorrectly detected cancer region pixels.
LRP (Likelihood Ratio Positive) and LRN (Likelihood Ratio Negative) (LRN) are two types of likelihood ratios is the performance evaluation parameters of this CC detection system it is based on its sensitivity and specificity.
Precision: It measures the tumor segmentation accuracy and it is measured in %. It is based on the evaluation parameters TP and FP.
False Positive Rate (FPR): FPR represents the number of cancer pixels accurately detected in the categorized CI, based on FP and TN
False Negative Rate (FNR): FNR represents the number of properly-recognized non-cancer pixels in the classified CI and is based on FN and TP.
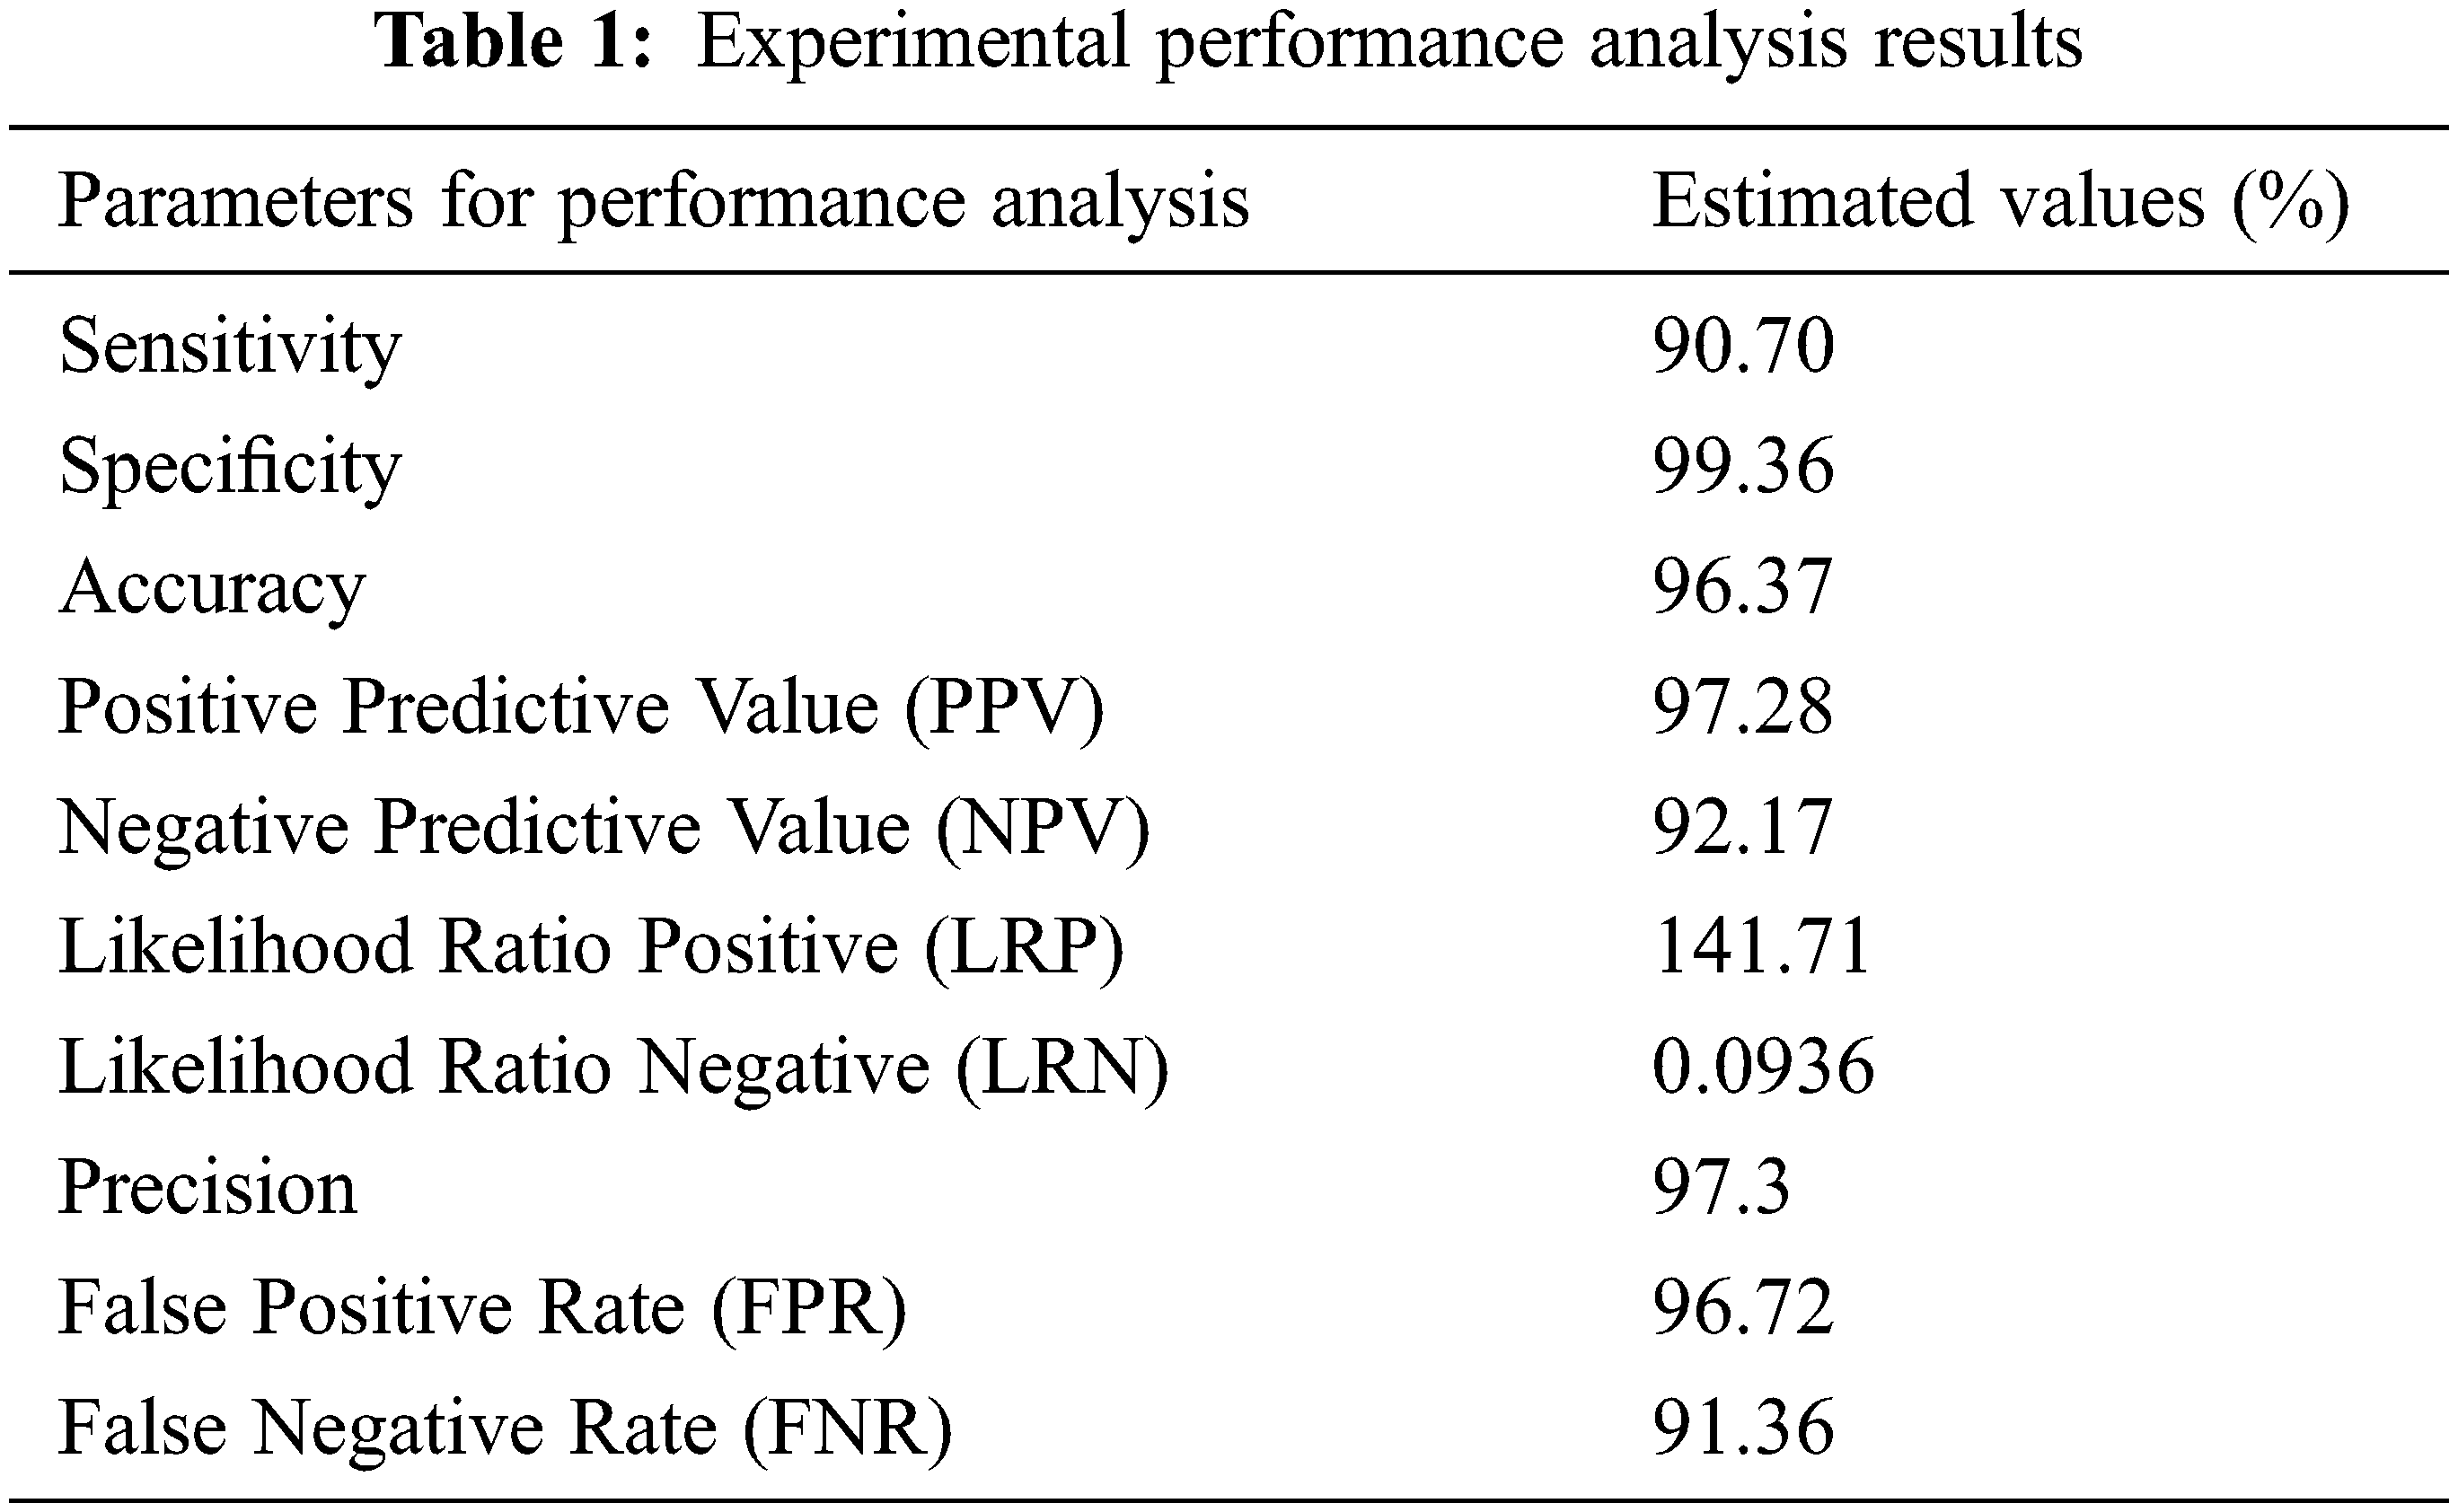
These performance metrics (sensitivity, specificity, and accuracy) are all reported as percentages. The results of the experimental performance investigation are shown in Tab. 1. Sensitivity, specificity, and accuracy are performance evaluation indicators that are used to compare the offered technique to others (Chen et al., 2014; Bergmeir et al., 2012). The results of the investigation suggest that the proposed technique has a decent accuracy rate of around 97 percent. Precision
Nuclear polymorphism refers to the tendency of abnormal cervix nuclei to fluctuate in form and size. It meets the huge nuclei, tiny nuclei, coarse nuclei, and dark nuclei in a malignant instance, as illustrated in Fig. 7.
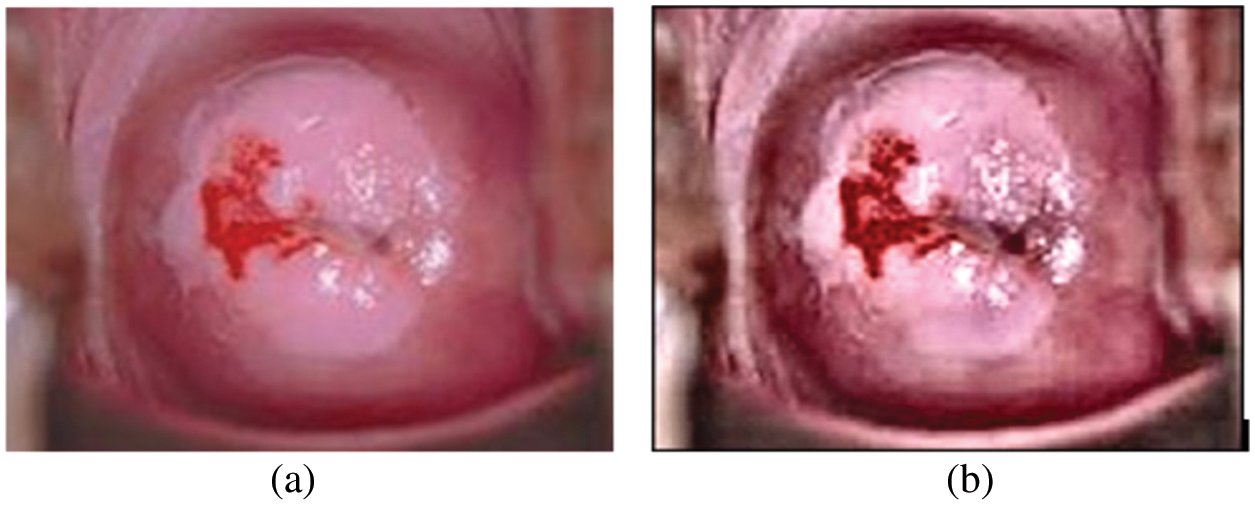
Figure 7: (a) Cervical image (b) edge enhanced cervical image
For testing, high-resolution sample photos are used. Histogram equalization is done initially on the photos. This is accomplished using the advanced approach of oriented local histogram equalization. Fig. 8 depicts the equalization graph. Denoising is then applied to the equalized image. The image is denoised using dual tree-DWT. Fig. 9 shows a histogram of wavelet coefficients. The features are extracted to classify the data. The segmented results are shown in Fig. 10.
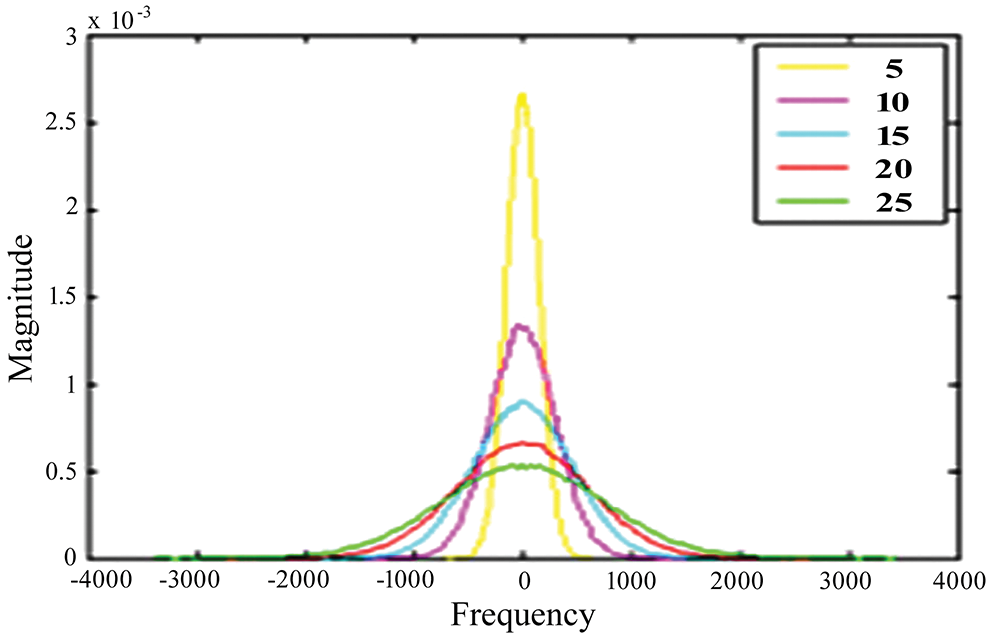
Figure 8: OLHE graph
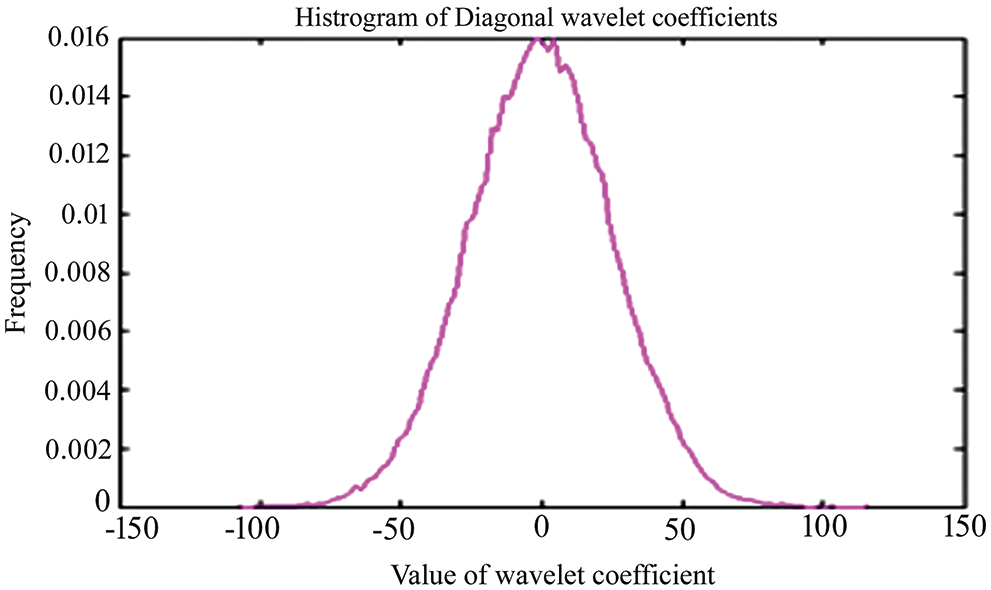
Figure 9: Histogram for dual-tree Dwt coefficients
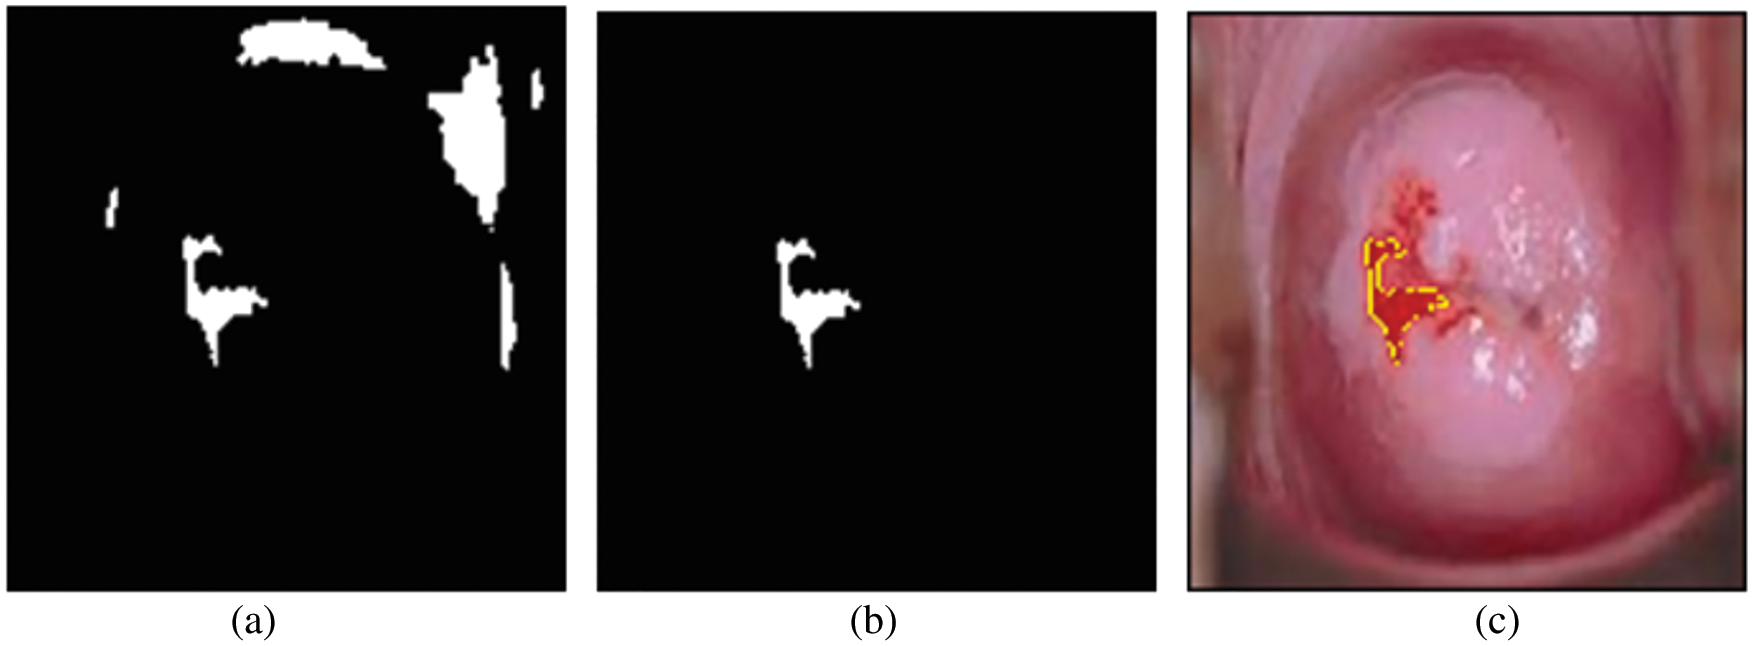
Figure 10: (a) Binary image; (b) region of interest image; (c) cancer segmentation image
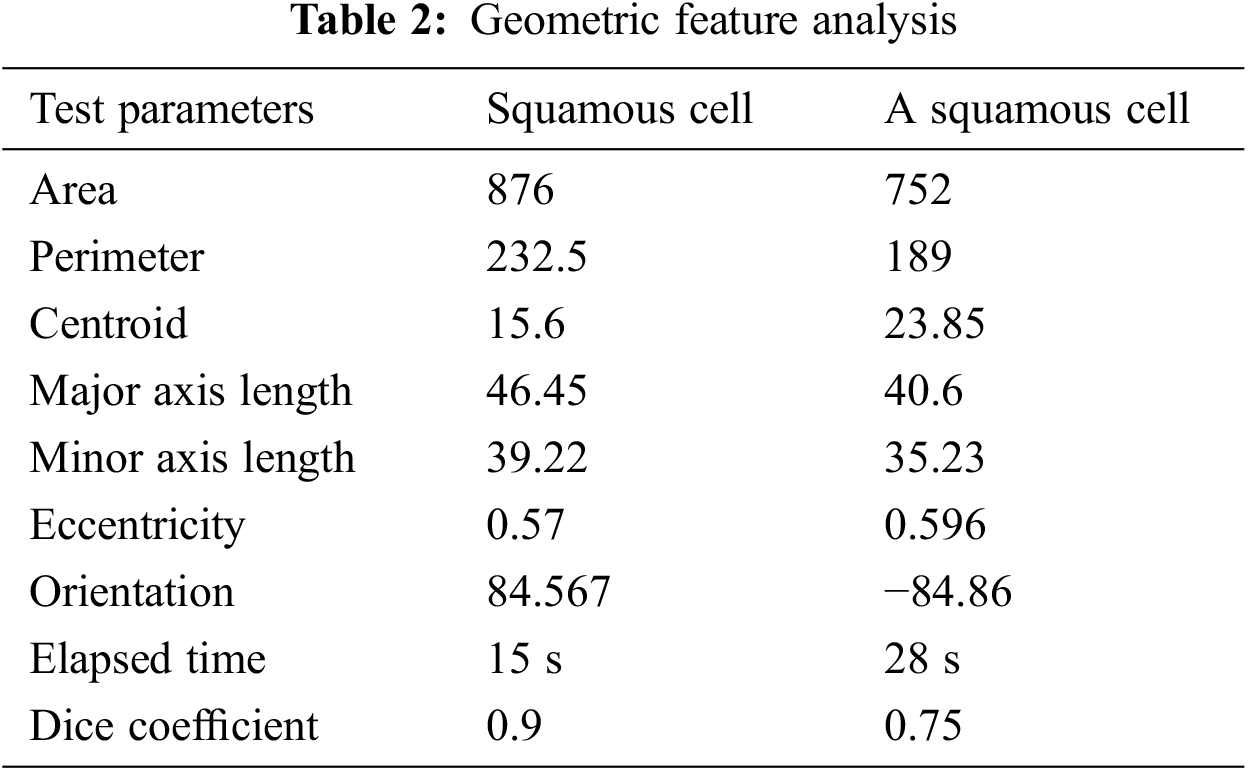
The geometric feature analysis of two types of segmented cells is shown in Tab. 2. Eccentricity is defined as the shortest distance between two vertices within the nucleus in this context. The two procedures, as we can see, estimate the area and perimeter of various geometrical features like Centroid, Major, and Minor Axis Length. These traits are utilized to determine if a cell is cancerous or not. They can also be used to assess the severity of cervical cancer. Increasing the detected ratio, form factor, and diameter, as well as the area of abnormalities, can be done by examining the morphological aspects of images. Basic image processing techniques and matching algorithms were used to determine the dimensions of the indicated region. For normal, pre-cancer, and malignant situations, the area, diameter and perimeter were determined, and the predicted detected region was calculated.
The proposed segmentation procedure is compared with other existing techniques. From Fig. 11, it concluded that ANFIS shows good accuracy results for various abnormal classes. Different stages of abnormal levels say mild, moderate, severe, etc., were tested with the proposed segmented criteria.
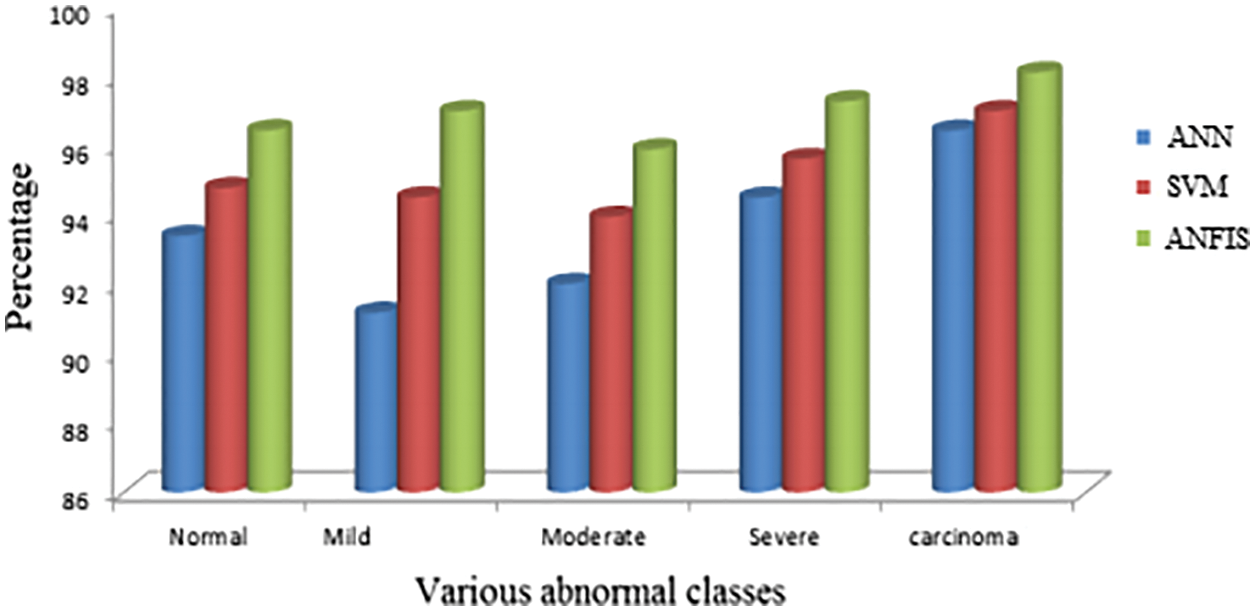
Figure 11: Comparison with various existing techniques
To improve the quality of cervical images, we used an oriented local histogram equalization-based approach in this study. The ANFIS classifier is used to differentiate between normal and pathological CI. The simulation results suggest that the proposed cervical cancer system is capable of distinguishing between normal and abnormal CI areas. The CC detection system has a sensitivity of 97.52 percent, a specificity of 99.46 percent, an accuracy of 98.39 percent, a Positive Predictive Value of 97.38 percent, a Negative Predictive Value of 92.27 percent, a Likelihood Ratio Positive of 141.81, a Likelihood Ratio Negative of 0.0946, a precision of 97.48 percent, an FPR of 96.This work can be investigated further in the future using machine learning approaches to detect cancer regions in cervical images and classify them into different severity levels, such as “early stage” or “advanced stage,” in order to diagnose and prevent mortality.
Acknowledgement: The authors with a deep sense of gratitude would thank the supervisor for his guidance and constant support rendered during this research.
Funding Statement: The authors received no specific funding for this study.
Conflicts of Interest: The authors declare that they have no conflicts of interest to report regarding the present study.
1. C. Bergmeir, M. G. Silvente and J. M. Benítez, “Segmentation of cervical cell nuclei in high-resolution microscopic images: A new algorithm and a web-based software framework,” Computer Methods and Programs in Biomedicine, vol. 107, no. 3, pp. 497–512, 2012. [Google Scholar]
2. S. Bhattacharjee, J. Mukherjee, S. Nag, I. K. Maitra and S. K. Bandyopadhyay, “Review on histopathological slide analysis using digital microscopy,” International Journal of Advanced Science and Technology, vol. 62, pp. 65–96, 2014. [Google Scholar]
3. Y. F. Chen, P. C. Huang, K. C. Lin, H. H. Lin, L. E. Wang et al., “Semi-automatic segmentation and classification of pap smear cells,” IEEE Journal of Biomedical and Health Informatics, vol. 18, no. 1, pp. 94–108, 2013. [Google Scholar]
4. C. Demir and B. Yener, “Automated cancer diagnosis based on histopathological images: A systematic survey,” Rensselaer Polytechnic Institute, vol. 5, pp. 1–16, 2005. [Google Scholar]
5. M. A. Devi, S. Ravi, J. Vaishnavi and S. Punitha, “Classification of cervical cancer using artificial neural networks,” Procedia Computer Science, vol. 89, no. 4, pp. 465–472, 2016. [Google Scholar]
6. D. Song, E. Kim, X. Huang, J. Patruno, H. M. Avila et al., “Multimodal entity conference for cervical dysplasia diagnosis,” IEEE Transactions on Medical Imaging, vol. 34, no. 1, pp. 229–245, 2014. [Google Scholar]
7. B. K. Jaya and S. S. Kumar, “Image registration based cervical cancer detection and segmentation using ANFIS classifier,” Asian Pacific Journal of Cancer Prevention, vol. 19, no. 11, pp. 3203–3209, 2018. [Google Scholar]
8. P. W. Huang and Y. H. Lai, “Effective segmentation and classification for HCC biopsy images,” Pattern Recognition, vol. 43, no. 4, pp. 1550–1563, 2010. [Google Scholar]
9. Q. Ji, J. Engel and E. Craine, “Texture analysis for classification of cervix lesions,” IEEE Transactions on Medical Imaging, vol. 19, no. 11, pp. 1144–1149, 2000. [Google Scholar]
10. I. T. Katz, N. C. Ware, G. Gray, J. E. Haberer, C. A. Mellins et al., “Scaling up human papillomavirus vaccination: A conceptual framework of vaccine adherence,” Sexual Health, vol. 7, no. 3, pp. 279–286, 2010. [Google Scholar]
11. R. Kumar and R. Srivastava, “Some observations on the performance of segmentation algorithms for microscopic biopsy images,” in Proc. Institute of Electrical and Electronics Engineer (IEEE), Kannur, India, pp. 16–22, 2014. [Google Scholar]
12. C. Kwok, K. White and J. K. Roydhouse, “Chinese-Australian women’s knowledge, facilitators and barriers related to cervical cancer screening: A qualitative study,” Journal of Immigrant and Minority Health, vol. 13, no. 6, pp. 1076–1083, 2011. [Google Scholar]
13. G. Landini, D. A. Randell, T. P. Breckon and J. W. Han, “Morphologic characterization of cell neighborhoods in neoplastic and preneoplastic epithelium,” Analytical and Quantitative Cytology and Histology, vol. 32, no. 1, pp. 30–38, 2010. [Google Scholar]
14. K. M. C. Caffery, J. Waller, J. Nazroo and J. Wardle, “Social and psychological impact of hpv testing in cervical screening: A qualitative study,” Sexually Transmitted Infections, vol. 82, no. 2, pp. 169–174, 2006. [Google Scholar]
15. M. Kumar and A. Rana, “Image enhancement using contrast limited adaptive histogram equalization and wiener filter,” International Journal of Engineering and Computer Science, vol. 5, no. 6, pp. 16977–16979, 2016. [Google Scholar]
16. M. R. Miri, M. Moodi, G. R. S. Zadeh, H. M. Moghadam, M. Miri et al., “Cognitive predictors of cervical cancer screening’s stages of change among sample of iranian women health volunteers: A path analysis,” PLoS One, vol. 13, no. 3, pp. e0193638, 2018. [Google Scholar]
17. A. Mouelhi, M. Sayadi, F. Fnaiech, K. Mrad and K. B. Romdhane, “Automatic image segmentation of nuclear stained breast tissue sections using color active contour model and an improved watershed method,” Biomedical Signal Processing and Control, vol. 8, no. 5, pp. 421–436, 2013. [Google Scholar]
18. D. R. Ramji, C. A. Palagan, A. Nithya, A. Appathurai and E. J. Alex, “Soft computing-based color image demosaicing for medical image processing,” Multimedia Tools and Applications, vol. 79, no. 15, pp. 10047–10063, 2020. [Google Scholar]
19. P. R. Praba and H. Ranganathan, “Comparing different classifiers for automatic lesion detection in cervix based on colour histogram,” Journal of Computer Applications, vol. 6, no. 1, pp. 123–129, 2013. [Google Scholar]
20. S. C. Robbins, C. Pang and J. Leask, “Australian newspaper coverage of human papillomavirus vaccination, October 2006–December 2009,” Journal of Health Communication, vol. 17, no. 2, pp. 149–159, 2012. [Google Scholar]
21. P. L. Sachan, M. Singh, M. L. Patel and R. Sachan, “A study on cervical cancer screening using pap smear test and clinical correlation,” Asia-Pacific Journal of Oncology Nursing, vol. 5, no. 3, pp. 337, 2018. [Google Scholar]
22. T. Xu, H. Zhang, C, Xin, E. Kim, L. R. Long, Xue et al., “Multi-feature based benchmark for cervical dysplasia classification evaluation,” Pattern Recognition, vol. 63, pp. 468–475, 2017. [Google Scholar]
23. S. N. Sulaiman, N. A. M. Isa and N. H. Othman, “Semi-automated pseudo colour features extraction technique for cervical cancer’s pap smear images,” International Journal of Knowledge-Based and Intelligent Engineering Systems, vol. 15, no. 3, pp. 131–143, 2011. [Google Scholar]
24. R. Sundarasekar and A. Appathurai, “Efficient brain tumor detection and classification using magnetic resonance imaging,” Biomedical Physics & Engineering Express, vol. 7, no. 5, pp. 55007, 2021. [Google Scholar]
25. J. C. Susan and H. K. Alex, “Screening for cervical cancer US preventive services task force recommendation statement,” Journal of the American Medical Association, vol. 320, no. 7, pp. 674–686, 2018. [Google Scholar]
26. K. Suzuki, “Overview of deep learning in medical imaging,” Radiological Physics and Technology, vol. 10, no. 3, pp. 257–273, 2017. [Google Scholar]
27. B. Taha, J. Dias and N. Werghi, “Classification of cervical-cancer using pap-smear images: A convolutional neural network approach,” in Proc. Conf. on Medical Image Understanding and Analysis, Cham, India, Springer, pp. 261–272, 2017. [Google Scholar]
28. R. Takiar, D. Nadayil and A. Nandakumar, “Projections of number of cancer cases in india (2010–2020) by cancer groups,” Asian Pacific Journal of Cancer Prevention, vol. 11, no. 4, pp. 1045–1049, 2010. [Google Scholar]
29. T. Xu, H. Zhang, X. Huang, S. Zhang and D. N. Metaxas, “Multimodal deep learning for cervical dysplasia diagnosis,” in Proc. MICCAI, Cham, Springer, pp. 115–123, 2016. [Google Scholar]
30. L. Zhang, L. Lu, I. Nogues, R. M. Summers, S. Liu et al., “Deep pap: Deep convolutional networks for cervical cell classification,” IEEE Journal of Biomedical and Health Informatics, vol. 21, no. 6, pp. 1633–1643, 2017. [Google Scholar]
31. A. Nithya, A. Appathurai, N. Venkatadri, D. R. Ramji and C. A. Palagan, “Kidney disease detection and segmentation using artificial neural network and multi-kernel k-means clustering for ultrasound images,” Measurement, vol. 149, no. 2, pp. 106952, 2020. [Google Scholar]
32. M. Sharma, “Cervical cancer prognosis using genetic algorithm and adaptive boosting approach,” Health and Technology, vol. 9, no. 5, pp. 877–886, 2019. [Google Scholar]
33. D. Parikh and V. Menon, “Machine learning applied to cervical cancer data,” International Journal of Mathematics and Computer Science, vol. 5, no. 1, pp. 53–64, 2019. [Google Scholar]
34. L. Akter, M. M. Islam, M. S. A. Rakhami and M. R. Haque, “Prediction of cervical cancer from behavior risk using machine learning techniques,” Springer Nature Computer Science, vol. 2, no. 3, pp. 1–10, 2021. [Google Scholar]
 | This work is licensed under a Creative Commons Attribution 4.0 International License, which permits unrestricted use, distribution, and reproduction in any medium, provided the original work is properly cited. |