DOI:10.32604/iasc.2022.023924
| Intelligent Automation & Soft Computing DOI:10.32604/iasc.2022.023924 | |
| Article |
Arrhythmia Detection and Classification by Using Modified Recurrent Neural Network
Department of CSE, Noorul Islam Centre for Higher Education, Kumaracoil, 629180, India
*Corresponding Author: Ajina Mohamed Ameer. Email: ajinama345@gmail.com
Received: 27 August 2021; Accepted: 08 December 2021
Abstract: This paper presents a novel approach for arrhythmia detection and classification using modified recurrent neural network. In medicine and analytics, arrhythmia detections is a hot topic, specifically when it comes to cardiac identification. In the research methodology, there are 4 main steps. Acquisition and pre-processing of data, electrocardiogram (ECG) feature extraction utilizing QRS (Quick Response Systems) peak, and ECG signal classification using a Modified Recurrent Neural Network (Modified RNN) for arrhythmia diagnosis. The Massachusetts Institute of Technology-Beth Israel Hospital. (MIT-BIH) Arrhythmia database was used, as well as the image accuracy. Medium filter is used in the pre-processing. Feature extraction is done with morphological and dynamic features to detect morphological arrhythmia the shape morphological properties of the ECG signal. Dynamic arrhythmia could be diagnosed by having some feature of the ECG signal such as amplitude and position of the QRS peak. Using the modified pan Tompkins algorithm, arrhythmia was detected. Load the ECG signal after getting QRS complex R and p peak of ECG signal detected. For the deep learning classification modified RNN is used as a classifier. The modified RNN is trained independently for each of the 17 classes using training and validation data, Data from the validation phase is utilized to calculate network parameters tweaking. The acquired results demonstrate the proposed method’s effectiveness. The overall classification accuracy for 17 cardiac arrhythmias was 95.33%. For each 10 s ECG data, the classification time was 0.015 s. The proposed technique is compared in terms of accuracy to that of other existing techniques, revealing that the new method outperforms them.
Keywords: Arrhythmia detection; ECG signal; deep learning; modified recurrent neural network; pan Tompkins
The most basic and extensively used way of identifying cardiac events is electrocardiography (ECG) (or irregular heartbeat irregularities) since it is a non-invasive and painless examination [1] that can reveal important information about cardiovascular health [2] and disease [3]. Arrhythmia of the heart is a common symptom of high blood pressure. The latter is a major societal issue [4–6] because of 1) its rising prevalence, 2) related high death rate (17.3 million people die from heart disease each year, taking account for 37 present of all deaths worldwide), and 3) the high costs of medical care (the disease’s typical persistent training entail lengthy and often costly treatments) [7].
Traditional algorithms for automatic ECG diagnosis of heart arrhythmia employ the study of morphological characteristics of a QRS complexes or pulses. So we look into a approach of detecting heart disease based on duration, uninterrupted ECG readings, which we feel is successful than existing methods. Our objective to lower the computation time of our created algorithms [8] is a key design factor, as it will make it easier to deploy our suspension in mobile systems [9,10] and cloud technology to watch clients’ status in real moment.
The goal of ECG arrhythmia pattern recognition [11] is accomplished using traditional ECG signal processing techniques as well as cutting-edge deep learning technologies. The expanding number of publications in ECG-related issues reflects its potential and appeal for research [12]. Although the ECG signal is straightforward to obtain, it provides a wealth of information that may be mined for computational analysis. It achieved a test accuracy of roughly 92% [13]. Using a modified Pan-Tompkins method and wavelet transform, we developed a robust QRS complex detection algorithm. A two-stage feature extraction approach to extract features from ECG signals for distinct types of arrhythmias has been developed as an efficient and effective strategy to identify heart disorders [14–16]. We used a unique deep learning model for ECG beat categorization that had a sensitivity of 98.24% and positive productivity of 99.93% [17]. On the overall dataset, the proposed Dynamic Neural Network (DNN) obtains a decent Value that is less than 0.2 present lower than the best, namely Part, and less than 0.06 present lower on the testing set. Specificity (SP) 93.30%, Accuracy (Ac) 98.37%, Recall 48.29%. Precision 43.91%, F Measure 45.31%, and Accuracy (Ac) 98.37% [18]. With an efficiency of 96.77, the artificial neural network (ANN) was employed to classify the MIT Arrhythmia dataset of ECG into regular and pathological [19–21].
The Modified RNN can be used to classify a variety of time-series data, and it has a wide range of applications. Aspects of our research that are novel, A method based on the long-duration ECG signals containing several heart evolutions has been developed.
❖ A new deep learning algorithm based on an optimum Modified RNN structure [22].
❖ It Recognizes 17 kinds of cardiac arrhythmia.
The structure of the journal is given by the following sections: arrhythmia detected using pan Tompkins algorithm [23]. This also presents the Feature extraction using Morphological and dynamic features and Modified RNN classified with 17 classes. Section 4 provides success metrics, and Section 5 clarifies the understanding of the outcomes.
Load ECG signal from the database. Then the loaded image is pre-processed using the median filter. In the next step the arrhythmia is detected using QRS peak detection. A combination of the Q wave, R wave and S wave, the “QRS complex” represents ventricular depolarization. The modified Pan Tompkins algorithm detect the arrhythmia. For the extraction and evaluation of features the morphological and dynamic features are used. Modified RNN have 17 classes. 3600 samples of long-duration raw ECG data were fed into this network structure. Predictions of the classes to which the signals belong were presented at the output of the classifier network. The ECG database, which has 1000 pieces, was used to assess the network’s overall performance. Results were obtained in experimental experiments utilizing 13-, 15-, and 17-classes on various situations and the proposed architecture is shown in Fig. 1.
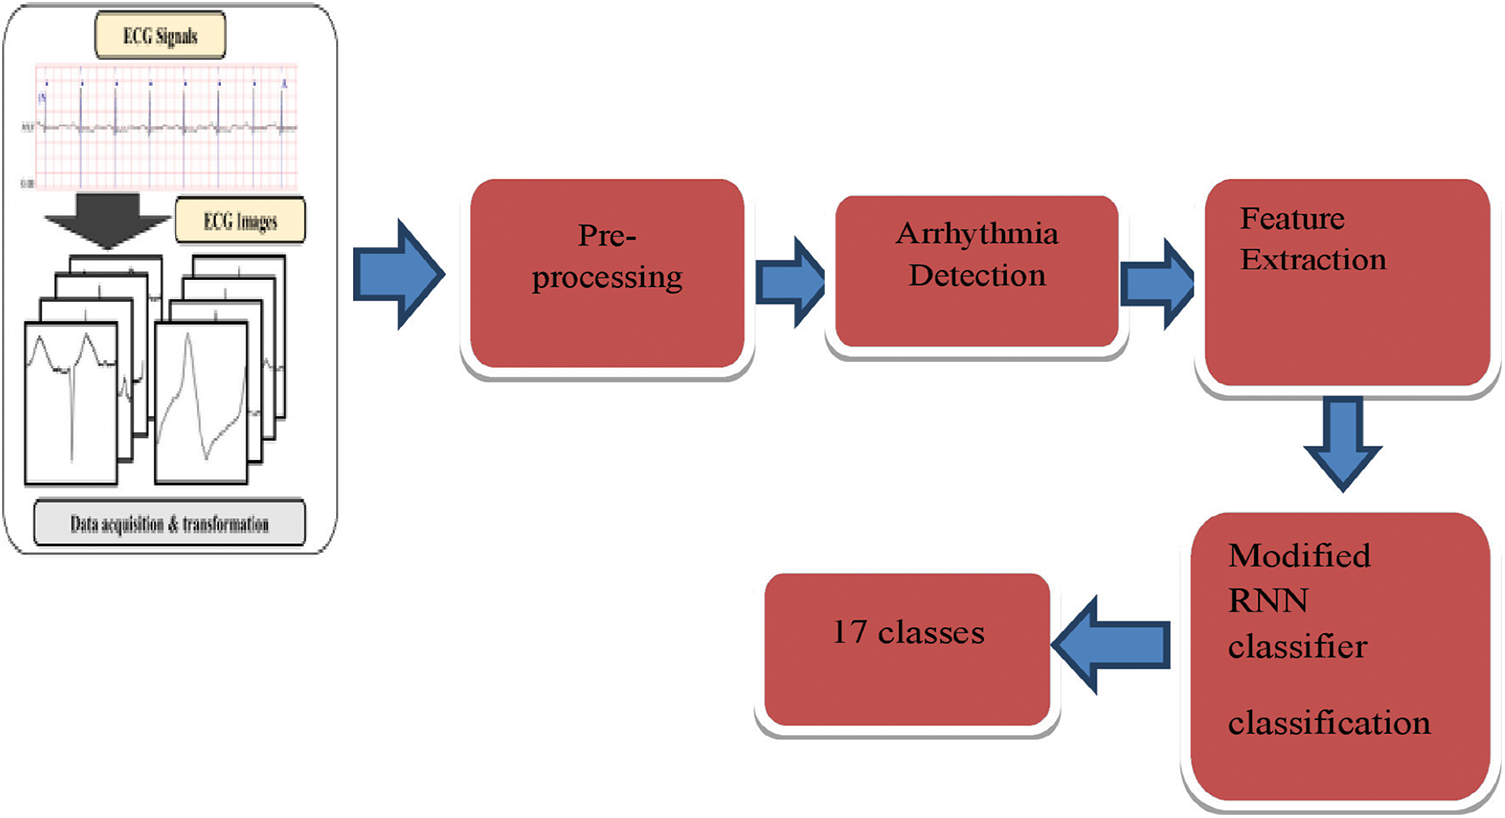
Figure 1: Proposed architecture
The Massachusetts Institute of Technology-Beth Israel Hospital (MIT-BIH) Irregular heartbeat dataset provided the ECG data for this study (MIT-BIH ECG database, 2017). The MIT-BIH Irregular Heartbeat Resource is a web-based database with 4000 ECG heart-rate recordings. In the training phase, a total of 215 waveforms for training and 203 wavelengths for testing are created at the end of the data acquisition phase and are ready for the next stage, data pre-processing.
Two median filters are used to filter the ECG signal initially. The first median filter has a width of 200 ms and filters out the QRS complexes and P waves. P stands for “primary” because they are always the first to arrive. The T wave on an electrocardiogram (ECG) represents typically ventricular repolarization. To remove the T waves, the signal is subsequently passed through a second median filter with a width of 600 ms. A FIR filter removes power line and other high frequency aberrations from the baseline corrected signal.
3.3 Modified Pan Tompkins Algorithm
Pan-Tompkins has been modified to help with arrhythmia diagnosis. R and P waves, the R-R interval, and QRS breadth were all recorded after the QRS complex had been identified. R-R intervals can be used to calculate heart rate, as well as time domain analysis. The improved arrhythmia detection system was given a graphical user interface (GUI), which provides a user-friendly platform for viewing the ECG signal and its associated features, as well as various problems in clients.
The ECG data contained threshold drift, electrode contact noise, electromagnetic interference, device noise, and other sorts of noise. The signal is first processed through a band pass with a pass band range of 5 to 15 Hz to mitigate for interference. The energy, breadth, and magnitude of the QRS complex must be eliminated from the ECG signal to achieve dependable service, which can be approximated using integration and the mechanism is shown in Fig. 2. Estimates could be used to identify various arrhythmias.
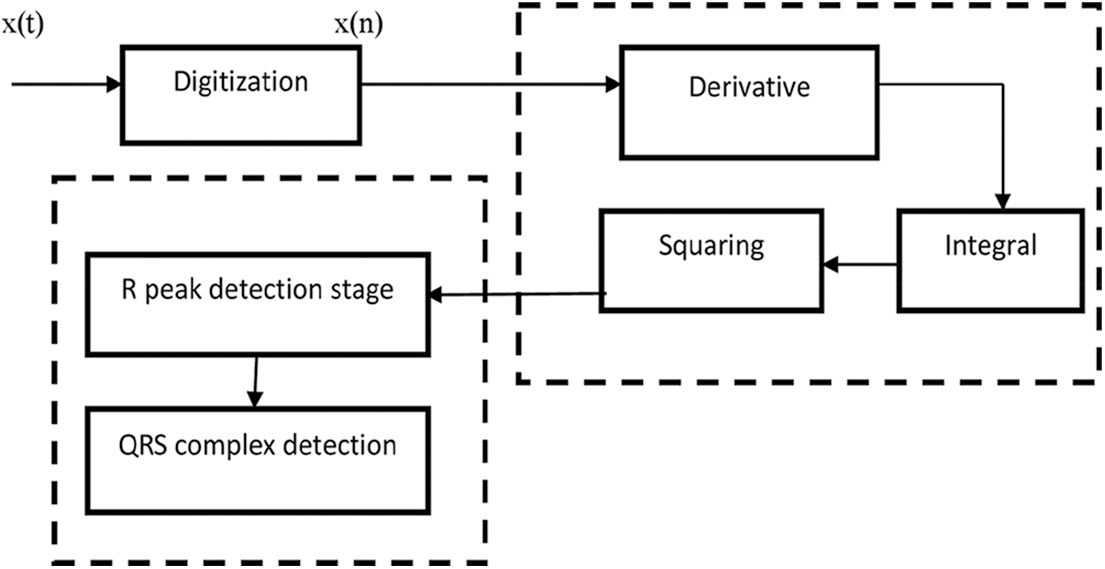
Figure 2: Mechanism of data processing
In inclusion to the QRS complex, P and T waves, and 60-Hz loud sounds from wired intervention, EMG from strength, movement artefact from the terminal and skin functionality, and potentially other intrusion from electro surgery devices in the operating theatre, the ECG waveform contains 60-Hz noise from wired interference.
A cardio tachometer and an irregularity monitor, for example, both require reliable real-time QRS identification. The QRS complex must be separated from other sound sources such as P and T waves in order to retrieve the desired signal, this QRS detection is shown in Fig. 3.
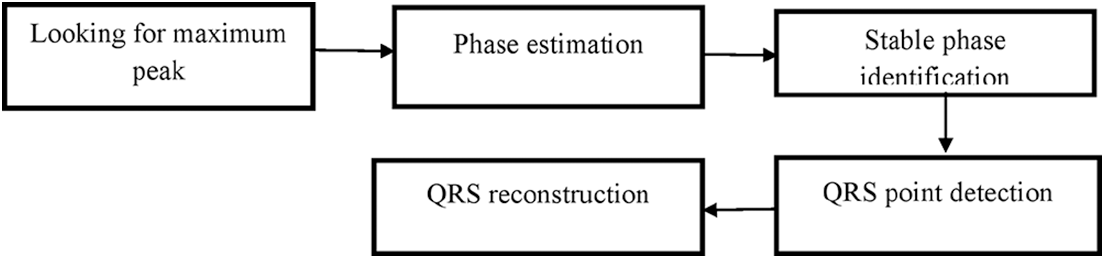
Figure 3: QRS detection
ECG signal is extracted during the feature extraction phase. The goal of extracting features and assessing them is to establish which features are morphological and which are dynamic. Morphological Features refers to determining the ECG signal’s volume, form, and organization, as well as calibration points such as peak points, segments, and period lengths. RR interval characteristics, pulse rate, Heart Rate Variability (HRV), and the R/P ratio are examples of dynamic features. Peaks, Waves, Valleys, Portions, Periods, Complex, and Points are all part of an ECG signal.
I) The initial stage in classifying an ECG signal as regular or atypical is to detect these properties and record the results in variables, followed by classification of the various anomalies.
II) Because R is the largest and clearest constituent in a Gain Power and Control ECG Signal, R peaks identified threshold that was used to estimate amplitude and frequency, temporal positions, and lengths.
3.5 Modified Recurrent Neural Network
In the created Modified RNN model, the modified RNN concept is applied to a deep network with two hidden layers and two contextual layers, which is shown in Fig. 4.
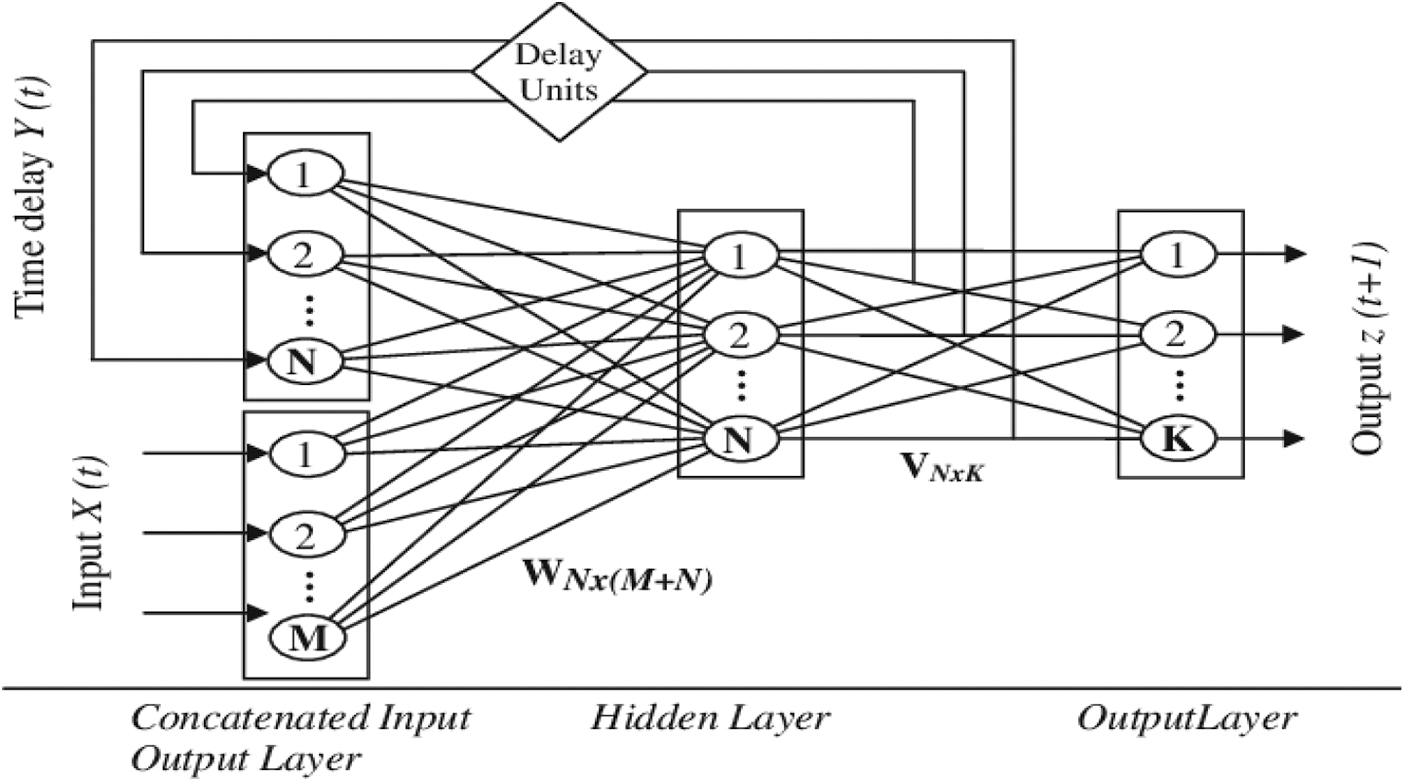
Figure 4: Modified RNN architecture
N (M+ N) recurrent value matrix, accordingly. For j B, the net action of neuron j at time t is calculated by
Passing net j(t) through the nonlinear activation function f (.) yields the result of neuron j in the hidden layer.
At period interval, the total result of neuron k is calculated by
It’s worth noting that the outer input at period step has no effect on any neuron’s response till time t + 1. The network’s overall dynamics are represented by the above set of equations. A simple example can be used to show the training approach for RNNs. At every epoch, the entire input sequence is fed into the network, and the results are calculated and the results to the target gene to produce an incorrect pattern. Fig. 5 illustrate the Algorithm for modified recurrent neural network.
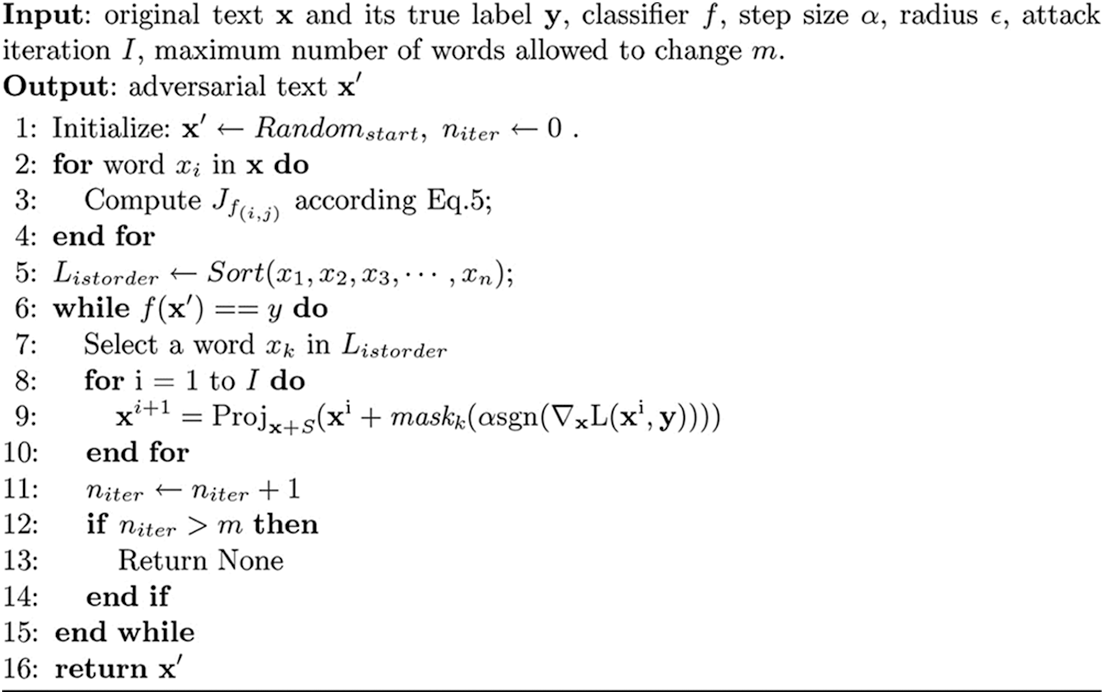
Figure 5: Algorithm for modified recurrent neural network
Modified RNNs vary from feed-forward systems, in that they impact a specific sort of neural layer called recurring levels, which enables the system to keep its state n the middle of uses. Let’s look at how modified RNNs work once they’ve been adequately trained to achieve a better understanding of how they work. We create a fresh example of our notion every time we want to analyse a data frame. The ECG database, which has 1000 pieces, was used to assess the network’s overall performance. Results were obtained in experimental experiments utilizing 13-, 15-, and 17-classes on various situations.
4 Simulation Results and Discussion
The study work employs four major steps to address the challenge of ECG pattern recognition and categorization. Among the processes are signal data acquisition, ECG feature extraction, arrhythmia detection, and ECG signal classification with a Modified RNN.
The MIT-BIH Arrhythmia database provided the ECG data (MIT-BIH ECG database, 2017). The MIT-BIH Arrhythmia Database is a searchable online database that contains over 4000 long-term ECG Holder recordings. Almost 60% of the recordings were made with the assistance of patients
The median filter is used to pre-process data for arrhythmia identification. Following signal derivation, the signal is filtered to highlight the QRS complex, then squared and averaged are remove high frequency noise.
After creating an approximately pulse-shaped waveform at the signal’s output, an adaptive threshold operation is used to determine QRS complex. At the position of the Master Veteran Index (MVI) maxima, the waveform is first processed to produce a set of weighted unit samples. This is done in order to pinpoint the location of the QRS complex in time. For the purpose of threshold the technique employs two threshold values to analyse the amplitude of the MVI output: signal and noise. If a legal QRS complex occurs within 200 ms of a previously identified one, it is impossible. Finally, if a QRS candidate appears after the 200-ms refractory period but within 360 ms of the preceding QRS, the algorithm assesses whether it is a real QRS complex of the following pulse or an excessively prominent T wave. The mean slope of the waveform at that point is used to make this conclusion. If the slope is less than half of the previous QRS complex, it is consistent with the slower changing behaviour of a T wave; otherwise, it is QRS detection. The arrhythmia detection using modified pan Tompkins, which are shown in Fig. 6
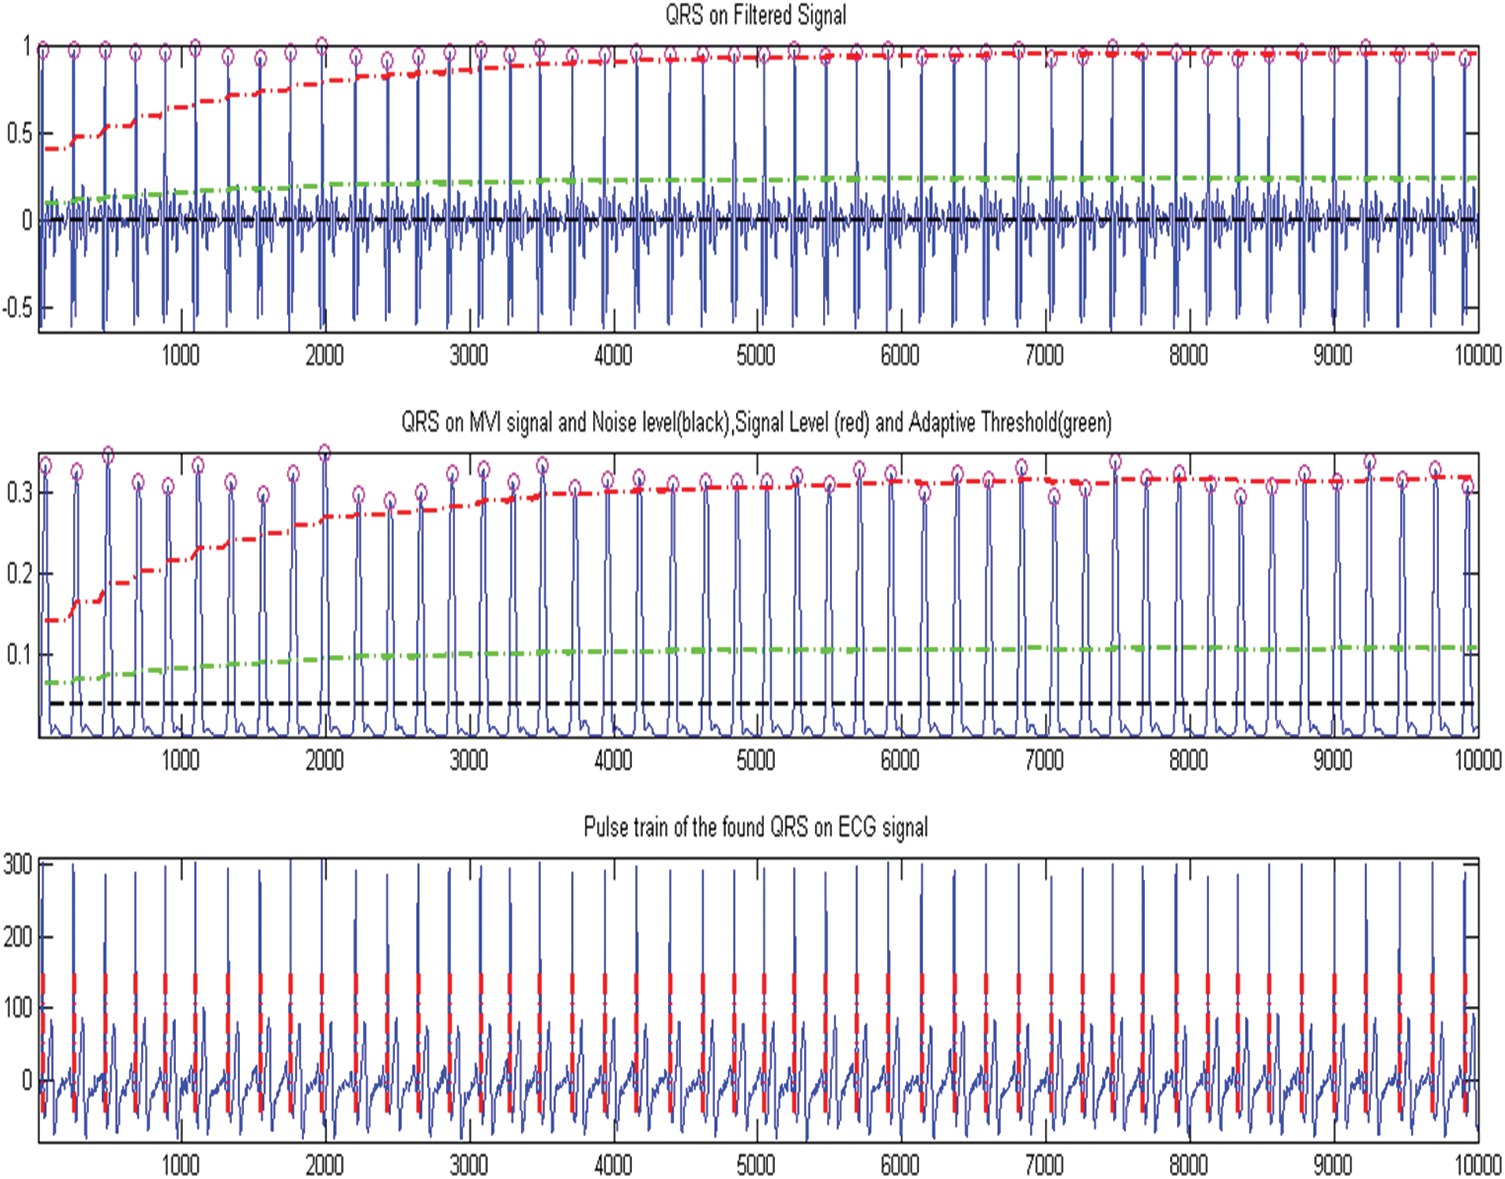
Figure 6: Arrhythmia detection using modified pan tompkins
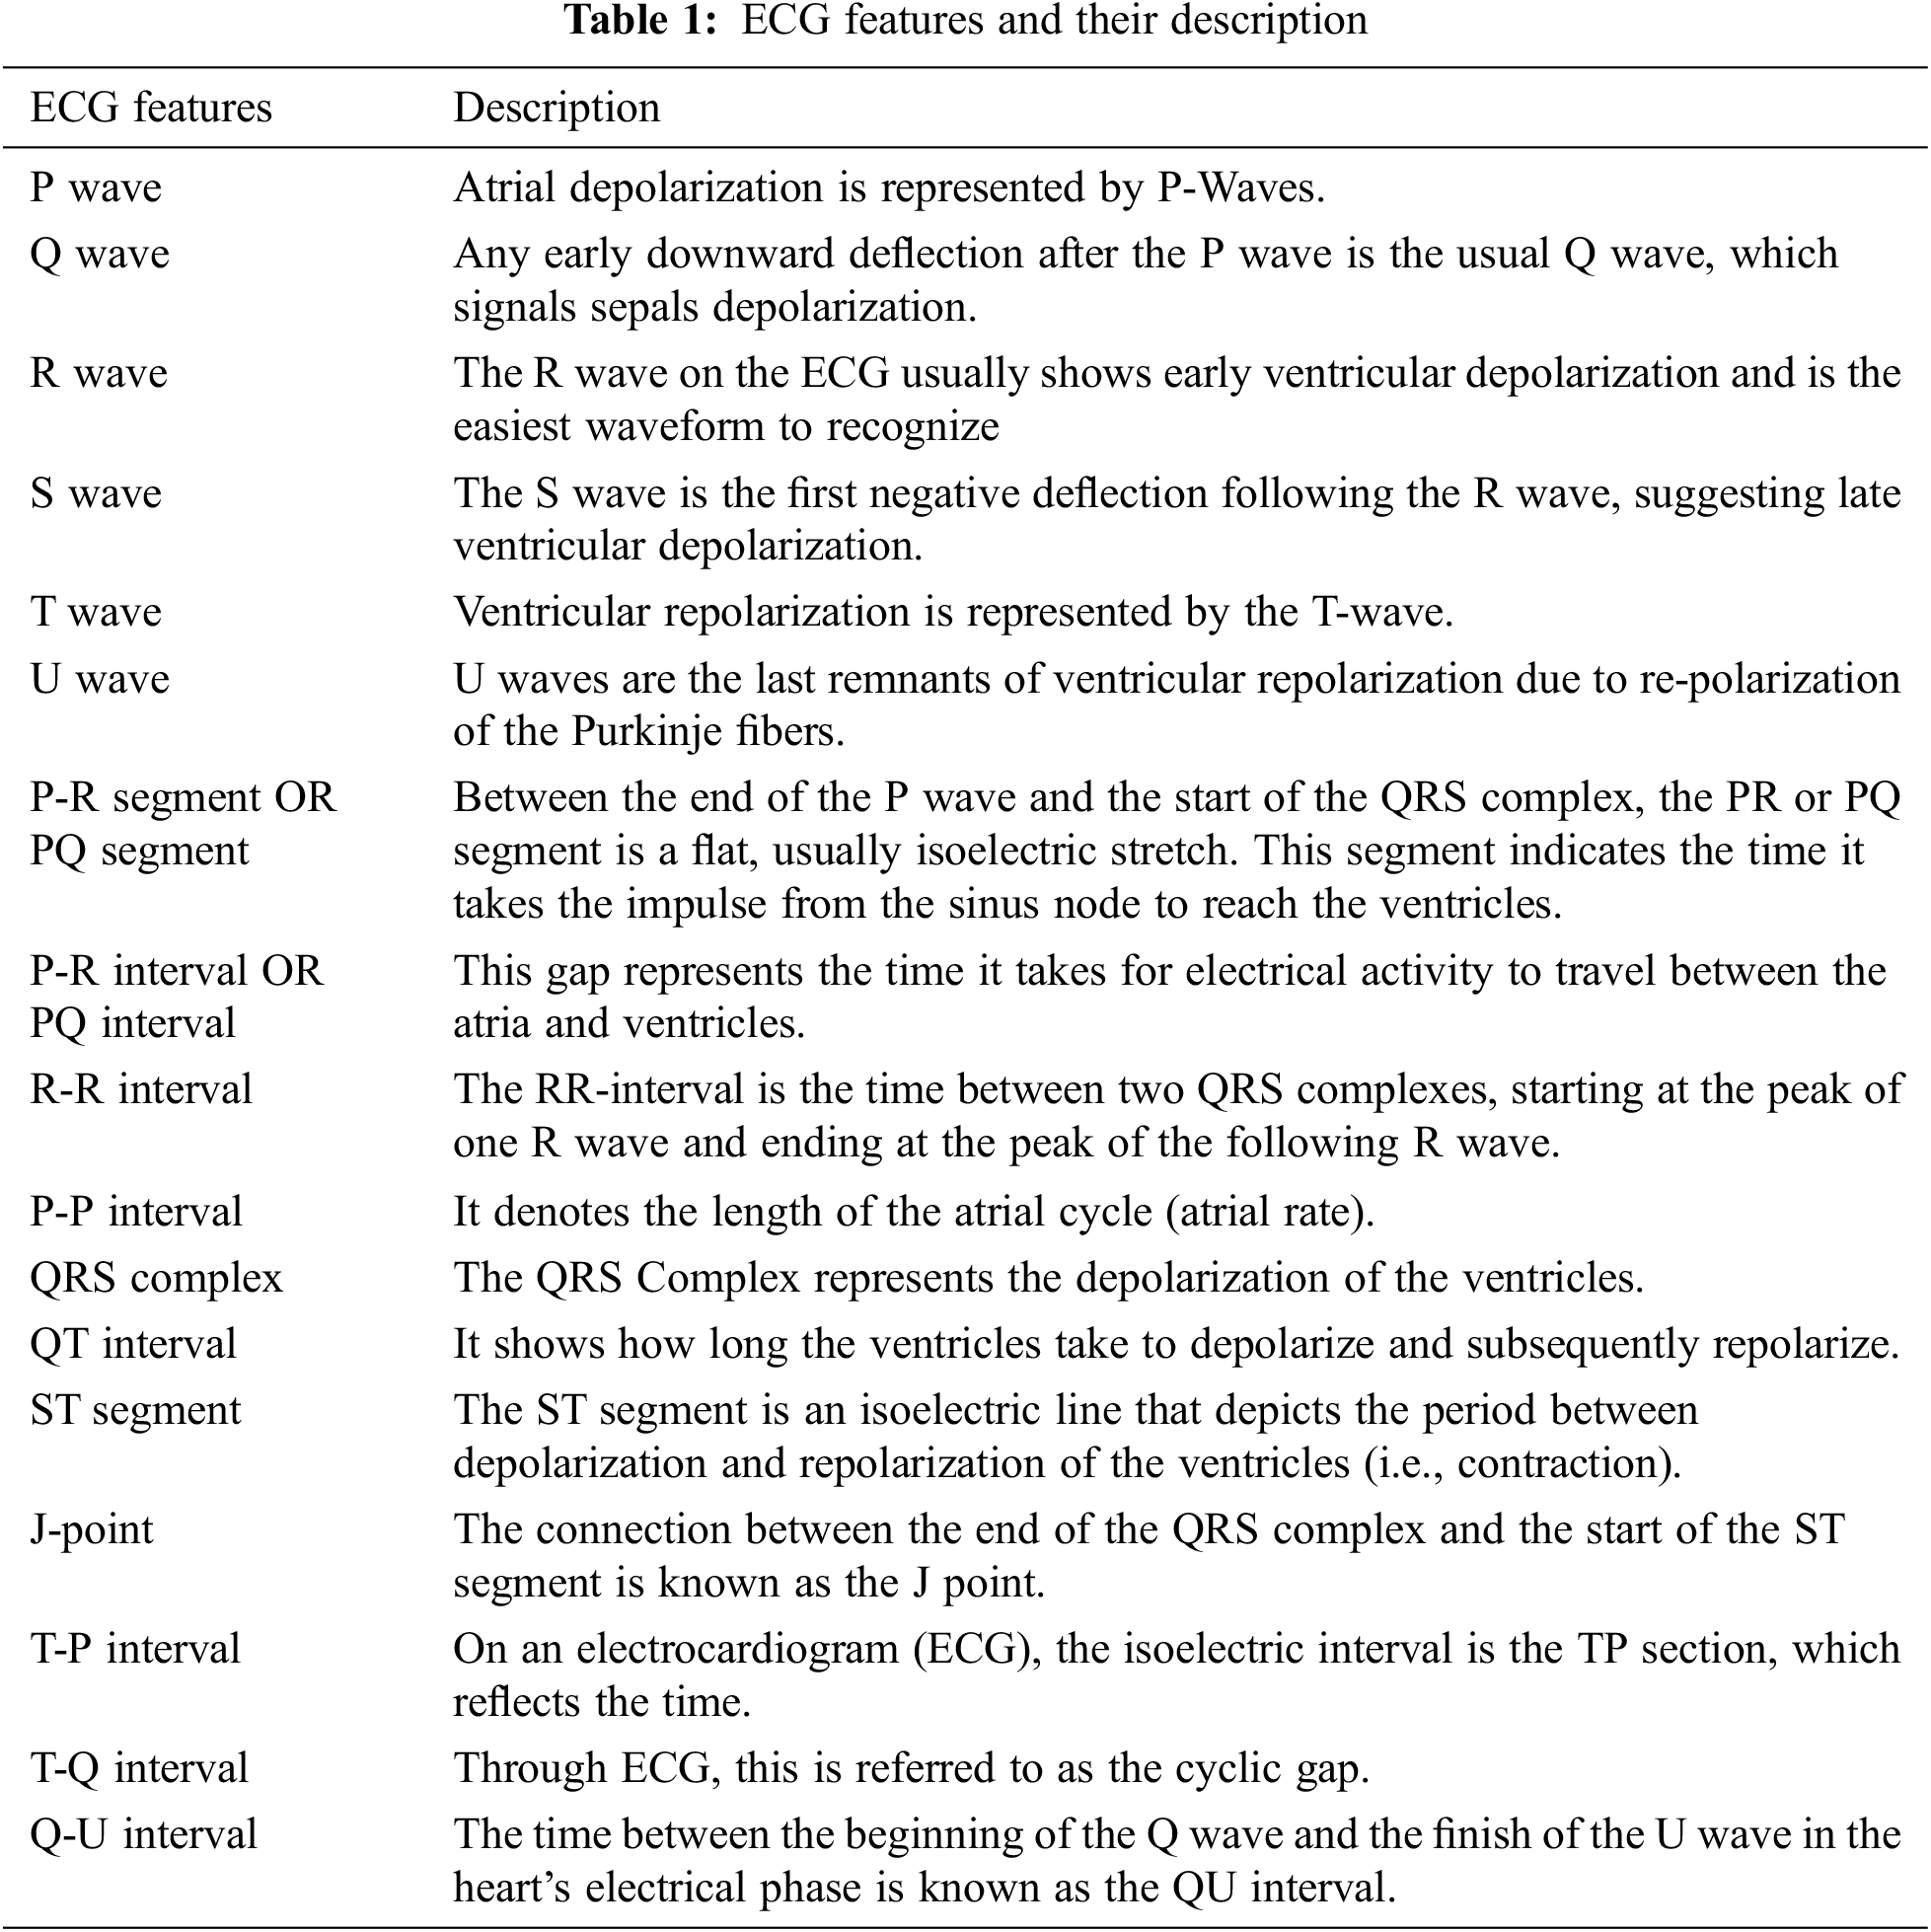
Each heartbeat’s track would be made up of many waves/peaks, segments, intervals, and joints. The features of the ECG are listed in Tab. 1 along with their descriptions.
When processing ECG signals in the time domain, values across beat intervals and amplitudes are used. The structure of the heart, differences in posture, age, size, relative body weight, chest arrangement, and a variety of other factors all influence the ECG. Normal sinus rhythm refers to the shape of an ECG signal in which the heart’s normal rhythm does not show any disease or condition Normal sinus rhythm (NSR). Cardiac arrhythmia is described as a condition, disturbance, or irregularity that disrupts the myocardium’s usual activation sequence is disrupted, resulting in an irregular heartbeat or abnormal cardiac rhythm, which can cause lasting heart damage. Arrhythmia can occur in a healthy heart and have no consequences, but it can also suggest a significant problem that can Due to a lack of blood flow to the body, this might result in stroke or cardiovascular problems, scarring of heart muscle or structural changes in the heart, or heart blockages or premature beats.
4.4 Modified RNN Classifier Performance Measures
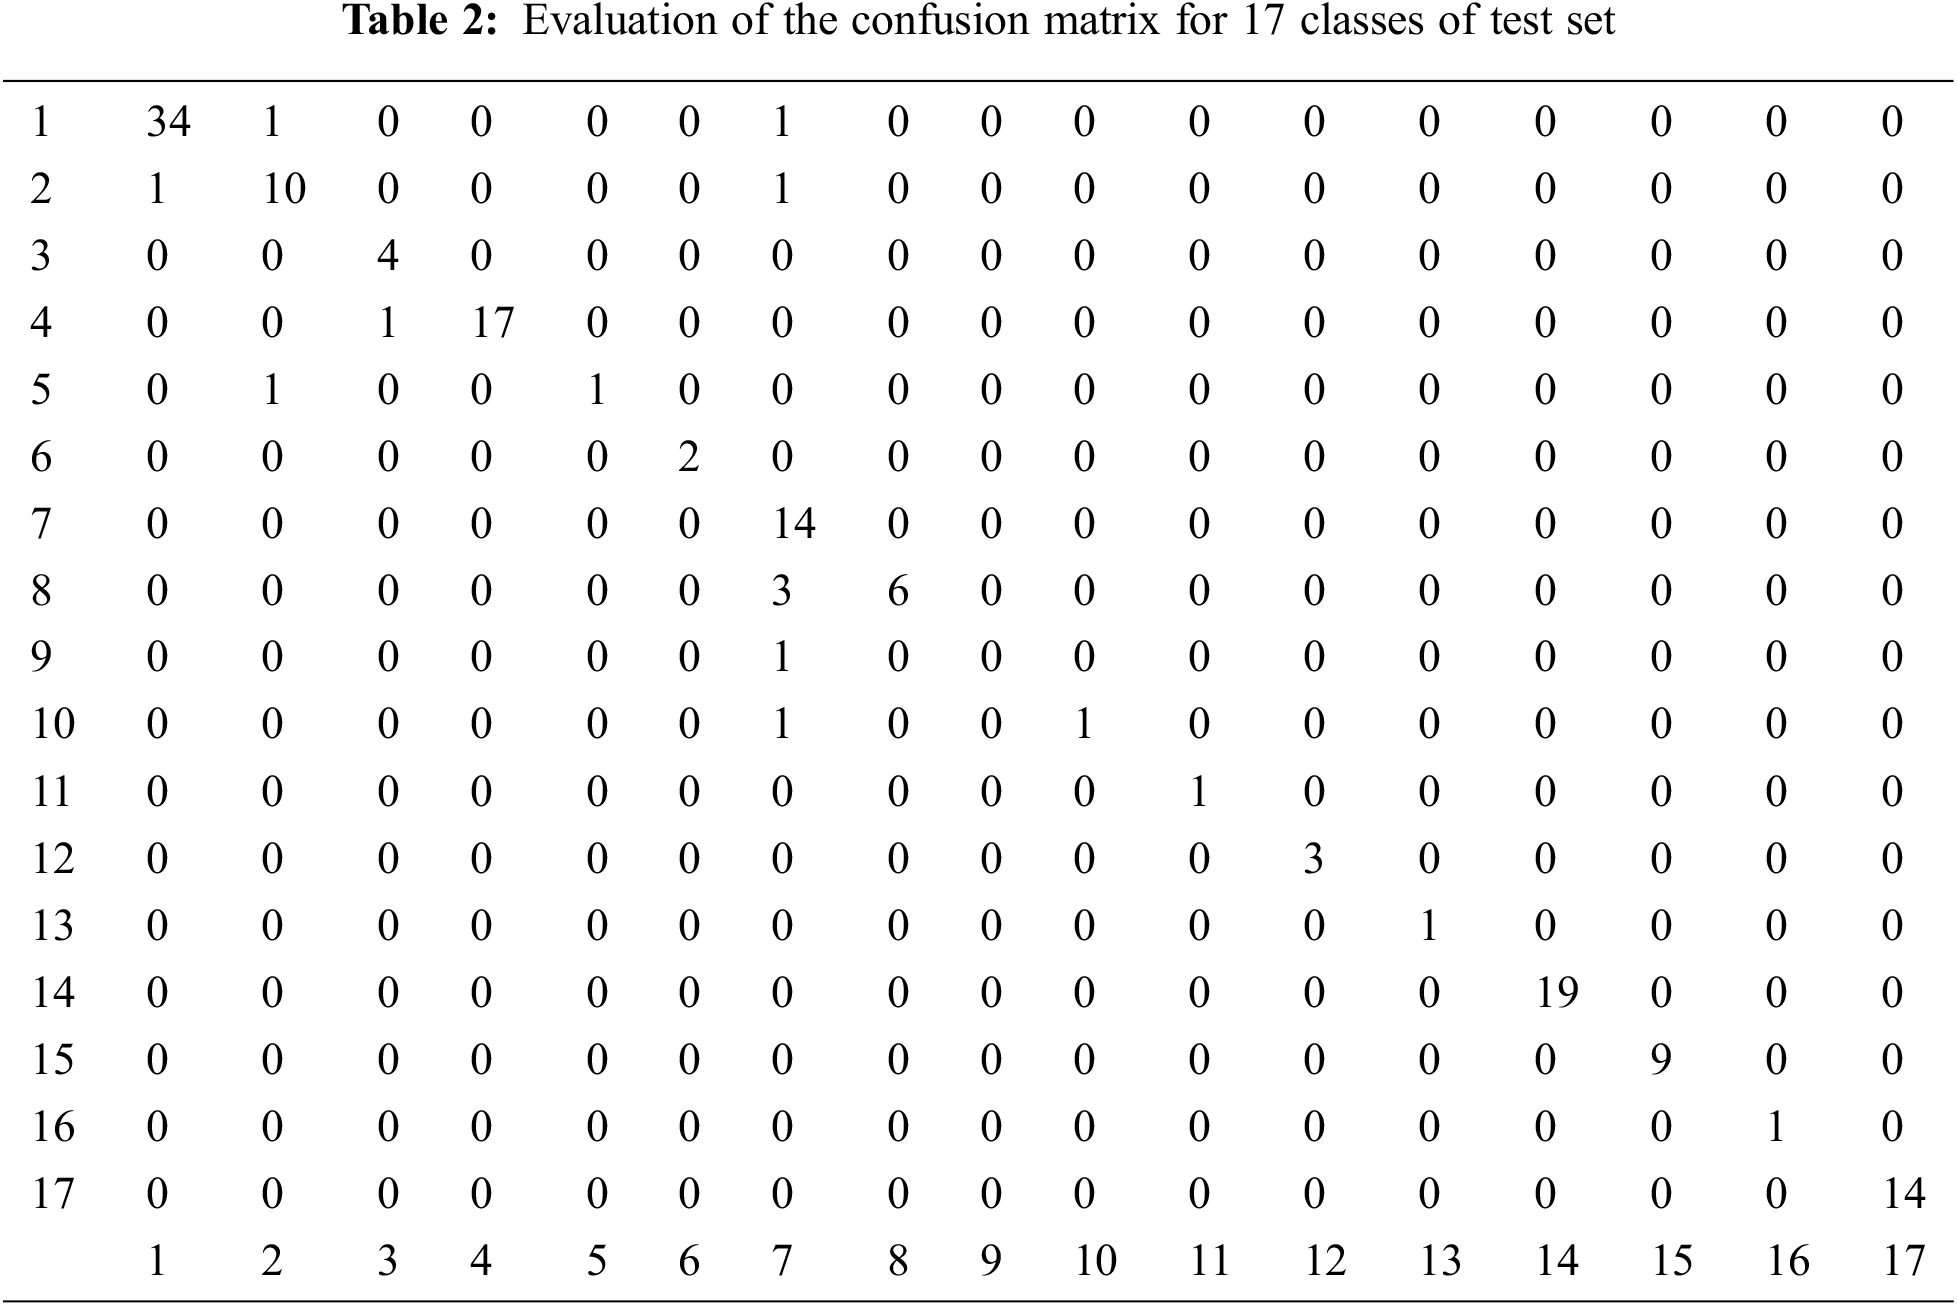
Modified RNN with 17 classes is used for categorization 3600 samples are employed in the proposed approach. In this study, there are 17 classes of 700 training, 150 testing, and 150 validation samples. The 17 classes are Normal sinus rhythm, Atrial premature beat, Atrial flutter, Atrial fibrillation, Supraventricular Tachyarrhythmia, Pre-excitation, Premature ventricular Contraction, Ventricular bigamy, Ventricular triggering, Ventricular Tachycardia, Ventricular rhythm, Ventricular flutter, Fusion of ventricular and normal beat, Left bundle branch block beat, Right bundle branch block beat, Second-degree heart block, Pacemaker rhythm. In the developed neural network model, the modified-RNN principle is used to a multi-layered structure perception with 2 different contextual layer and hidden layers. To investigate the students’ categorization outputs, a confusion matrix is employed as another assessment in the provided classification methods. These metrics, which are linked to true positive (TP), true negative (TN), false positive (FP), and false negative (FN) rates, are precision (PRE), sensitivity (SEN), specificity (SPE), and F1-score (FN). The evaluation of the confusion matrix for 17 classes of test set are tabulated in Tab. 2.
This feature distinguishes the M-RNN from other neural network approaches, which only have one hidden layer.
A standard Receiver operating characteristic (ROC) graph for a prediction system illustrates the sensitivity and specificity against the predicted values for each model, which is shown in Figs. 7a and 7b. The best quality can be obtained at a high sensitivity of 0.6 to 0.7 for all cases where the trained classier of the neural network has a specificity value of less than 0.1, as shown in the figures, suggesting that the classier might be better used in cases where sensitivity is much more essential than specificity.
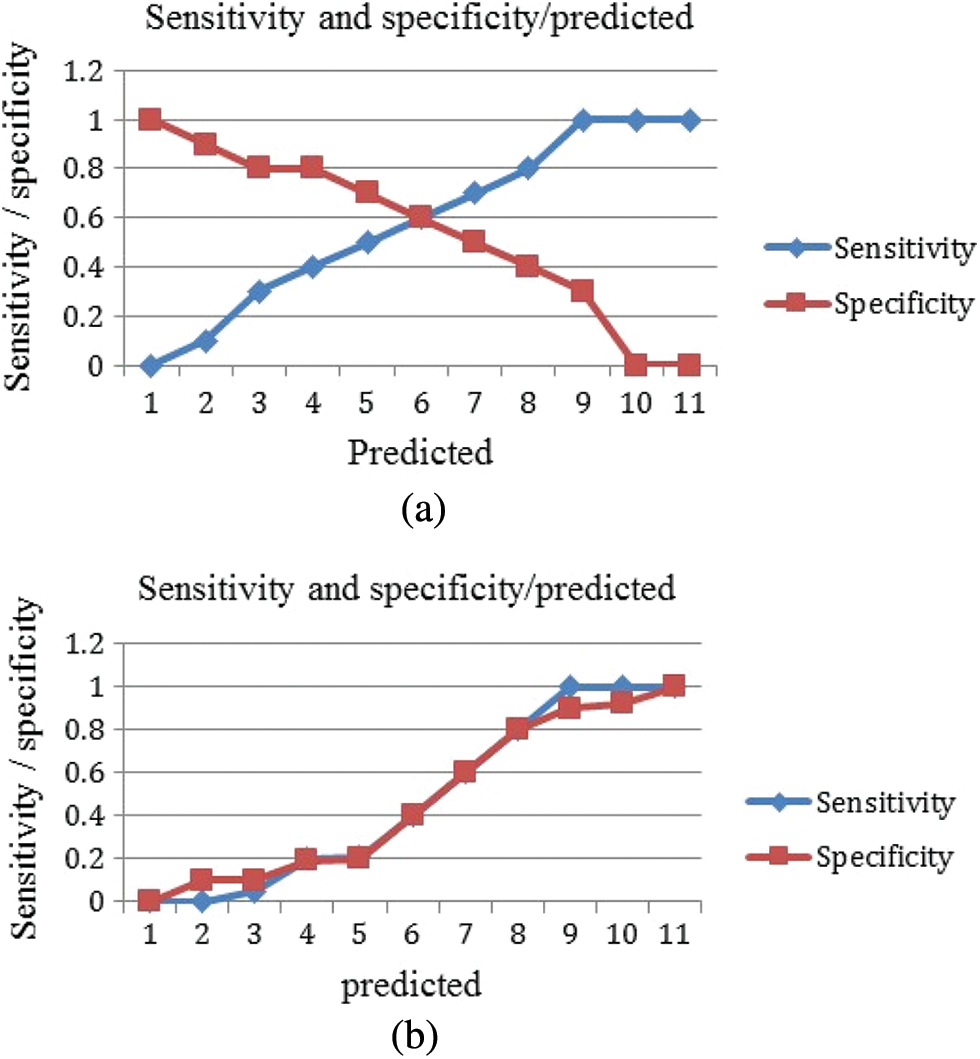
Figure 7: Sensitivity and specificity against the predicated values (a) M-RNN (b) RNN
The false positive is more prominent than the false negative, and it has been predicted by the classier, which is clearly explained in the above Figs. 8a and 8b. Because this finding is likely to be essential in most practical situations, positive classes should pay closer attention to it.
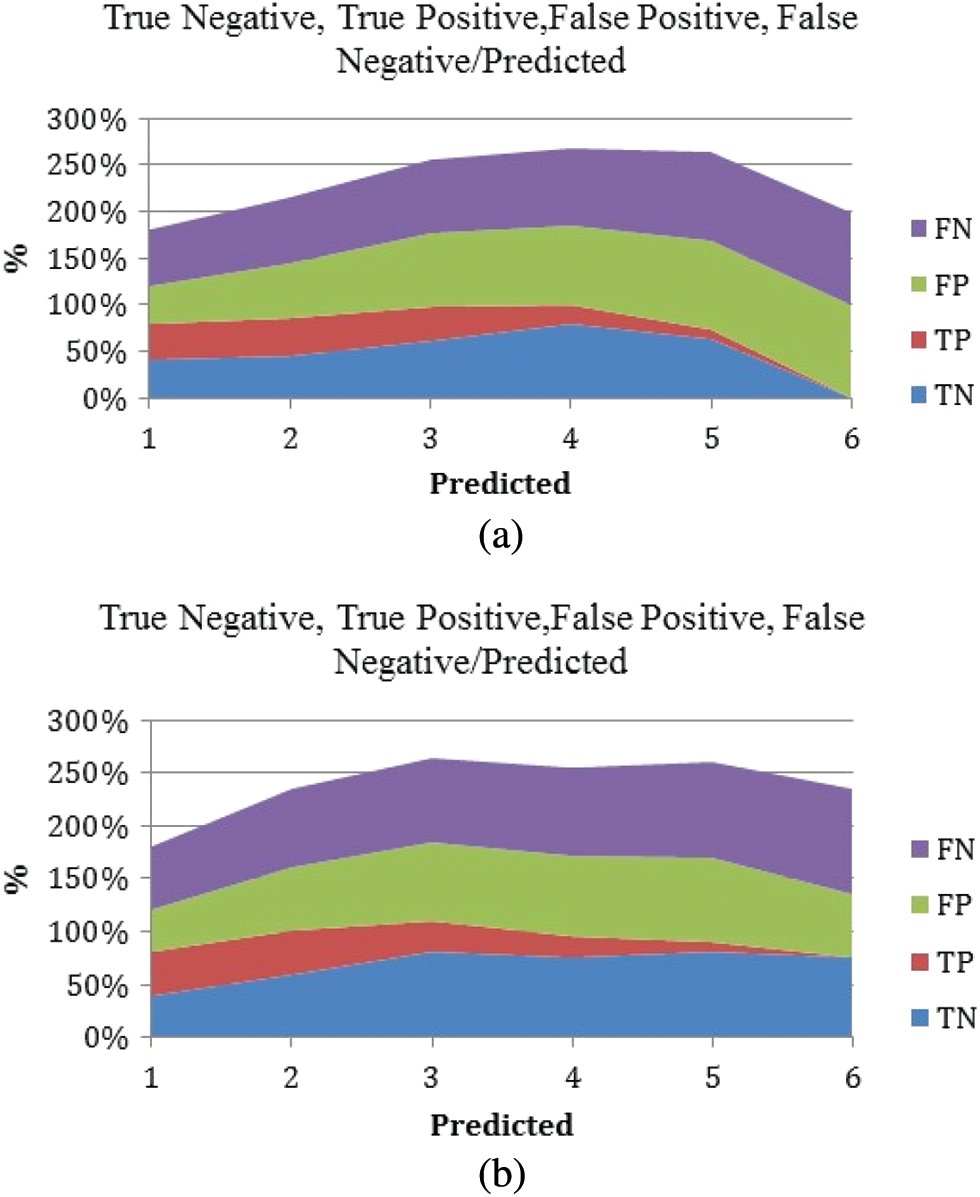
Figure 8: True positive, true negative, false positive, and false negative against the predicted values. (a) M-RNN (b) RNN
The classification efficiency on the underlying data set as the classifier tends to predict positive for the smaller values and mostly negative for the next half. The material varies because Logics Regression is being used for classifying and Elastic Net is used for predictions or regressed.
Using logistic regression, a ROC curve with AUC = 0.801 was created, which is well illustrated in Fig. 9. When compared to the M-RNN ROC curve, which has an AUC of 0.872, the value for the logic regression model is good. The M-RNN model is more stable and has a greater Area under Curve (AUC) than the baseline ROC curve, which has an AUC of 0.5 and represents a random predictors ROC curve.
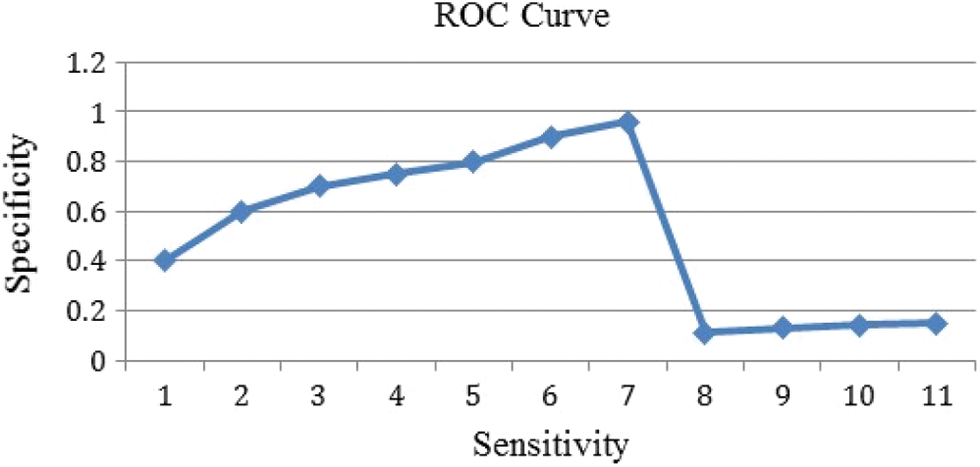
Figure 9: ROC curve obtained with proposed M-RNN classifier
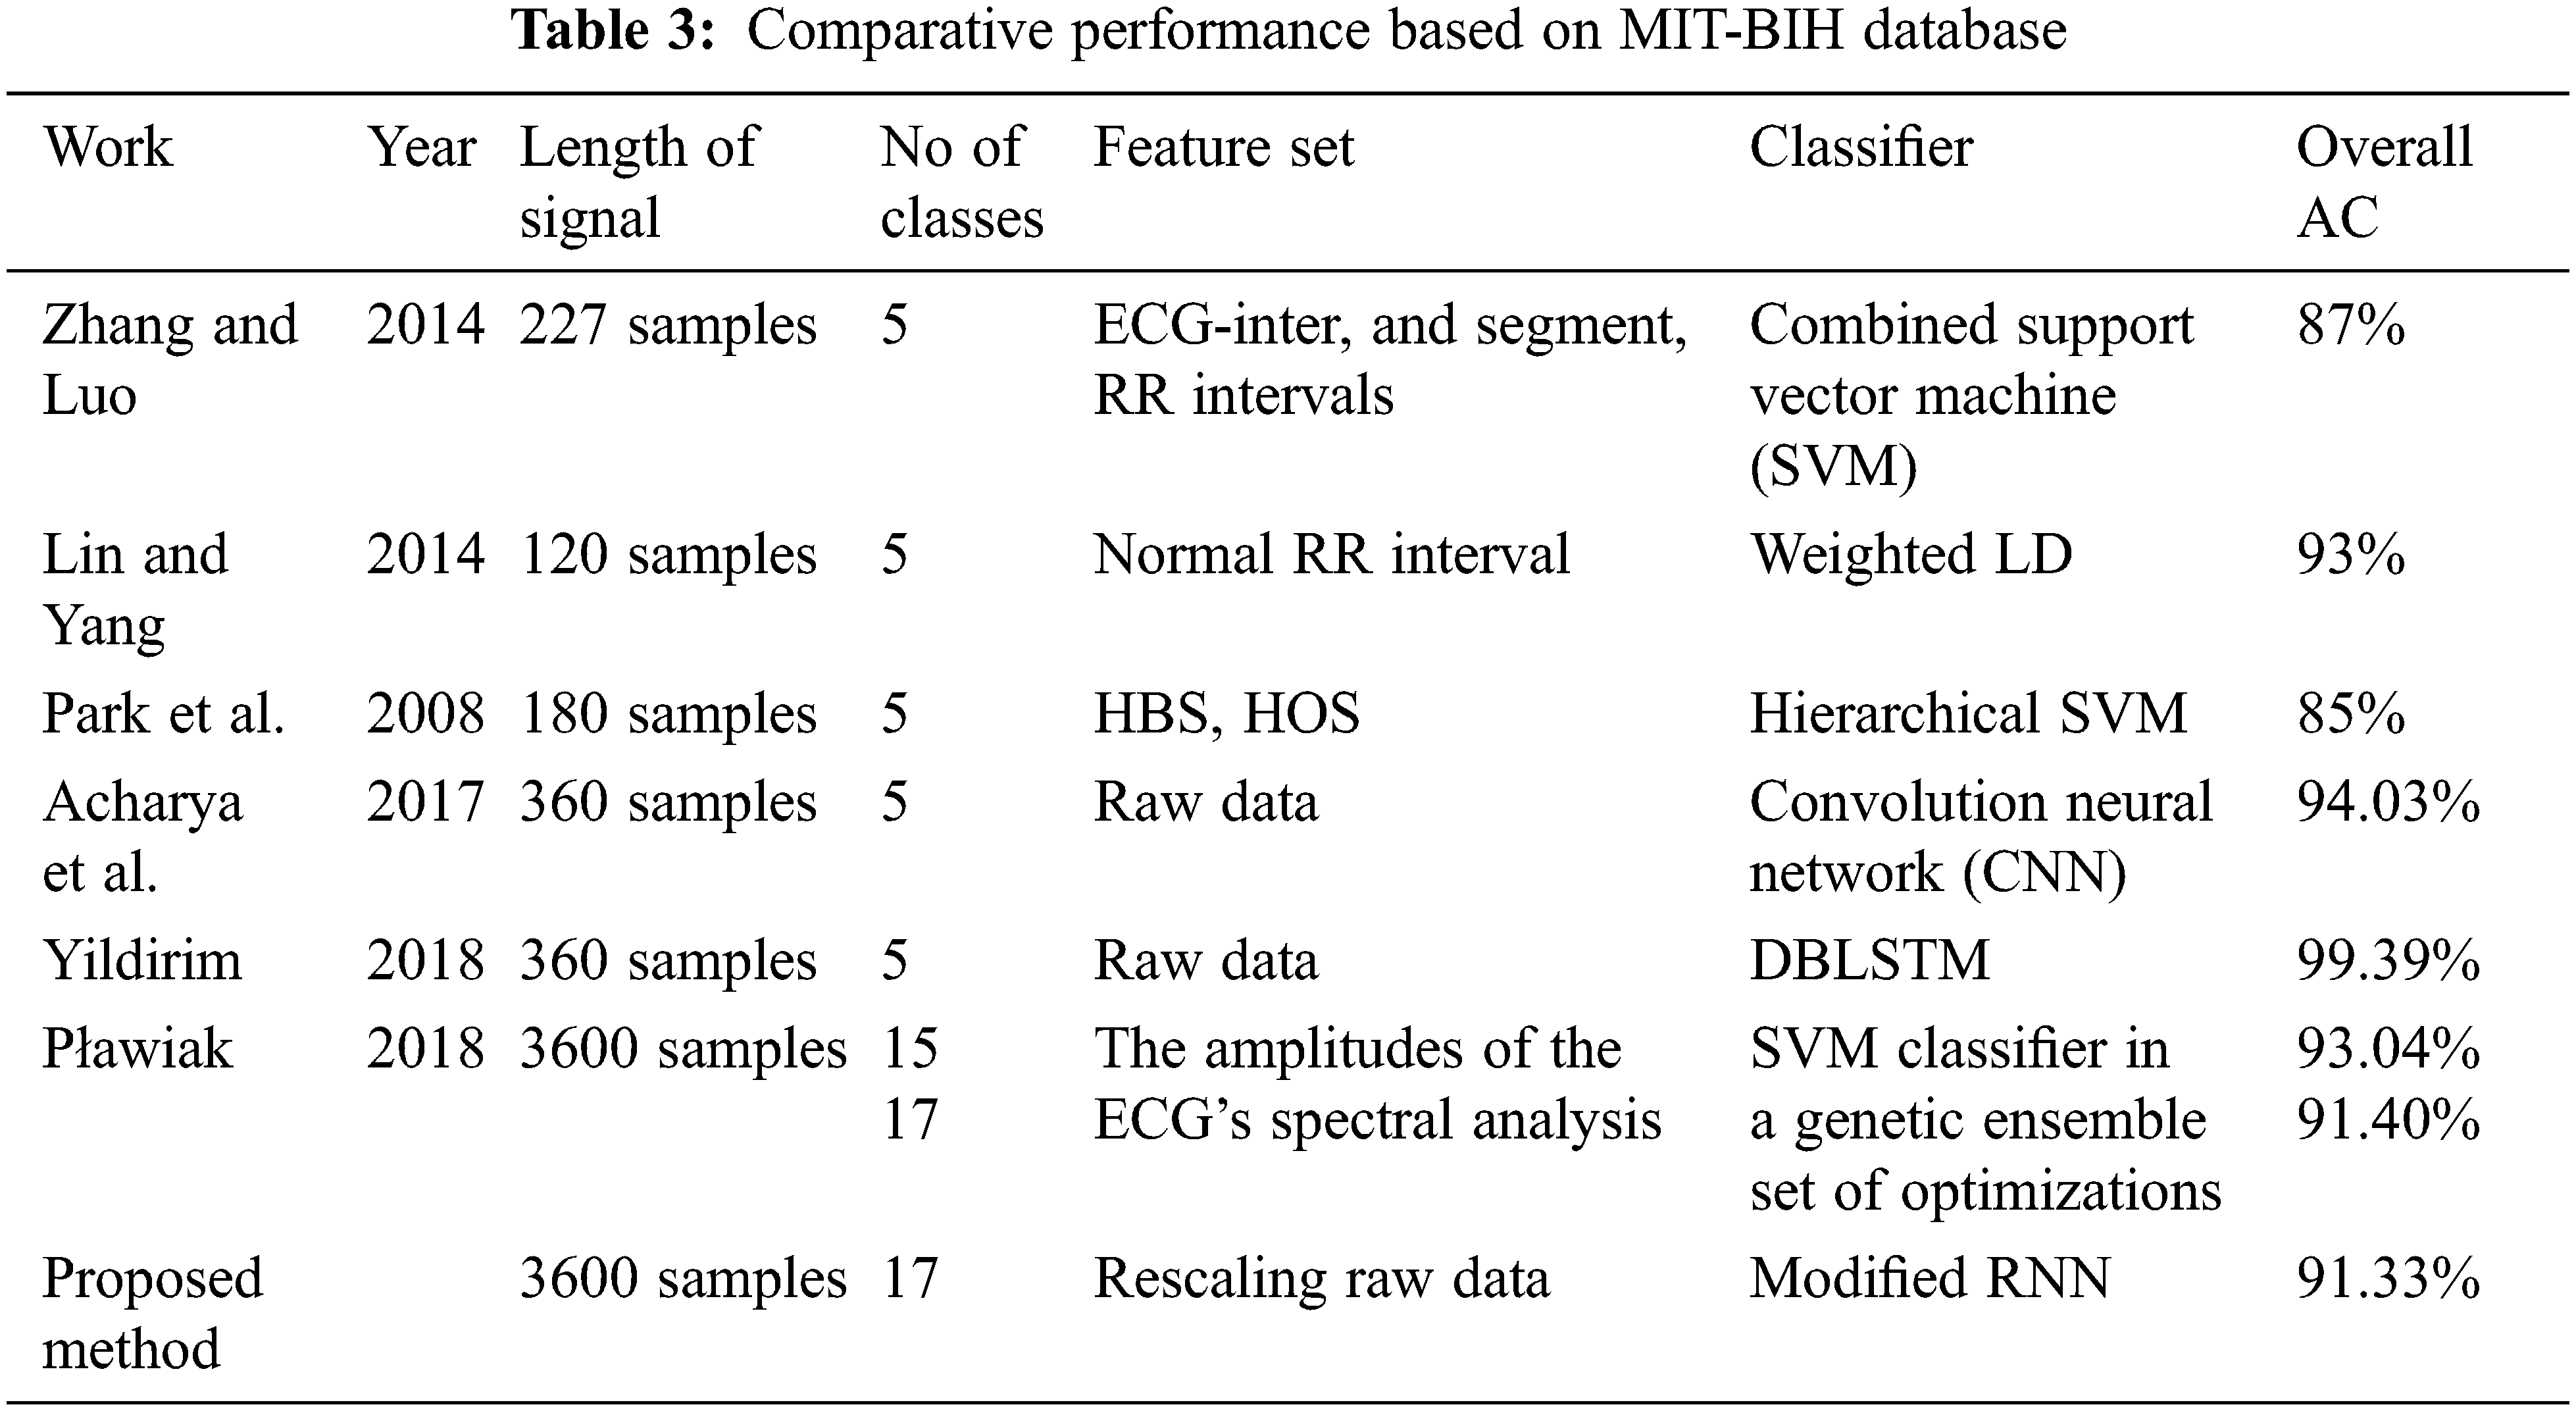
Tab. 3 lists the several reported ECG diagnosis algorithms, their signal analysis methodologies, and the best overall accuracies attained using the same database (MIT-BIH Arrhythmia). The new modified RNN model is effective in classifying cardiac arrhythmias utilizing long-duration ECG signals. Tab. 3 shows that we achieved the greatest accuracy of 91.33% for 17-class recognition that is comparable (91.40%) to a more complicated ensemble of classifiers. Even for 17, 15, and 13-classes, our results are superior to Plawiak’s previous work. The categorization of a single 10-s ECG signal segment took 0.015 s with Modified RNN. This quick computation time bodes well for the suggested solution’s potential use in telemedicine, mobile devices, or cloud computing for actual on going ECG data processing.
This research proposes and applies a novel ECG signal categorization with Modified RNN to the MIT-BIH database. The updated RNN is used to develop a deep learning model for heartbeat sound classification. To detect ECG arrhythmias automatically, A transportable need plenty ECG categorization system has been developed. The weights and biases of the classification algorithm were optimized using a modified RNN. This change had a positive impact, since the search agents’ positions were updated with an additional best answer. The overall classification accuracy of 17-classes cardiac arrhythmia was 95.33 present, for every 10-s ECG data, the classification time was 0.015 s. This approach can also be used to the analysis of ECG data from a larger number of leads in order to increase disease interpretation accuracy. In the future, improved methodologies could be employed to train the M-RNN classifier, which could improve ECG classification accuracy while also reducing training time.
Acknowledgement: The authors would like to thank Anna University and also we like to thank Anonymous reviewers for their so-called insights.
Funding Statement: The authors received no specific funding for this study.
Conflicts of Interest: The authors declare that they have no conflicts of interest to report regarding the present study.
1. A. Isin and S. Ozdalili, “Cardiac arrhythmia detection using deep learning,” in Procedia Computer Science, Budapest, Hungary, vol. 120, pp. 268–275, 2017. [Google Scholar]
2. M. Gala, J. Barabbas and J. Krajnak, “Robust QRS complex detector algorithm based on modified pan-tompkins method and wavelet transform,” in Proc. Int. Conf. on Telecommunications and Signal Processing, Milan, Italy, pp. 633–636, 2020. [Google Scholar]
3. G. Sannino and G. D. Pietro, “A deep learning approach for ECG-based heartbeat classification for arrhythmia detection,” Future Generation Computer Systems, vol. 86, pp. 446–455, 2018. [Google Scholar]
4. B. Jinda and R. Devi, “MATLAB based GUI for ECG arrhythmia detection using pan-tompkin algorithm,” in Proc. Parallel, Distributed and Grid Computing, Solan, India, pp. 754–759, 2019. [Google Scholar]
5. E. H. Houssein, M. Kilany, A. E. Hassanien and V. Snasel, “A Two-stage feature extraction approach for ECG signals,” in Proc. Int. Afro-European Conf. for Industrial Advancement, Springer, Cham, Milan, Italy, pp. 299–310, 2016. [Google Scholar]
6. A. Vishwa, M. K. Lal, S. Dixit and P. Vardwaj, “Clasification of arrhythmic ECG data using machine learning techniques,” the International Journal of Interactive Multimedia and Artificial Intelligence, vol. 1, no. 4, pp. 67–70, 2011. [Google Scholar]
7. G. Swapna, D. N. Ghista, R. J. Martis, A. P. Ang and S. V. Sree, “ECG signal generation and heart rate variability signal extraction: Signal processing, features detection, and their correlation with cardiac diseases,” Journal of Mechanics in Medicine and Biology, vol. 12, no. 4, pp. 1240012, 2012. [Google Scholar]
8. V. G. Sujadevi, K. P. Soman and R. Vinayakumar, “Real-time detection of atrial fibrillation from short time single lead ECG traces using recurrent neural networks,” in Proc. Int. Symp. on Intelligent Systems Technologies and Applications, Springer, Cham, Milan, Italy, pp. 212–221, 2017. [Google Scholar]
9. M. Thirugnanam and M. S. Pasupuleti, “Cardiomyopathy-induced arrhythmia classification and pre-fall alert generation using convolutional neural network and long short-term memory model,” Evolutionary Intelligence, vol. 14, no. 2, pp. 789–799, 2021. [Google Scholar]
10. R. K. Pathinarupothi, R. Vinaykumar, E. Rangan, E. Gopalakrishnan and K. P. Soman, “Instantaneous heart rate as a robust feature for sleep apnea severity detection using deep learning,” in Proc. Int. Conf. on Biomedical & Health Informatics, Orlando, FL, USA, pp. 293–296, 2017. [Google Scholar]
11. A. L. Goldberger, L. A. Amaral, L. Glass, J. M. Hausdorff, P. C. Ivanov et al., “Physio bank, physio toolkit, and physio net: Components of a new research resource for complex physiologic signals,” Circulation, vol. 101, no. 23, pp. 215–220, 2000. [Google Scholar]
12. I. B. Salah, R. D. Rosa, K. Ouni and R. B. Salah, “Automatic diagnosis of valvular heart diseases by impedance cardiography signal processing,” Biomedical Signal Processing and Control, vol. 57, pp. 101758, 2020. [Google Scholar]
13. S. Hochreiter and J. Schmidhuber, “Long short-term memory,” Neural Computation, vol. 9, no. 8, pp. 1735–1780, 1997. [Google Scholar]
14. F. A. Gers, J. Schmidhuber and F. Cummins, “Learning to forget: Continual prediction with LSTM,” Neural Computation, vol. 12, no. 10, pp. 2451–2471, 2000. [Google Scholar]
15. D. Lai, Y. Bu, Y. Su, X. Zhang and C. S. Ma, “Non-standardized patch-based ECG lead together with deep learning-based algorithm for automatic screening of atrial fibrillation,” IEEE Journal of Biomedical and Health Informatics, vol. 24, no. 6, pp. 1569–1578, 2020. [Google Scholar]
16. T. F. Romdhane and M. A. Pr, “Electrocardiogram heartbeat classification based on a deep convolutional neural network and focal loss,” Computers in Biology and Medicine, vol. 123, pp. 103866, 2020. [Google Scholar]
17. F. Chollet, “Xception: Deep learning with depth wise separable convolutions,” in Proc. Conf. on Computer Vision and Pattern Recognition, China, pp. 1251–1258, 2017. [Google Scholar]
18. M. Abadi, P. Barham, J. Chen, Z. Chen, A. Davis et al., “Tensor flow: A system for large-scale machine learning,” in Proc. Symposium on Operating Systems Design and Implementation, USA, pp. 265–283, 2016. [Google Scholar]
19. S. H. Wang, V. V. Govindaraj, J. M. Gorriz, X. Zhang and Y. D. Zhang, “COVID-19 classification by FGC net with deep feature fusion from graph convolutional network and convolutional neural network,” Information Fusion, vol. 67, pp. 208–229, 2021. [Google Scholar]
20. A. Appathurai, J. J. Carol, C. Raja, S. N. Kumar, A. V. Daniel et al., “A study on ECG signal characterization and practical implementation of some ECG characterization techniques,” Measurement, vol. 147, pp. 106384, 2019. [Google Scholar]
21. D. R. Ramji, C. A. Palagan, A. Nithya, A. Appathurai and E. J. Alex, “Soft computing based color image demosaicing for medical image processing,” Multimedia Tools and Applications, vol. 79, 15, pp. 10047–10063, 2020. [Google Scholar]
22. A. J. G. Malar, C. A. Kumar and A. G. Saravanan, “Iot based sustainable wind green energy for smart cites using fuzzy logic based fractional order darwinian particle swarm optimization,” Measurement, vol. 166, pp. 108208, 2020. [Google Scholar]
23. R. Sundarasekar and A. Appathurai, “Efficient brain tumor detection and classification using magnetic resonance imaging,” Biomedical Physics & Engineering Express, vol. 7, no. 5, pp. 055007, 2021. [Google Scholar]
 | This work is licensed under a Creative Commons Attribution 4.0 International License, which permits unrestricted use, distribution, and reproduction in any medium, provided the original work is properly cited. |