DOI:10.32604/iasc.2022.024176
| Intelligent Automation & Soft Computing DOI:10.32604/iasc.2022.024176 | |
| Article |
Modeling of Hyperparameter Tuned Hybrid CNN and LSTM for Prediction Model
1Department of Computer Science and Engineering, SRM Institute of Science and Technology, Ramapuram, 600 089, India
2Department of Computer Science and Engineering, M S Ramaiah Institute of Technology, Bangalore, 560 054, India
3Department of Information Technology, Sona College of Technology, Salem, 636 005, India
4Computer Science Department, University of Agriculture Faisalabad, Faisalabad, 38000, Pakistan
5Department of Computer Science and Engineering, Panimalar Engineering College, Chennai, 600 123, India
6Department of Computer Science and Engineering, Poornima College of Engineering, Jaipur, 302 022, India
*Corresponding Author: J. Faritha Banu. Email: banujahir@gmail.com
Received: 08 October 2021; Accepted: 26 November 2021
Abstract: The stock market is an important domain in which the investors are focused to, therefore accurate prediction of stock market trends remains a hot research area among business-people and researchers. Because of the non-stationary features of the stock market, the stock price prediction is considered a challenging task and is affected by several factors. Anticipating stock market trends is a difficult endeavor that requires a lot of attention, because correctly predicting stock prices can lead to significant rewards if the right judgments are made. Due to non-stationary, noisy, and chaotic data, stock market prediction is a huge difficulty, and as a result, investors find it difficult to invest their money in order to make a profit. In order to predict stock market movements, a number of strategies have been established. Earlier studies based on statistical models and machine learning techniques have been focused on short term stock price prediction. In this aspect, this study designs a novel hyperparameter tuned hybrid convolutional neural network with long short term memory (HPT-HCLSTM) for stock price prediction. The proposed HPT-HCLSTM technique encompasses three different processes namely pre-processing, prediction, and parameter optimization. The HPT-HCLSTM technique employs the HCLSTM technique for the prediction of stock prices. In addition, teaching and learning based optimization (TLBO) algorithm is applied for the hyperparameter optimization of the HCLSTM technique and thereby results in minimal error values. In order to demonstrate the enhanced prediction performance of the HPT-HCLSTM technique, a wide range of simulations were carried out and the results highlighted the better performance of the HPT-HCLSTM technique under several aspects. The HPT-HCLSTM technique is found to be a proper tool for forecasting stock prices. the HPT-HCLSTM technique has showcased better performance with the increased R2 value of 0.9154.
Keywords: Stock price prediction; stock market; time series; prediction; deep learning; hyperparameter tuning; TLBO algorithm
The stock market is a platform where the stocks are traded, circulated, and transferred. It has a record of four hundred years and it is utilized as channel to companies for increasing funds [1]. One of the issues that investors focus more on the stock market is the ever-changing trends of stock price [2]. The stock price has been impacted from several aspects, for example, the foreign and domestic economic environments, international situations, change of national policies, and so on. Stock price often changes are non-linear [3]. Forecasting stock price fluctuations earlier has often been a major challenge for economists. This prediction permits investors for adding the forecasted stock price to its investment policy and assists investor to increase their investment revenue. Making a prediction model for financial resources often has numerous challenges in the previous, involving various approaches to forecasting resource prices, i.e., hard to incorporate into single architecture, complexity in extracting features of deep learning (DL) approaches from text-based fundamental data, and historical price data in the market, that are hard to quantify, and automatic extraction of features is always laborious and time consuming and incomprehensive [4], time series forecast was the drawbacks of machine learning methods because of the presence of serial auto-correlation, DL methods always have a difficulty in tuning, huge amount of parameters, and so on. Detecting slow DDoS attacks in SDN-based networks using a hybrid Convolutional Neural Network-Long-Short Term Memory (CNN-LSTM) model. Custom datasets are used to assess the performance of this method. The obtained results are quite impressive-all performance metrics considered are greater than 99 percent. Our CNN-LSTM hybrid model also outperforms other deep learning models such as Multilayer Perceptron (MLP) and standard machine learning models such as l-Class Support Vector Machines (l-Class SVM). High Error is a possibility. Selection of Algorithms In Machine Learning, selecting an algorithm remains a manual process. Compilation of data We work on data all the time in machine learning. Time and space are two of the most important factors.
Continuous growth in the AI fields results in extensive utilization of DL algorithms in practical scenarios and many research fields [5]. The application includes image recognition, medical predictions, natural language processing, etc. The neural network utilized in this application has also improved and developed because of the growth of DL algorithms. e.g., reinforcement learning (RL) has become more popular since AlphaGo has beaten the optimal chess player while by utilizing it, and RL method has been performed in the financial predictive fields from that time [6]. Reinforcement learning (RL) is a subfield of machine learning concerned with how intelligent agents should behave in a given environment in order to maximize the concept of cumulative reward. Reinforcement learning, along with supervised and unsupervised learning, is one of the three basic machine learning paradigms. Advances in technology have provided the stock and Forex predictive methods a greater room to improve and strong framework to start. The very difficult non-linear relationships of DL could completely explain the complicated features of the factors that have an impact.
Several areas have tested the precision of DL methods for predictive performance, namely gene analysis image classification and. Experimental outcomes are also attained for time-series prediction and data analyses with a DL method; e.g., DL method is utilized for predicting offline store traffics [7]. DL algorithms have outstanding performances in another field of research. Hence, it is possible to forecast Forex and stock trends using DL algorithm. Financial investigators worldwide have been analyzing and studying the stock market changes. The increasing applications of artificial intelligence have resulted in a growing amount of investors with DL method for predicting and studying stock x prices. It was demonstrated that the variation in Forex and stock prices can be forecasted [8]. Unlike conventional econometric and statistical methods, DL algorithm could illustrate complicated factors that have an impact.
This paper presents an effective hyperparameter tuned hybrid convolutional neural network with long short term memory (HPT-HCLSTM) for stock price prediction. The proposed HPT-HCLSTM technique involves the design of effective DL model using HCLSTM for the prediction of stock prices. Moreover, teaching and learning based optimization (TLBO) algorithm is applied for the hyperparameter optimization of the HCLSTM technique and thereby results in minimal error values. Higher order neural networks pay more attention than traditional neural networks because they have greater computational capabilities, as well as better learning and storage capacity. This work represents a novel attempt to effectively optimise the performance of a higher order neural network (specifically, the Pi-Sigma neural network) for classification purposes. The neural network was efficiently trained using a newly developed population-based teaching learning-based optimization algorithm. The design of TLBO model for hyperparameter tuning of the HCLSTM technique shows the novelty of the work. For examining the improved performance of the HPT-HCLSTM technique, a comprehensive simulation analysis is made and the results are inspected under varying aspects.
2 Existing Stock Price Prediction Models
Mehtab et al. [9] proposed an accurate and robust architecture of stock price forecast which has an agglomeration of ML, DL, and statistical methods. They utilize regular stock price information, gathered at 5 min intervals of time, of a very popular company i.e., registered in the National Stock Exchange (NSE) of India. Subulakshmi [10], developed a new portfolio construction method with a hybrid method that depends on ML algorithm predicting stocks and MV methods for selecting portfolio. Initially, a hybrid method integrating XGBoost using an IFA is presented for predicting stocks for the following days. The IFA is designed for optimizing the hyperparameter of the XGBoost. Next, stock prices with high possible returns were chosen, and the MV approach is used for selecting portfolios.
In Vijh et al. [11], ANN and RF approaches were employed to predict the next day’s close prices for 5 companies belongs to distinct fields of management. The financial information: Close, Low, High, and Open prices of stock are employed to create novel parameters that are utilized as inputs to the method. Ramalingam [12] designed a hybrid model for predicting stock prices with ML and DL based algorithms. They choose NIFTY 50 index values of the NSE of India, for 4 years, from January 2015 till December 2019. According to the NIFTY information during that time, they construct different prediction methods with ML models, later utilize these methods for predicting the Closing values of NIFTY 50 during the year 2019, using a predicted horizon of a few weeks. In order to predict the NIFTY index movement pattern, they employ several classification models, but in order to forecast the real Close values of NIFTY index, numerous regression methods were made. Next, increase this prediction capacity of the method by constructing a DL based regression method with CNN using walk-forward validation.
Zhang et al. [13] proposed a new SVR-ENANFIS method for predicting stock prices by integrating the features of SVR and ENANFIS models. Initially, the potential values of technological indicators are predicted by the SVR model. Next, ENANFIS is used for predicting the close price according to the predictive result of initial phase. Rezaei et al. [14] developed new hybrid methods that are EMD-CNN-LSTM and CEEMD-CNN-LSTM that can extract time sequences and deep features that are ultimately used for the one-step-ahead predictions. The idea of the presented model is that while integrating this algorithm, few collaboration is determined amongst others which might improve the analytical capacity of this method.
Abe et al. [15] design a cross-sectional everyday stock price predictive model with DL for managing real investment. e.g., construct a portfolio using data accessible during market closing and invest during market opening the following days. Also, they implement experimental analyses in the Japanese stock market and validate the effectiveness of this model. Ampomah et al. [16] relate the efficacy of tree based ensemble ML methods (RF, XG, BC, Ada, ET, and VC) in predicting the direction of stock price changes. The 8 distinct stock information from 3 stock exchanges (NSE, NYSE, and) NASDAQ have been gathered arbitrarily and employed for the research. Every database is separated into testing and training sets.
In Yu et al. [17], the financial product price information is processed as a 1D series produced using the prediction of chaotic systems comprised of various aspects to the time dimensions, also the price sequence is recreated by the time sequence PSR technique. (It turns out that even chaos-related texts do not provide a clear definition of the term. A simple and rather imprecise way of expressing chaos is as follows: “chaotic systems are distinguished by their sensitive dependency on beginning circumstances as well as by their progression across phase space, which appears to be very random). A DNN based predictive method is developed on the basis of LSTM and PSR methods for DL algorithm and utilized for predicting stocks. Lu et al. [18] suggested a technique that depends on CNN-BiLSTM-AM for predicting the stock close prices of the following days. The method comprises CNN, (BiLSTM, and AM). The CNN could extracting feature in the input stock information. LSTM is a development of RNN that prevents the challenges of gradient explosion and gradient disappearance resulting from RNN model. In Ivan and Hakan proposed, We provide a new method for improving approximation accuracy using computational intelligence. It uses the Successive Geometric Transformations Model’s neural-like structure and the inputs polynomial extension in harmony. Second degree Wiener polynomial is used to implement this expansion. For example, this combination improves the approach accuracy for tasks like classification and regression, as well as picture identification and image scaling. The system’s high speed is maintained in both training and use modes because to the SGTM neural-like structure.
In this study, a new HPT-HCLSTM technique is derived to forecast the stock prices accurately. The design of HPT-HCLSTM technique involves three stages of operations namely pre-processing, HCLSTM based prediction, and TLBO based hyperparameter optimization. Fig. 1 demonstrates the overall working process of proposed HPT-HCLSTM technique.
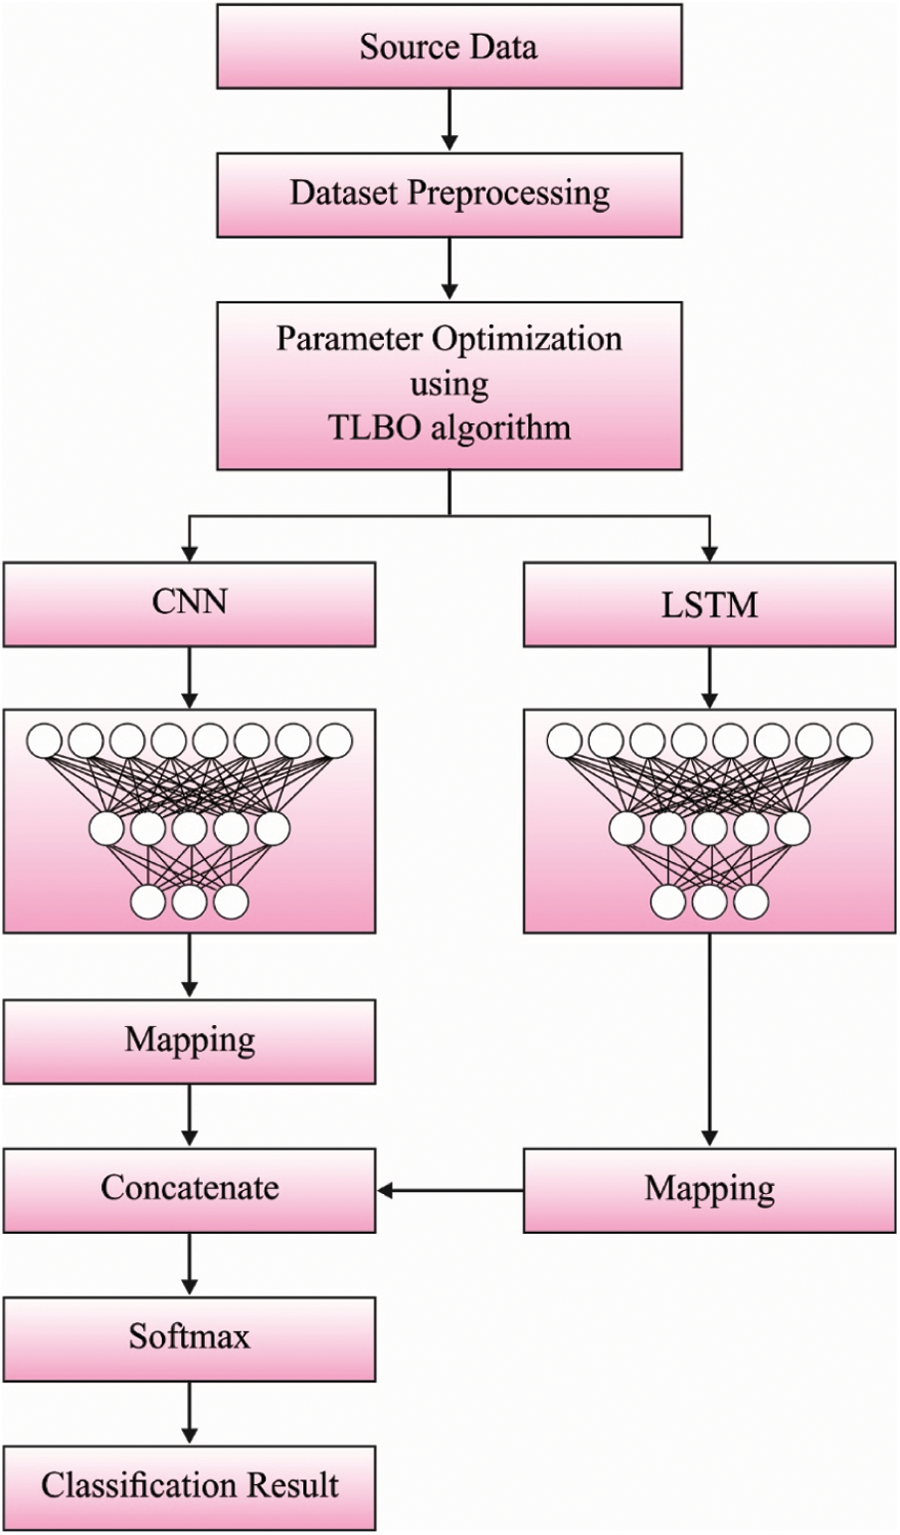
Figure 1: Overall process of HPT-HCLSTM model
Primarily, the data collects in the business fields endure pre-processed to the change of input financial data as to helpful data by 3 subprocesses such as data transformation, class labeling, and min-max normalization. It mostly uses for enhancing the quality of business data. Afterward, the data transformation procedure contains the translation of categorical as to numerical value. Then, the data sample has been chosen for appropriating class labels from the class labeling procedure. Finally, the min-max normalization technique attains finalization for regularizing the data to unchanging level.
3.2 HCLSTM Based Prediction Model
Once the input stock market data is pre-processed, the next stage lies in the design of HCLSTM based prediction process.
The LSTM resolves the issue of gradient disappearance of RNN. The LSTM has the ability for striking out or improve data to cell state. This ability has been provided as the framework named as gate. An LSTM takes 3 gates such as input, forget, and output gates that are utilized for providing read, write and reset functions correspondingly.
Amongst them, Ct−1 implies the cell state in the earlier module, dt−1 refers the outcome of preceding component, Xt stands for the present input, utilized for generating novel memory, and the resultant data contains the cell state Ct transferred later, novel output dt.
The forgetting gate from LSTM has been really a valve. If the input gate has been continuously open, much data flood as to the memory. At present, a forgetting process requires that more for removing the data from the memory [19]. It can be forgetting gate. It appearances at dt−1 (earlier output) and Xt (existing input) and output the number amongst 0 with 1 to all digits from the cell state Ct−1 (preceding state). 1 demonstrates the entirely kept, and 0 indicates the completely removed. The computation equation as:
Amongst them, Wf signifies the weight matrix, bf implies the bias term, and the outcome F with this network is number from the range 0 and 1, representing the probabilities of preceding cell state being forgotten, and 1 refers as “Entirely reserved” 0 represented as “entirely discarded”.
An input gate in LSTM needs to enhance the state-of-the-art memory in the present input then circulate NN “forgets” part of earlier state. The input gate contains 2 parts. The primary part, a sigmoid layer called as input threshold layer” chooses that values are required to renew. The second part, a tanh layer, makes a novel candidate vector
Amongst them, Wn implies the weight matrix, bn stands for the bias items, WM indicates the weight matrix to update the state of unit, bm denotes the bias item to upgrading the state of unit, and Ct demonstrates the state of upgraded memory units. In Eq. (4), input gate ht and
The resultant gate from LSTM has been outcome of present moment which requires that created afterward computing a novel state that has been utilized for controlling greatly the state of memory units from this layer has been removed. The resultant gate defines the output at that moment based on newest state, the outcome at last moment, and the present input. Its computation equation has been followed:
Specifically, primarily utilize the sigmoid activation function for obtaining Ot with value from the interval 0 and 1, and afterward, increase the memory cell state Ct with the tanh activation function and afterward multiply it with Ot that has been the output of this layer. dt could not only be compared with the input xt in the timestep t and the activation value dt−1 of hidden layer from the preceding timestep, apart from compared with the memory unit state Ct in the present time step.
The LSTM network is increased time features and procedure data with sequential characteristics [20]. Current analysis demonstrates that relating CNN and LSTM techniques are further stables than utilizing CNN and LSTM approaches individually. So, this work also connects the respective features of CNN with LSTM networks and utilizes the parallel association of network for combining the 2 networks for obtaining the HCLSTM network technique of this work that generates complete utilize of time and space feature expression abilities of 2 networks.
The data has been pre-processed initially, and the managed data has been utilized for training the CNN as well as LSTM networks correspondingly. Afterward, the feature data removed with CNN and the feature data removed with LSTM are correspondingly managed as to the similar dimensional with mapping layers, and the outcomes of CNN as well as LSTM have been linked from parallel with concatenating, and lastly classified by softmax.
3.3 TLBO Based Hyperparameter Optimization
For properly tuning the hyperparameters involved in the HCLSTM model, the TLBO algorithm is applied to it. TLBO algorithm is based on the classical technique of education from classrooms contains 2 important parts. A primary part has been compared with choosing an optimum solution (teacher) and sharing skills amongst the teacher and another solution from the teacher phase. The second one defines the learner procedure for finding optimum solution with utilizing knowledge amongst specific candidates and by chance chosen one. These 2 parts role important plays from the TLBO technique. Combine of intensification as well as diversification have been guaranteed from the teacher and learner stages correspondingly.
The optimize technique of TLBO begins with the group of arbitrary populations known as students. Afterward the initial estimation of solutions, an optimum solution defines the teacher. The skill has been shared amongst the teacher and another solution from the teacher stage. The recently upgraded solutions have been estimated, and the greatest optimum solution is elected and exchanged with the old ones [21]. Then, all the solutions alert was upgraded using sharing feature with other arbitrarily chosen solutions. Like teacher one, a replacing approach has been implemented for keeping the old learner or replacing them with currently created ones afterward the learner stage. The TLBO technique steps have been projected and expressed as:
Population Initialization
During the TLBO technique, a primary candidate solution is regarded as class with nS student. The group of randomizing students (S) has been processed with subsequent formula:
where nS refers the amount of students, nVar implies the amount of design variables, and Lb and Ub demonstrates the lower as well as upper bound vectors of design variable.
Teachers Level
Initially, the students have been estimated, and its equivalent penalization objective function vector (PFit) has been produced. Afterward, an optimum student (the student with optimum-penalization objective function values) was elected as teacher (T). A step size upgrades the student nearby its teacher. The step size has been attained dependent upon the teacher skill and the average skill of every student (AveS). The teacher stage has been expressed as follows:
The term of srepsizei refers the step size of ith students, newS signifies the vector of novel student, randi,j defines the arbitrary number elected in the interval of 0 and 1 and the teacher factor (TFi) has been regarded as for changing the result of teacher skill on the class average that is also 1 or 2.
The value of TFi is not provided as input to this technique, and this technique arbitrarily chooses their value. The demonstrated schematic generation of novel solutions from the teacher stage of TLBO projected exposes that the feasible area of novel solutions is probable amongst 2 vectors of present solution (S) and randomized step size [22]. It could be advantageous for exploring a wide possible area of the novel solution with implementing approaches like hybridization or some other enhancement techniques declared that QTLBO.
Replacement Level
During this step, recently created students have been estimated and exchanged with its equivalent old ones from the easy greedy approach. In this manner, the recently created student with an optimum-penalized objective function has been chosen to equivalent old one. So, a novel class with nS students has been designed.
Learners Level
During the learner phase, primarily, all the students arbitrarily elect another one (Srs) other than himself. Afterward, the student shares his skill with arbitrarily chosen one. The student nears the another chosen student when the other elected one has further skill than him (PFiti < PFitrs). The learner phase has been expressed as:
Step five (replacement manner): The replacement approach was carried out again.
Step six (end condition): When this technique’s end condition has been fulfilled, this technique was ended. Else, go to step 2. Fig. 2 illustrates the flowchart of TLBO technique.
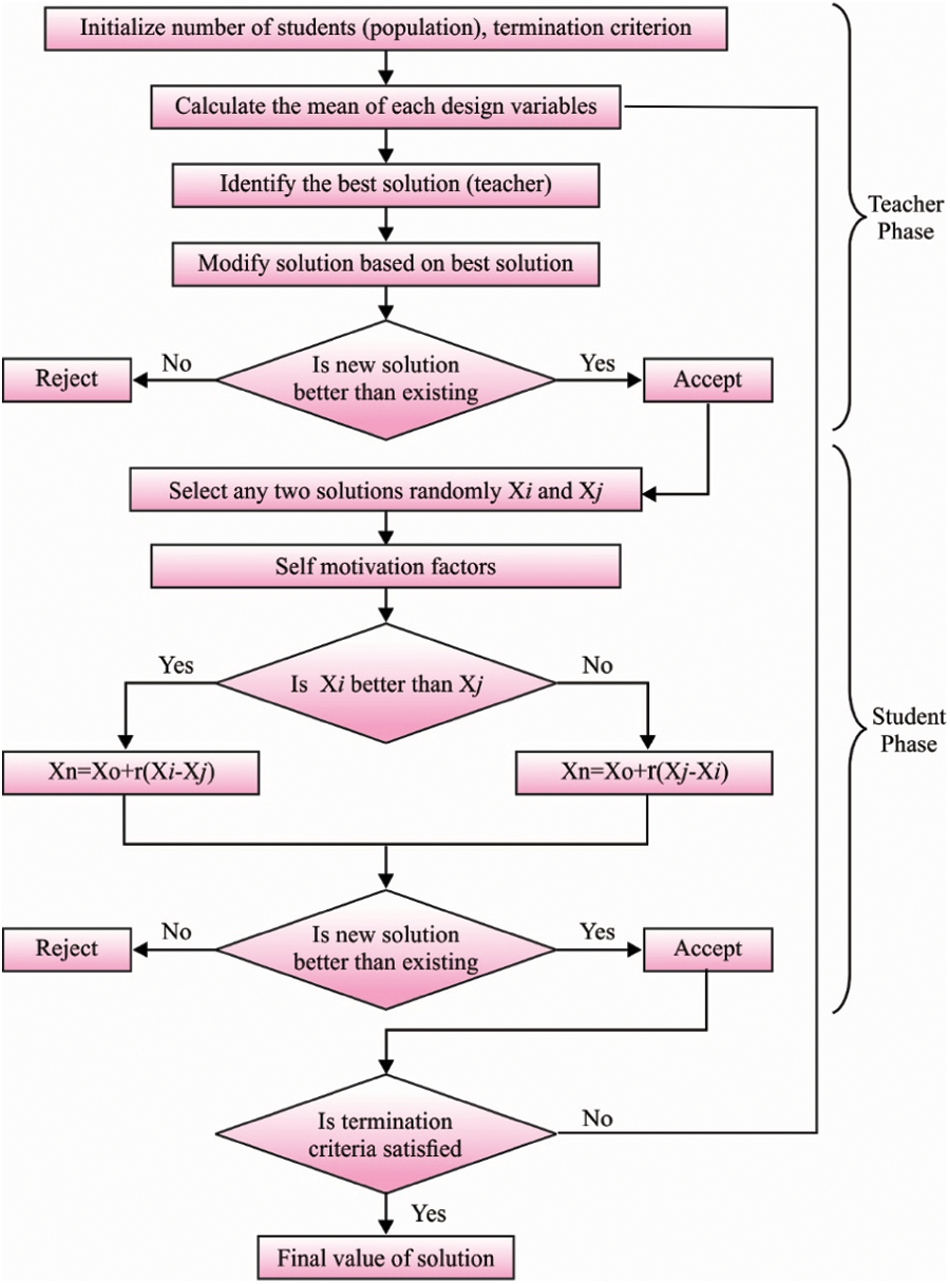
Figure 2: Flowchart of TLBO algorithm [22]
For experimental validation, the Shanghai Composite Index (000, 001) stock is chosen. The day-to-day trading data of 7083 trading days in the duration of July 1, 1991 to June 30, 2020 are attained. Every instance comprises 8 attributes namely opening price, highest price, lowest price, closing price, volume, turnover, ups and downs, and change. Besides, the results are inspected interms of, mean absolute error (MAE), root mean square error (RMSE), and R-square (R2).
Tab. 1 offers a detailed results analysis of the HPT-HCLSTM technique under ten folds. Fig. 3 inspects the MAE and RMSE analysis of the HPT-HCLSTM technique under varying folds. For instance, with fold-1, the HPT-HCLSTM technique has obtained MAE and RMSE of 20.425 and 30.530 respectively. Likewise, with fold-4, the HPT-HCLSTM system has gained MAE and RMSE of 20.235 and 30.124 correspondingly. Eventually, with fold-6, the HPT-HCLSTM technique has reached MAE and RMSE of 20.176 and 30.455 correspondingly. Meanwhile, with fold-8, the HPT-HCLSTM approach has obtained MAE and RMSE of 20.449 and 30.421 respectively. Lastly, with fold-10, the HPT-HCLSTM manner has achieved MAE and RMSE of 20.552 and 30.201 correspondingly.
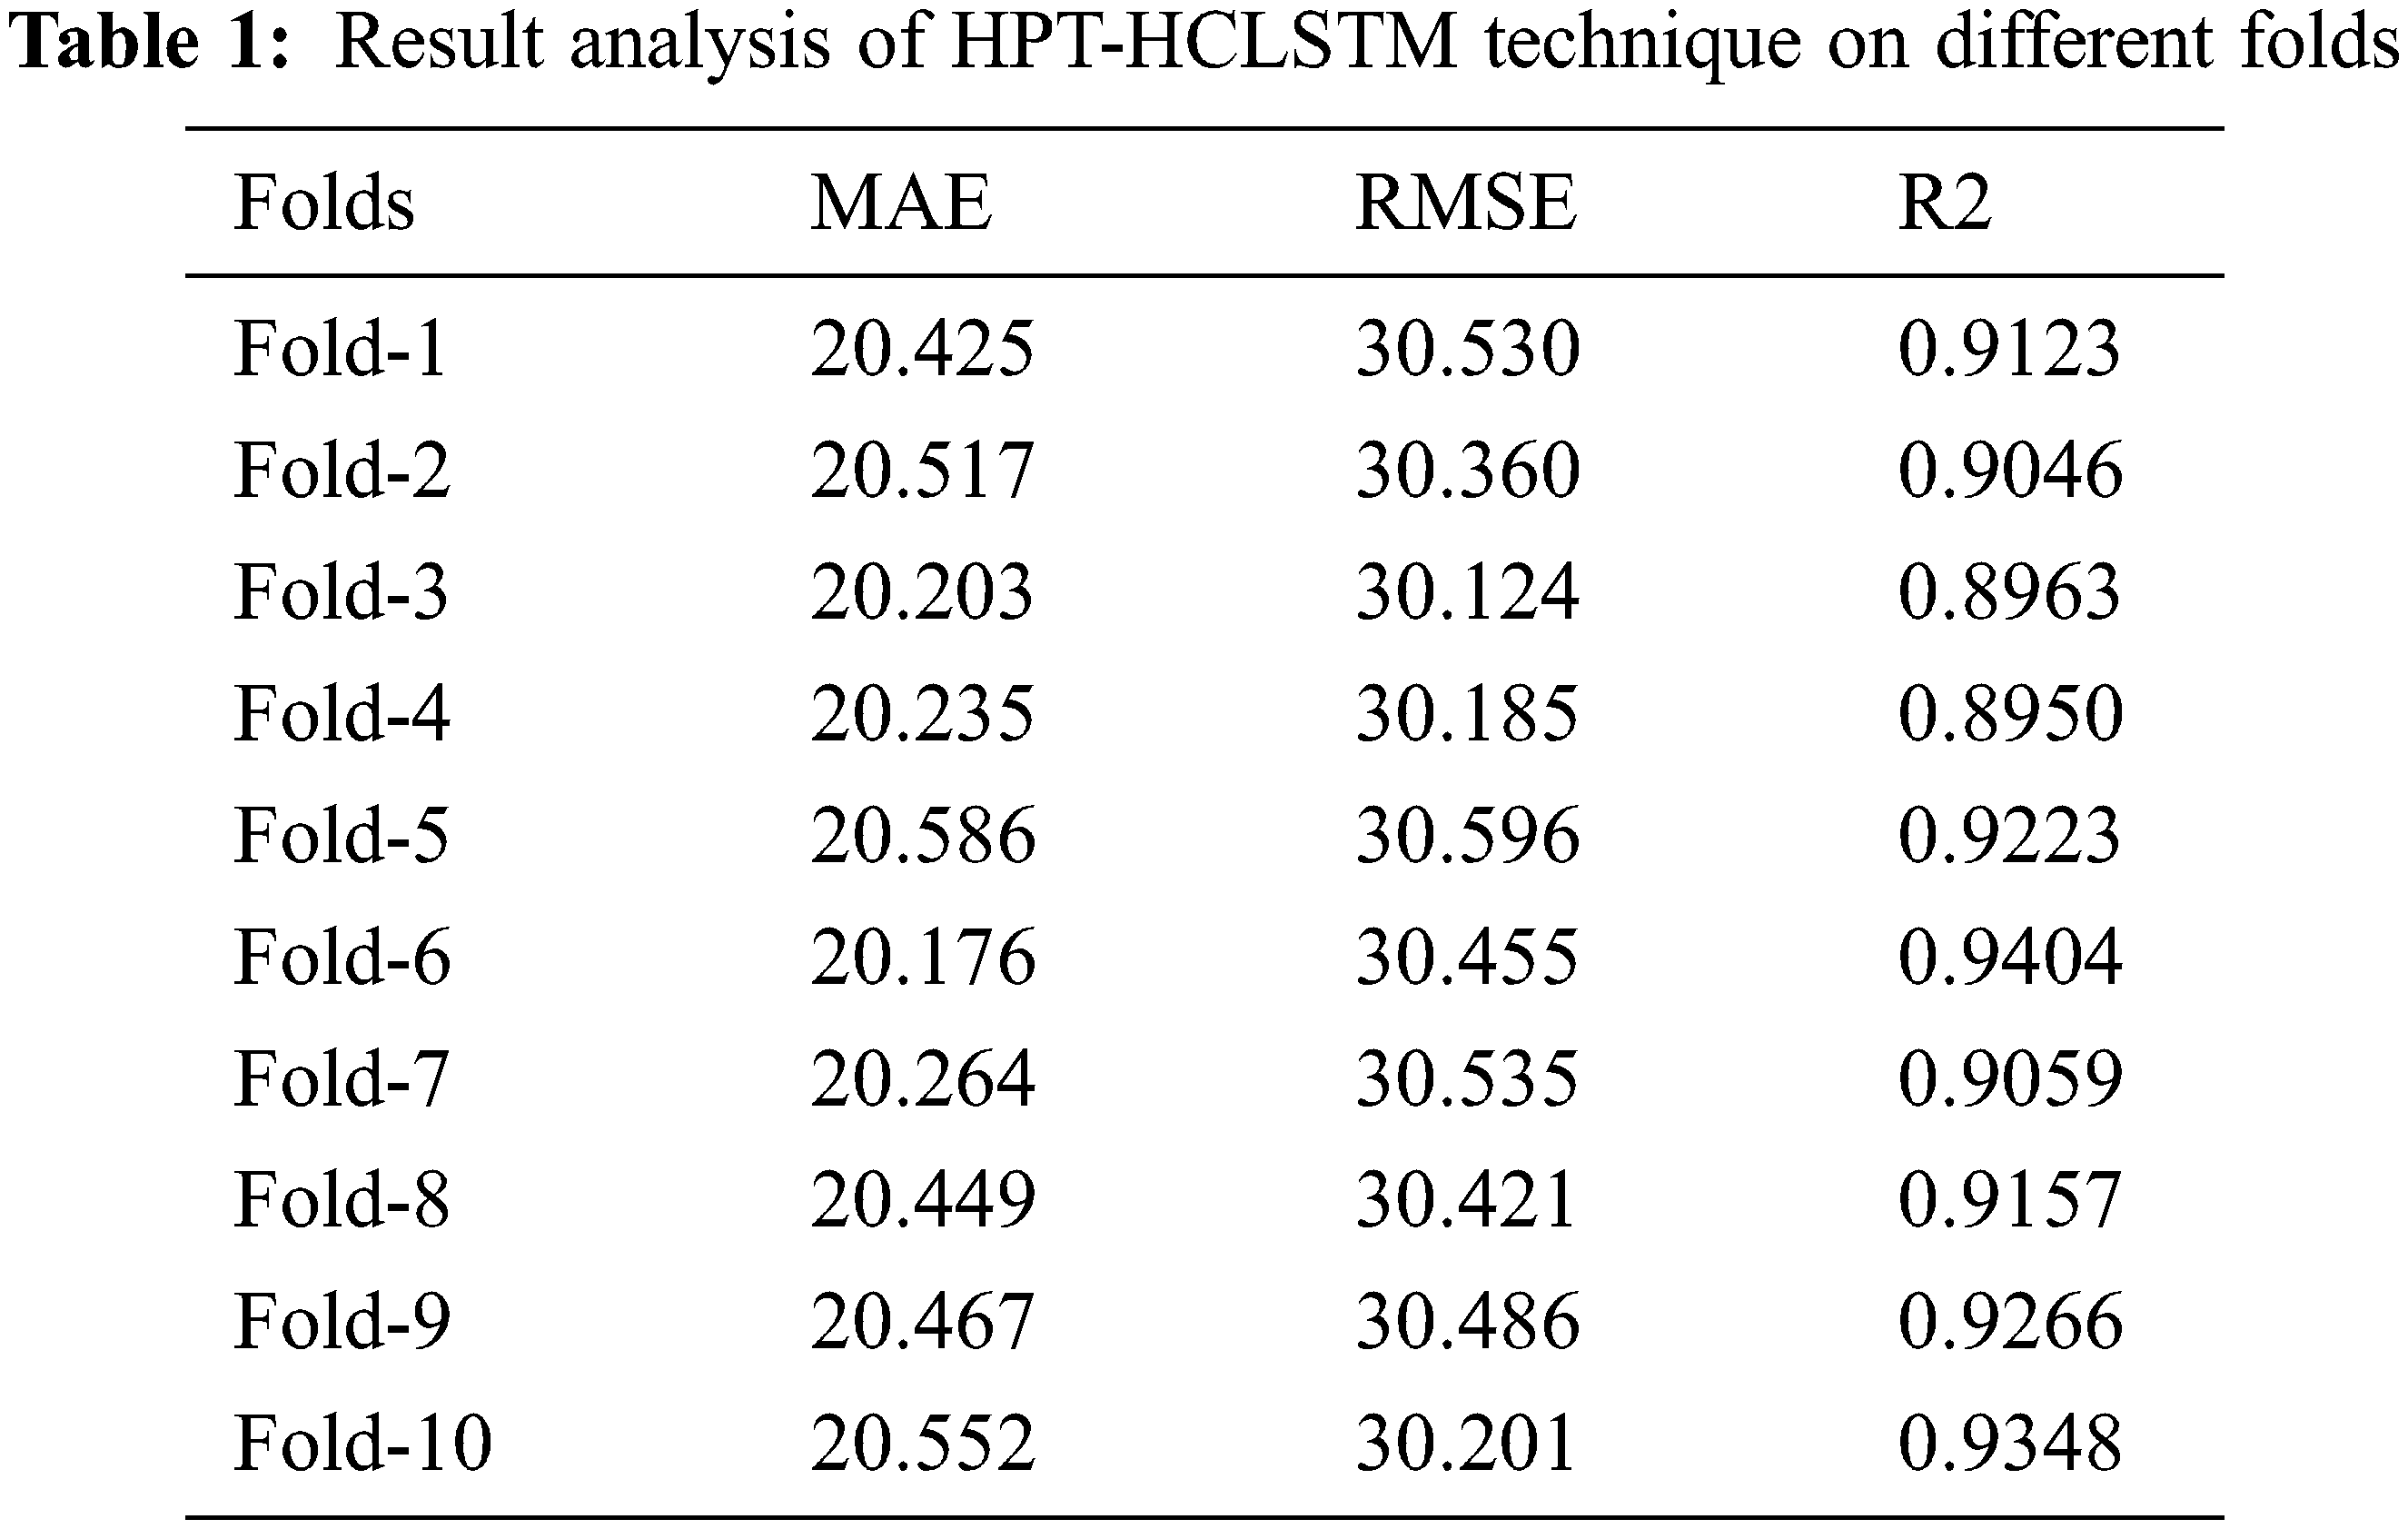
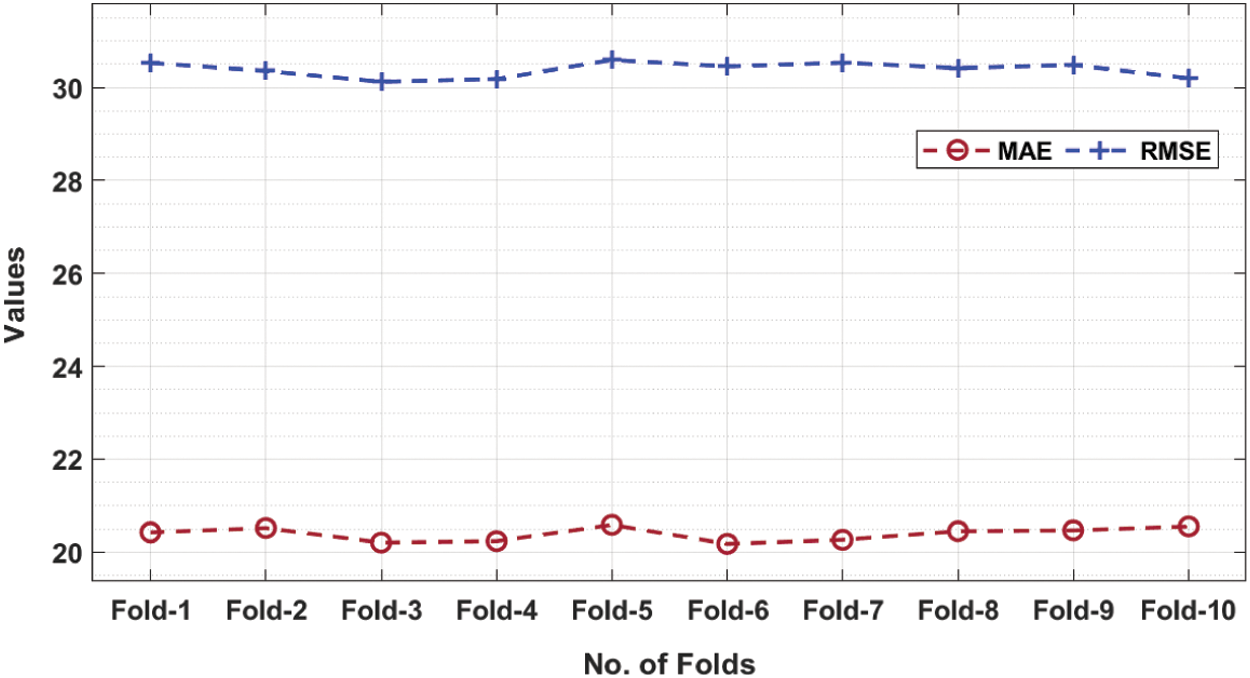
Figure 3: MAE and RMSE analysis of HPT-HCLSTM technique under ten folds
The R2 analysis of the HPT-HCLSTM technique under different folds is provided in Fig. 4. The figure portrayed that the HPT-HCLSTM technique has resulted in improved performance with the maximum R2 values. For instance, with fold-1, the HPT-HCLSTM technique has gained R2 of 0.9123. Similarly, with fold-4, the HPT-HCLSTM method has obtained R2 of 0.8950. Simultaneously, with fold-6, the HPT-HCLSTM system has achieved R2 of 0.9404. Concurrently, with fold-8, the HPT-HCLSTM technique has reached R2 of 0.9157. At last, with fold-10, the HPT-HCLSTM algorithm has attained R2 of 0.9348.
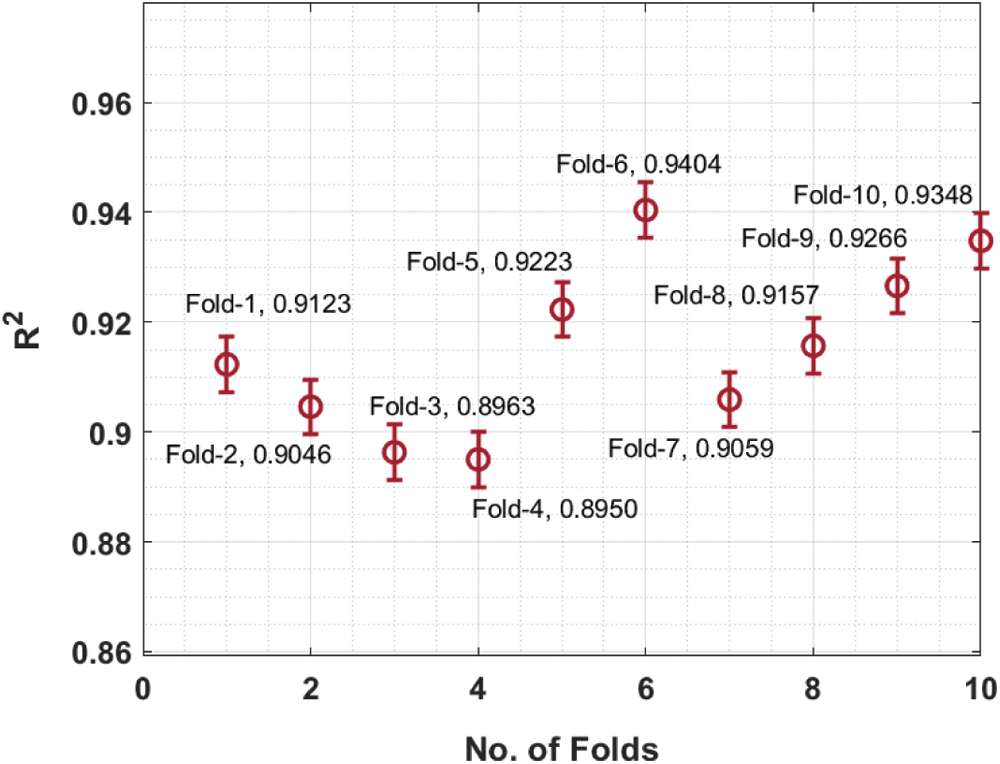
Figure 4: R2 analysis of HPT-HCLSTM technique under ten folds
Fig. 5 shows the predictive results analysis of the HPT-HCLSTM technique. The figure has shown that the HPT-HCLSTM technique has obtained only minor differences between the actual and predicted stock market prices.
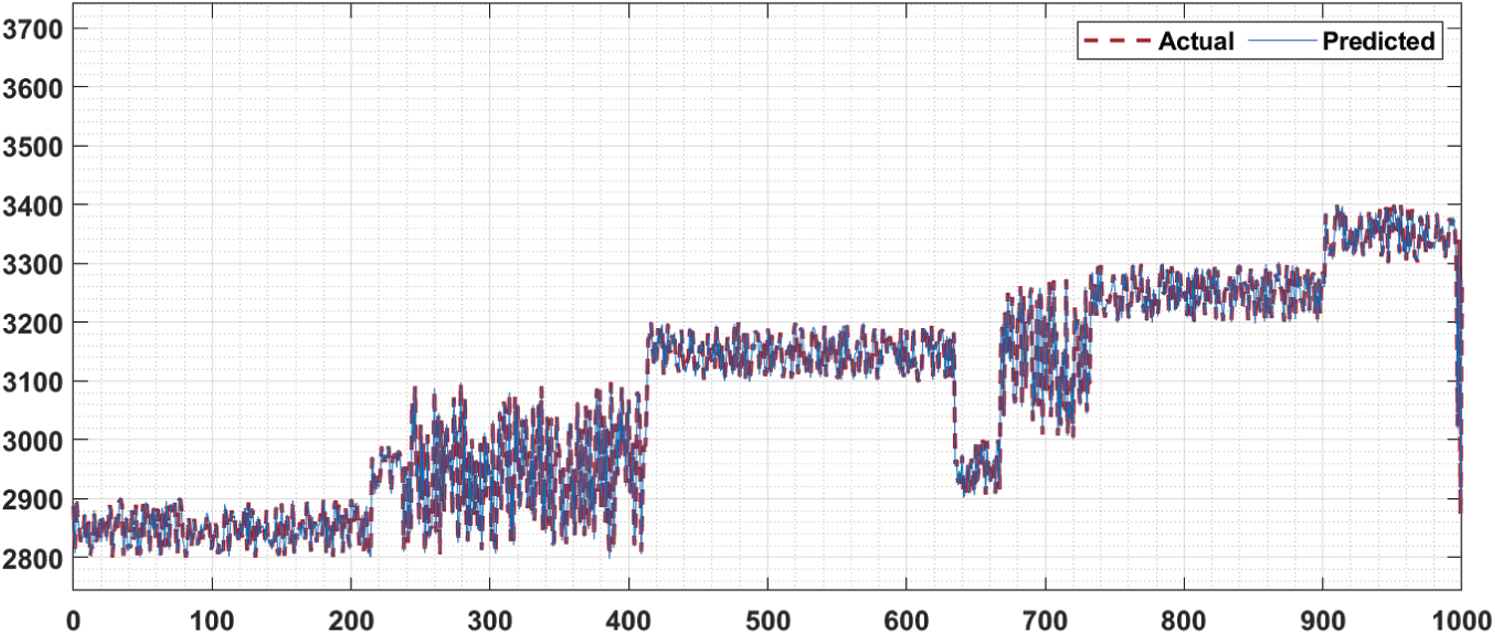
Figure 5: Predictive analysis of HPT-HCLSTM model
In order to showcase the better performance of the HPT-HCLSTM technique, a comprehensive comparative analysis is made in Tab. 2.
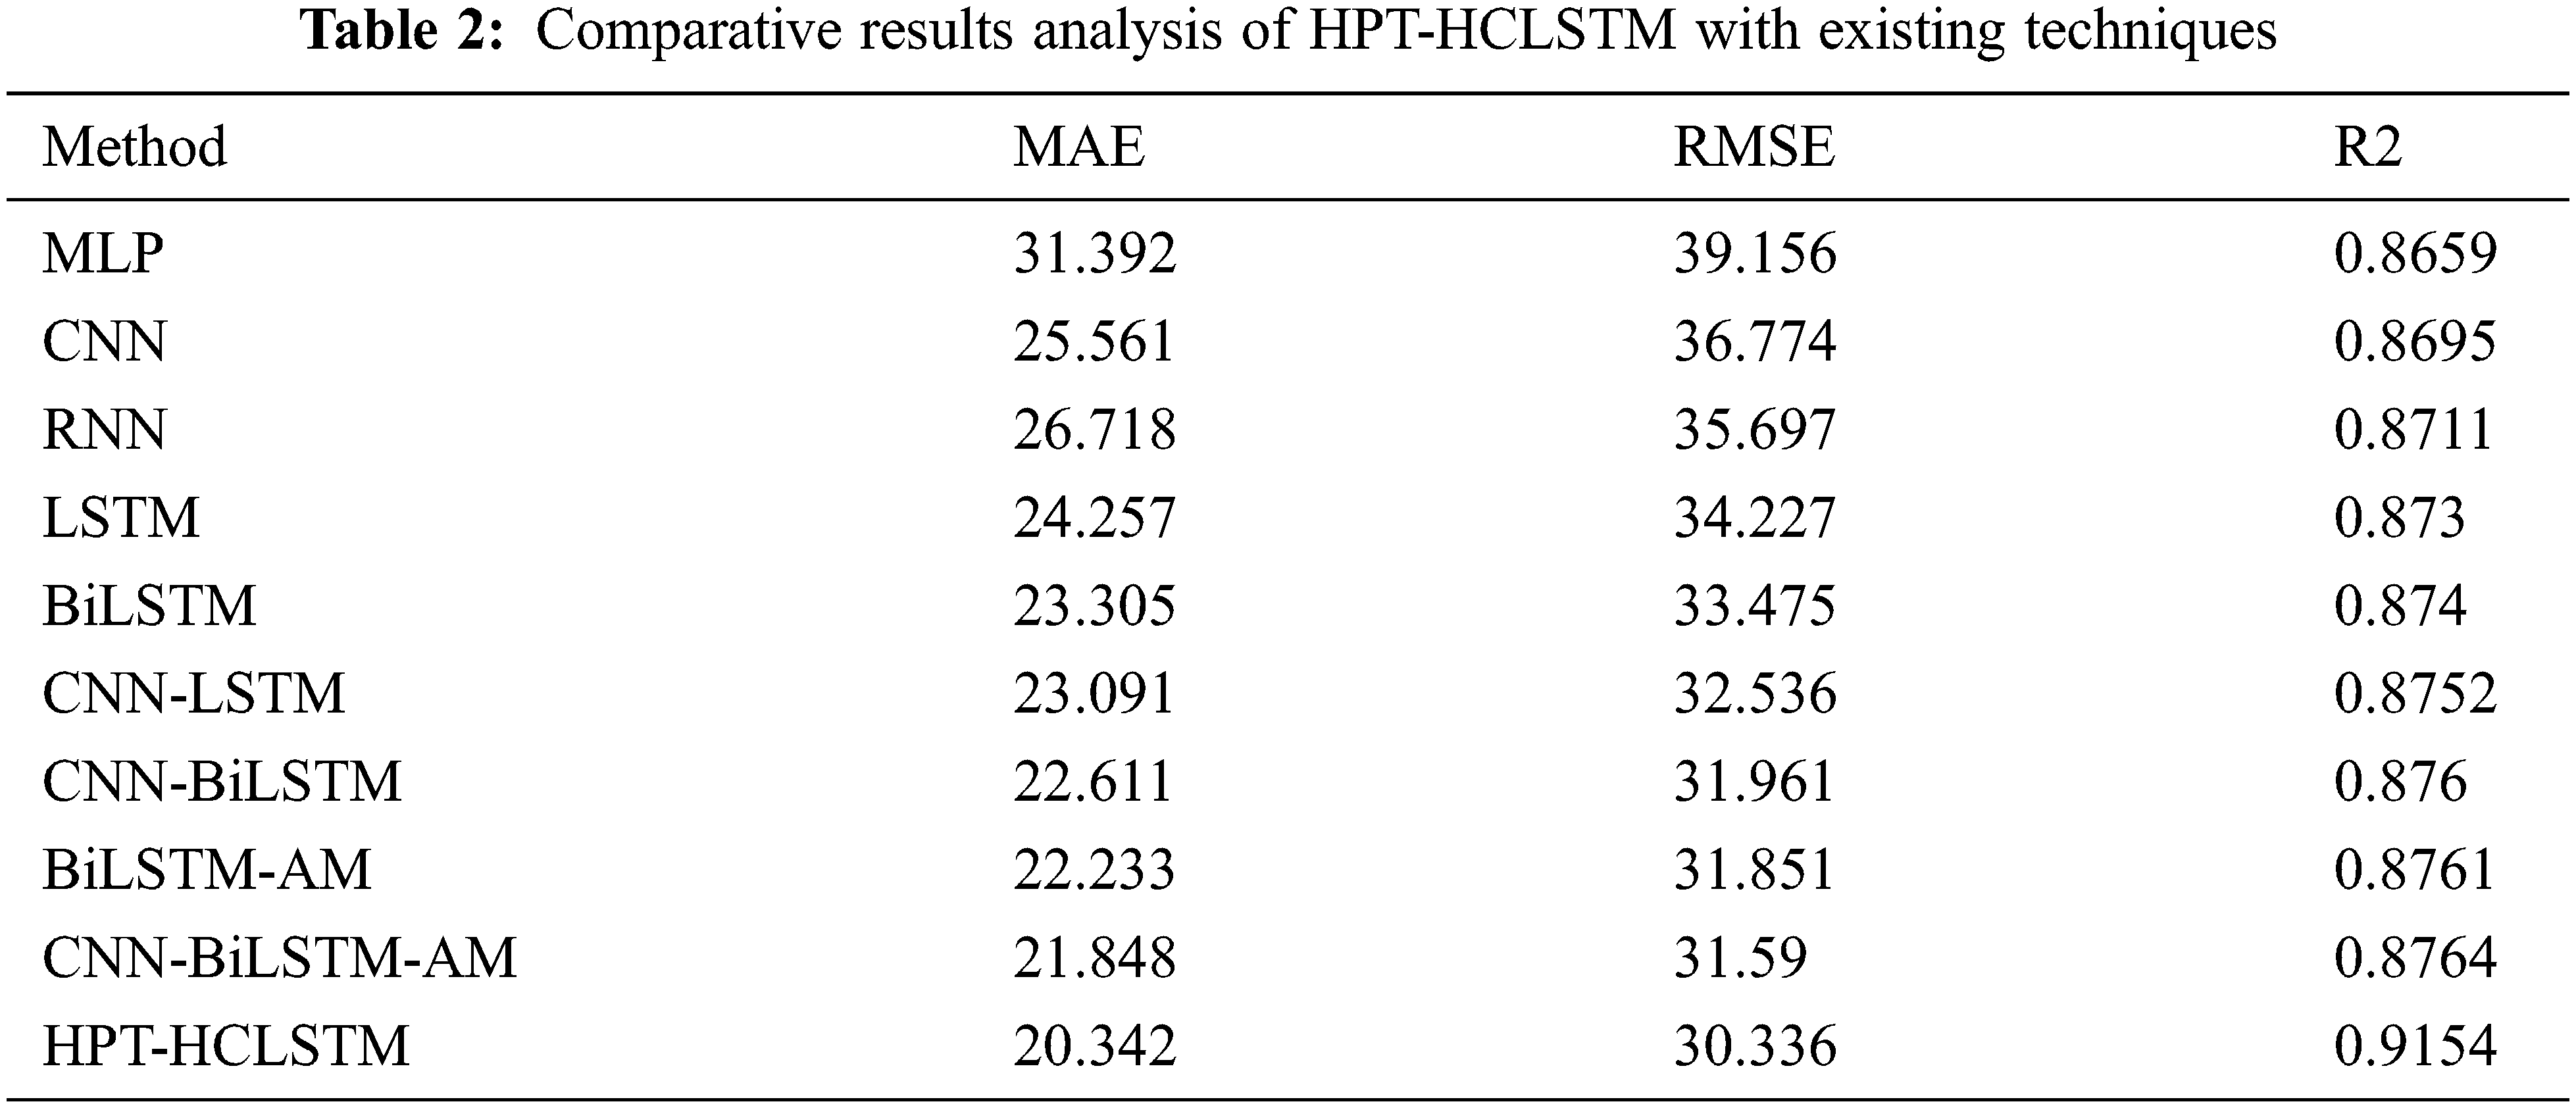
The MAE analysis of the HPT-HCLSTM technique with existing ones takes place in Fig. 6. The results signified that the MLP model has offered ineffective outcomes with the maximum MAE of 31.392. At the same time, the RNN, CNN, LSTM, BiLSTM, CNN-LSTM, and CNN-BiLSTM techniques have obtained moderately closer MAE values. Followed by, the BiLSTM-AM and CNN-BiLSTM-AM techniques have resulted in somewhat reduced MAE of 22.333 and 21.848 respectively. However, the proposed HPT-HCLSTM technique has accomplished improved outcomes with the lower MAE of 20.342. On the other hand, the RMSE analysis of the HPT-HCLSTM approach with existing ones showed that the MLP manner has accessible ineffective outcomes with the maximal RMSE of 39.156. Simultaneously, the RNN, CNN, LSTM, BiLSTM, CNN-LSTM, and CNN-BiLSTM systems have gained moderately closer RMSE values. In addition, the BiLSTM-AM and CNN-BiLSTM-AM methodologies have resulted in somewhat reduced RMSE of 31.851 and 31.59 respectively. Finally, the proposed HPT-HCLSTM algorithm has accomplished improved outcomes with a minimum RMSE of 30.336.
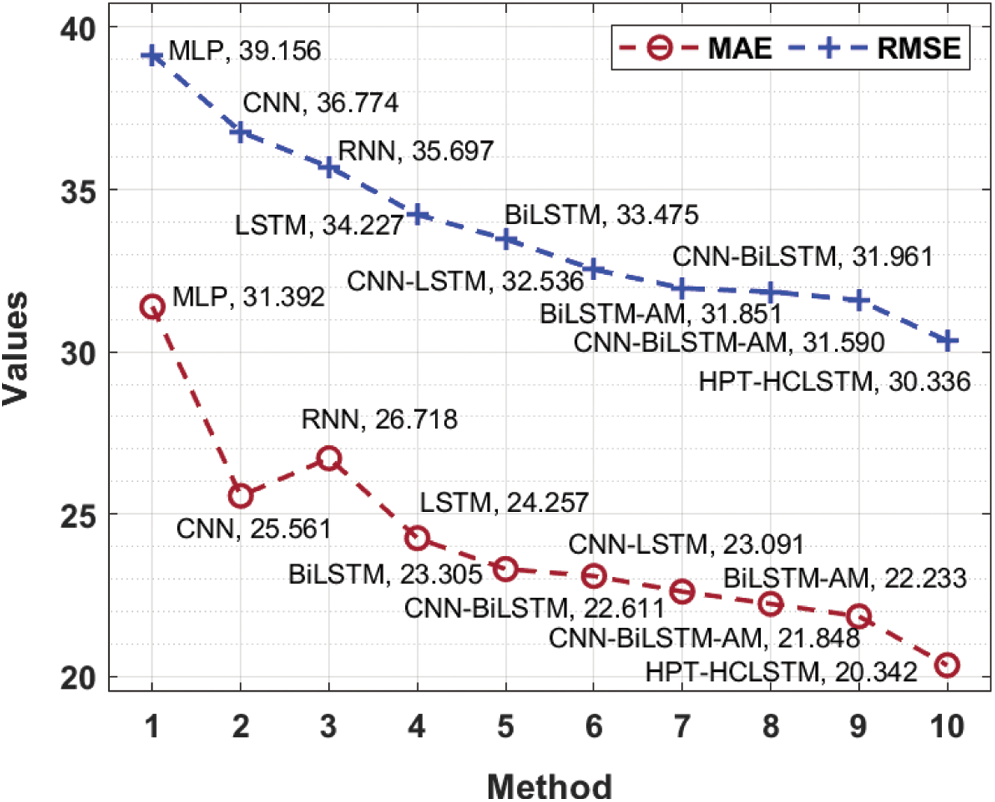
Figure 6: Comparative MAE and RMSE analysis of HPT-HCLSTM with existing techniques
Finally, the comparative R2 analysis of the HPT-HCLSTM technique with existing methods is provided in Fig. 7. The figure revealed that the HPT-HCLSTM technique has showcased better performance with the increased R2 value of 0.9154. By looking into the above mentioned tables and figures, it is evident that the HPT-HCLSTM technique is found to be a proper tool for forecasting stock prices.
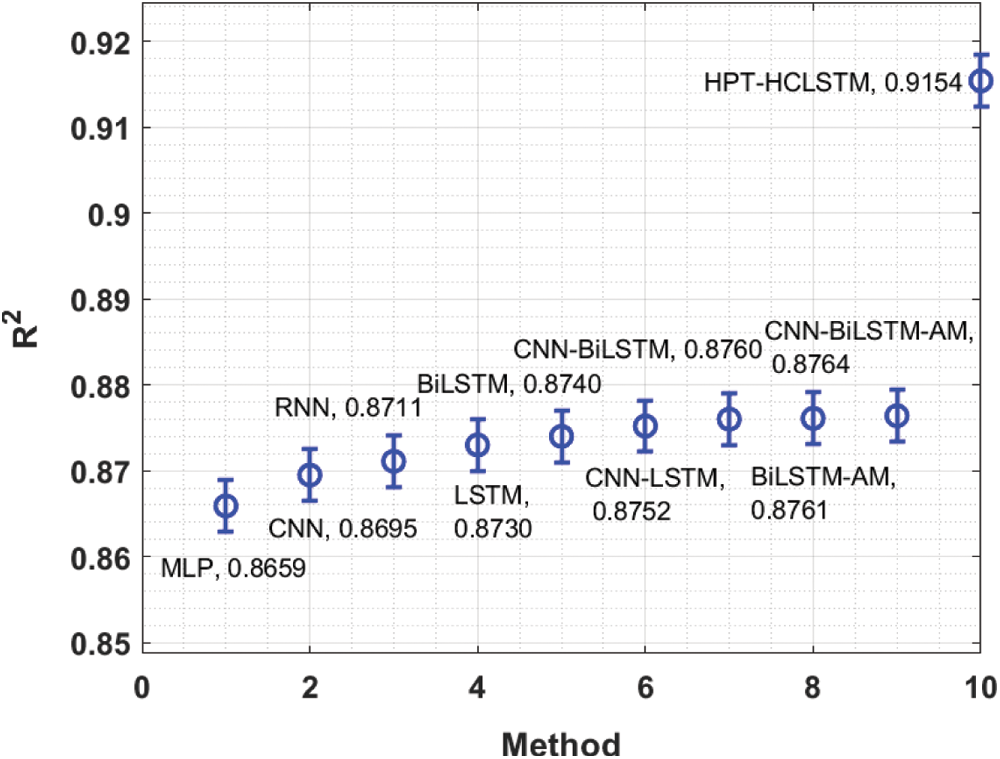
Figure 7: Comparative R2 analysis of HPT-HCLSTM with existing techniques
In this study, a new HPT-HCLSTM technique is derived to forecast the stock prices accurately. The design of HPT-HCLSTM technique involves three stages of operations namely pre-processing, HCLSTM based prediction, and TLBO based hyperparameter optimization. In addition, the TLBO algorithm effectually adjusts the hyperparameters involved in the HCLSTM model and it results in improved prediction outcomes. For examining the improved performance of the HPT-HCLSTM technique, a comprehensive simulation analysis is made and the results are inspected under varying aspects. The resultant outcome ensured the better performance of the HPT-HCLSTM technique over the other techniques in terms of several performance measures. In future, the feature selection techniques can be incorporated to choose the proper influencing factors for enhanced prediction outcomes. Furthermore, the RMSE of the BiLSTM-AM and CNN-BiLSTM-AM techniques was lowered to 31.851 and 31.59, respectively, by using the BiLSTM-AM and CNN-BiLSTM-AM approaches. Finally, with a minimal RMSE of 30.336, the proposed HPT-HCLSTM method produced better results. Features selection strategies may be used in the future to select the most appropriate influencing elements, resulting in better predictions.
Funding Statement: The authors received no specific funding for this study.
Conflicts of Interest: The authors declare that they have no conflicts of interest to report regarding the present study.
1. C. C. Emioma and S. O. Edeki, “Stock price prediction using machine learning on least-squares linear regression basis,” Journal of Physics: Conference Series, vol. 1734, no. 1, pp. 012058, 2021. [Google Scholar]
2. E. S. Madhan, S. Neelakandan and R. Annamalai, “A novel approach for vehicle type classification and speed prediction using deep learning,” Journal of Computational and Theoretical Nano Science, vol. 17, no. 5, pp. 2237–2242, 2020. [Google Scholar]
3. S. Subha and S. B. Priya, “A model for enhancing the structure and strategy in an e-learning environment,” in Int. Conf. on Computing and Communications Technologies, Chennai, India, IEEE, pp. 141–148, 2019. [Google Scholar]
4. S. Neelakandan, “Social media network owings to disruptions for effective learning,” Procedia Computer Science, vol. 172, no. 5, pp. 145–151, 2020. [Google Scholar]
5. R. G. Ahangar, M. Yahyazadehfar and H. Pournaghshband, “The comparison of methods artificial neural network with linear regression using specific variables for prediction stock price in Tehran stock exchange,” International Journal of Computer Science and Information Security, vol. 7, no. 2, pp. 38–46, 2010. [Google Scholar]
6. S. Neelakandan and D. Paulraj, “An automated exploring and learning model for data prediction using balanced ca-svm,” Journal of Ambient Intelligence and Humanized Computing, vol. 12, no. 6, pp. 4979–4990, 2021. [Google Scholar]
7. P. Mohan, M. Sundaram, S. Satpathy and S. Das, “An efficient technique for cloud storage using secured de-duplication algorithm,” Journal of Intelligent & Fuzzy Systems, vol. 41, no. 2, pp. 2969–2980, 2021. [Google Scholar]
8. S. Sambit, S. Debbarma, S. C. Sengupta and K. D. Bhattacaryya Bidyut, “Design a fpga, fuzzy based, insolent method for prediction of multi-diseases in rural area,” Journal of Intelligent & Fuzzy Systems, vol. 37, no. 5, pp. 7039–7046, 2019. [Google Scholar]
9. S. Mehtab and J. Sen, “A time series analysis-based stock price prediction using machine learning and deep learning models,” International Journal of Business Forecasting and Marketing Intelligence, vol. 6, no. 4, pp. 272–335, 2020. [Google Scholar]
10. P. Subbulakshmi, “Mitigating eavesdropping by using fuzzy based MDPOP-Q learning approach and multilevel stackelberg game theoretic approach in wireless CRN,” Cognitive Systems Research, vol. 52, no. 2, pp. 853–861, 2018. [Google Scholar]
11. M. Vijh, D. Chandola, V. A. Tikkiwal and A. Kumar, “Stock closing price prediction using machine learning techniques,” Procedia Computer Science, vol. 167, no. 2, pp. 599–606, 2020. [Google Scholar]
12. C. Ramalingam, “An efficient applications cloud interoperability framework using i-anfis,” Symmetry, vol. 13, no. 2, pp. 268, 2021. [Google Scholar]
13. J. Zhang, L. Li and W. Chen, “Predicting stock price using two-stage machine learning techniques,” Computational Economics, vol. 57, no. 4, pp. 1237–1261, 2021. [Google Scholar]
14. H. Rezaei, H. Faaljou and G. Mansourfar, “Stock price prediction using deep learning and frequency decomposition,” Expert Systems with Applications, vol. 169, no. 2, pp. 114332, 2021. [Google Scholar]
15. M. Abe and K. Nakagawa, “Cross-sectional stock price prediction using deep learning for actual investment management,” in Proc. of the 2020 Asia Service Sciences and Software Engineering Conf., Nagoya Japan, May 13–15, pp. 9–15, 2020. [Google Scholar]
16. E. K. Ampomah, Z. Qin and G. Nyame, “Evaluation of tree-based ensemble machine learning models in predicting stock price direction of movement,” Information, vol. 11, no. 6, pp. 332, 2020. [Google Scholar]
17. P. Yu and X. Yan, “Stock price prediction based on deep neural networks,” Neural Computing and Applications, vol. 32, no. 6, pp. 1609–1628, 2020. [Google Scholar]
18. W. Lu, J. Li, J. Wang and L. Qin, “A CNN-BiLSTM-AM method for stock price prediction,” Neural Computing and Applications, vol. 33, no. 10, pp. 4741–4753, 2021. [Google Scholar]
19. X. Zhou, J. Feng and Y. Li, “Non-intrusive load decomposition based on CNN–LSTM hybrid deep learning model,” Energy Reports, vol. 7, no. 12, pp. 5762–5771, 2021. [Google Scholar]
20. S. Srivastava and S. Lessmann, “A comparative study of LSTM neural networks in forecasting day-ahead global horizontal irradiance with satellite data,” Solar Energy, vol. 162, no. 2, pp. 232–247, 2018. [Google Scholar]
21. R. V. Rao, V. J. Savsani and D. P. Vakharia, “Teaching–learning-based optimization: A novel method for constrained mechanical design optimization problems,” Computer Aided Design, vol. 43, no. 3, pp. 303–315, 2011. [Google Scholar]
22. A. Kaveh, M. Kamalinejad, K. B. Hamedani. and H. Arzani, “Quantum teaching-learning-based optimization algorithm for sizing optimization of skeletal structures with discrete variables,” in Structures, vol. 32, pp. 1798–1819, 2021. [Google Scholar]
 | This work is licensed under a Creative Commons Attribution 4.0 International License, which permits unrestricted use, distribution, and reproduction in any medium, provided the original work is properly cited. |