DOI:10.32604/iasc.2022.024786
| Intelligent Automation & Soft Computing DOI:10.32604/iasc.2022.024786 | |
| Article |
Classification of Liver Tumors from Computed Tomography Using NRSVM
1Department of Computer Science and Engineering, P. S. R. Engineering College, Sivakasi, Tamil Nadu, 626123, India
2COMBA R&D Laboratory, Faculty of Engineering, Universidad Santiago de Cali, 76001, Cali, Colombia
3Master of Computer Applications, M S Ramaiah Institute of Technology, Bangalore, 560054, India
4Department of Computer Science & Information Technology, Koneru Lakshmaiah Education Foundation, Vaddeswaram, A.P, India
5Department of Computer Science and Engineering, PSN College of Engineering and Technology, Tirunelveli, 627152, Tamil Nadu, India
*Corresponding Author: S. Priyadarsini. Email: priyadarshini@psr.edu.in
Received: 31 October 2021; Accepted: 20 December 2021
Abstract: A classification system is used for Benign Tumors (BT) and Malignant Tumors (MT) in the abdominal liver. Computed Tomography (CT) images based on enhanced RGS is proposed. Diagnosis of liver diseases based on observation using liver CT images is essential for surgery and treatment planning. Identifying the progression of cancerous regions and Classification into Benign Tumors and Malignant Tumors are essential for treating liver diseases. The manual process is time-consuming and leads to intra and inter-observer variability. Hence, an automatic method based on enhanced region growing is proposed for the Classification of Liver Tumors (LT). To enhance the Liver Region (LR) from the surrounding tissues, Non-Linear Mapping (NLP) is used. Region Growing Segmentation (RGS) is employed to segment the LR, and Expectation-Maximization (EM) algorithm is used to segment the region of interest. Grey Level Co-occurrence Matrix (GLCM) features are extracted from the tumor region, and Nonlinear Random Support Vector Machine (NRSVM) classification is performed to classify the Benign Tumors and Malignant Tumors. The proposed method is tested on a database of medical images collected from Med all Diagnostic Research Centre and attained an accuracy of 96%. The proposed method is beneficial for better liver tumor diagnosis in an optimized method by the medical expert.
Keywords: Liver tumor; region growing; grey level co-occurrence matrix; expectation maximization; computed tomography; non-linear random support vector machine
The liver tumor is the most commonly occurring disease, which causes severe ailments and even death. It is necessary to diagnose the LT earlier since it will increase patients’ survival rate. Hence, there is a necessity for the automatic detection of LT. Multiple cell varieties that include the liver endothelial cell, Kupffer cell, the stellate fat-storing cell, and hepatocyte together form the liver. Hepatocytes gives 80% of their contribution to the liver. There is existence of various imaging techniques like Positron Emission Tomography, Computed Tomography, and Magnetic Resonance Imaging (MRI). An instance of a non-invasive imaging technique is CT, and it is the most commonly used method for analysis of soft tissue anatomy of the liver since signal to noise ratio, and better spatial resolution are contained in CT images. There are two types of tumours, viz., Benign Tumors (BT) and Malignant Tumors (MT).
BT, like Hemangiomas, hepatic adenoma and focal nodular hyperplasia, do not spread to other organs, and MT like hepatocellular carcinoma, cholangiocarcinoma, and hepatoblastoma spread to neighbouring organs. The application that defines computer programs to aid radiologists in analyzing the medical images to estimate the likelihood of derives feature from the image that represents the progression of the disease, for example, BT and MT, are called Computer-Aided Diagnosis (CAD). Many research works have been proposed to achieve the CAD model to segment both the liver and tumor regions from the given image, which have been an important and demanding task in the recent trends. However, they have the following perspectives:
• The process of segmenting the liver and accurately spotting the tumor is challenging and demanding due to the liver image's diversity of shape, texture, and intensity.
• The intensity similarities of the neighbouring organs of the liver create difficulties during LTS.
• It increased volumetric overlap error.
• It increased time consumption during Classification.
• The significant drawbacks of manual segmentation are many image slices, intensive time, lack of results, and creating a distinct dataset, which is a highly complex process.
These kinds of research problems are taken to be solved with the help of the proposed work. The following are the contributions of this proposed work:
• The CAD model is developed using the enhanced RGS method and Contrast Enhancement (CE) to highlight the LRs.
• This work follows the CAD model and utilizes an efficient image processing technique to precisely locate the liver and the tumor without user interaction.
• So, misclassification can be avoided, and the computational complexity can be reduced by avoiding more complex models.
This article is organized in the following manner: Section 2, reviewing existing techniques and algorithms related to Liver Tumor Segmentation (LTS) and Classification. It also investigates the advantages and disadvantages of each work and the reason for developing the proposed work. Section 3 presents a detailed description of the proposed LT classification system. Section 4 discusses the proposed technique’s results and the comparative analysis between the existing and the proposed algorithms based on different performance measures. Section 5 concludes the thesis with its research objectives and attainments, and it also provides some enhancements that may be implemented in future.
The proposed system has been designed with the help of vast literature reviews. The works of literature provide significant technical contributions and limitations of related research works. It avoids the necessity to take the needle biopsy, which is an invasive technique. LTS in CT Scans is deployed using the Modified SegNet technique, a Deep Learning technique for liver CT segmentation and Classification [1]. The imaging, clinical and laboratory tests like MRI, CT, and ultrasound scans are used to diagnose primary hepatic malignancy [2].
They have developed a deformable model to segment the tumor region from CT liver images. Here, a Multilayer Perceptron (MLP) model extracted the input patches from the training data. The mean intensity of the liver was estimated by using the statistical shape model. In this work, both the synthetic and real-time datasets were applied to evaluate the performance. The measures used in this analysis were dice, RMSE, Mean Absolute Distance (MAD), MAX absolute distance, sensitivity, specificity, and average accuracy. The suggested technique reduced the intra-class variability during Classification. But it has difficulty in stretching an elongated tumor, as it requires maintaining a constant vertex density, local readjustment and is not suitable for unconventional tumors [3].
The first step in the CAD system for classifying BT and MT from liver CT images is to segment the LR from CT images [4]. LTS is a difficult task because the organs adjacent to the liver, like the stomach, spleen, pancreas and kidney, have a similar intensity to the liver [5–7]. The extraction of Region of Interest (ROI) from the LR is the second step. By reducing the number of pixels, ROI minimizes the computer’s processing time to be considered. The tumour affected area and surrounding pixels are selected as the ROI. The third step is feature extraction from the region of interest. Medical images have the characteristics of rough and uneven pixel intensities, but they have patterns and consistency. Hence, texture analysis is best suited for feature extraction in the detection of anomalies. The final step is the texture feature-based classification system for classifying the BT and MT types of LT.
Statistically, MT has a coarser-grained structure, while BT has a more homogeneous texture. The visibility of texture variation in these two kinds of disease images is not visible to human eyes. Besides, the MT has greater values for intensity and contrast features when compared to BT. The automatic CAD system is used for classifying BT and MT. The stages in the method are automatic tumor segmentation using alternative Fuzzy C-Means; texture feature extraction using features of coefficient statistics, contourlet coefficient statistics; and tumor characterization using Probabilistic Neural Network (PNN) classifier [8].
The Fatty and Cirrhosis liver diseases are differentiated from Computed Tomography Images with the help of Back Propagation Neural Network (BPN), Linear Vector Quantization (LVQ) and PNN. Using the operations like threshold and morphology, LRs are classified. The extraction of statistical texture is done using biorthogonal wavelet transform from the LRs. The optimization of the features extraction is performed using Genetic Algorithm (GA) and Sequential Forward Floating Search (SFFS) [9].
The Classification for normal and abnormal liver images with cancer from which Local Binary Pattern (LBP) images for the ROI liver images of 8 × 8 non-overlapping segments are obtained. Further, for features texture extraction and selection of accurate features, the Legendre moments and SFFS algorithm are applied, respectively. At last, the nearest neighbourhood MIN distance rule and Euclidean distance classifier are used to classify the images [10]. CAD method is deployed for Classification of liver images with hepatic tumors in which the RGS algorithm is used for Liver segmentation from CT images. Then Discrete Wavelet Packet Decomposition (DWPD) is employed to transform the extracted CT images into a digital signal. Then REDUCT sets of rough sets are used to reduce the attributes and perform Classification [11].
The CAD system is used to classify the BT and MT from CT images. For extracting the texture features like correlation, contrast, variance, entropy, homogeneity and variance, Grayscale Level Co-occurrence Matrix (GLCM) uses PNN to classify the liver diseases [12]. Generalized N-Dimensional Principle Component Analysis (GND-PCA) based Statistical Fractal models can select the features in the region of liver and Ant Colony Optimization-Support Vector Machine (ACO-SVM) for Classification of liver diseases [13]. The employed watershed transforms Support Vector Machine (SVM) classification into interactive LT segmentation from CT scans [14].
The GLCM texture features were extracted from the liver segmented ultrasound images. Fuzzy-SVM is used for the Classification of BT and MT [15]. The novel content-based image retrieval diagnoses LT on CT images. The Fourier descriptors can extract shape features, and MPEG-7 can extract edge histogram descriptors. The dimensionality of the feature vector is reduced by core component analysis. Finally, the cluster-based indexing accelerates the process of similarity matching to match the query image with the image contained in the database [16].
The diffused and focal liver diseases from ultrasound images are automatically classified from ultrasound medical images. The segmentation and Classification are used in Is contour segmentation and Artificial Neural Network (ANN) for disease classification.
Based on the literature survey, BT and MT are classified from liver CT images using a new CAD system proposed by the enhanced RGS. As denoted in the previous section, the existing systems are lacking in time and volumetric efficiencies. In addition, they have limited accuracy in LT detection. The proposed system takes these issues and provides optimal solutions [17–21].
3 Enhanced Region Growing with Non-Linear Mapping (NLM) based Liver Segmentation
In the first level of the proposed system, the LR is segmented from input liver CT images using the RGS method. Here, NLM is used as a CE operation to highlight the LR from the surrounding organs like the spleen, pancreas and kidney. Secondly, the ROI (tumour region) is segmented using the Expectation-MAX method. Thirdly, the extraction of features like homogeneity, entropy, contrast, correlation, variance etc., from the GLCM textures are done from ROI. Finally, the Classification of a BT and MT is done using the Nonlinear Random Support Vector Machine (NRSVM) classifier. The basics of the region growing algorithm, Gaussian Mixture Model Expectation-Maximization (GMM-EM), and CE enabled NLM, GLCM features, and NRSVM classifier are provided. The contributions of the article are: development of CAD model is developed using enhanced region growing method and CE to highlight the LRs. The block diagram of the method is illustrated in Fig. 1, and itis explained in the steps given below.
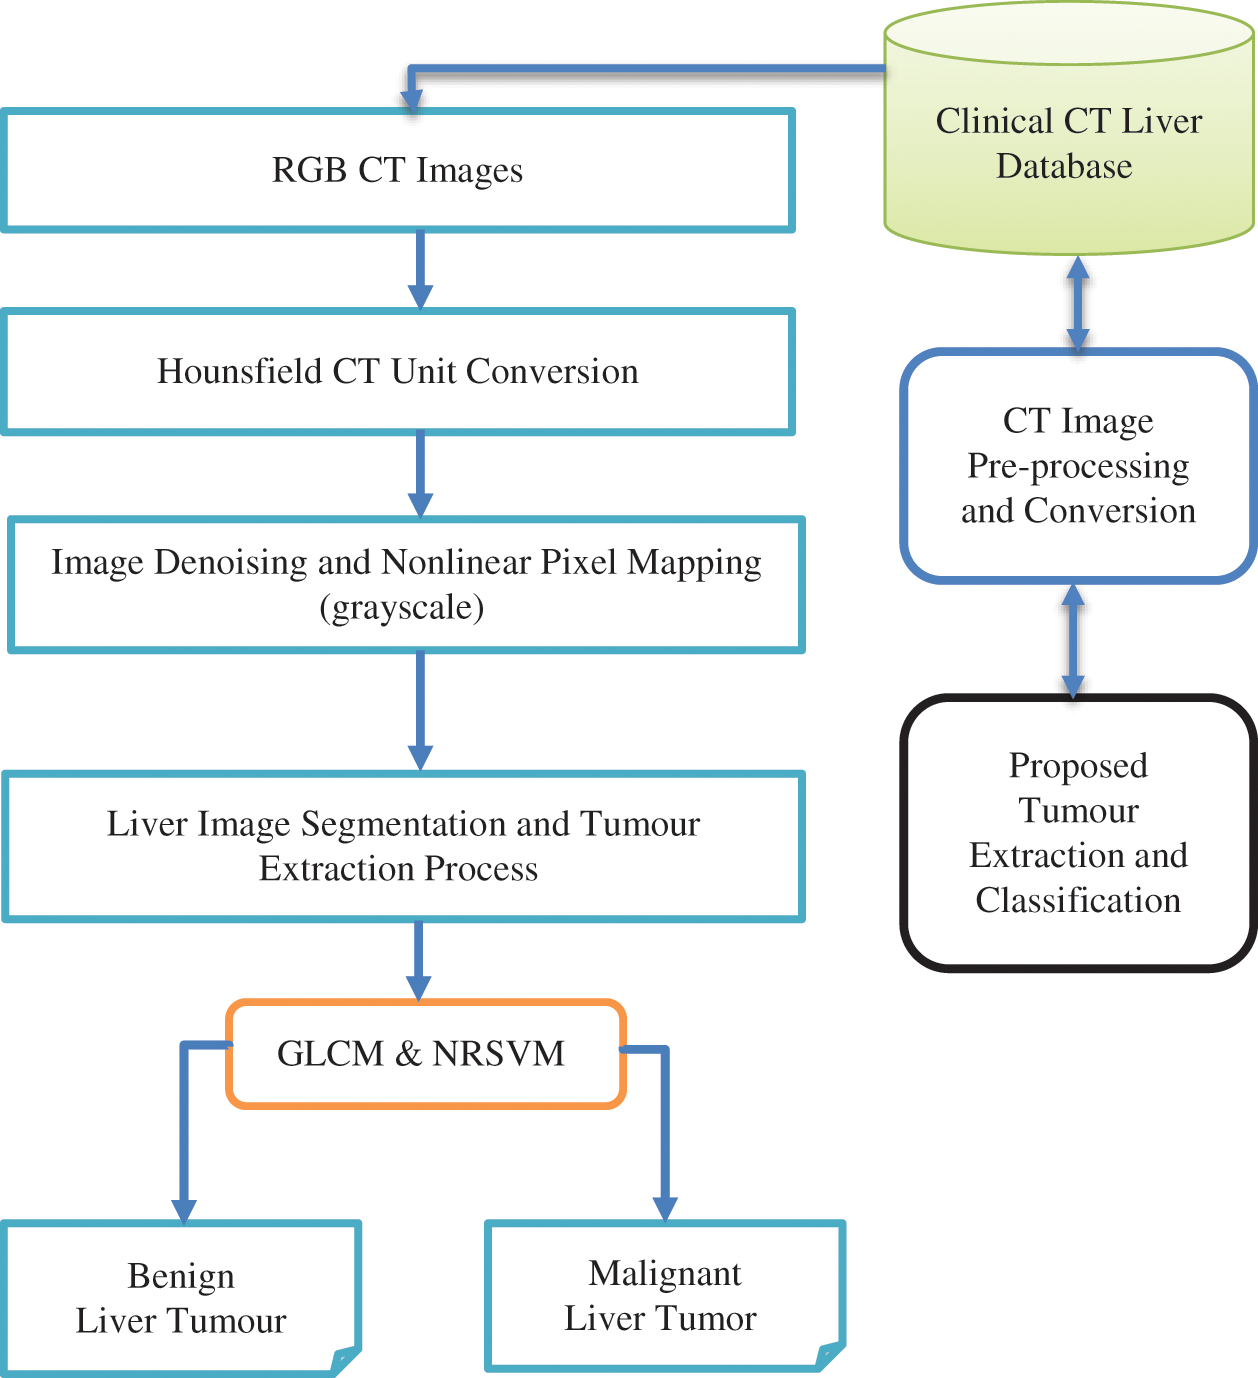
Figure 1: Proposed NRSVM methodology
3.1 Hounsfield Unit to Grayscale Conversion
The results of the X-Ray reconstruction algorithm represent the attenuation measure from the tissues for each pixel location in the image. These attenuation values are normalized to the HU before the generation of the final image, whose values lie in the range of [–1000 to 3000] HU. The HU values vary for different types of tissues: for soft tissues, they range between –300 to 100 HU and for bones, they have values above 1000. Based on the Hounsfield Units (HU), anatomical CT images have a typical grayscale range of 212 (4096 values). They are scaled down to a grayscale range of 212 (256 values) by a process called window and levelling. For the database used in the experiments, the window centre has a value of 40, and the window width is 400. Hence HU ranges [–160 to 240]. It is converted into the grayscale range of [0–255].
3.2 Image Denoising and Nonlinear Mapping
Noise exists in live CT images, and hence preprocessing is done before the segmentation operation. An anisotropic filter with suitable parameters is used to reduce noise in the segmentation and classification problem as it gives smoothing with the preservation of delicate structures, including tumors in the images. The NLM is used to enhance the LR of abdominal CT images from the surrounding regions. Sigmoid filters enhance the pixel values of a particular range and strongly attenuate the values that lie outside the desired range. The intensity mapping of the sigmoid filter is given by Eq. (1).
where the input pixel’s intensity is I, the output pixel’s intensity is I′, the minimum and maximum values of the output image are MIN and MAX, the input intensity range is α, and the intensity of the centered range is defined by β. After NLM, it is easier to distinguish the LR from the surrounding tissues, and the LR can be segmented efficiently.
3.3 Liver Segmentation Using Enhanced Region Growing
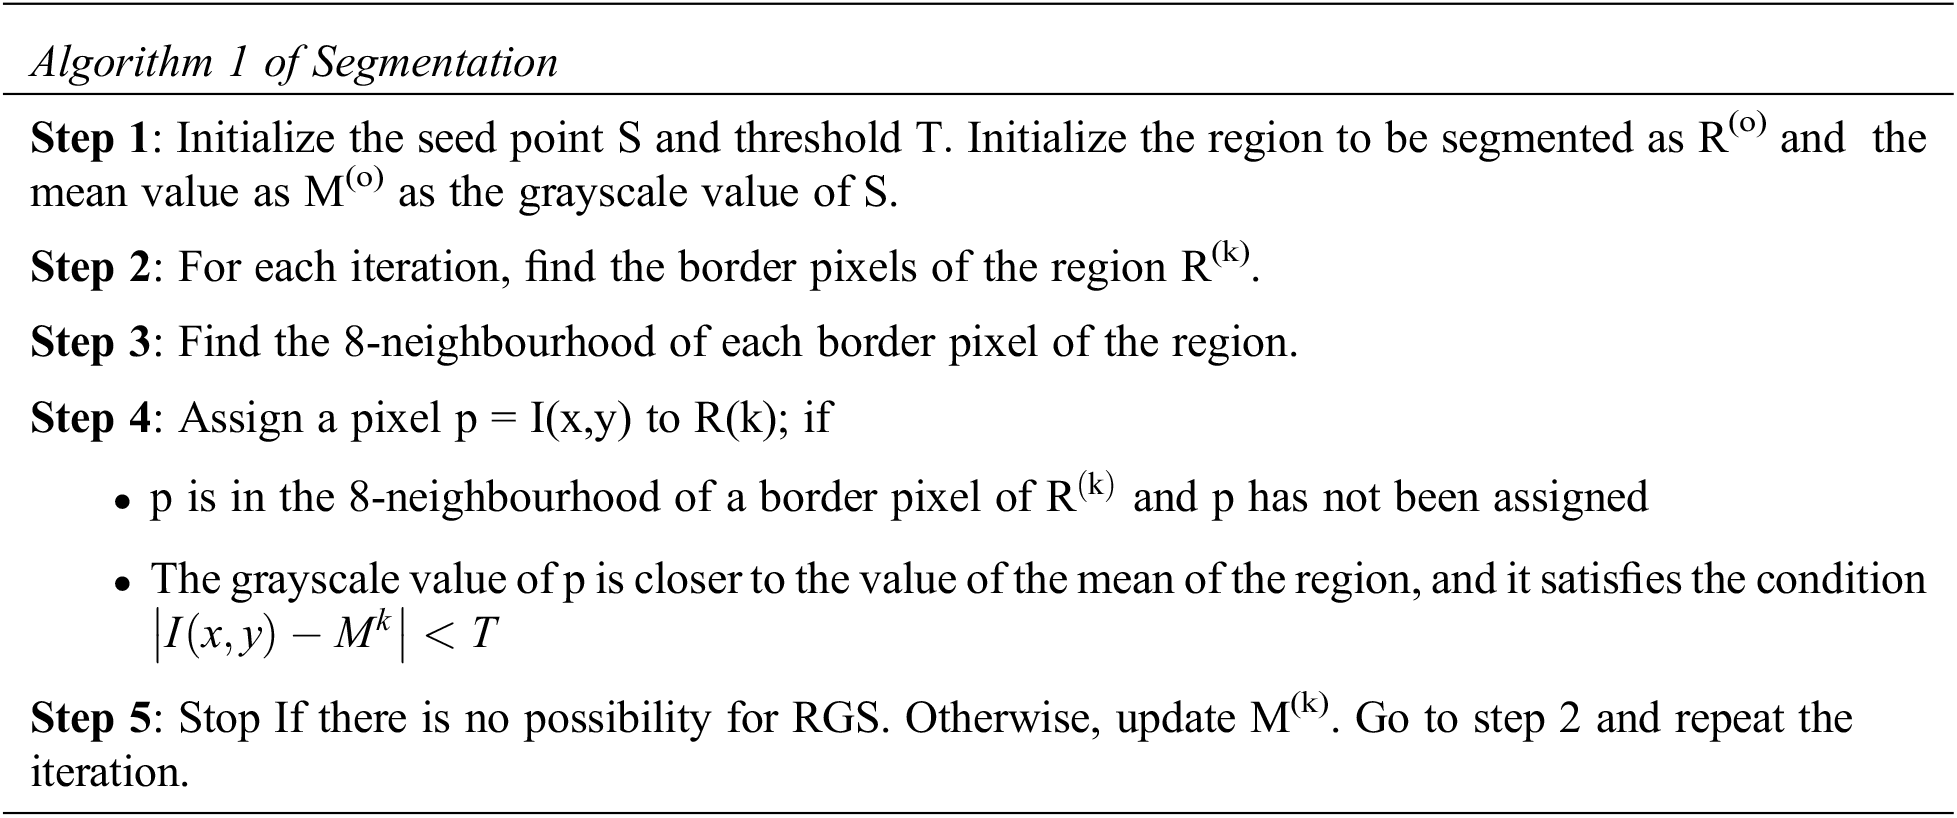
For the segmentation of the LR, the RGS algorithm is employed. First, K-Means segmentation is used to remove the unwanted bone regions of high grayscale levels, after which region growing is performed. For the RGS algorithm, selecting seed points is an important step and can be done manually/automatically. The improper selection of seed points may result in low segmentation accuracy. In the proposed method, the seed point for region growing of LR is made automatically. The LR is better visible in the middle slices of the volume of liver CT images, and hence these middle slices are used to construct the database. An algorithm to select the seed automatically that from a group of pixels to represent the LR, which has the MAX value, is employed. After liver segmentation, morphological post-processing operations including connected components and filling are done to enhance the LR. Enhanced RGS is a region-based segmentation method in which a seed point is initialized for a region to be segmented. The neighbouring pixels that share standard features like grayscale level and texture are appended to the seed point, and the region grows. The algorithms’ steps for segmenting a single region are given below.
3.4 Expectation MAX Based Tumor Region Extraction
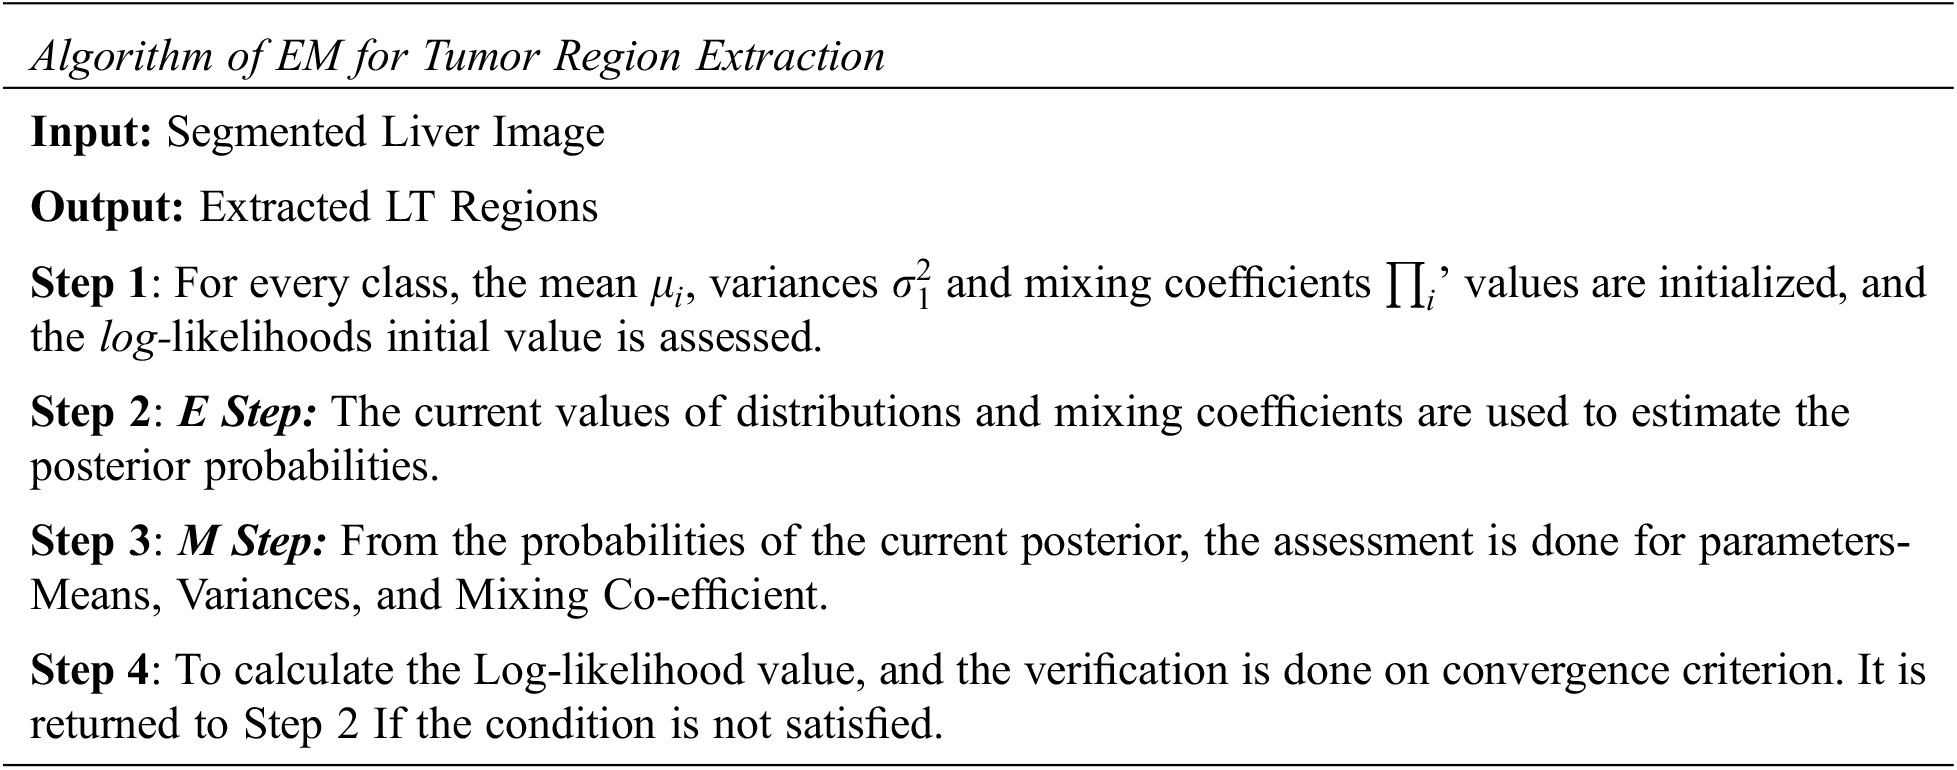
EM segmentation is employed to detect the ROI from the input segmented liver image. The number of classes for EM segmentation is initialized as 5, among which Class 2 and Class 3 are classified as TR. In the following steps, the explanation of the EM algorithm is assumed. To MAX, the similarity function by integrating the parameters–Mean, Variance and Mixing Co-efficient is the primary objective.
The Gaussian Distribution (GD) of the variable ‘y’ is represented as Eq. (2)
where the mean is µ, and the variance is σ2. Eq. (3) is the likelihood function for the GD.
A linear superposition of ‘P’, which is the Gaussian densities of the form, is contained in Gaussian Mixture Distribution, Eq. (4)
where i represents the variable and the number of classes is represented by C. A component of the mixture is supposed to be each Gaussian density
The posterior probabilities
The log-likelihood function is given by Eq. (7)
For MAX, the log-likelihood, the derivatives of Eq. (8) concerning
The parameters are obtained as Eqs. (9)–(11)
The textural properties of the image contain helpful information and can be used for classification applications. Haralick constructed the grayscale tone spatial dependence matrices (co-occurrence matrices) in four directions of angles 0°, 45°, 90°, 135° and extracted 14 textural features. The most commonly used features are energy, entropy, contrast, homogeneity, correlation, and variance.
Let DI represents the digital image, and
Entropy is firmly but inversely correlated to energy, Eq. (13)
Contrast measures the texture contrast, and for high contrast images, the texture contrast is high, and a low value of the GLCM contrast is assigned for a low contrast image, Eq. (14)
Image homogeneity is measured by Homogeneity or Inverse Difference Moment. For the more significant minor grayscale tone differences in pair elements, its value is high. When the contrast for constant energy is more, then IDM is less. Eq. (15)
In the image, grayscale tone linear dependencies are measured using correlation, Eq. (16)
where,
3.6 Tumor Classification using NRSVM
One of the supervised linear classification methods known as the SVM is an a significant tool for applications that additionally contain recognition of images and patterns, medical diagnosis, and bioinformatics. Both the classification errors are MIN, and the geometric margin is MAX simultaneously. Hence SVM is called the MAX Margin Classifier. The separation of patterns done by optimal hyperplane is located by SVM for linearly separable patterns. There is a transformation of data into kernel function and contraction of hyperplane when the patterns are not linearly separable. In this proposed work, NRSVM has been used with Random Forest (RF)classification trees that support multiple ensemble classifiers. This proposed approach effectively categorizes the liver point using multiple nonlinear hyperplanes.
Given a set of training vectors belonging to separate classes,
The Eq. (17) for the separating hyperplane is given by,
Eq. (18) can be compactly represented as
Lagrange multipliers are used to find the optimal hyperplane. One hyperplane is MAX the margin, i.e., the distance between the hyperplanes, among all the possible hyperplanes. The nonlinear RF-SVM lies in the margin order and constitutes the essential features. The decision function gives the solution to the classification problem as given by Eq. (19).
where
The CT images were collected from Meenakshi Mission Scan Centre, Madurai and Medall Diagnostics Centre, Tirunelveli. The opinion about BT/MT in the liver CT images was obtained from the radiologist. The proposed method is tested on liver CT images, and the performance is analyzed. The computer's specifications used to simulate the algorithm using MATLAB is intel Core 2 Duo CPUs@2.53 GHz with 1.98 GB of RAM.
The images are collected from 48 different patients and are of DICOM format with 512 × 512 resolution. The experimental images are selected from the middle slices of the liver volume in which the LR is prominently visible. Image with different types of tumours is used, including BT of Hepato Cellular (HC) adenoma, focal nodular hyperplasia and hemangioma and MT of cholangiocarcinoma, hepatoma, lymphomatous deposits, multiple cysts, metastasis, HC carcinoma and mass lesion. By making a comparison of the fundamental truth for evaluating the performance, qualitative analysis can be done on the segmented liver and tumor of the abdominal CT images. For quantitative analysis, accuracy, sensitivity and specificity are used. This error rate is described in terms of True Positive (TP) and False Positive (FP) and True Negative (TN) and False Negative (FN). These values help to determine the performance measures (TP, TN, FP and FN).
The initial values and parameter selection are given below for various processes.
Anisotropic Filter: The iteration is 15, the gradient threshold parameter is 5, and the rate of diffusion constant is 1/7. The proper selection of these parameters is necessary for efficient Classification.
Contrast Enhancement: The width of the input intensity range is 50, and the intensity around which the range centers is 170. The values are selected based on the proper enhancement of the LR in contrast with the surrounding regions.
K-Means segmentation: The number of classes is 5, and the bone region is removed.
Region Growing Algorithm: The seed point is selected automatically from a group of pixels lying in the region of interest with a pixel value in the desired range. The seed point is selected around the (x,y) coordinates of (240,170), representing the middle of the LR, which has the MAX value. The MAX intensity distance is set to default as 0.1, and for testing mass lesions alone, the value is set as 0.2.
EM Algorithm: The number of classes is 5, and the convergence criterion that is the difference between two successive log-likelihoods, is set at 0.0001.
The input abdominal liver CT images are shown in Fig. 2a. The output of CE using NLM are shown in Fig. 2b.
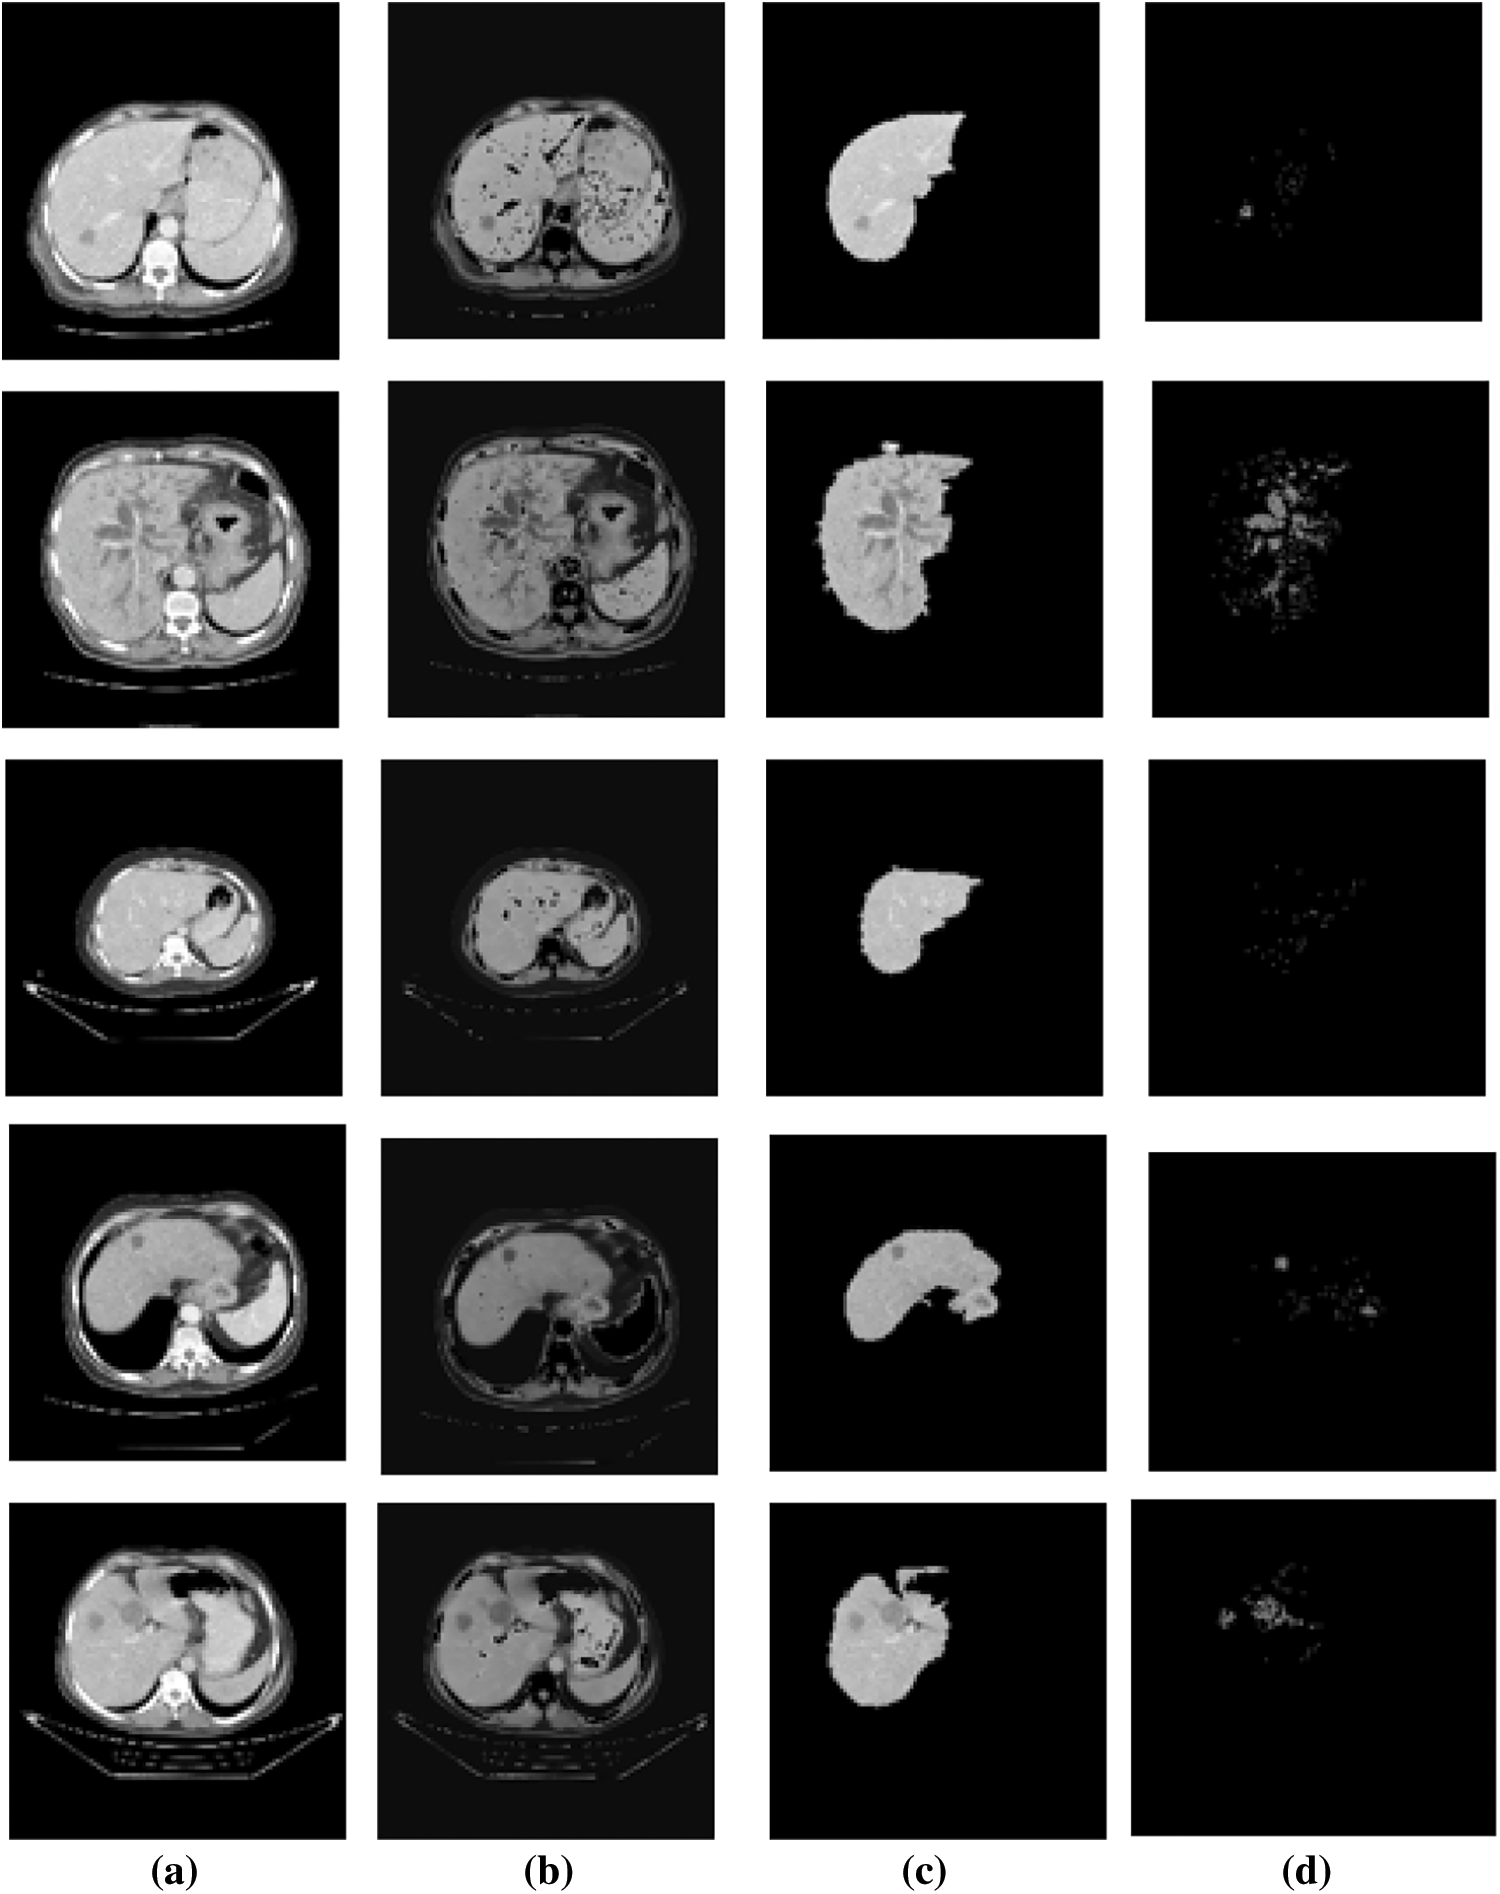
Figure 2: Results of liver and ROI segmentation sample images (a). Input image of abdominal liver CT (b). The output of CE using NLM, (c) LTS output of the RGS algorithm, (d) The ROI segmentation results of the EM algorithm
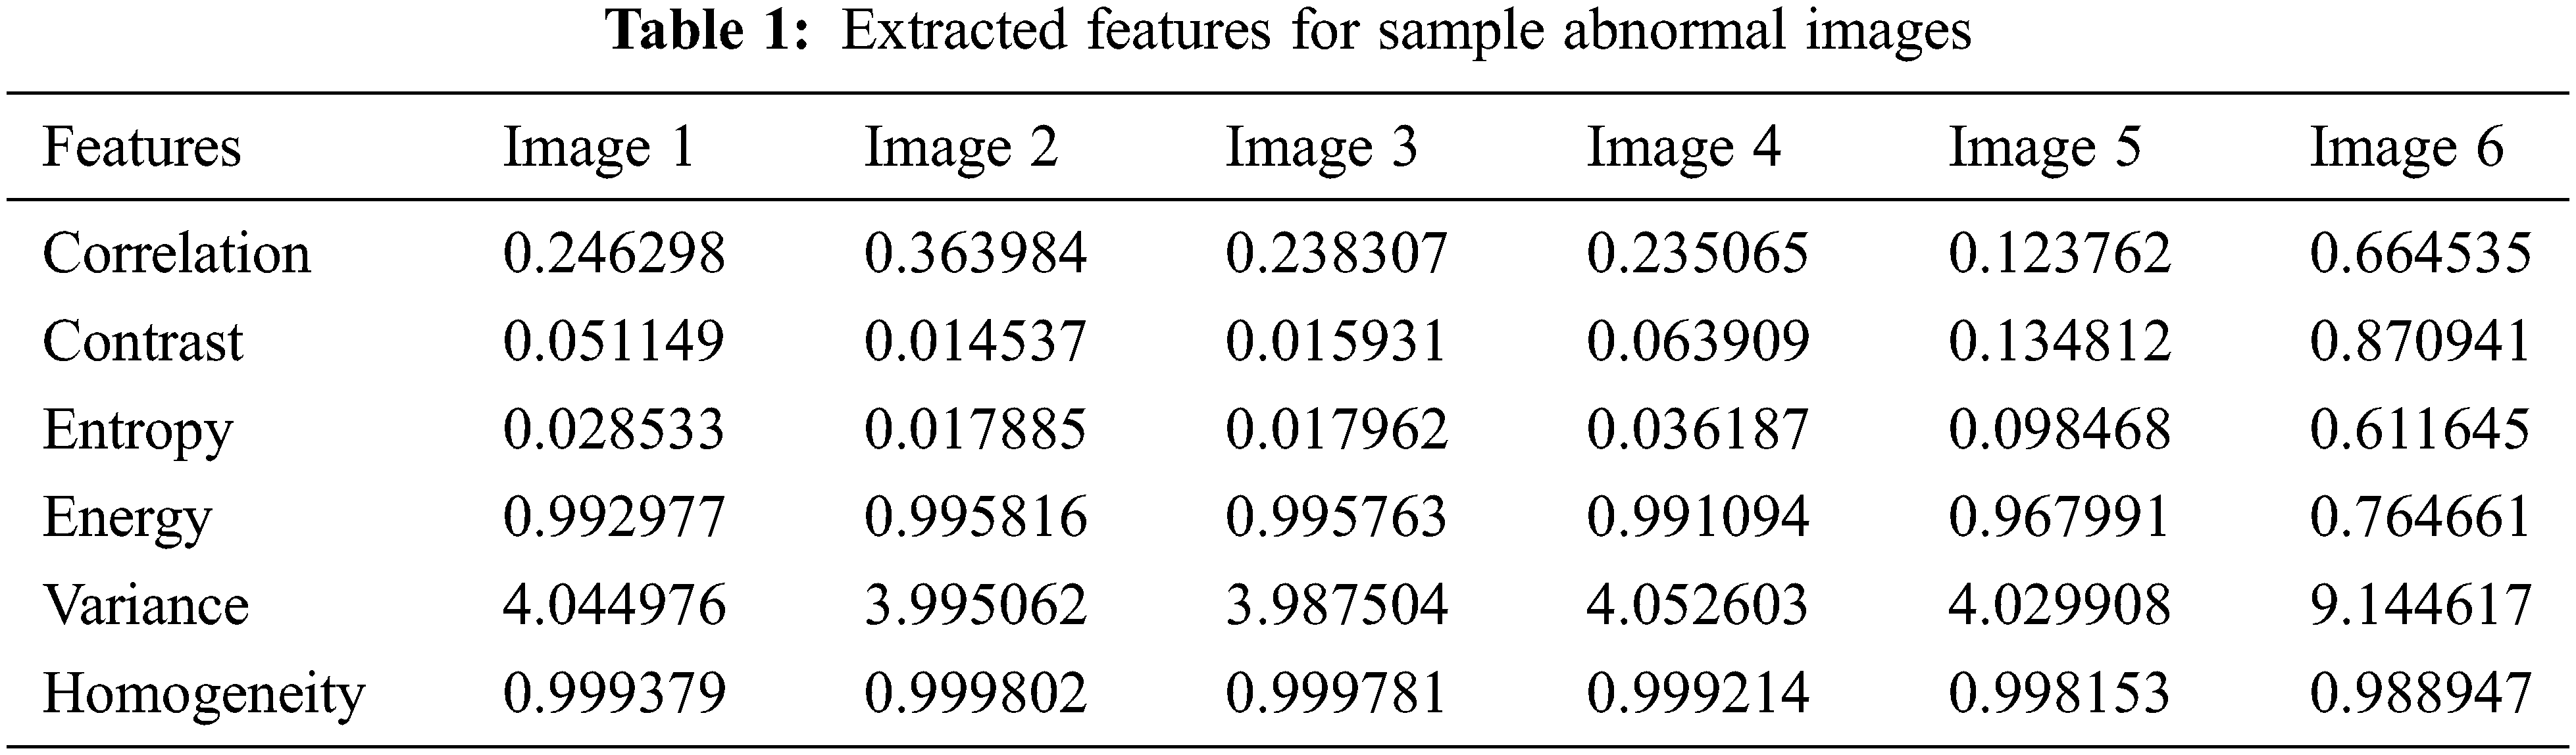
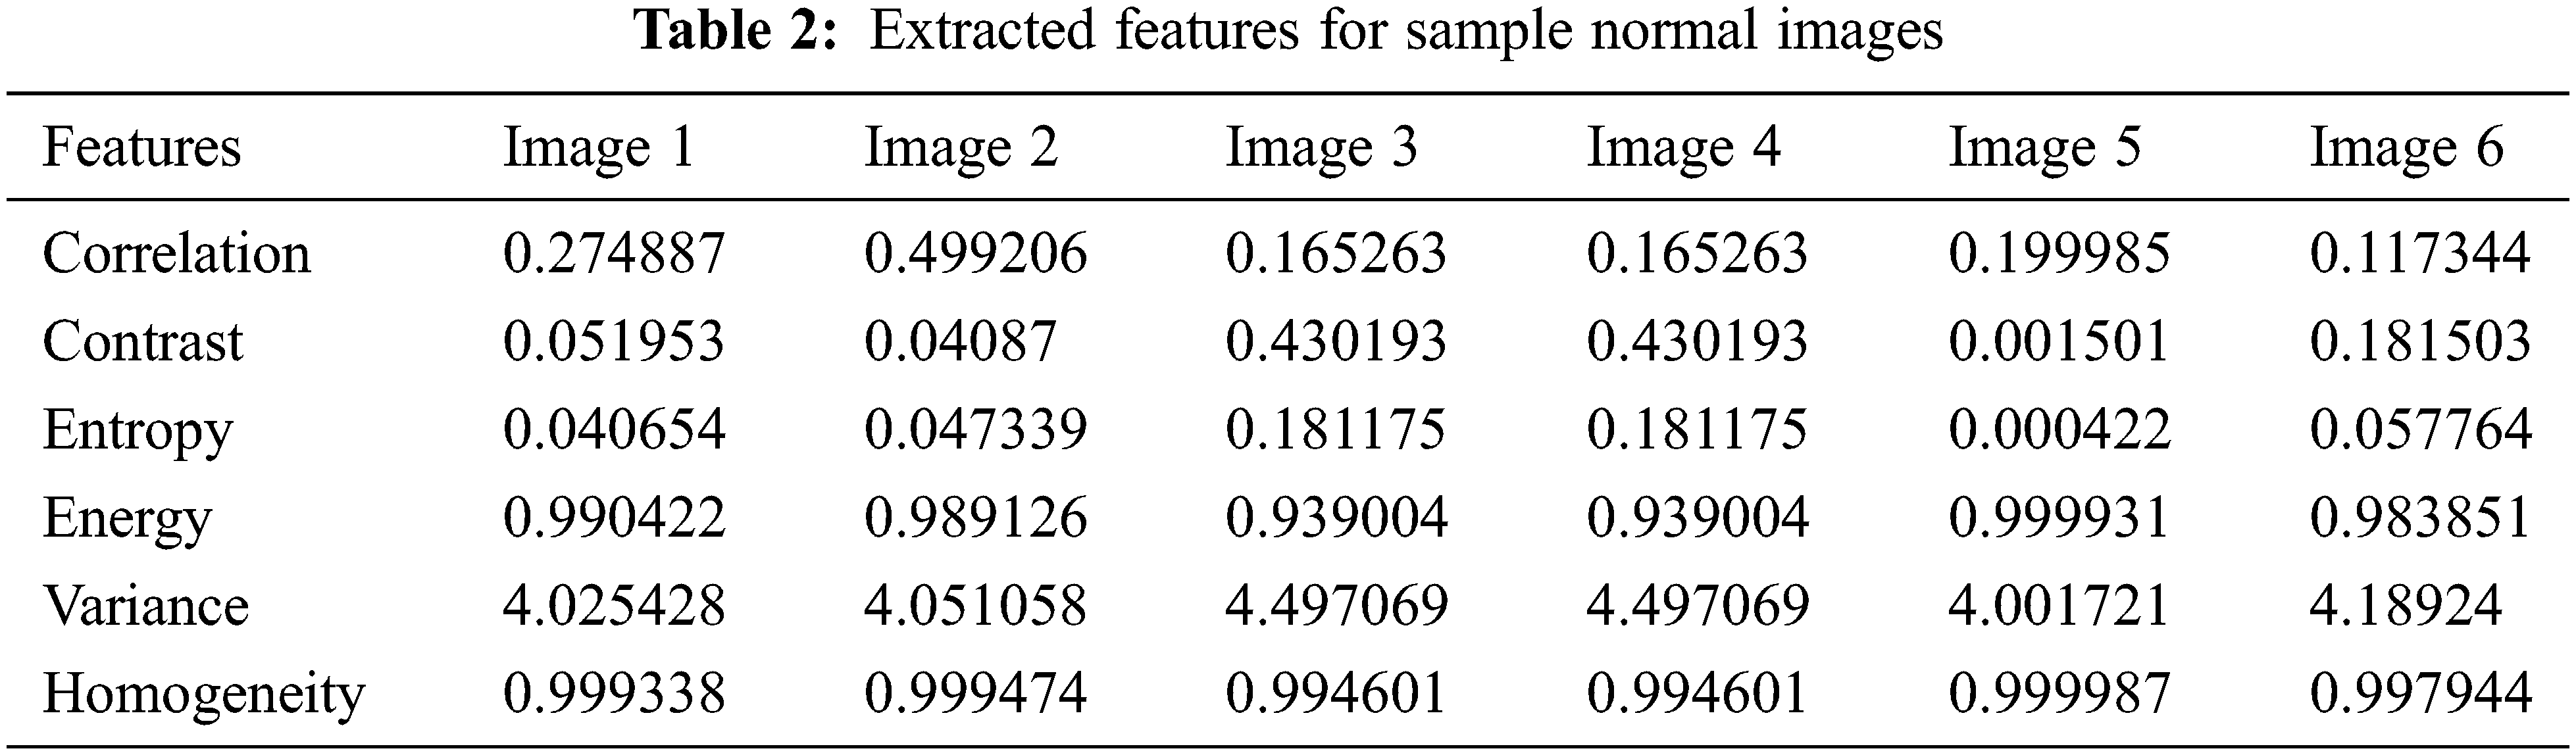
The LTS output of the RGS algorithm is shown in Fig. 2c. The ROI segmentation results of the EM algorithm are shown in Fig. 2d. Qualitative analysis indicates the accurate segmentation performance of the method for different types of tumors and the normal images (Figs. 3 and 4). The extracted six feature values of contrast, correlation, entropy, energy, homogeneity and variance for sample ROI segmented images are tabulated in Tabs. 1 and 2.
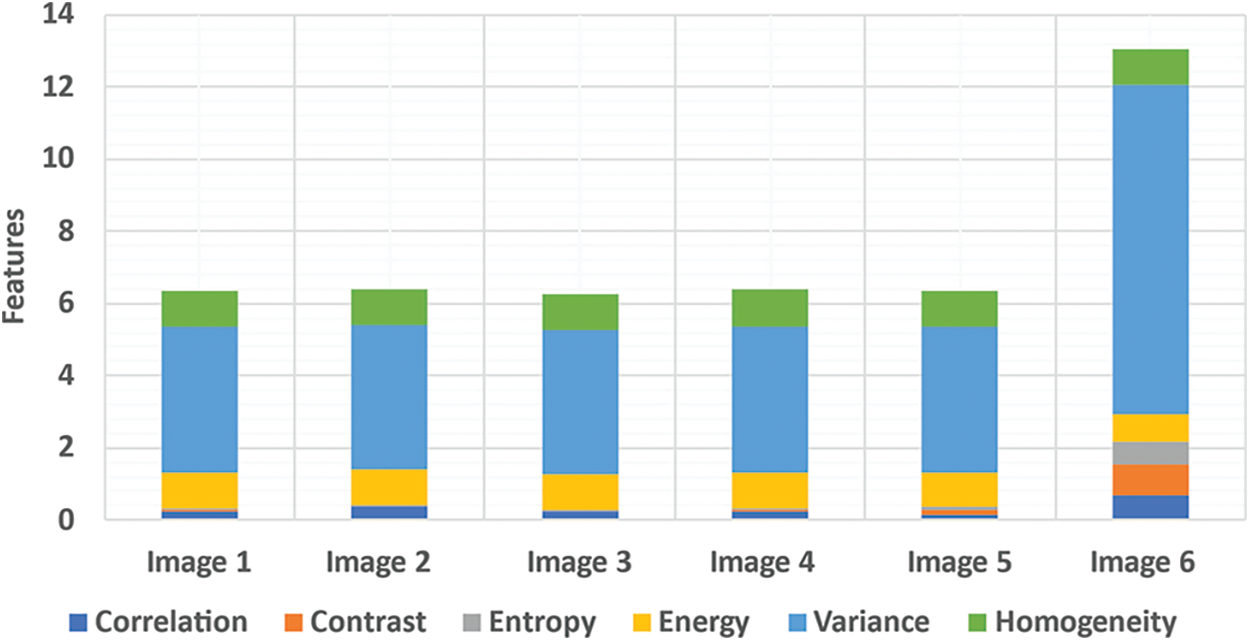
Figure 3: Features extraction from abnormal image set-I (1-6)
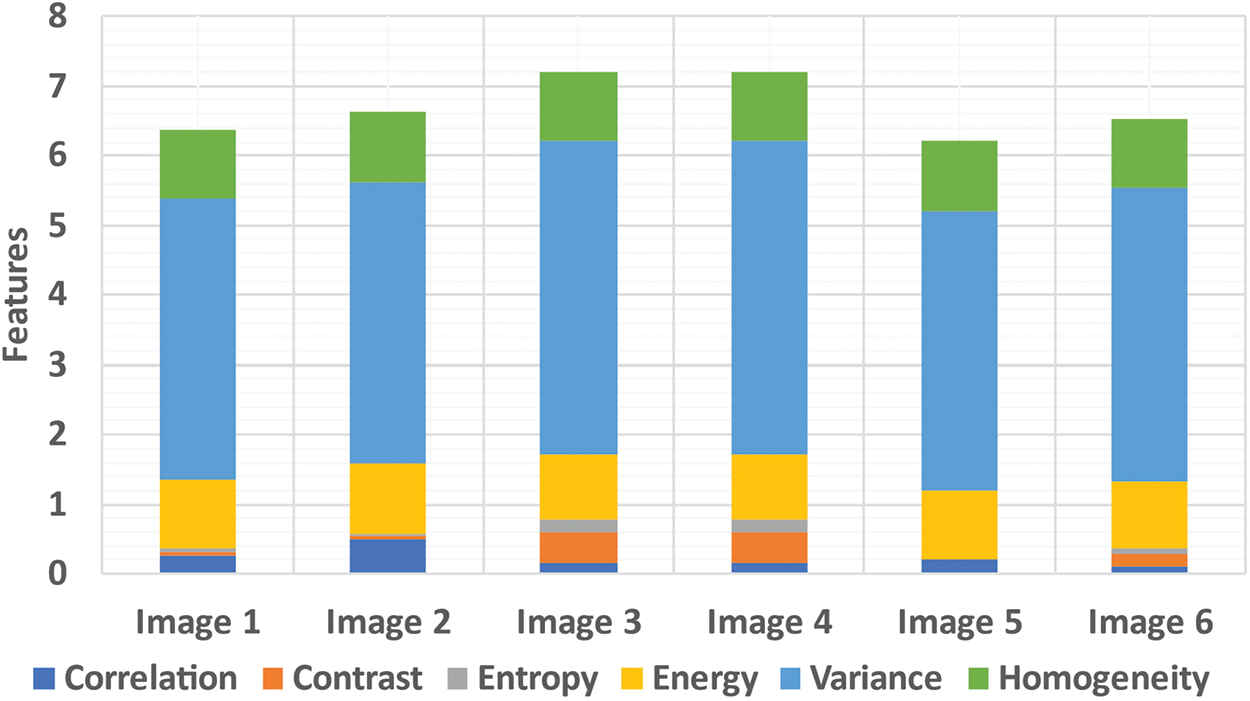
Figure 4: Features extraction from abnormal image set-II (1-6)
As shown in Tab. 3, the proposed system's specificity and accuracy values produce better results than the existing works mentioned. The sensitivity of the proposed system is slightly lesser than Xian et al., but at the same time produces better performance than Hameed et al. (Fig. 5).
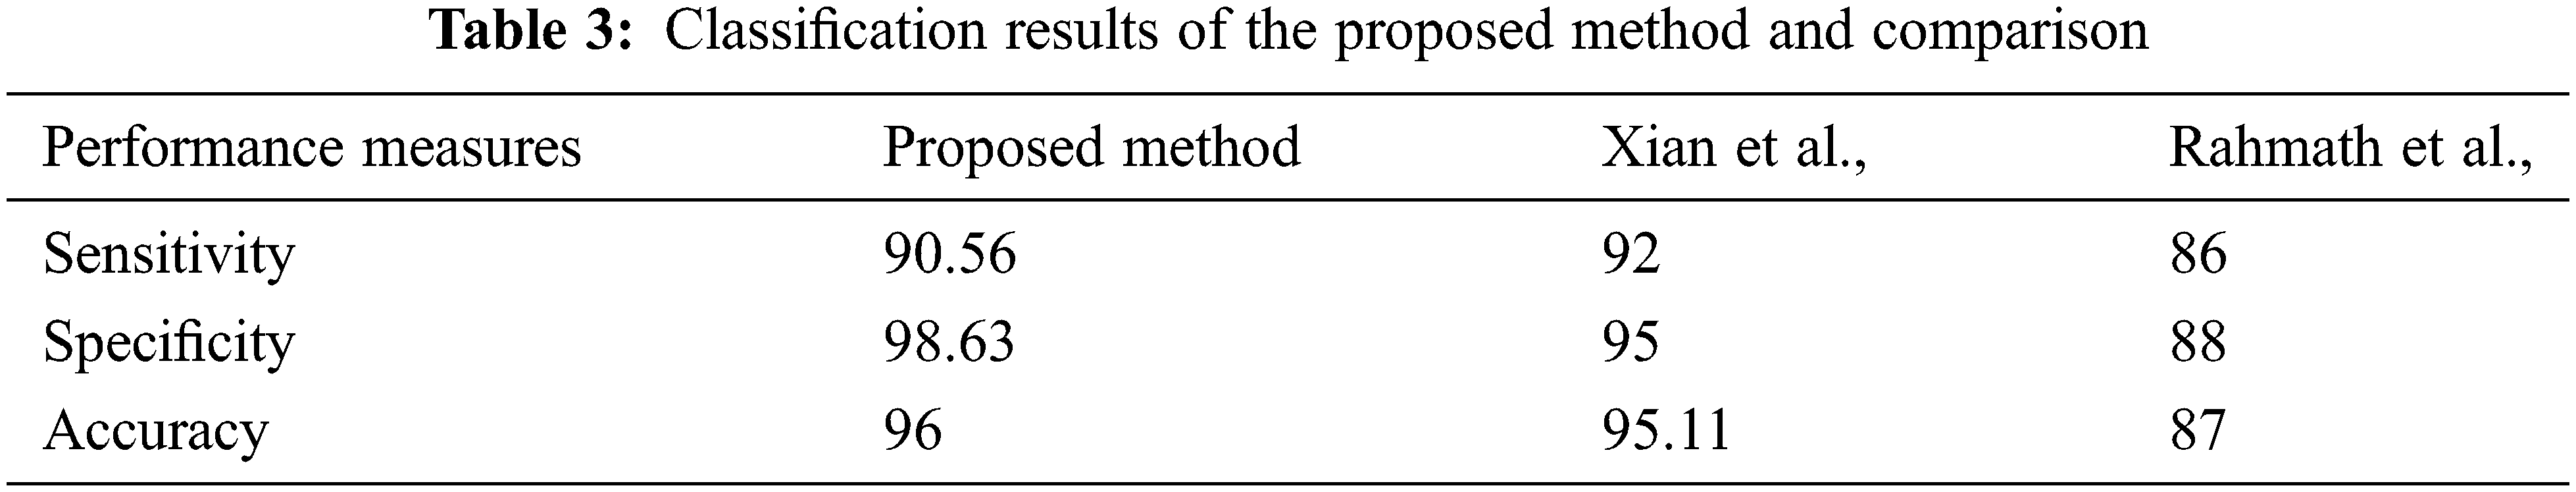
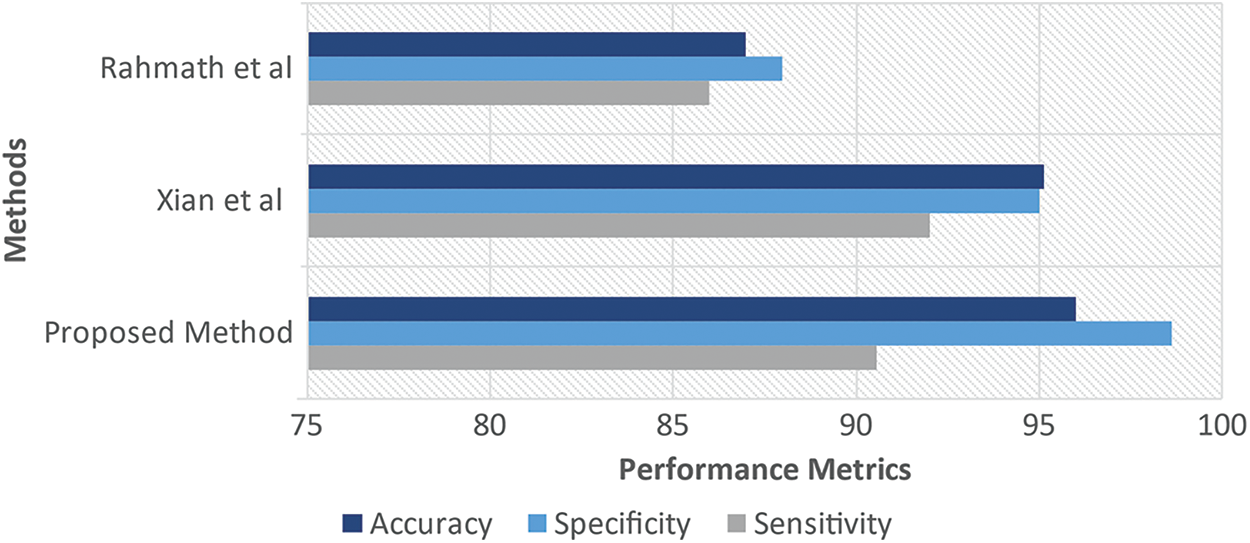
Figure 5: Performance measures of proposed vs. (Xian and Rahmath)
A CAD system for the Classification of BT and MT from abdominal liver CT images based on enhanced RGS is proposed. The LR is enhanced using non-linear mapping to enhance it from the surrounding tissues. The LR is extracted using RGS, and EM is used to segment the tumor region. GLCM features are extracted, and a NRSVM classifier is used to classify normal and abnormal images. The proposed method is extensively tested on a database of images collected from hospitals, and an accuracy of 96% is attained, which shows a good performance measure over the methods of comparison. The proposed method can be used as a second opinion to the radiologist.
In future, this work may be enhanced by implementing the LT classification technique for different imaging modalities with increased accuracy. Also, it aims to improve the overall segmentation and classification performance of the proposed system.
Funding Statement: This research has been funded by Dirección General de Investigaciones of Universidad Santiago de Cali under call No. 01-2021.
Conflicts of Interest: The authors declare that they have no conflicts of interest to report regarding the present study.
1. S. Almotairi, K. Ghada, A. Mohamed, A. Badr and A. M. S. Mohammed, “Liver tumor segmentation in CT scans using modified SegNet,” Sensors, vol. 20, no. 5, pp. 1–13, 2020. [Google Scholar]
2. M. Mokhtari, P. G. Daneshmand and H. Rabbani, “Optical oherence tomography image reconstruction using morphological component analysis,” in 41st Annual Int. Conf. of the IEEE Engineering in Medicine and Biology Society (EMBC), Berlin, Germany, pp. 5601–5604, 2019. [Google Scholar]
3. E. Vorontsov, T. An, R. David, P. J. Christopher and K. Samuel, “Metastatic liver tumour segmentation with a neural network-guided 3D deformable model,” Medical & Biological Engineering & Computing, vol. 55, no. 1, pp. 127–139, 2017. [Google Scholar]
4. L. E. Chen, C. P. Choo, C. C. Liang, H. M. Tsai and C. I. Chang, “An automatic diagnostic system for CT liver image classification,” IEEE Transactions on Biomedical Engineering, vol. 45, no. 6, pp. 783–794, 1998. [Google Scholar]
5. S. V. Vanmore and S. R. Chougule, “Survey on automatic liver segmentation techniques from Abdominal CT images,” in Int. Conf. on Intelligent Computing and Control Systems (ICCS), Madurai, India, pp. 1030–1035, 2019. [Google Scholar]
6. T. Heimann, B. V. Ginneken, M. A. Styner, Y. Arzhaeva, V. Aurich et al., “Comparison and evaluation of methods for liver segmentation from CT datasets,” IEEE Transactions on Medical Imaging, vol. 28, no. 8, pp. 1251–1265, 2009. [Google Scholar]
7. W. Kuo, “Computer-aided diagnosis for feature selection and classification of liver tumors in computed tomography images,” in IEEE Int. Conf. on Applied System Invention (ICASI), Chiba, Japan, pp. 1207–1210, 2018. [Google Scholar]
8. K. Mala, V. Sadasivam and S. Alagappan, “Neural network-based texture analysis of CT images for fatty and cirrhosis liver classification,” Applied Soft Computing, vol. 32, no. c, pp. 80–86, 2015. [Google Scholar]
9. B. Vijayalakshmi and V. Subbiah Bharathi, “Classification of CT liver images using local binary pattern with Legendre moments,” Current Science, vol. 110, no. 4, pp. 687–691, 2016. [Google Scholar]
10. C. H. Cheng and L. Y. Wei, “Rough classifier based on region growth algorithm for identifying liver CT image,” Journal of Applied Science and Engineering, vol. 19, no. 1, pp. 65–74, 2016. [Google Scholar]
11. R. S. Hameed and S. S. Kumar, “Assessment of neural network based classifiers to diagnose focal liver lesions Using CT images,” Procedia Engineering, vol. 38, pp. 4048–4056, 2012. [Google Scholar]
12. J. Huiyan, F. Tianjiao, Z. Di, Y. Benqiang, Z. Libo et al., “Statistical fractal models based on GND-PCA and its application on classification of liver diseases,” BioMed Research International, vol. 2013, pp. 1–8, 2013. [Google Scholar]
13. X. Zhang, J. Tian, D. Xiang, X. Li and K. Deng, “Interactive liver tumor segmentation from ct scans using support vector classification with watershed,” in Annual Int. Conf. of the IEEE Engineering in Medicine and Biology Society, Boston, MA, USA, pp. 6005–6008, 2011. [Google Scholar]
14. G. M. Xian, “An identification method of malignant and benign liver tumors from ultrasonography based on GLCM texture features and fuzzy SVM,” Expert Systems with Applications, vol. 37, no. 10, pp. 6737–6741, 2010. [Google Scholar]
15. R. Sudhakar, “Focal and diffused liver disease classification from ultrasound images based on Isocontour segmentation,” IET Image Processing, vol. 9, no. 4, pp. 261–270, 2014. [Google Scholar]
16. R. Vasanthi, O. I. Khalaf, C. A. T. Romero, S. Sudhakar and D. K. Sharma, “Interactive middleware services for heterogeneous systems,” Computer Systems Science and Engineering, vol. 41, no. 3, pp. 1241–1253, 2022. [Google Scholar]
17. A. Mehbodniya, S. Bhatia, A. Mashat, E. Mohanraj and S. Sudhakar, “Proportional fairness based energy-efficient routing in wireless sensor network,” Computer Systems Science and Engineering, vol. 41, no. 3, pp. 1071–1082, 2022. [Google Scholar]
18. D. Stalin David, S. Arun Mozhi Selvi, S. Sivaprakash, P. Vishnu Raja, D. K. Sharma et al., “Enhanced detection of glaucoma on ensemble convolutional neural network for clinical informatics,” Computers, Materials & Continua, vol. 70, no. 2, pp. 2563–2579, 2022. [Google Scholar]
19. D. Stalin David, M. Anam, K. Chandraprabha, S. Arun Mozhi Selvi, D. K. Sharma et al., “Cloud security service for identifying unauthorized user behaviour,” Computers, Materials & Continua, vol. 70, no. 2, pp. 2581–2600, 2022. [Google Scholar]
20. K. Rajakumari, M. Vinoth Kumar, G. Verma, S. Balu, D. K. Sharma et al., “Fuzzy based ant colony optimization scheduling in cloud computing,” Computer Systems Science and Engineering, vol. 40, no. 2, pp. 581–592, 2022. [Google Scholar]
21. R. Nithya, K. Amudha, A. Syed Musthafa, D. K. Sharma, E. H. Ramirez-Asis et al., “An optimized fuzzy-based ant colony algorithm for 5G-MANET,” Computers, Materials & Continua, vol. 70, no. 1, pp. 1069–1087, 2022. [Google Scholar]
 | This work is licensed under a Creative Commons Attribution 4.0 International License, which permits unrestricted use, distribution, and reproduction in any medium, provided the original work is properly cited. |