DOI:10.32604/iasc.2022.025485
| Intelligent Automation & Soft Computing DOI:10.32604/iasc.2022.025485 | |
| Article |
Reversible Data Hiding in Encrypted Images Based on Adaptive Prediction-error Label Map
1College of Computer Science and Information Technology, Central South University of Forestry and Technology, Changsha, 410004, China
2Department of Mathematics and Computer Science, Northeastern State University, OK, 74464, USA
*Corresponding Author: Jiaohua Qin. Email: qinjiaohua@163.com
Received: 25 November 2021; Accepted: 01 February 2022
Abstract: In the field of reversible data hiding in encrypted images (RDH-EI), predict an image effectively and embed a message into the image with lower distortion are two crucial aspects. However, due to the linear regression prediction being sensitive to outliers, it is a challenge to improve the accuracy of predictions. To address this problem, this paper proposes an RDH-EI scheme based on adaptive prediction-error label map. In the prediction stage, an adaptive threshold estimation algorithm based on local complexity is proposed. Then, the pixels selection method based on gradient of image is designed to train the parameters of the prediction model. In the embedding stage, reserve enough space to embed auxiliary information and secret data embedding by flipping the least significant bits (LSBs) to encrypt the original image. In the receiver, based on the prediction-error map, error-free image recovery can be achieved. Extensive experimental results have shown that the proposed method can achieve effective pixel prediction results and get a higher embedding rate (ER).
Keywords: Reversible data hiding; adaptive threshold estimation algorithm; pixels selection method; image gradient
Nowadays, with the increasing demand for privacy protection and information security, data hiding technology has thrived. Data hiding technology mainly comprises steganography [1], watermarking [2], and reversible data hiding [3]. Among them, reversible data hiding (RDH) is a significant research topic in multimedia security that can provide copyright identification and integrity certification for multimedia in third-party platforms. The existing RDH methods are mainly based on three fundamental strategies: lossless compression [4,5], histogram shift (HS) [6,7], and differential expansion (DE) [8,9].
According to the order of data embedding, RDH can be divided into two methods: VRAE (vacating room after encryption) [10,11] and RRBE (reserving room before encryption) [12]. Zhang first proposed the VRAE method [13]. Then Zhang et al. [14] proposed a separable reversible data hiding scheme in encrypted images. However, the VRAE method is difficult to achieve a large embedding capacity of encrypted images due to the error of the predictor. In recent years, the methods based on pixel prediction has been proposed, which can predict the target pixel to achieve the desired effect [15,16]. Chen et al. [17] proposed a directional enclosed predictor to detect the proportional relationship between local complexity and prediction-error, thereby improving image fidelity. Mohammadi et al. [18] used the local difference predictor to determine the label of the block embedding capacity. To optimize the performance of the rhombus predictor, Chu et al. [19] designed a new weight calculation technique for the rhombus predictor to ensure that texture regions have always smaller weights. To reduce the distortion of the marked image, Li et al. [20] proposed dynamic predictor by introducing a dynamic pixels value ordering (D-PVO) method into dynamic prediction and expansion (DPE). To obtain high data embedding ability, Chen et al. [21] used a predictor based on single linear regression to predict pixels. However, due to the low prediction accuracy of this method, the embedding ability is not improved significantly. Li et al. [22] designed a double linear regression prediction model and set a fixed threshold. However, if the threshold setting in the prediction model is not appropriate, it will cause a large difference between the original pixel and its predicted value. It means that auxiliary data needs more embedding room, leading to a smaller embedding capacity for additional data.
To further increase the embedding capacity of additional data, this paper proposes a new separable reversible data hiding method in encrypted images. To summarize, the main contributions of this paper are as follows:
1) A new pixel selection and prediction strategy is proposed to reduce prediction error (PE). Different from many previous works, our method uses an adaptive threshold algorithm for texture classification and combines image gradient to use smooth pixels for effective pixel prediction, which greatly benefits the data embedding process.
2) This method reserves space before the image is encrypted. Different from the method of VRAE, it retains the pixel correlation and increases the embedding capacity.
The rest of this paper is organized as follows. Section 2 introduces the related work. Section 3 presents the details of the proposed method. The experimental results are provided in Section 4. Conclusion is presented in Section 5.
Due to the spatial correlation, the neighboring pixels are likely to be similar in the plaintext image. Therefore, it is possible to predict the value of a pixel based on its neighboring pixel. Suppose pi,j is the target pixel to be predicted in the original image I, M × N. In [21], Chen et al. select three neighboring pixels, i.e., pi-1,j-1, pi-1,j, pi,j-1 to predict the target pixel value, in which 2 ≤ i ≤ M and 2 ≤ j ≤ N. To further exploit correlation, Li et al. [22] based on [21], a neighboring pixel i.e., pi-1,j+1 is added for pixel prediction. However, if the target pixel pi,j which j = N, the neighboring pixels pi-1,j+1 is missing. So Li et al. used the pixel substitution method, which replace the missing pixel with pi-1,j. Nevertheless, this method may produce errors in the details of the image.
2.2 Linear Regression Prediction
Regression analysis is a method of finding the mathematical relationship between variables that are not completely determined and making statistical inferences. Therefore, according to the neighboring pixels, the target pixel value can be predicted by the model:
where β is a one-dimensional vector of n × 1, i.e., β∈[β0, β1, …,βn]T, which represents the partial regression coefficient of the multiple linear regression model; x is the independent variable, y is the dependent variable. It also can be present as Y = Xβ + ε, and the matrix form is as follows:
Suppose J(β) is the objective function, it is described as:
To find the extreme value of the objective function, it is necessary to obtain the derivative of the objective function, which is calculated as follows:
And then set the derivative function to 0, and obtain the parameter values in the derivative function according to the equation:
Based on the known partial regression coefficient β, a multiple linear regression model can be constructed. When there are other new independent variable values, the predicted value can be finally obtained through this model. However, linear regression prediction has the following two shortcomings:
• The prediction rate of unary linear regression analysis is low.
• This model is very sensitive to outliers.
The framework of the proposed scheme is shown in Fig. 1. The proposed method contains three stages: 1) The content-owner conducts the auxiliary information and the encrypted image to the data hider. First, the content owner uses the proposed high precision error prediction algorithm to conduct the corresponding prediction error map. Combined with the original image, the reserved rooms are calculated and the original image is encrypted by Logistic Chaotic encryption. 2) The data-hider performs data hiding according to the data hiding key. The embedded data consists of the auxiliary data and the secret data. 3) Data extraction and image decryption are done by the receiver. Auxiliary information is used for image restoration.
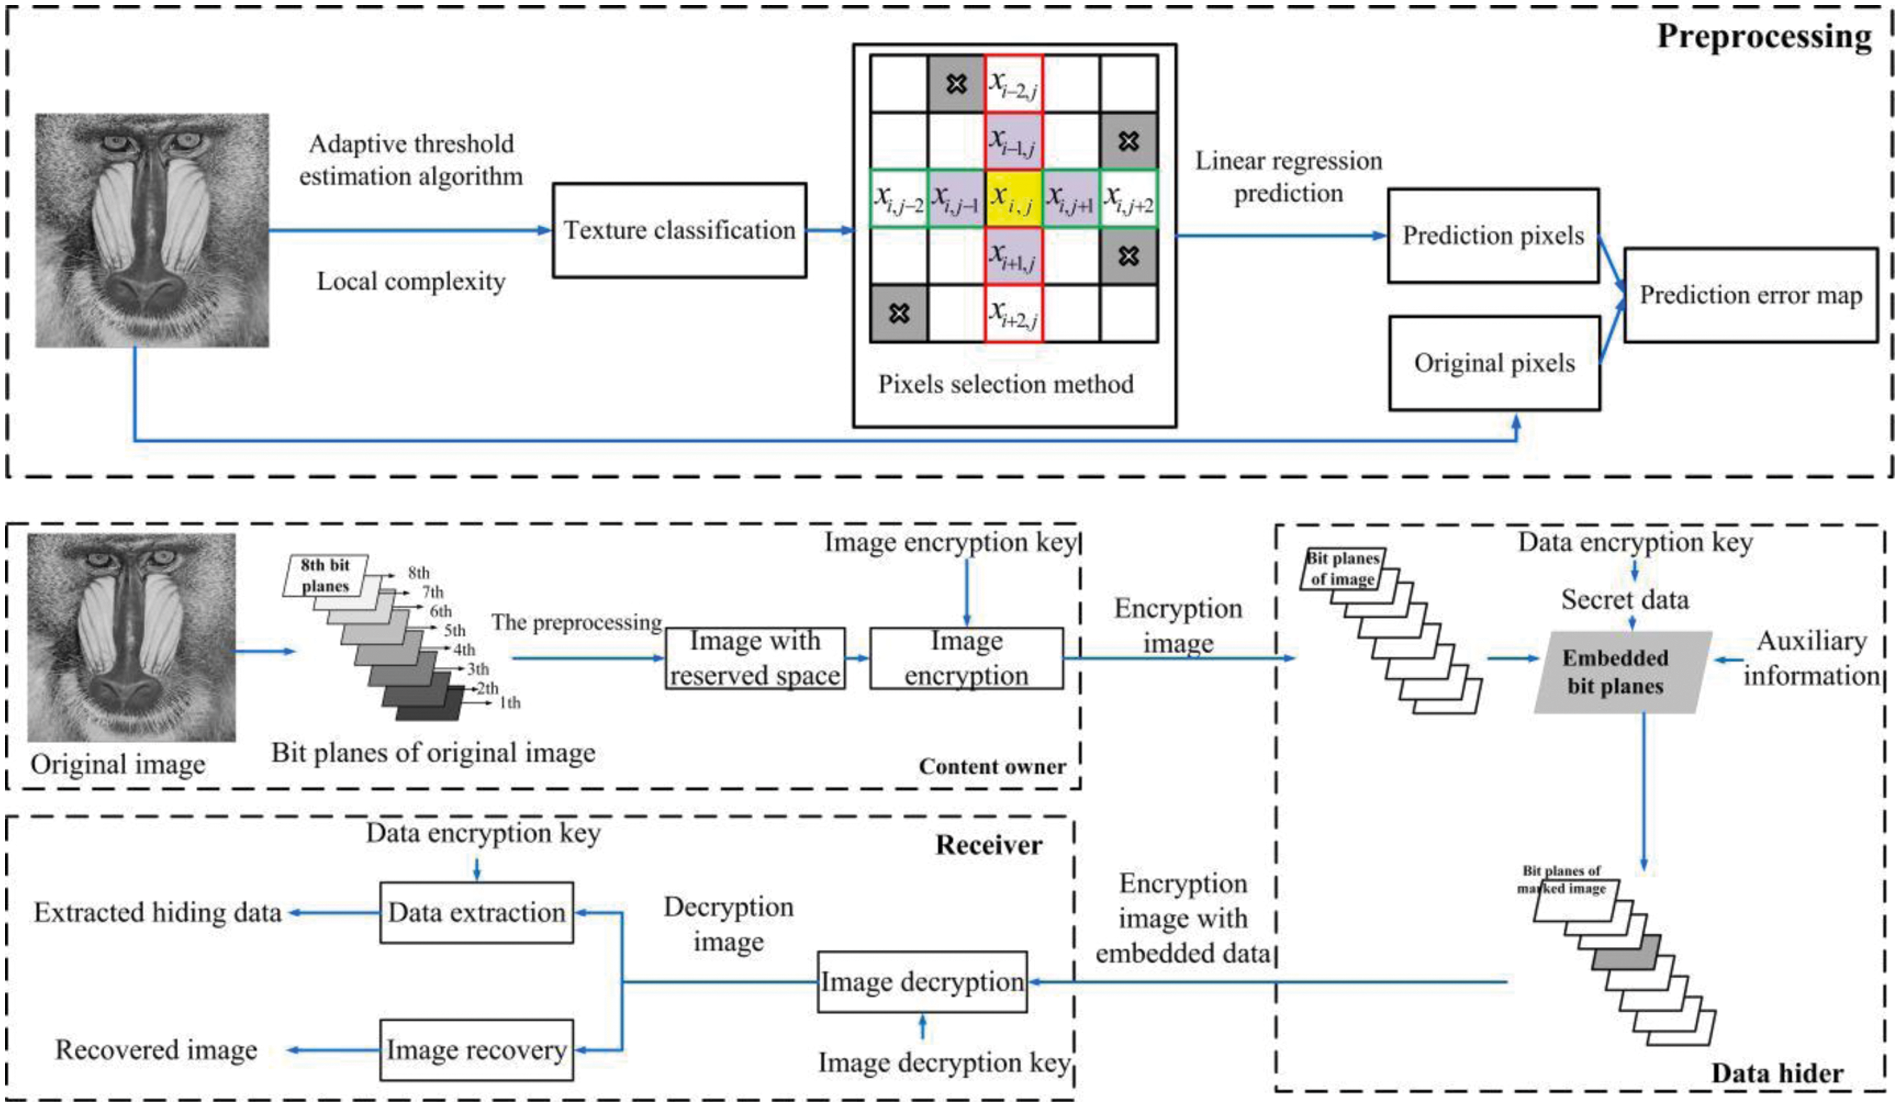
Figure 1: Framework of our proposed scheme
3.1 The Proposed Adaptive Error Prediction Label Map Generation
In this section, we first elaborate an adaptive threshold estimation algorithm. With the proposed algorithm, we design a pixels selection method based on image gradient for training stable model parameters by a double linear regression predictor. Generate the prediction error map and compress it by using a lossless compression scheme. According to the prediction error map, the modified bit-planes of the original image can be recovered to recover the image losslessly.
3.1.1 Adaptive Threshold Estimation Algorithm Based on Local Complexity
Let I be an 8-bit grayscale uncompressed image with M × N size and pi,j denotes its pixel located at the coordinates (i,j), where 0 ≤ pi,j ≤ 255, 1 ≤ i ≤ M, and 1 ≤ j ≤ N. For each pixel pi,j that consists of 8 bits, denoted as bi,j,1, bi,j,2, …, bi,j,8 .The bit values can be derived as follows.
where bi,j,1 is the least significant bit and bi,j,8 is the most significant bit.
The proposed method is based on the local complexity calculation of the original image. Considering that pi,j neighboring pixels are missing when i = 1, M or j = 1, N, we use edge mirror expansion to expand an image of size M × N to (M + 2)×(N + 2). Suppose ci,j is the local complexity of pi,j. The calculation of Local _complexity is derived as follows.
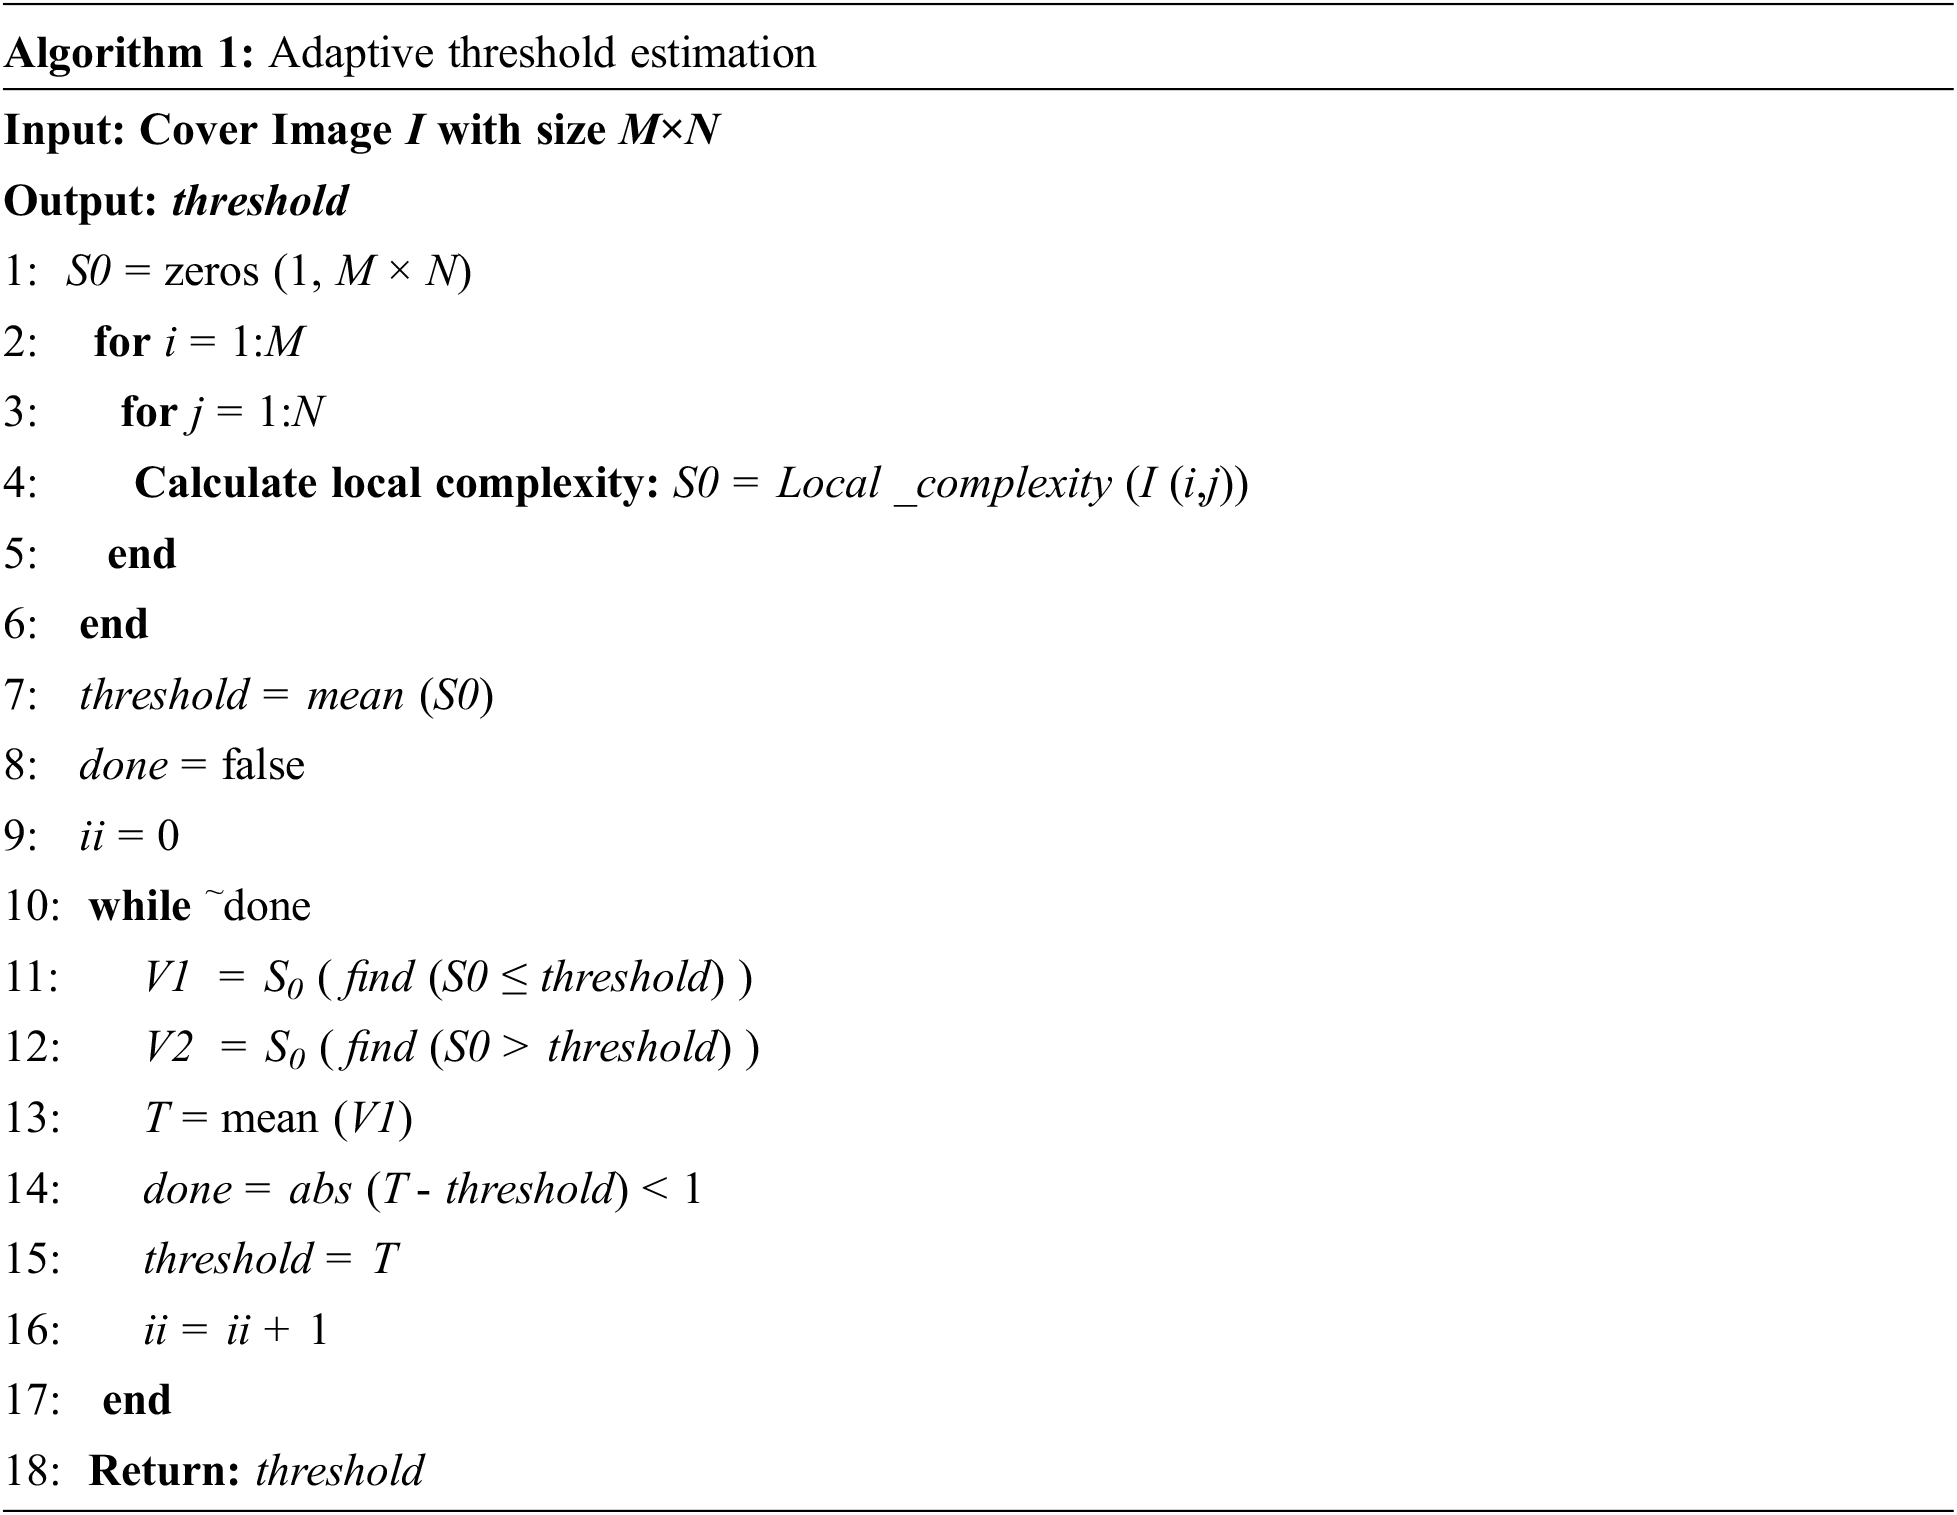
The linear regression method has the characteristics of being very sensitive to outliers and the accuracy of the model mainly depends on the parameters. To address this problem, we proposed an adaptive threshold estimation algorithm to classify the image into two areas: uniform regions and complexity regions. In the uniform regions, the neighboring pixels are similar, so one pixel can be effectively predicted by the neighboring pixels. However, in the complexity regions, there is a large difference between neighboring pixels. The pseudocode for the adaptive threshold estimation algorithm is shown in Algorithm 1.
3.1.2 Linear Regression Predictor Based on Adaptive Pixels Selection Method
Before constructing a multiple regression model, in order to ensure that the regression model has an excellent predictive effect, it is necessary to pay attention to the choice of independent variables. So we combined the gradient of the image to construct an adaptive pixel selection method. First, calculate the horizontal gradients
The double linear regression analysis forecasting method refers to the method of predicting through the correlation analysis of two or more independent variables and one dependent variable and establishing a model. Due to the strong correlation between adjacent pixels, we use the linear regression analysis method to predict the pixels. According to the gradient labeling map obtained in Eq. (8), we have three possible values of
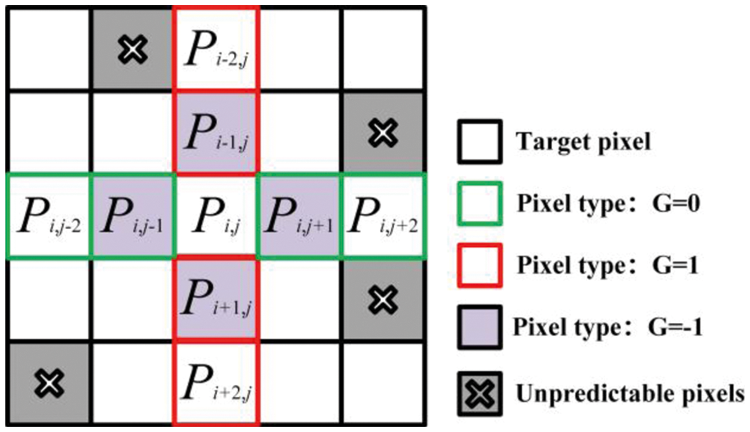
Figure 2: Training sets and an example of pixels selection
Case 1: If
Case 2: If
Case 3: If
pi,j-1, pi+1,j, pi,j+1, as the input data.
According to the constructed gradient label map, the linear prediction model LR_Predictor can be established. For example, in case 1, we firstly choose three pixels pi,j-2, pi,j-1, pi,j-2 of the objected pixel pi,j as prediction sample Y. Next, select the training sample chooses three different combinations of each of its values. The model is shown as follows.
Taking Baboon image as an example, the parameter is: β0 = –9.5783 × 10⁻⁴, β1 = 0.0033, β2 = 0.8397, β3 = 0.157. In Fig. 3, the target pixel pi,j = 250 can obtain the predicted pixel
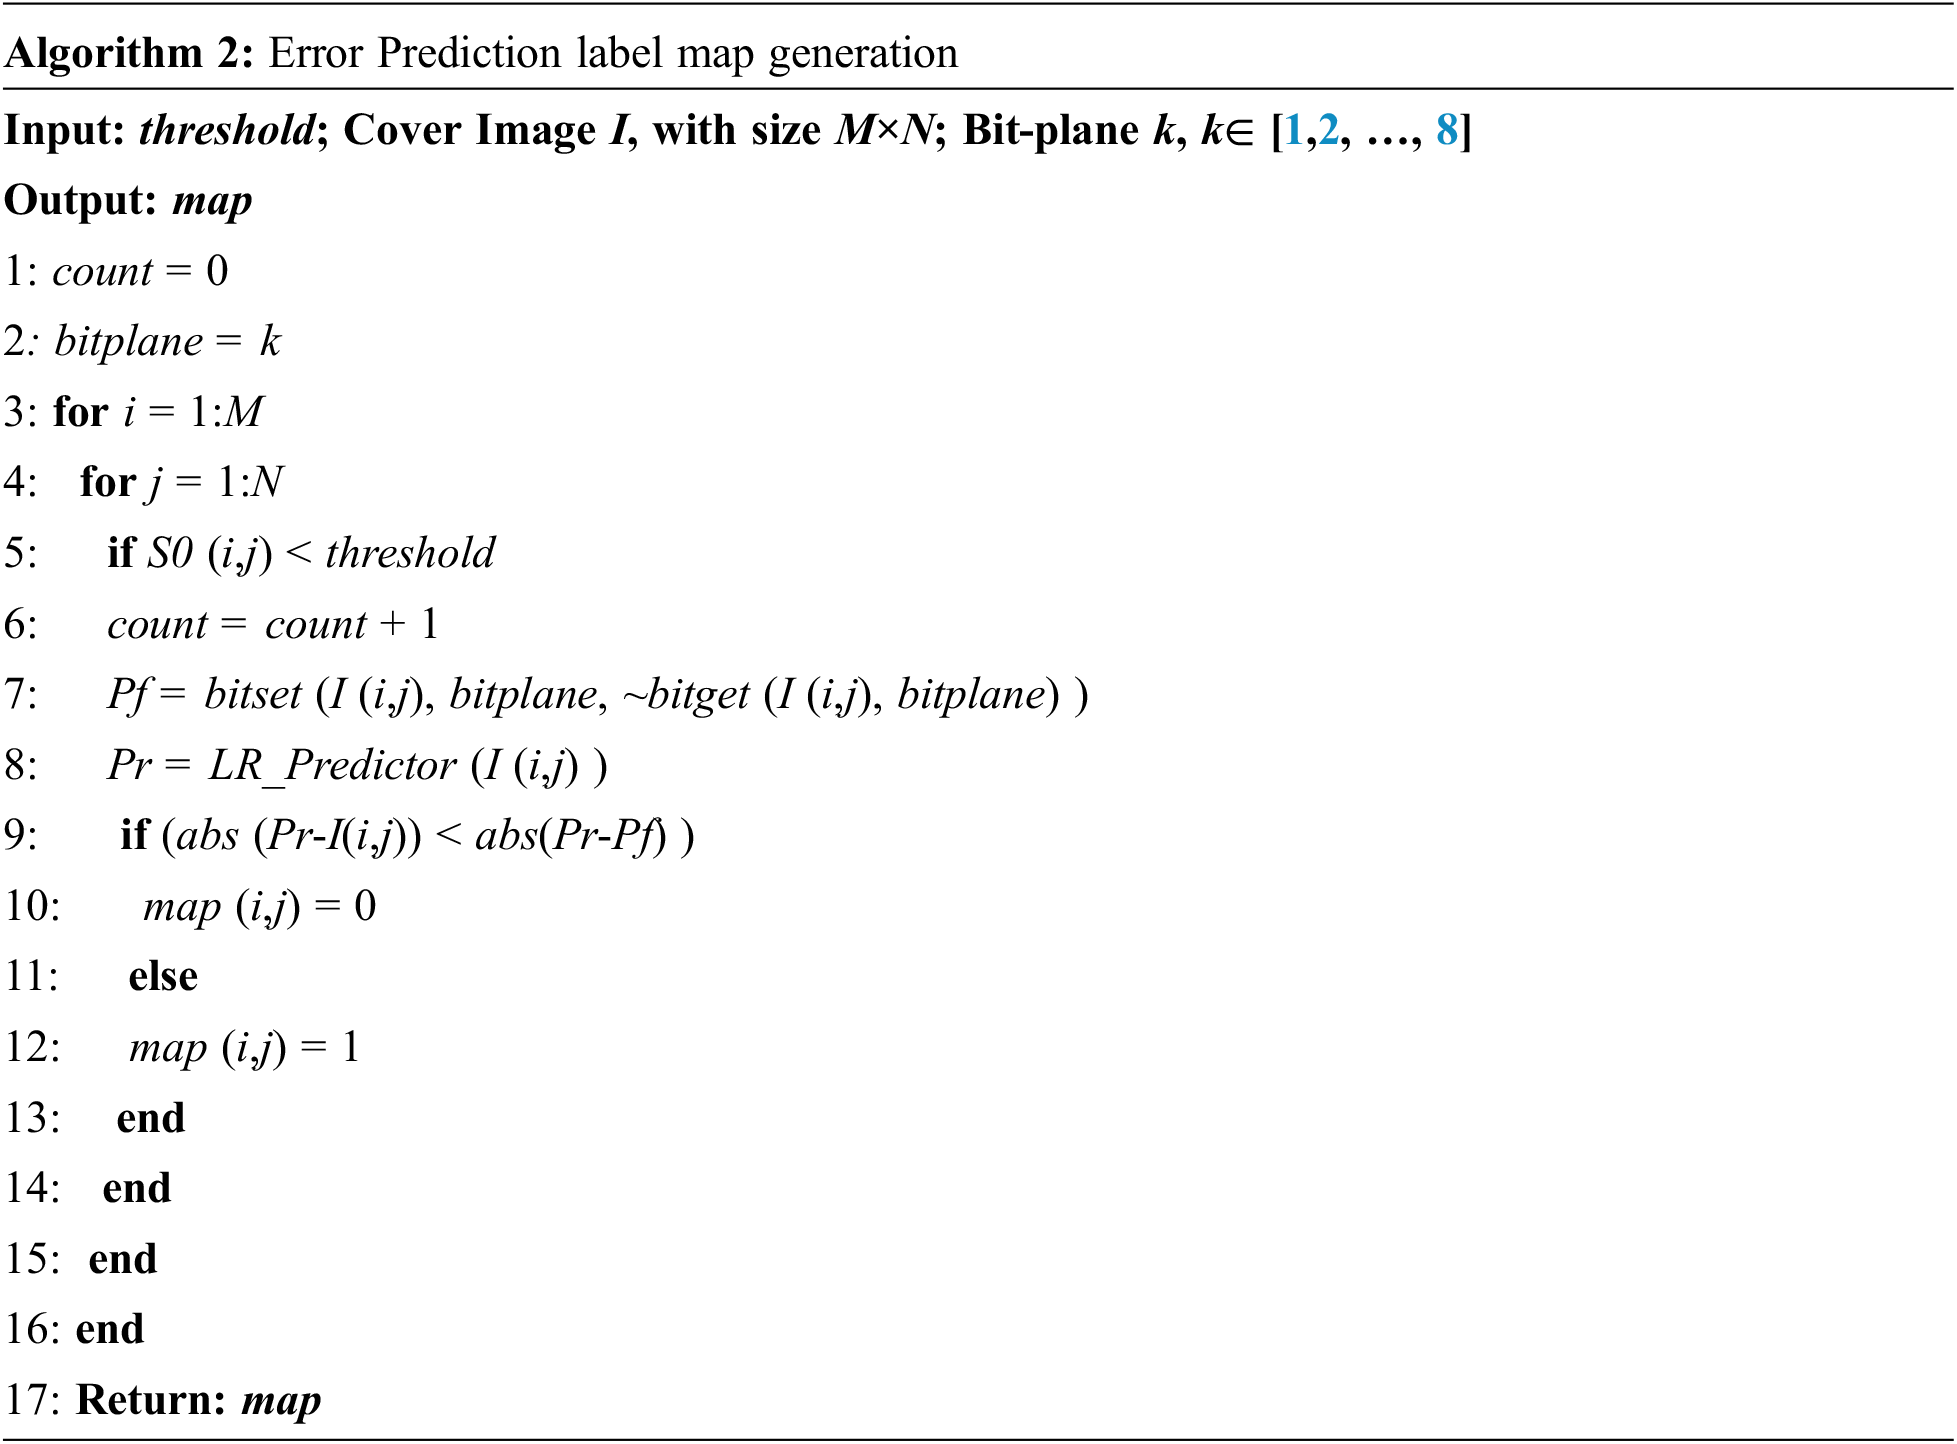
3.1.3 Error Prediction Label Map Generation
According to error prediction label maps, the modified bit-planes of the original image can be recovered so as to recover image losslessly. Suppose
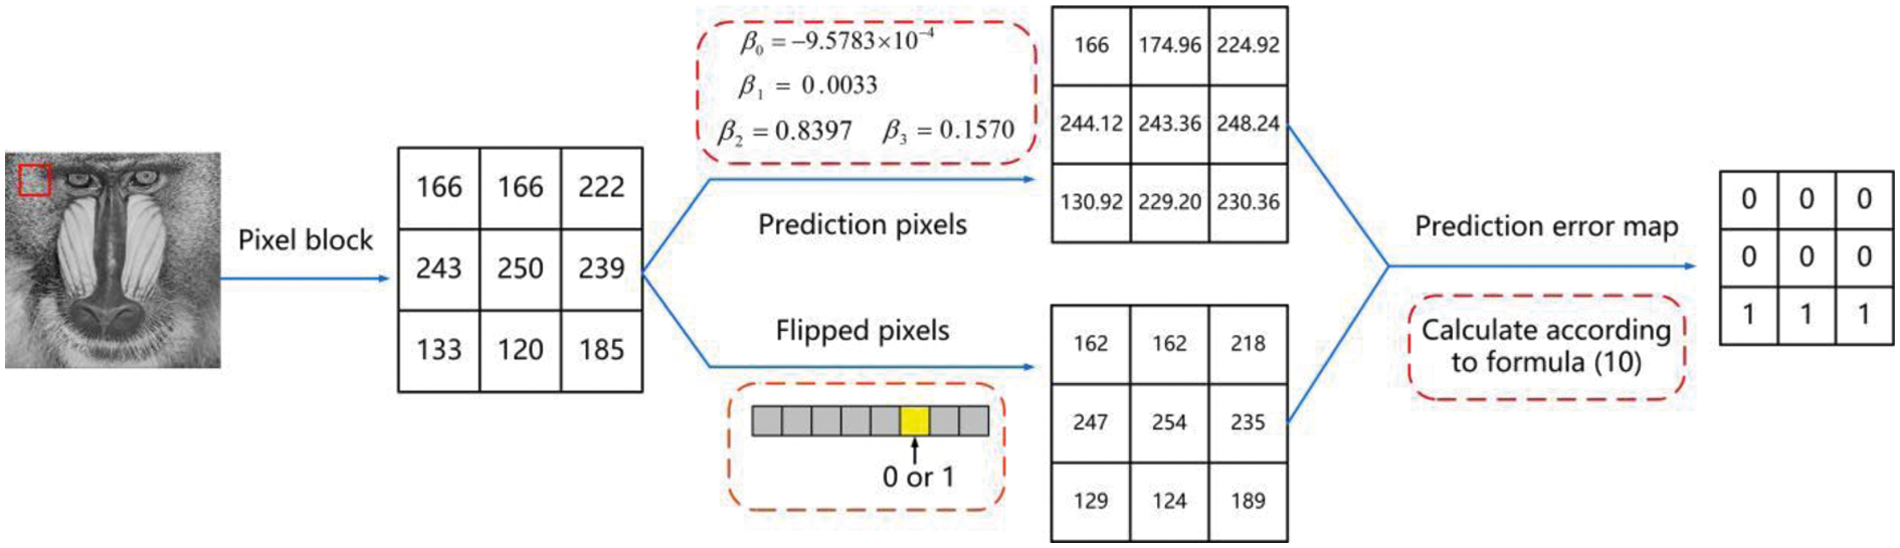
Figure 3: The process of prediction error map
For image encryption, we use a Logistic Chaotic encryption method [23] to encrypt the image. The Logistic chaotic sequence is first generated, and then the encryption algorithm is designed through the chaotic system to achieve the encryption purpose. In this method, the original image is encrypted by encryption key K1. First, we generate a pseudo-random matrix R of size M × N through the key K1. Next, the pixel pi,j, and its corresponding Ri,j are transformed into the 8-bit binary sequence, denoted as bi,j,k and Ri,j,k. Then, each bit-plane of the original pixel is encrypted as follows.
where
3.3 Auxiliary Information and Secret Data Embedding
In this section, the secret data and the auxiliary information are encrypted by the data hiding key K2 to enhance security. When the data hider receives the encrypted image Ie, in order to generate room for embedding in the encrypted image as well as perform lossless recovery, a compressed prediction error map is required to be embedded into the encrypted image before data embedding operation. The auxiliary information is first embedded using the data hiding key. The remaining part is used to store secret bits, where the bits with labels ‘0’ or ‘1’ are replaced by secret bits. Therefore, the corresponding secret data can be further embedded if there is more embedding room. Fig. 4 illustrates the constitution of the embedded data. Fig. 5 shows an example of embedding data, where the 3th bit plane is selected to embed data.
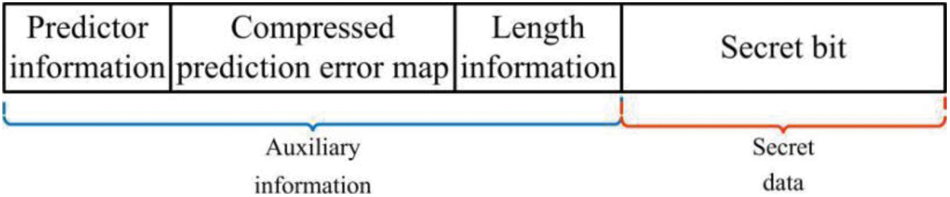
Figure 4: The constitution of the embedded data
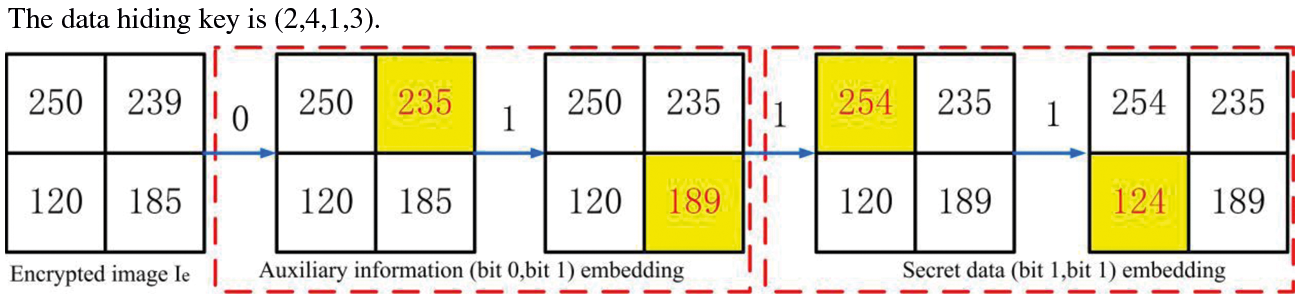
Figure 5: The process of auxiliary information and secret data embedding
3.4 Data Extraction and Image Recovery
On the receiver, three scenarios are considered due to the separation characteristic of the proposed method. One scenario is that the receiver only has the data hiding key K2, so it can accurately extract secret bits from the marked encrypted image. Another scenario is that the receiver only has the encryption key K1, so it can perfectly reconstruct the original image according to prediction error map. When the receiver has both the image encryption key K1 and the data hiding key K2, the secret data can be reversibly extracted and the original image can be restored. Fig. 6 shows the image restoration process of our method.
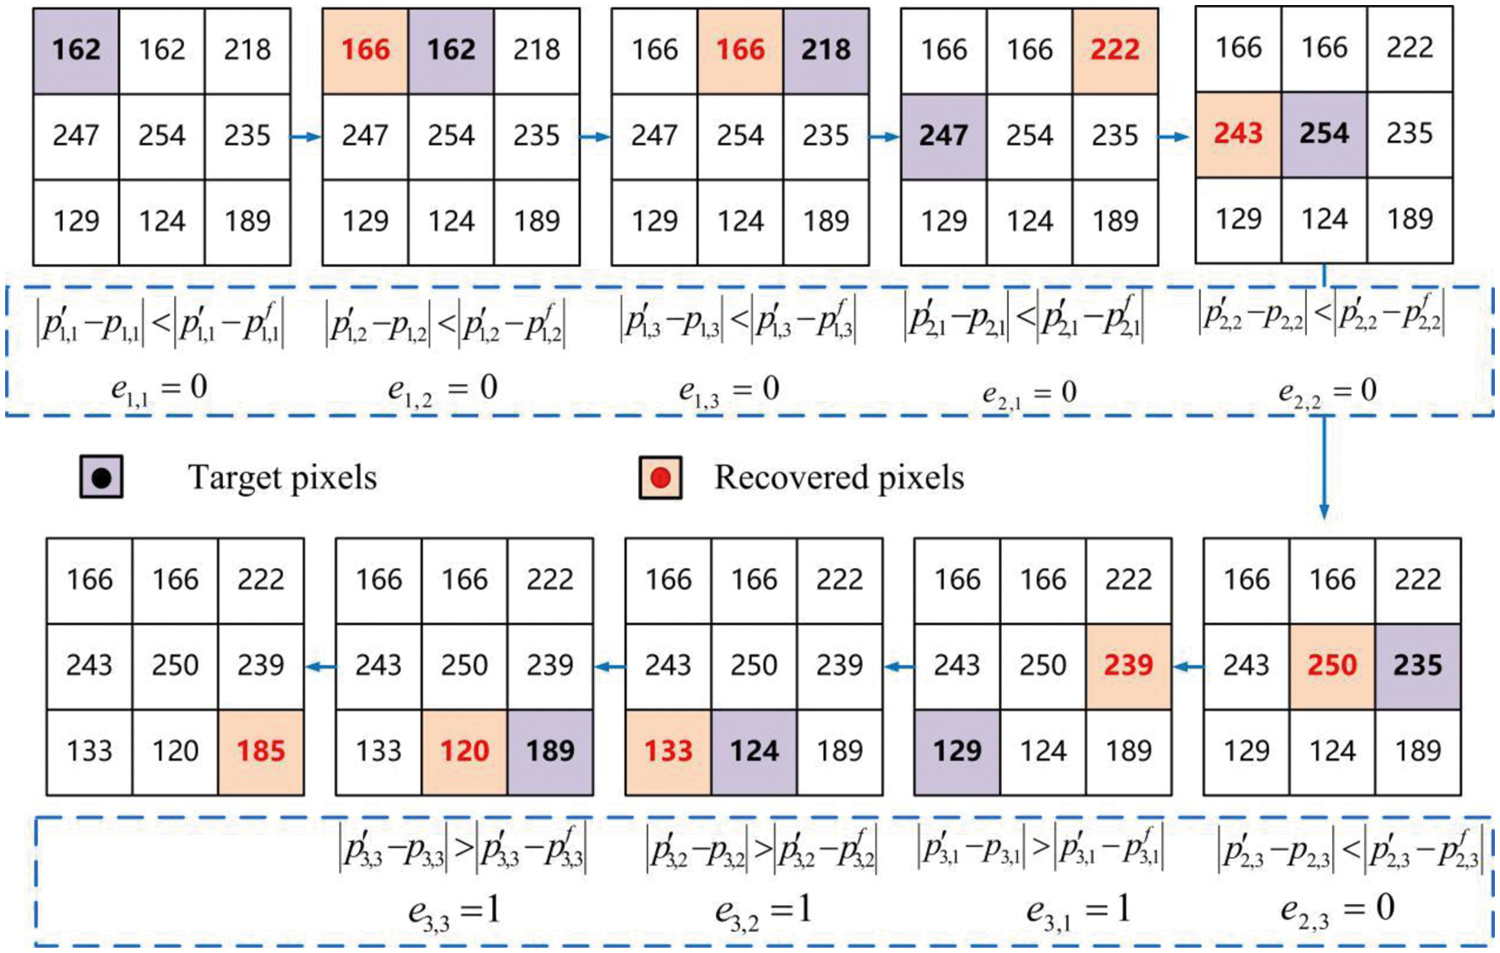
Figure 6: The process of recovering an image
4 Experimental Results and Analysis
In this section, we use the proposed method to experiment on six RDH classic images as shown in Fig. 7, and two grayscale data sets: BOSSBase [24], BOWS2, and an RGB (red green and blue channels) data set UDIC (uncompressed color image database) [25]. It is worth mentioning that the RDH classic image, the dataset BOSSBase, and BOWS2 are all standard grayscale images with a size of 512 × 512, and the BOSSBase and BOWS2 datasets are natural datasets with 10,000 grayscale images. The UDIC dataset is a dataset of 1338 RGB images with a size of 384 × 512.
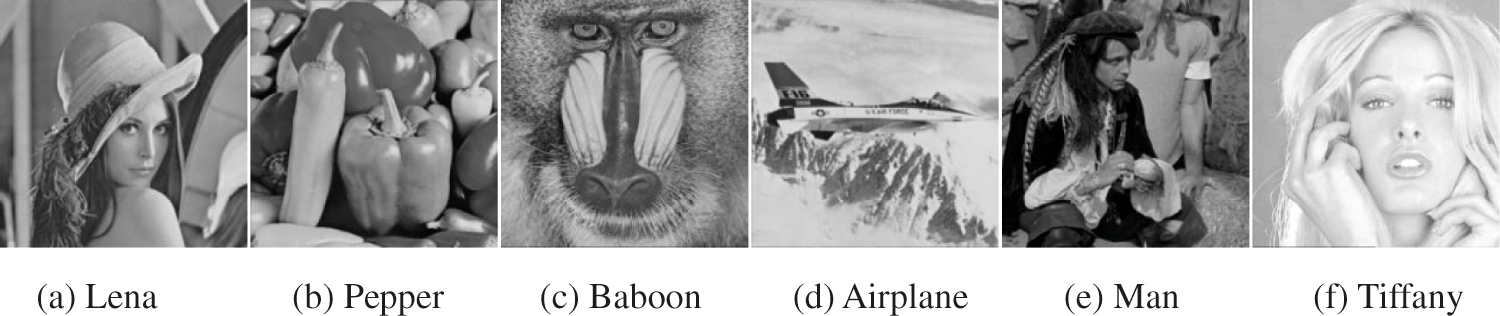
Figure 7: Six standard test images
We took Baboon and Airplane as examples to demonstrate the reversibility, as shown in Fig. 8. In particular, we also analyze the reversibility of the color image data set (UDIC) by converting the color image into a grayscale image (3 channels (RGB) into one channel), as shown in Fig. 9.
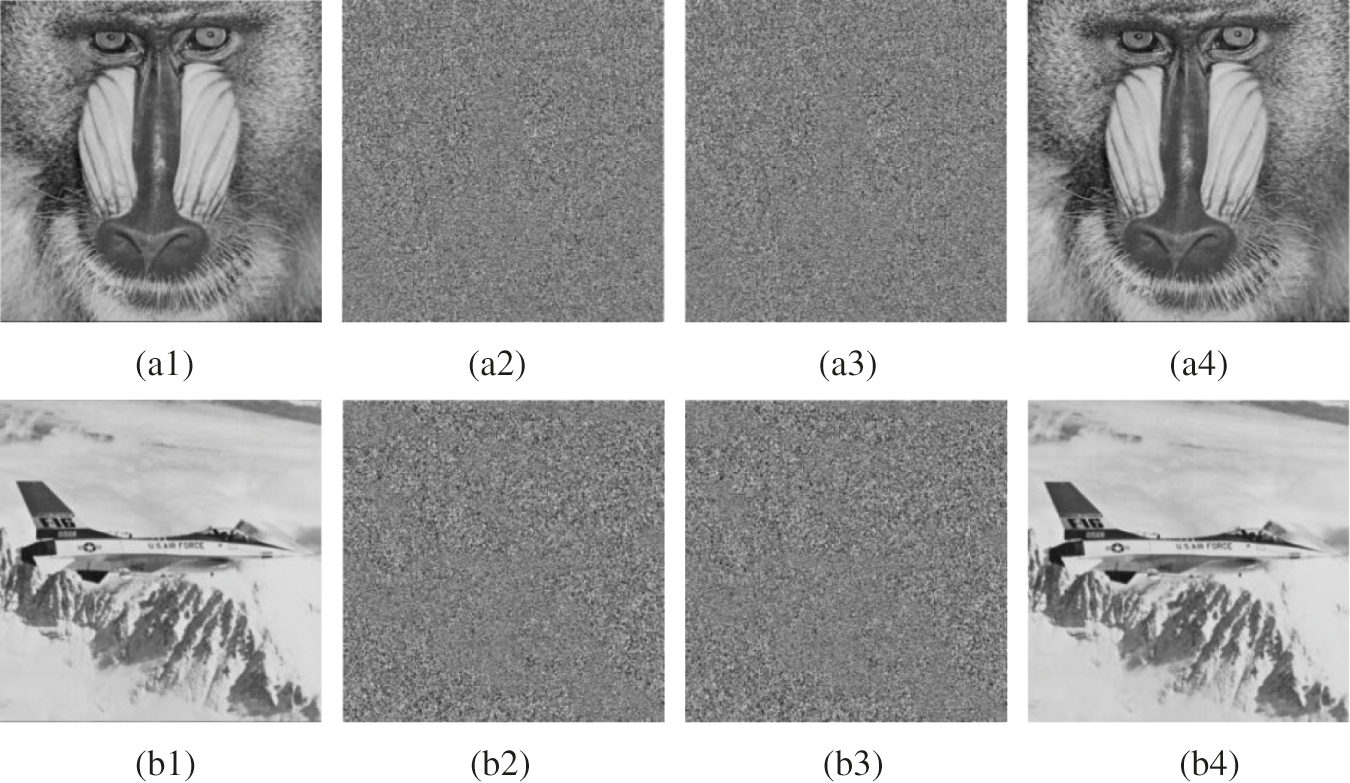
Figure 8: The resulting distribution images: (a1), (b1): original gray image, (a2), (b2): encrypted image, (c1), (c2): encrypted image with secret data, (d1), (d2): reconstructed image
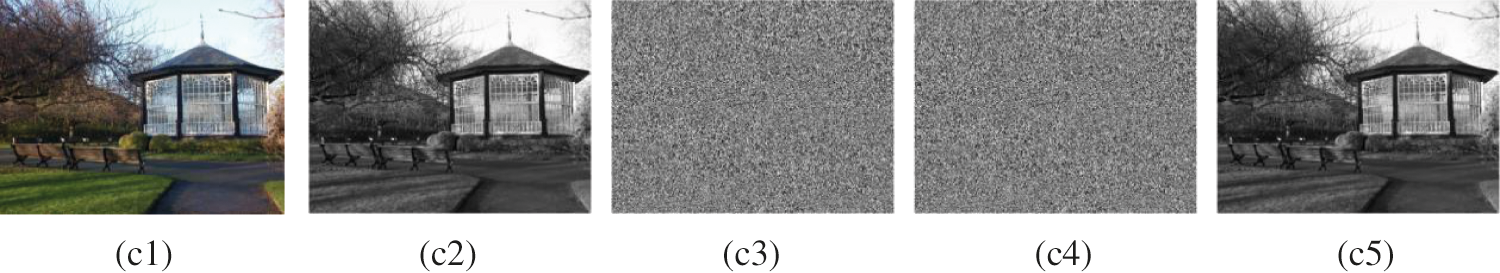
Figure 9: The resulting distribution images: (c1): original RGB image, (c2): grayscaled original image, (c3): encrypted image, (c4): encrypted image with secret data, (c5): reconstructed image
In terms of the reversibility of the algorithm, it can be seen from the experimental results of Figs. 8 and 9 that the test image is invisible during the transmission process, and the restored carrier image has a better effect, and the abnormality cannot be detected in the human visual range.
The experimental results in Tab. 1 show that the threshold T is obtained by the iterative adaptive threshold method introduced in Section 3.2. It is compared with the T directly taking the mean or variance of the local complexity.
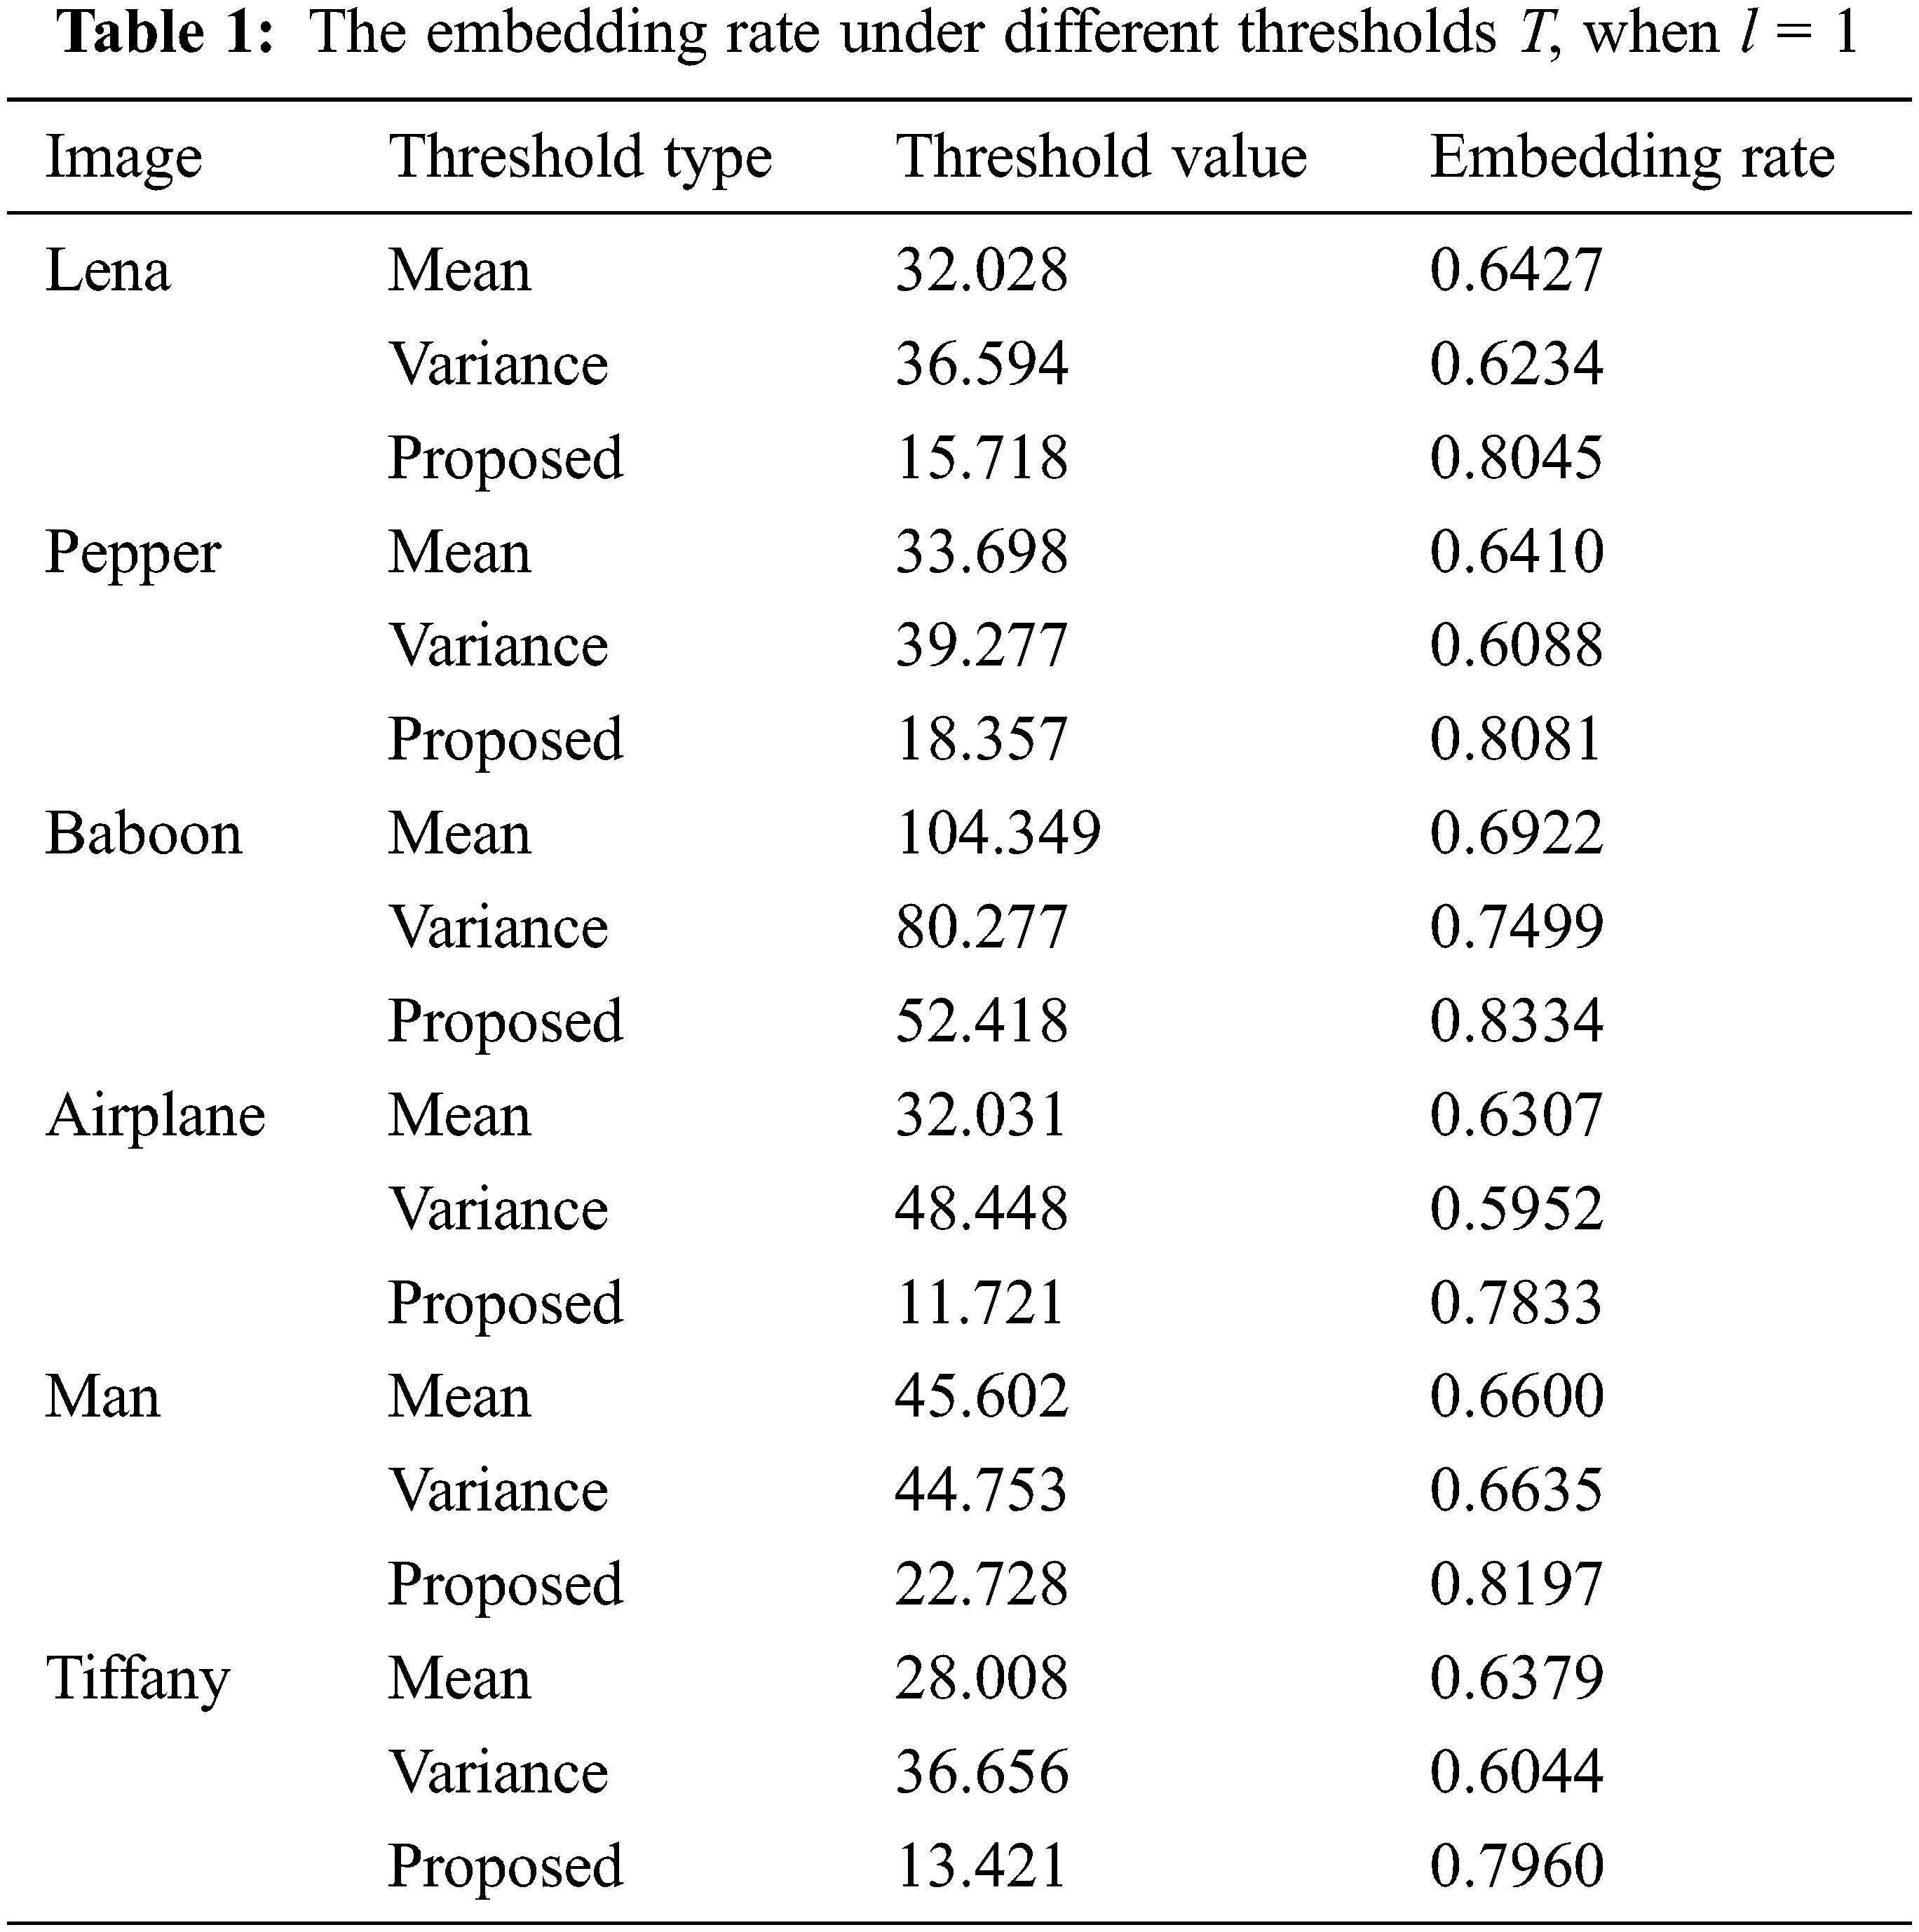
It can be seen from the comparison results in Tab. 1 that the embedding rate obtained by using the adaptive threshold estimation algorithm is significantly higher than when the threshold is set to the mean or variance of the local complexity. Among them, Baboon’s pixels are more complex and the effect is the most obvious.
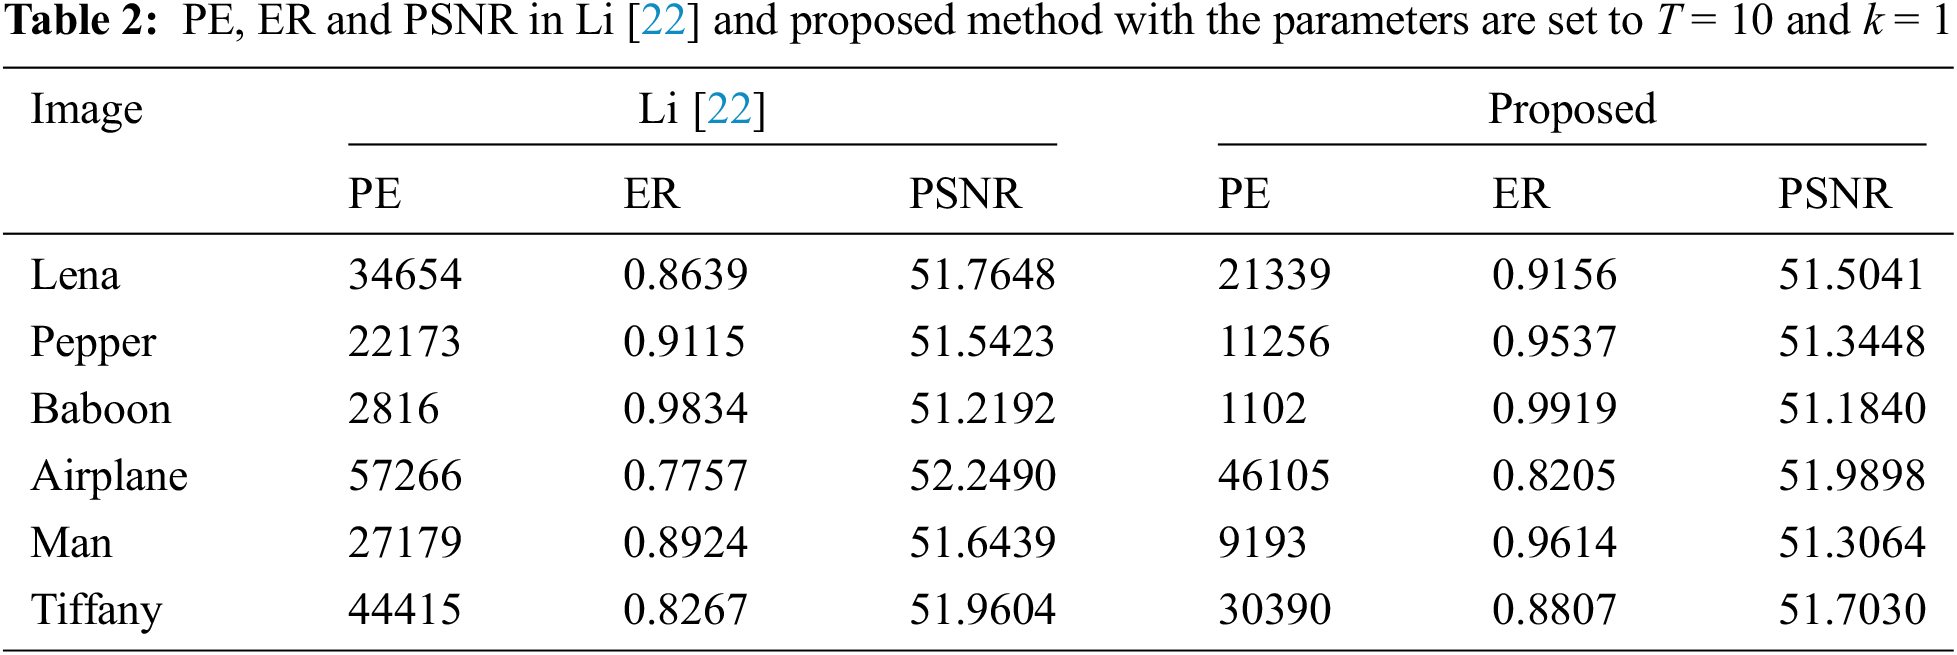
Peak signal to noise ratio (PSNR) [26] is an evaluation index applied between the original image and the decrypted image containing secret data. The larger the value of PSNR, the smaller the distortion. The calculation process is shown in Eqs. (11) and (12). Among them, MSE (mean square error) is the mean square error, the original image size is M × N, the decrypted image containing secret data is defined as K, MAXI represents the maximum value of the image point pixel, if each sampling point is represented by 8 bits, so MAXI is 255.
It can be seen from the comparative experimental results in Tab. 2 that, taking Lena as an example, compared with the scheme in [22], our proposed scheme reduces the prediction error by 13,315, and the embedding rate increases from 0.8639 to 0.9156. It is worth mentioning that the increase in the embedding rate will lead to a decrease in image quality, but from the experimental results, the PSNR is not reduced much, which is within the acceptable range of visual quality.
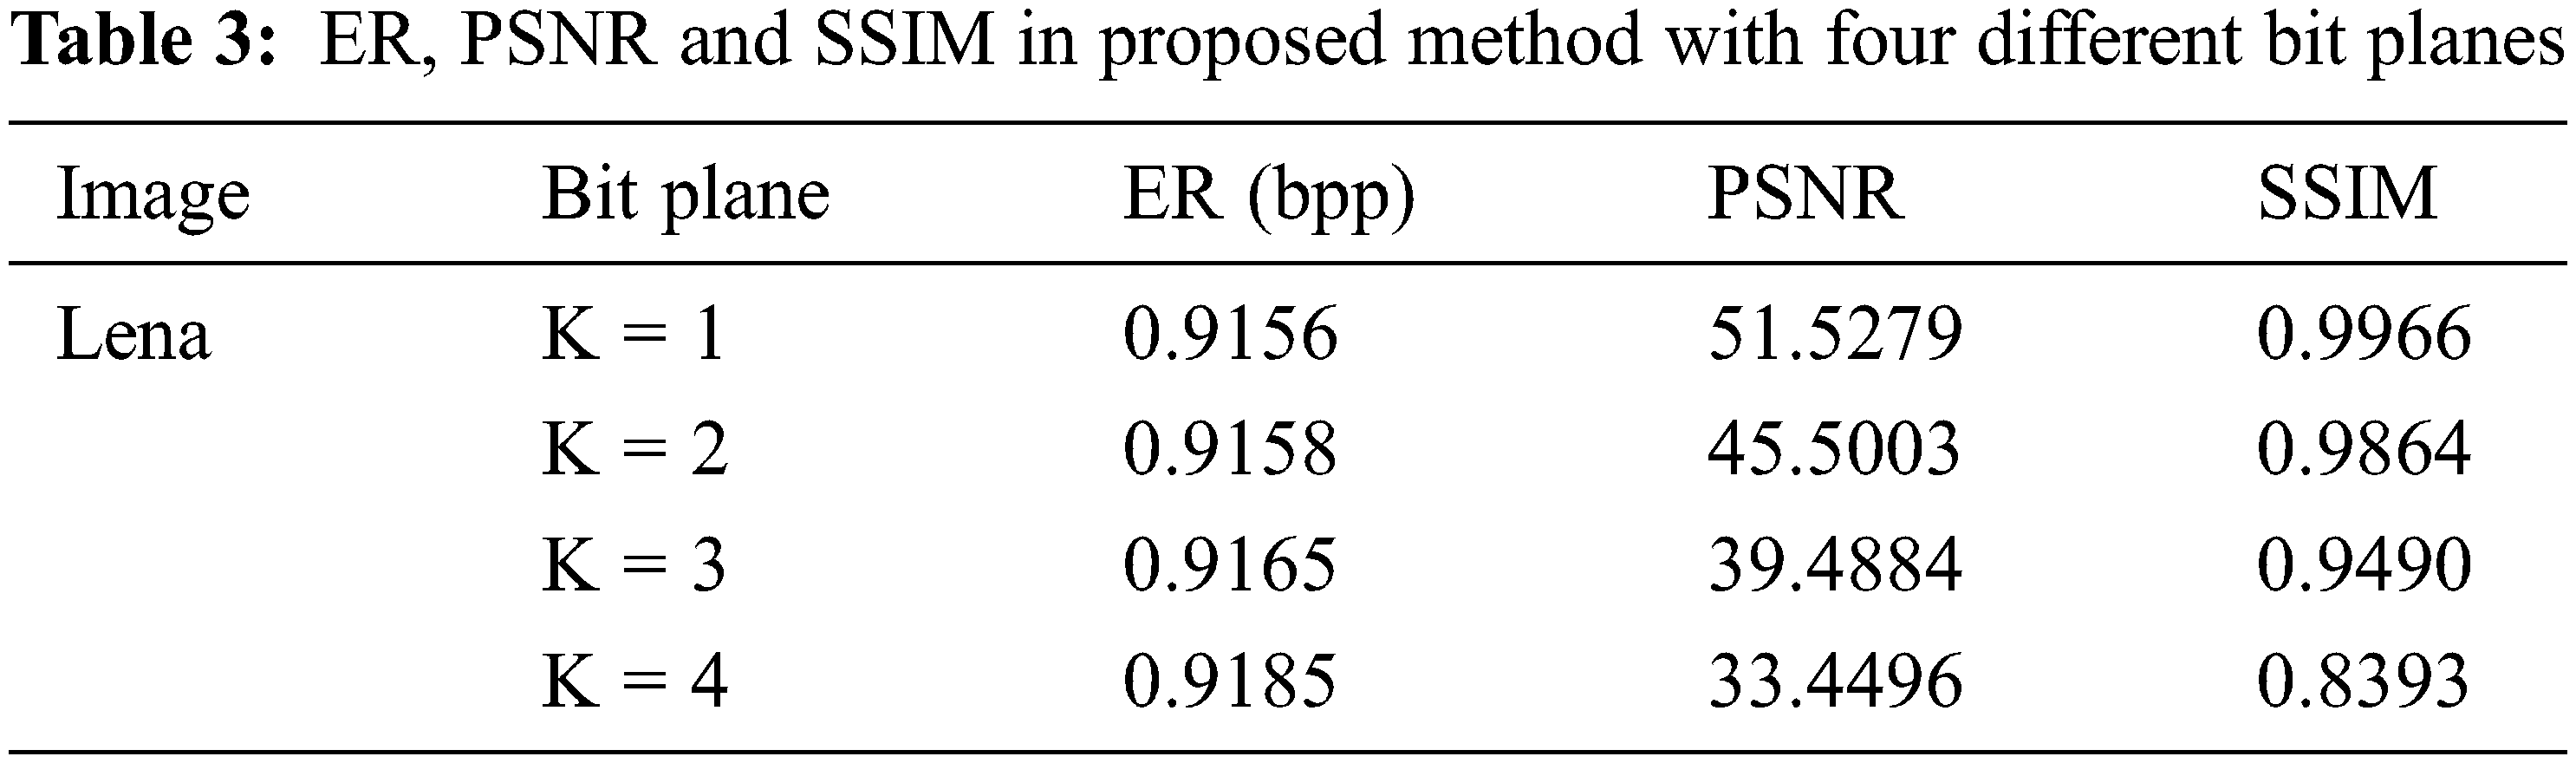
SSIM (structural similarity index) [27–29] calculation formula is shown in Eq. (13).
where μx, μy represents the average value of the two image pixels, σx, σy represents the standard deviation, and c1, c2 is a constant to avoid system errors caused by the denominator being 0. SSIM is a number between 0 and 1. When the two images are the same, then SSIM = 1.
The four evaluation indicators of the four-bit planes of image Lena after using the iterative adaptive threshold are shown in Tab. 3. From the experimental results, we can see that the embedding rate of each image is maintained at about 0.9 bpp, which shows the effectiveness of the method. In addition, we find that when bit plane l = 4, PSNR, and SSIM significantly decrease. However, when bit plane l = 1,2,3, each image can obtain a high embedding rate and excellent decrypted image visual effects.
For different RDH schemes, the performance of each algorithm is different. Therefore, we compared our proposed scheme with schemes [22] and [30]. The experimental results are shown in Fig. 10, and the embedding capacity is compared with the quality of the restored image (PSNR).
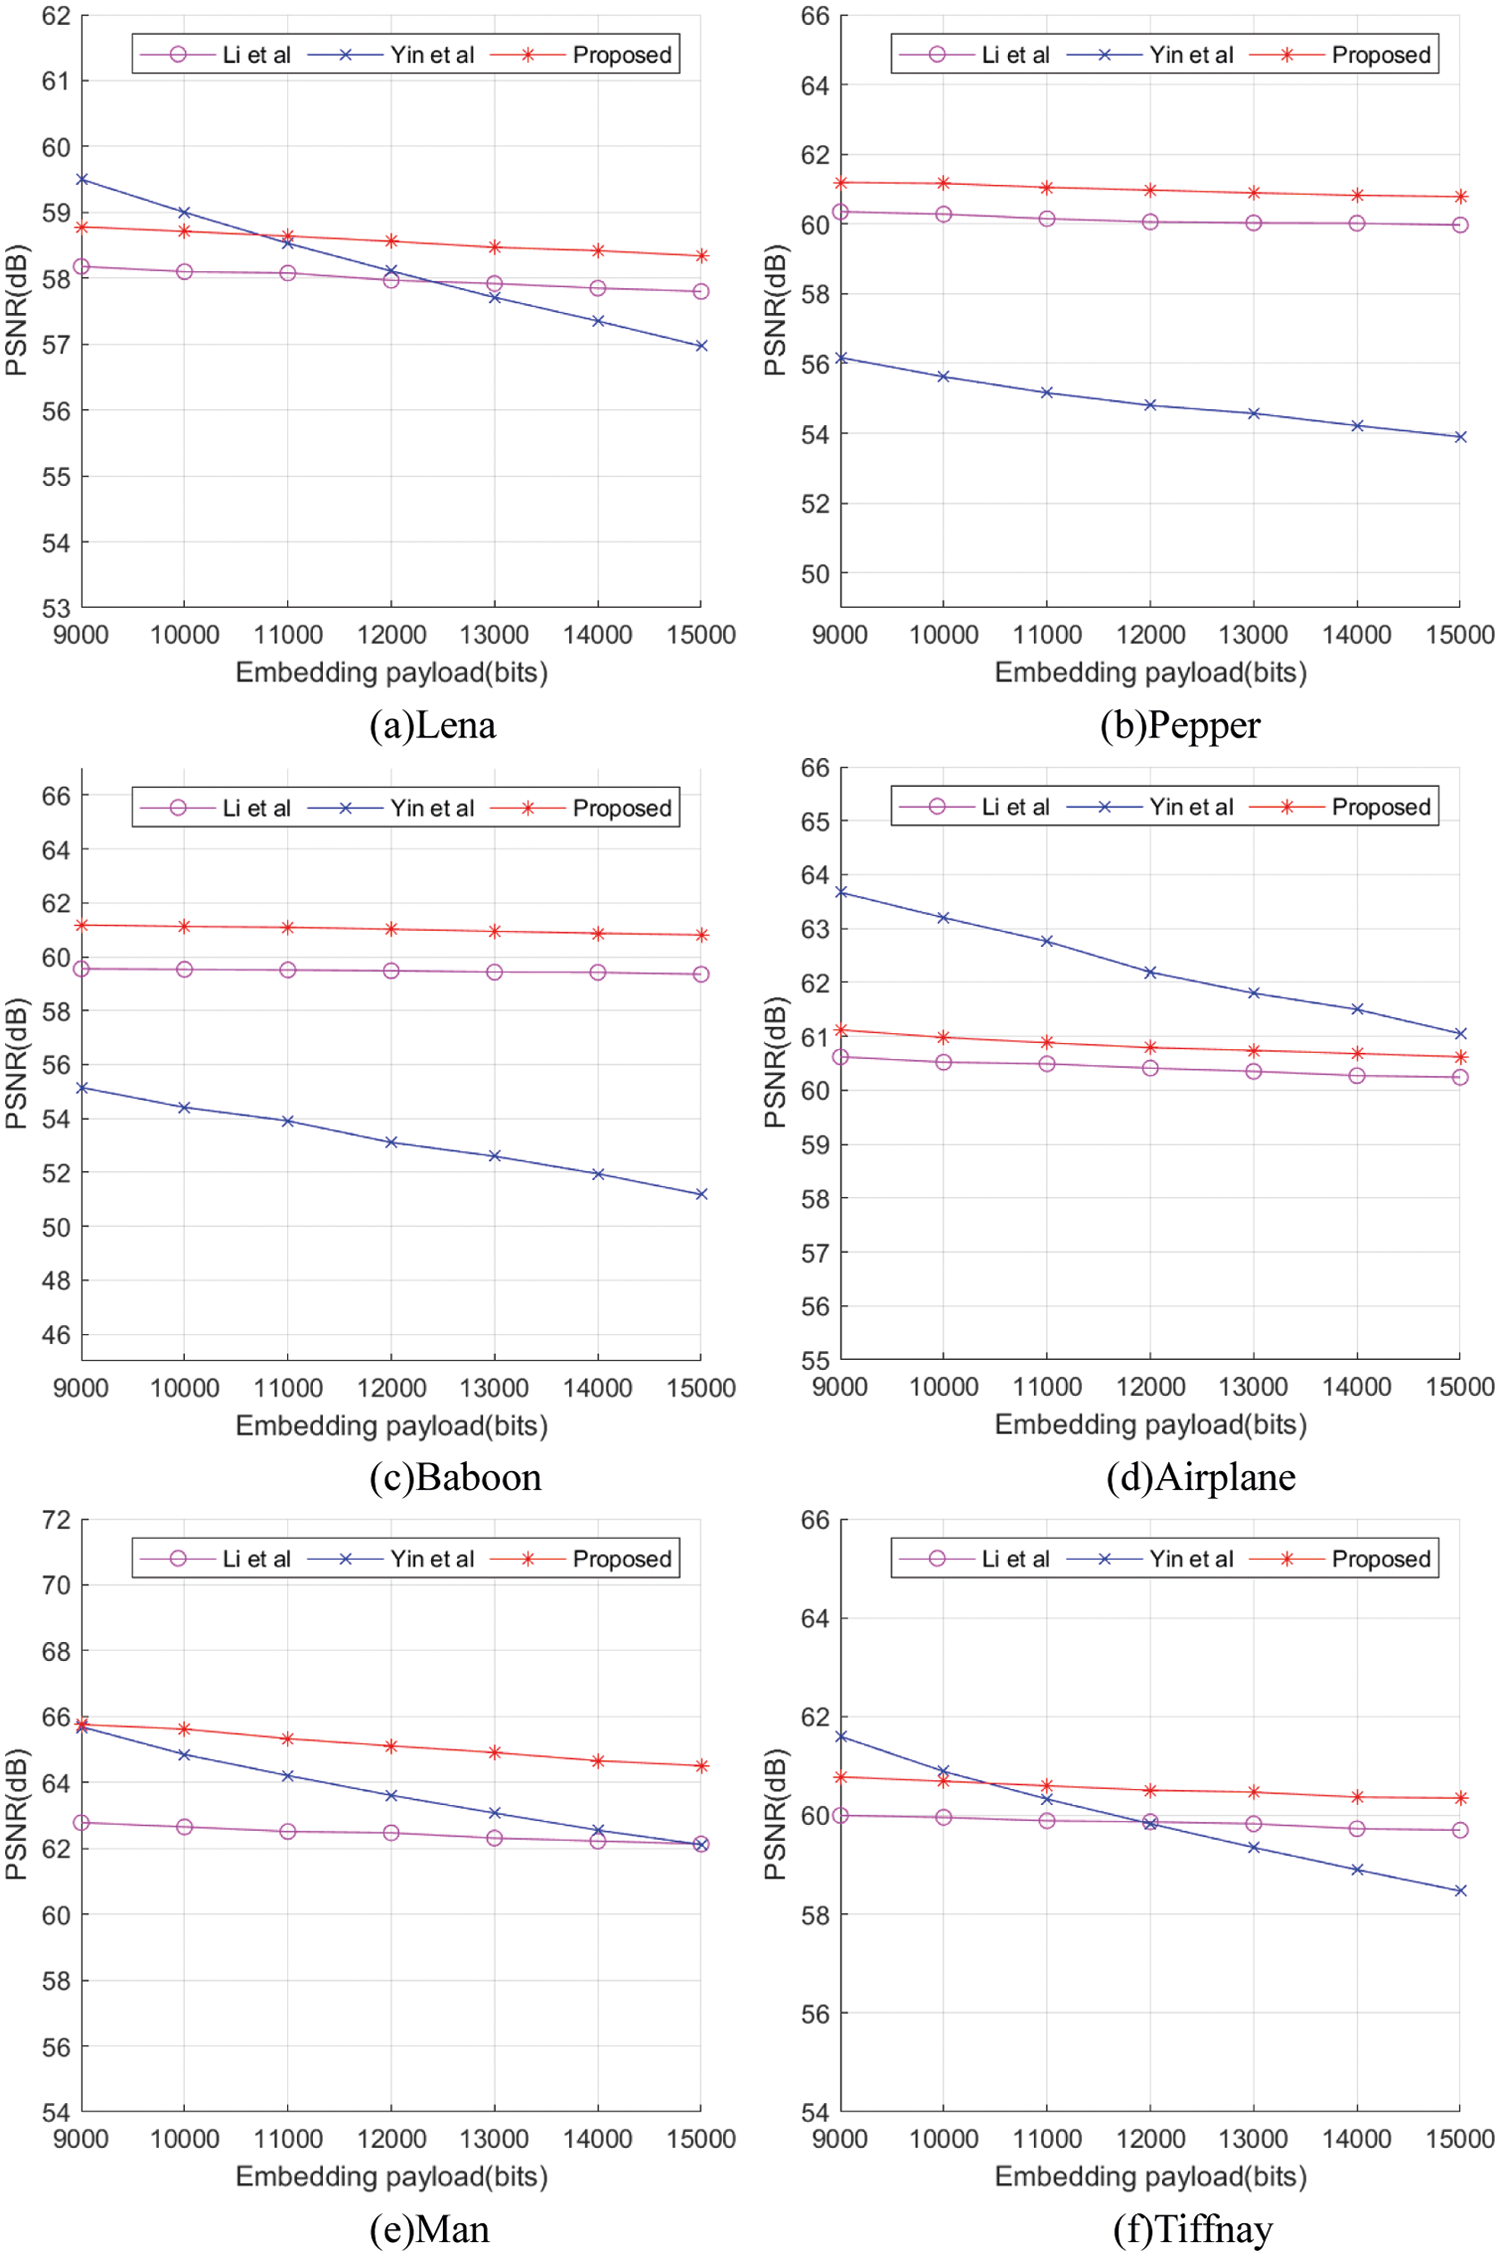
Figure 10: Performance comparison between proposed work and the methods introduced by Li et al. [22] and Yin et al. [30]
It can be seen from the experimental results that, besides Airplane, our proposed scheme is better than the schemes [22] and [30] in other test images. Airplane image performance is not as good as the scheme [30] due to large changes in the background area, but due to the existing linear prediction scheme [22]. In addition, the PSNR under high embedding rate is greater than the visual perception value of 35 dB, so the overall result is positive.
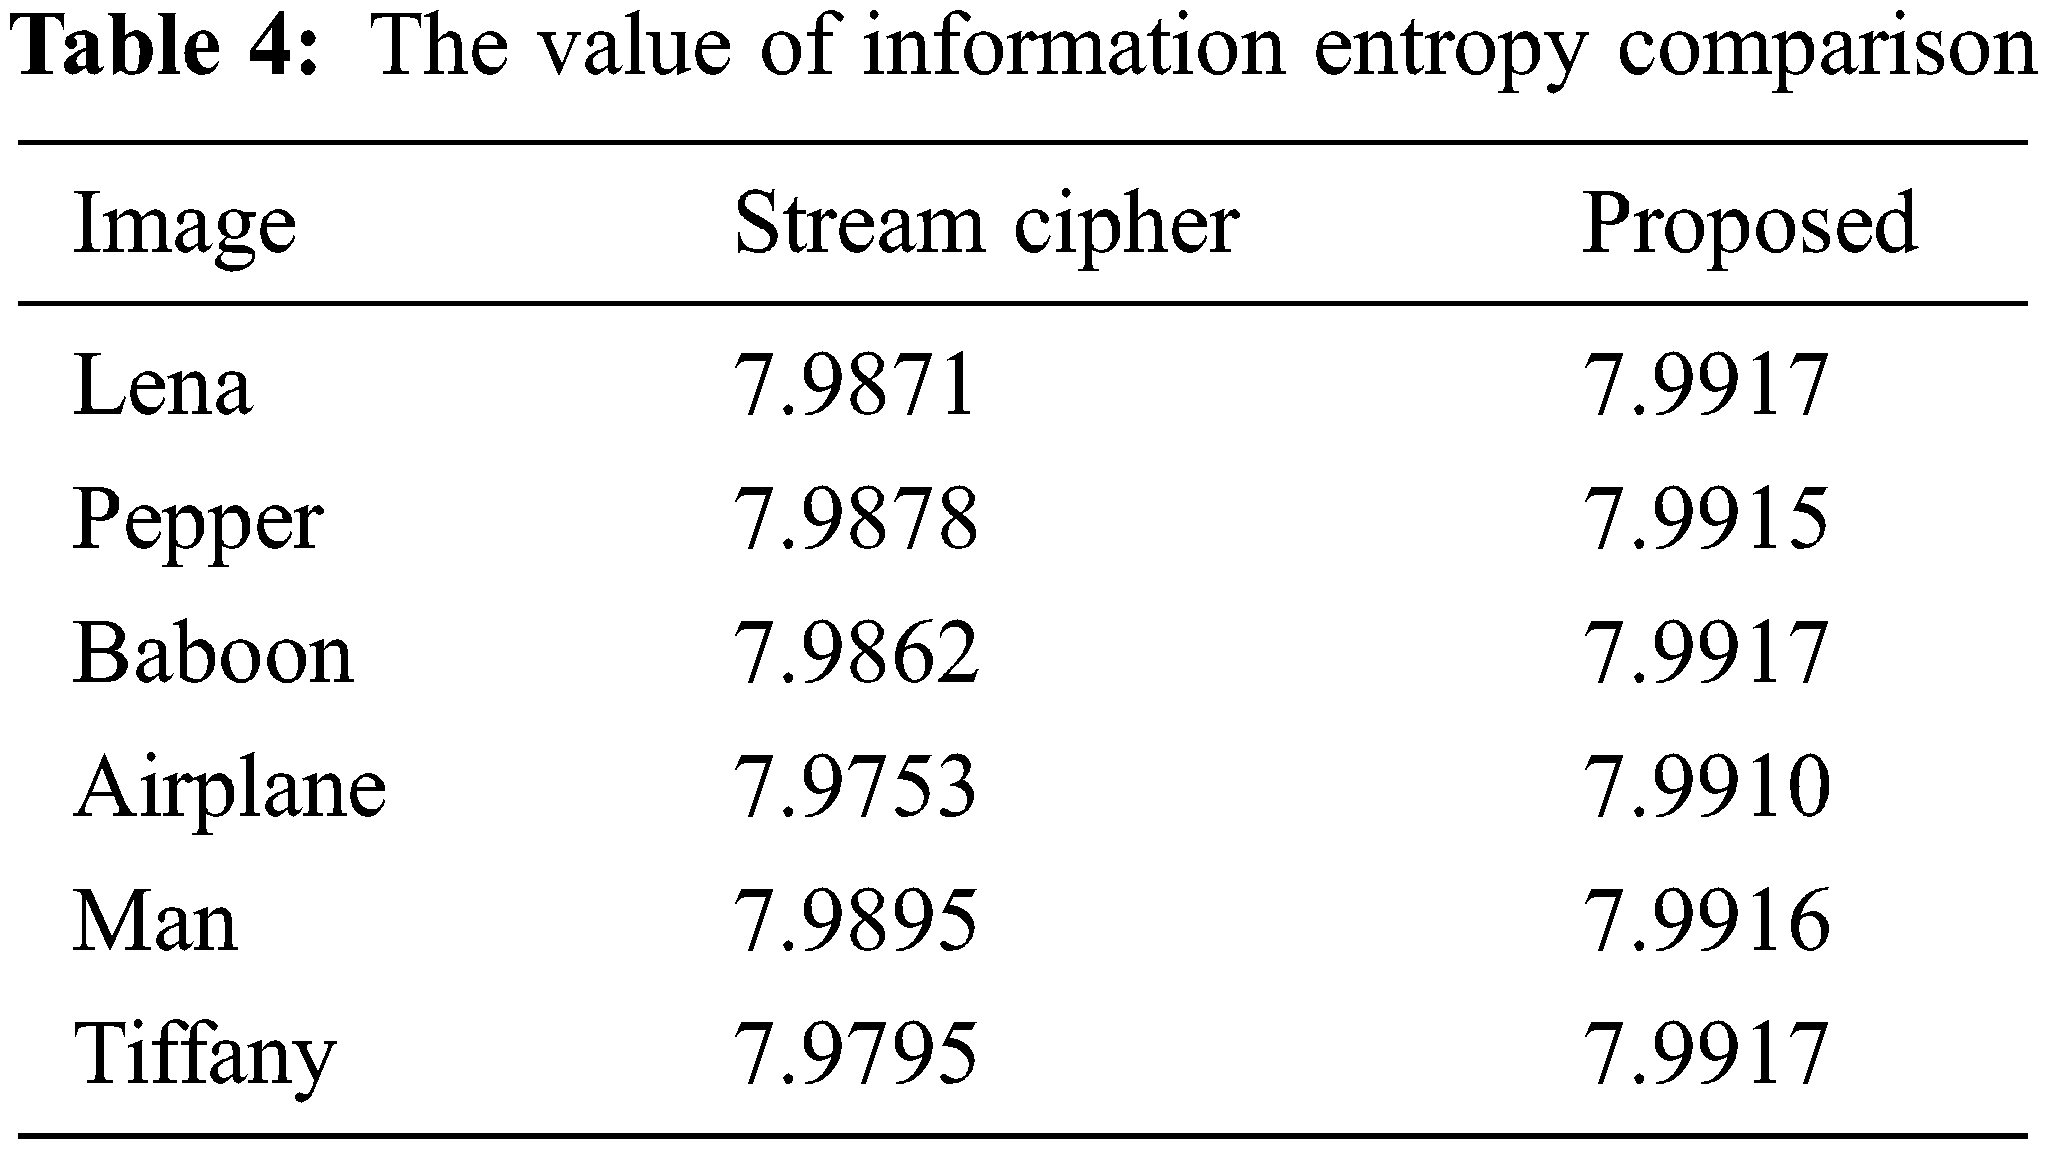
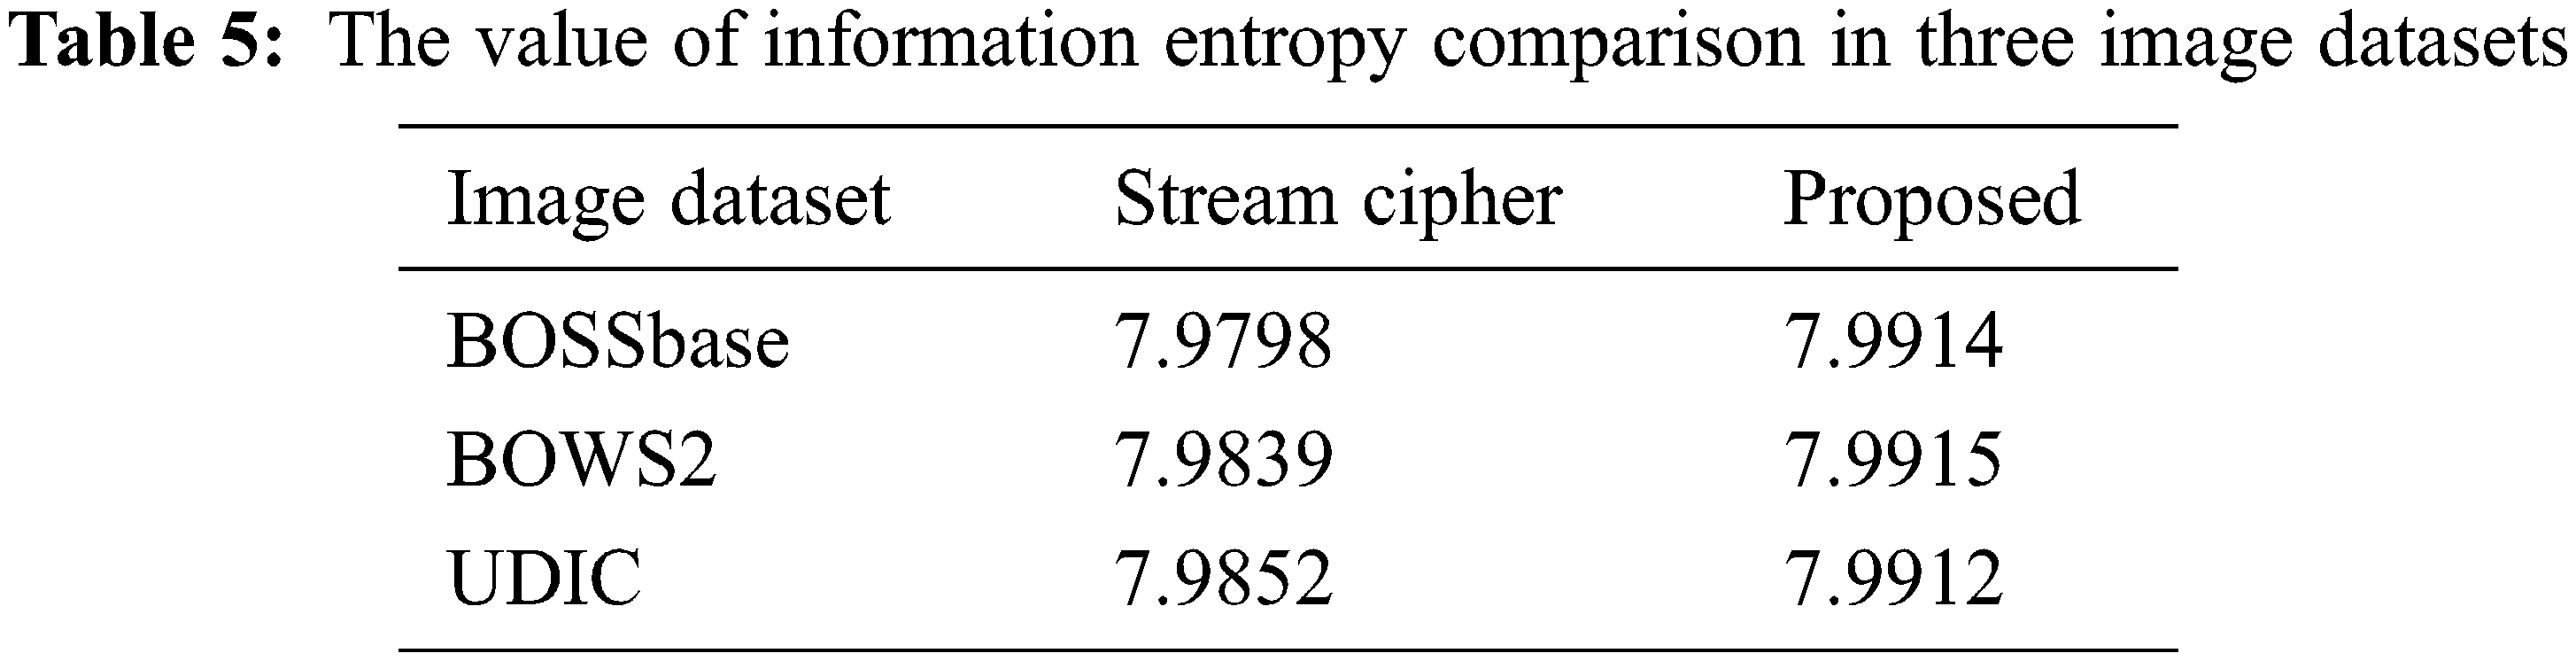
Information entropy is a concept of purity, that is: the smaller the information entropy, the greater the purity. The calculation of information entropy is shown in Eq. (14), where P(x) represents the proportion of x pixels and 0 ≤ n ≤ 256. Therefore, for an image with a gray level of 256, the maximum value of information entropy is 8. Therefore, the closer the encrypted image information entropy is to 8, the better the encryption effect.
From the perspective of information entropy, the experimental results are shown in Tabs. 4 and 5 And our approach is closer to the theoretical maximum information entropy of 8, so it shows that our method has better encryption performance.
In this paper, a new RDHEI method based on adaptive prediction-error label map is proposed. This method uses the local complexity of the image to perform the adaptive threshold estimation through preprocessing operations and combines gradient of image to propose a pixel selection strategy, which solves the problem of linear regression prediction that is sensitive to outliers and obtains stable prediction parameters. In addition, by flipping the LSB, the auxiliary information and secret data are embedded in the image and then encrypted image, which makes better use of the pixel correlation of the original image. Experiments and analysis show that this method can not only restore the original image perfectly but also has a high embedding rate. In future work, we hope to further optimize the algorithm to reduce the time complexity, thereby improving the efficiency of the algorithm.
Acknowledgement: The author would like to thank the support of Central South University of Forestry & Technology and the support of the National Science Fund of China.
Funding Statement: This project is supported by the National Natural Science Foundation of China (61772561, 62002392); Hunan Provincial Postgraduate Excellent Teaching Team Project ([2019] 370-133); Hunan Provincial Natural Science Foundation General Project (2020JJ4141, 2020JJ4140).
Conflicts of Interest: The authors declare that they have no conflicts of interest to report regarding the present study.
1. Z. C. Wang, G. R. Feng, Y. L. Ren and X. P. Zhang, “Multichannel steganography in digital images for multiple receivers,” IEEE Multimedia, vol. 28, no. 1, pp. 65–73, 2021. [Google Scholar]
2. N. Agarwal, A. K. Singh and P. K. Singh, “Survey of robust and imperceptible watermarking,” Multimedia Tools and Applications, vol. 78, no. 7, pp. 8603–8633, 2019. [Google Scholar]
3. J. Fridrich, M. Goljan and D. Rui, “Lossless data embedding for all image formats,” Spie Security & Watermarking of Multimedia Contents IV, vol. 4675, pp. 572–583, 2002. [Google Scholar]
4. M. U. Celik, G. Sharma, A. M. Tekalp and E. Saber, “Lossless generalized-LSB data embedding,” IEEE Transactions on Image Processing, vol. 12, no. 2, pp. 253–266, 2005. [Google Scholar]
5. M. U. Celik, G. Sharma and A. M. Tekalp, “Lossless watermarking for image authentication: A new framework and an implementation,” IEEE Transactions on Image Processing, vol. 15, no. 4, pp. 1042–1049, 2006. [Google Scholar]
6. W. M. Zhang, X. C. Hu, X. L. Li and N. H. Yu, “Recursive histogram modification: Establishing equivalency between reversible data hiding and lossless data compression,” IEEE Transactions on Image Processing, vol. 22, no. 7, pp. 2775–2785, 2013. [Google Scholar]
7. Y. J. Jia, Z. X. Yin, X. P. Zhang and Y. L. Luo, “Reversible data hiding based on reducing invalid shifting of pixels in histogram shifting,” Signal Processing, vol. 163, no. 10, pp. 238–246, 2019. [Google Scholar]
8. Y. Q. Qiu, Z. X. Qian and L. Yu, “Adaptive reversible data hiding by extending the generalized integer transformation,” IEEE Signal Processing Letters, vol. 23, no. 1, pp. 130–134, 2016. [Google Scholar]
9. J. Tian, “Reversible data embedding using a difference expansion,” IEEE Transactions on Circuits and Systems for Video Technology, vol. 13, no. 8, pp. 890–896, 2003. [Google Scholar]
10. X. C. Cao, L. Du, X. X. Wei, D. Meng and X. J. Guo, “High capacity reversible data hiding in encrypted images by patch-level sparse representation,” IEEE Transactions on Cybernetics, vol. 46, no. 5, pp. 1132–1143, 2016. [Google Scholar]
11. K. M. Chen and C. C. Chang, “High-capacity reversible data hiding in encrypted images based on extended run-length coding and block-based MSB plane rearrangement,” Journal of Visual Communication and Image Representation, vol. 58, no. 3, pp. 334–344, 2018. [Google Scholar]
12. P. Puteaux and W. Puech, “An efficient MSB prediction-based method for high-capacity reversible data hiding in encrypted images,” IEEE Transactions on Information Forensics and Security, vol. 13, no. 7, pp. 1670–1681, 2018. [Google Scholar]
13. X. P. Zhang, “Reversible data hiding in encrypted image,” IEEE Signal Processing Letters, vol. 18, no. 4, pp. 255–258, 2011. [Google Scholar]
14. X. P. Zhang, Z. X. Qian, G. R. Feng and Y. L. Ren, “Efficient reversible data hiding in encrypted images,” Journal of Visual Communication and Image Representation, vol. 25, no. 2, pp. 322–328, 2014. [Google Scholar]
15. S. M. Lu, X. F. Liao, N. K. Mu, J. H. Wu and J. Q. Le, “Reversible data hiding based on improved rhombus prediction method,” in 2019 Tenth Int. Conf. on Intelligent Control and Information Processing (ICICIP), Marrakesh, Morocco, pp. 1–6, 2019. [Google Scholar]
16. R. W. Hu and S. J. Xiang, “CNN prediction based reversible data hiding,” IEEE Signal Processing Letters, vol. 28, pp. 464–468, 2021. [Google Scholar]
17. H. S. Chen, J. Q. Ni, W. E. Hong and T. S. Chen, “High-fidelity reversible data hiding using directionally enclosed prediction,” IEEE Signal Processing Letters, vol. 24, no. 5, pp. 574–578, 2017. [Google Scholar]
18. A. Mohammadi, M. Nakhkash and M. A. Akhaee, “A high-capacity reversible data hiding in encrypted images employing local difference predictor,” IEEE Transactions on Circuits and Systems for Video Technology, vol. 30, no. 8, pp. 2366–2376, 2020. [Google Scholar]
19. L. Chu, H. W. Wu, Y. L. Zeng and X. Tang, “Improved weighted average-based rhombus predictor in reversible data hiding using prediction error expansion,” in 2021 IEEE 6th Int. Conf. on Computer and Communication Systems (ICCCS), Chengdu, China, pp. 6–11, 2021. [Google Scholar]
20. T. X. Li, Y. Ke, M. Q. Zhang, Y. Lei and Y. Ding, “High-fidelity reversible data hiding using dynamic prediction and expansion,” Journal of Electronic Imaging, vol. 28, no. 1, pp. 1, 2019. [Google Scholar]
21. K. M. Chen and C. C. Chang, “Error-free separable reversible data hiding in encrypted images using linear regression and prediction error map,” Multimedia Tools and Applications, vol. 78, no. 22, pp. 31441–31465, 2019. [Google Scholar]
22. F. Y. Li, H. J. Zhu, J. Yu and C. Qin, “Double linear regression prediction based reversible data hiding in encrypted images,” Multimedia Tools and Applications, vol. 80, pp. 1–19, 2020. [Google Scholar]
23. S. J. Yan and Z. P. Yu, “Gray image encryption algorithm based on chaotic sequences of Logistic,” Computer Engineering and Applications, vol. 44, no. 36, pp. 179–182, 2008. [Google Scholar]
24. P. Bas, T. Filler and T. Pevný, “Break our steganographic system: The ins and outs of organizing BOSS,” in Information Hiding—13th Int. Conf., Prague, Czech Republic, pp. 18–20, 2011. [Google Scholar]
25. G. Schaefer and M. Stich, “UCID: An uncompressed color image database,” in Storage and Retrieval Methods and Applications for Multimedia 2004 Int. Society for Optics and Photonics, Beijing, China, pp. 472–480, 2003. [Google Scholar]
26. A. Horé and D. Ziou, “Image quality metrics: PSNR vs. SSIM,” in 2010 20th Int. Conf. on Pattern Recognition, Istanbul, Turkey, pp. 2366–2369, 2010. [Google Scholar]
27. C. H. Fu, R. Duan and E. Kayacan, “Visual tracking with online structural similarity-based weighted multiple instance learning,” Information Sciences, vol. 481, no. 8, pp. 292–310, 2019. [Google Scholar]
28. Y. J. Lu, “The level weighted structural similarity loss: A step away from the MSE,” in Proc. of the AAAI Conf. on Artificial Intelligence, Hawaii, USA, vol. 33, pp. 9989–9990, 2019. [Google Scholar]
29. Y. B. Tong, Q. S. Zhang and Y. P. Qi, “Image quality assessing by combining PSNR with SSIM,” Journal of Image and Graphics, vol. 12, pp. 1758–1763, 2006. [Google Scholar]
30. Y. J. Jia, Z. X. Yin, X. P. Zhang and Y. L. Luo, “Reversible data hiding based on reducing invalid shifting of pixels in histogram shifting,” Signal Processing, vol. 163, no. 10, pp. 238–246, 2019. [Google Scholar]
 | This work is licensed under a Creative Commons Attribution 4.0 International License, which permits unrestricted use, distribution, and reproduction in any medium, provided the original work is properly cited. |