DOI:10.32604/iasc.2022.022681
| Intelligent Automation & Soft Computing DOI:10.32604/iasc.2022.022681 | |
| Article |
Speech Quality Enhancement Using Phoneme with Cepstrum Variation Features
1Department of Computer Science and Engineering, Sona College of Technology, Salem, 636005, Tamil Nadu, India
2Department of Computer Science and Engineering, Kongu Engineering College, Perundurai, 638060, Tamil Nadu, India
3Department of Information Technology, E.G.S. Pillay Engineering College, Nagapattinam, 611002, Tamil Nadu, India
4Department of Computer Science and Engineering, Chitkara University Institute of Engineering and Technology, Rajpura, 140401, Punjab, India
*Corresponding Author: K. C. Rajeswari. Email: rajeswarikc@sonatech.ac.in
Received: 15 August 2021; Accepted: 26 October 2021
Abstract: In recent years, Text-to-Speech (TTS) synthesis is taking a new dimension. People prefer voice embedded toys, online buyers are interested in interactive chat application in the form of text-to-speech facility, screen readers for visually challenged people, and many more applications use TTS module. TTSis a system that is capable of converting the arbitrary text input into natural sounding speech. It’s success lies in producing more human like speech sounding more natural. The most importanttechnical aspect of TTS is feature extraction process. Both text and speech features are needed but it is not that easy to select meaningful and useful features from the text or from speech. There are many feature extraction techniques available for both text and speech, still there is a need for very simplest form of feature extraction technique. Though the emergence of Deep learning technique automates feature extraction, it is suitable only when the volume of data is enormous. This paper proposes a novel text and speech feature extraction technique which is based on special symbols present in the text and phoneme with cepstrum variation of the speech signal respectively. These techniques are simple and works well for real-time applications in which size of data is small or moderate. The proposed methods not only extract useful features but also meaningful features in terms of fetching the salient traits of the text and speech cepstrum. The experimental results have shown that the quality of speech is increased by 14% when compared to the other conevntional feature extraction techniques.
Keywords: Speech synthesis; tamil TTS; feature extraction; prosody; intonation
Every language has its own grammar for the spoken and written form of text. Some languages may or may not differ in written and spoken form, but the spoken of Tamil differs from its written form. The written form of Tamil text is referred to as ‘Senthamizh’ and spoken form is referred as ‘Iyatramizh’. Most of the scholarly books, media, public speaking, official and Government writings use Senthamizh whereas Tamil speaking community uses Iyatramizh. The language also has diglossia that refers to the same language being spoken in more than one form with respect to region or community. The research work focuses only on Senthamizh because it is the script form of the language. It is necessary to concentrate on the syntax of the text or sentence specific to the language because the Parts of speech information are the building blocks of the language. Makawana et al., in a survey mention that parsing is one of the important tasks in natural language processing (NLP) [1]. Parsing provides information about the syntactical structure of the sentence. Sudhakar et al., adopted forward parsing technique for sentiment analysis for which intonation patterns is of high concern [2]. For example, English sentence keeps the verb in the middle of the sentence whereas Tamil sentence keeps the verb phrase at the end of the sentence.
The general structure of Tamil sentence is subject-object-verb. The object is preceded by the subject and the sentence is concluded by the verb. A valid Tamil sentence can be formed in any one of the following ways:
Sentence formed only with a verb. Example:  is a verb stating “It has happened” in English. Sentence formed with a subject and an object but not verb. Example:
  –“This is my nation” in English, verb is present in the sentence. Sentence formed with a subject, an object and a verb. Example:
  –“Ramu read the book” in English.
Since it is possible to form sentences without subject and object in Tamil, it is said to be a null-subject language. Tamil is a classical language and has undergone many transformations in spoken and written form over a period of 2,200 years. The written form of Tamil text is given by the oldest grammar book Tolkkappiyam  The present form of Tamil sentence structure has been prescribed by Nannul (
 ). The language is grammar rich and also agglutinative in nature. The word has one lexical root with or without suffixes. In spite of all these, any text will consists of many special characters or symbols. It is a very important element since it also conveys useful prosodic information and sometimes even pragmatic information. For example,
Statement 1  (Yesterday I got the garland)
Statement 2  (Yesterday evening, I got)
Though the sentences share the same set of words, they convey different meaning. The first statement conveys the message that “Yesterday I got the garland” whereas the second statement conveys “Yesterday evening I got”. In both the sentences,  is a noun, but conveys different meaning. In statement 1: means garland and in statement 2: means evening. The placement of special symbol “,” is responsible for the change in meaning of the sentences. It is evident from the simple example that, to incorporate appropriate prosody in the speech, such special symbols must be considered.
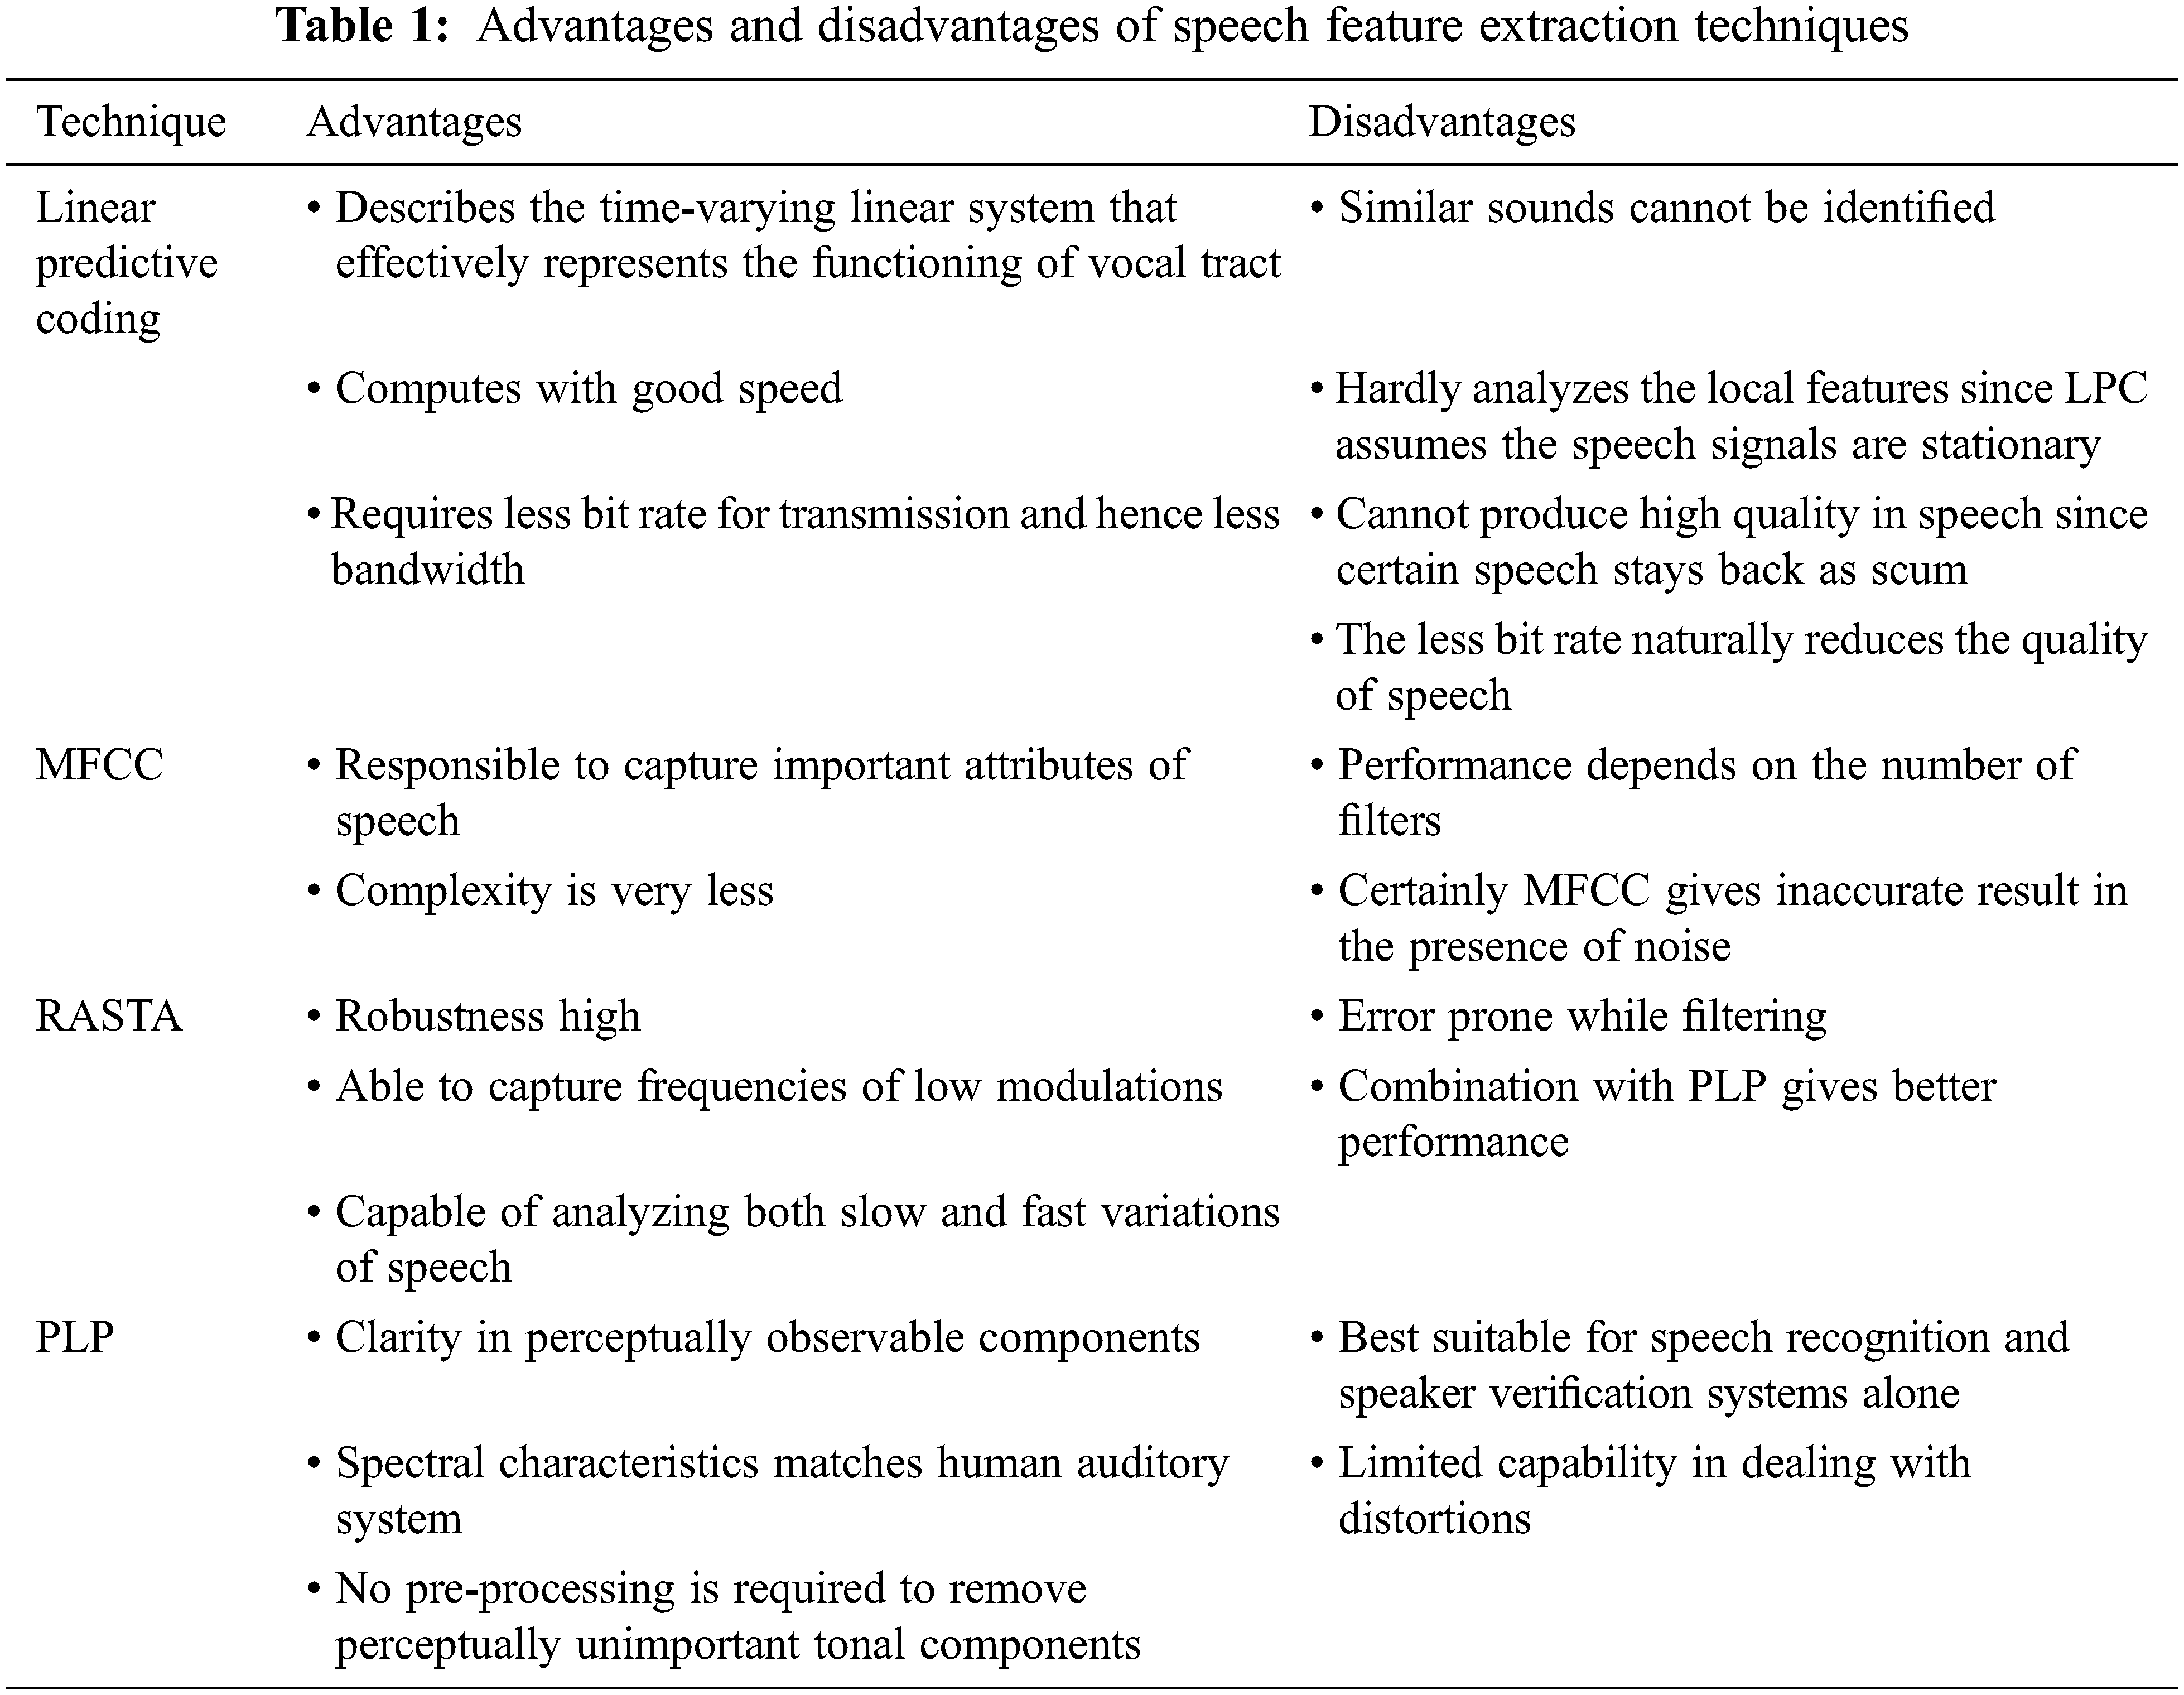
The purpose of speech feature extraction differs for various applications. In speech recognition application, the recognition performance greatly depends on the features extracted and it is also responsible for computing the features in sequence to be stored in vectors. In speech synthesis application, the features are used to analyze the short term spectrum of the signal, so that the modifications in prosody can be incorporated according to the features extracted. Pooja et al., have discussed many speech feature extraction techniques namely LPC, LPCC, MFCC, PLP, FFT, RASTA, and DWT [3]. Rajeswari et al., discussed the transformation based MFCC speech feature extractions [4]. Shreya et al., have reviewed various speech feature extraction methods and highlighted the merits and demerits as listed in the Tab. 1 [5].
All the research contributions for speech generation so far analyzed only any one of the features such as Linear prediction (LP), Mel frequency cepstral coefficients (MFCC), Linear predictive cepstral coefficients (LPCC), Fast Fourier transform (FFT), Discrete wavelet transform (DWT) and Guassian model (GM). Each of the mentioned techniques suffers from one amongst the problems like lack of time information; requirement of high sampling, problems related to shifts and sensitive to noise. The proposed work has modified the approach of analysis as FFT based enhanced MFCC spectral feature analysis, DWT based enhanced MFCC spectral feature analysis and FrFT based enhanced MFCC spectral feature analysis. The proposed feature choice takes into account this information to model the intonation component. The research work proposes “Function of intonation” as a feature extracted from text. The proposed approach provides a clear picture about the work of interest, i.e., pitch track, peak variations, depth and frequency variations, spectrum analysis through which improvement in quality of synthesized speech is ensured. Phoneme with Cepstrum Variation (PCV) is the novel speech feature extraction technique proposed. Redundant Kernel Learning (RKL) is a kind of machine learning approach used to perform further learning process.
2 Proposed Text Feature Extraction
The Tamil language is grammar rich, agglutinative in nature, that makes a real challenge in extracting the features from the text. The existing feature extraction methods by Akshay et al., had extracted horizontal and vertical curves or lines from the written form of text [6]. This is possible only when the text is presented in the image. Ramu Reddy et al., have proposed a two stage intonation model using neural networks to predict the F0 values of the syllables in a text [7]. Rizi Ahmed et al., in an investigation, highlight the possible differences in intonation patterns among Persian speaker’s English Interlanguage [8]. Romportl et al., have developed F0 model that depends on the position of the prosodic word present in the prosodic structure of the sentence [9]. The slope method and discrete wavelet transform method are the two most widely used methods to extract features from handwritten character and optical character. The proposed research work extracts the intonation function based features from the special symbols present in the text and the sentence is further classified as shown in the Tab. 2.

Fig. 1 shows the design of proposed intonation model. The Tamil input text is analyzed to classify the sentence into declarative, interrogative, exclamatory or others. This is achieved with the help of symbols present in the sentence. According to the table, if the symbols comma, semicolon, hyphenation or quotation is present, then the sentence is classified as declarative sentence. If the sentence is declarative, then the complexity of the sentence is analyzed. If the number of words present in the sentence does not exceed 10 and if there is no long vowel present in the last two words then it is considered as simple sentence otherwise complex sentence. A declination in the F0 (pitch) will be a suitable contour for the simple sentence and rise in F0 will be a suitable contour otherwise. If a question mark is present in the sentence, then it is classified as interrogative sentence. If an exclamation mark is present in the sentence then it is classified as exclamatory sentence. If the sentence is exclamatory, then the position or place of exclamation is analyzed and the word previous to the symbol must be assigned a rise in F0 contour. If there is no symbol present in the sentence, it is considered to be in others category. It is checked for the presence of long vowel in the words to raise F0, otherwise declination in F0 will be appropriate.

Figure 1: System design of text feature extraction
The intonation function includes attitude, grammar, focus, discourse, psychology and index terms along with the special symbols such as comma, semicolon, exclamation, question, hyphenation and quotation. The attitudinal intonation function is accountable for the emotions and attitude present in the phrase. The grammatical intonation function will clearly convey the difference in the structure of the phrase. The focus intonation function concentrates on the important elements present in the message. The discourse intonation function highlights the importance of subordinate clause rather than the main clause. The psychological intonation function gives importance to the perceivable units of the message. The indexical intonation function considers one’s social identity in a group.
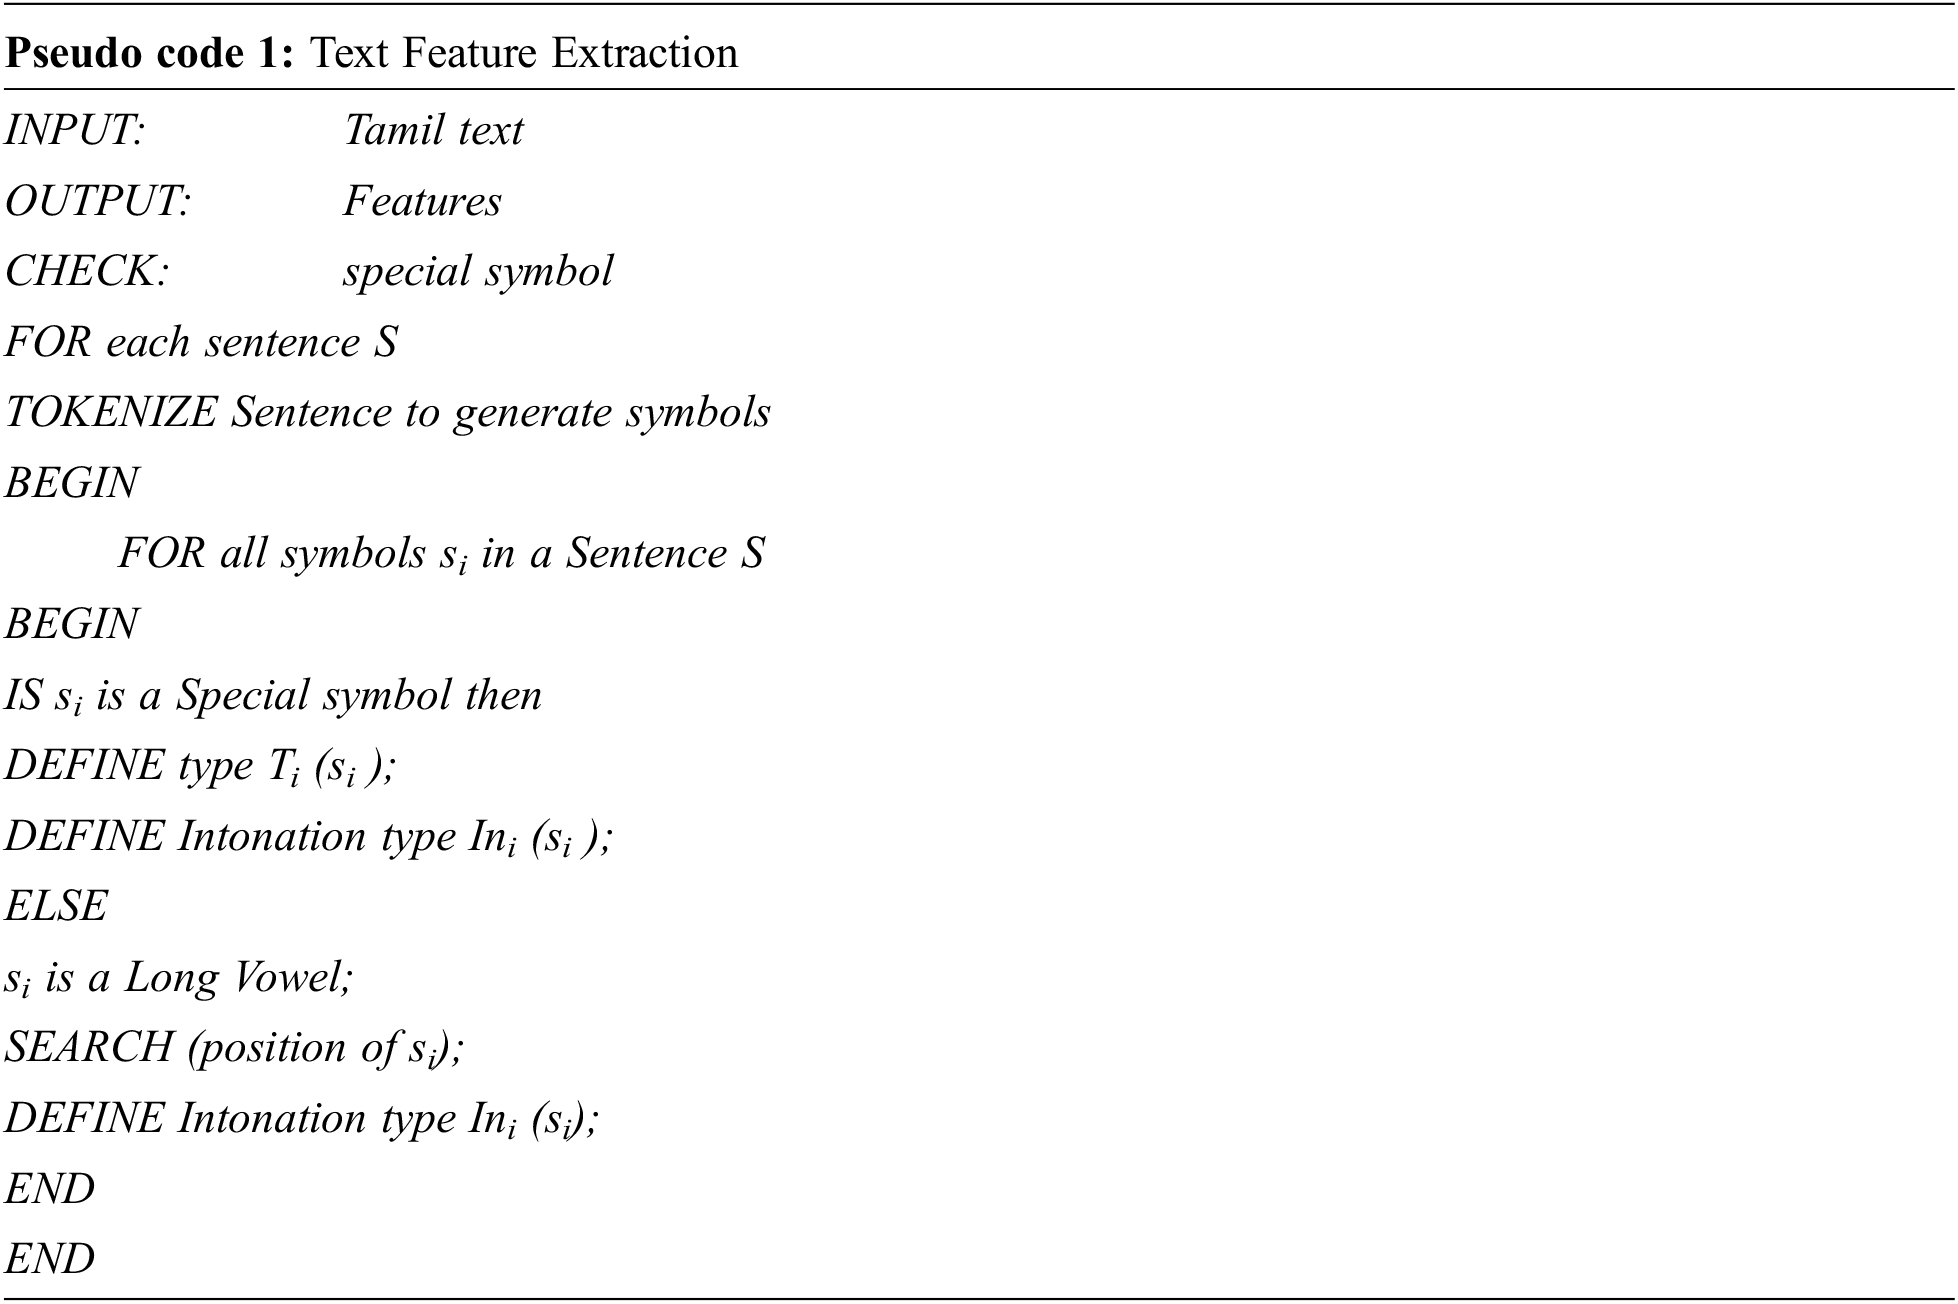
The pseudocode 1 illustrates how the intonation function based features are extracted from the text. The Tamil text is parsed to calculate the length of the sentence and count the number of words present in the sentence. It is also checked for the presence of special symbols/characters. The position where special symbols are present is stored separately. The sentences are classified based on the special symbols that appear in the sentence. The labels such as 1, 2, 3 and 4 are assigned for each classification of the sentence type. After identifying the type of the sentence, it is further analyzed to identify the type of intonation function such as attitudinal, grammatical, focus, discourse, psychological and indexical to which the sentence belong.
3 Proposed Speech Feature Extraction
Researchers still strive to provide suitable speech feature extraction techniques. Shrawankar et al., has mentioned that spectrum obtained through FFT provides more useful information about the speech signal [10]. Shafi et al., has compared the features obtained by employing Discrete cosine transform and Discrete Fourier Transform (DFT) in the process of removing the noise from the speech [11]. Kurzekar et al., has compared various feature extraction techniques for speech systems [12]. Vimal et al., has employed a Discrete wavelet transform to decompose the signal into wavelets at different scales and location in order to perform coding and decoding of the signal [13]. Rajeswari et al., utilized wavelet packet transform for fault diagnosis [14]. Vinod Kumar et al., has utilized a joint feature extraction of MFCC for continuous Telugu speech recognition [15]. Dinesh Sheoran et al., also discussed on spectral feature extraction techniques [16]. Lee et al., has presented prosody embeddings for speech synthesis networks [17]. Sun et al., has presented an interpretable latent variable model for prosody based on the Tacotron for text-to-speech model [18]. These techniques have been tried for various purposes and also for languages spoken in India. Miao et al., presented an Efficient TTS which is non-autoregressive architecture and mentioned the presented system outperforms when compared to Tacotron [19]. Mustaqeem et al., presented a simple light weight deep learning based system, 1-D, CNN and two stream deep CNN for Speech Emotion Recognition System in [20–22].
According to proposed PCV technique, speech is segmented into phonemes and the cepstrum variation is analyzed. The proposed feature extraction technique is unique in its own way to identify the cepstrum variation when phoneme is being analyzed. Phoneme is a sound element that differentiates the words in a language. Phonemic representation is an essential part in speech synthesis process. So, it makes sense using phoneme with cepstrum variation based feature extraction from speech. Fig. 2 shows the design of proposed speech feature extraction model. The input Tamil dataset is stored in a file and its corresponding speech dataset is created and stored separately. The creation of speech dataset is done by recording the speech in a noise free environment. In the first step, text data is analyzed for extracting the useful features. The use of intonation functions along with special symbols facilitates predicting the rise fall pattern of F0 in the sentence. In connection to the text feature extraction, features must be extracted from the speech.

Figure 2: System design of phoneme with cepstrum variation based speech feature extraction
The research work proposes a new speech feature extraction technique which is based on the phoneme present in the speech. The speech data is stored as wav file. The speech waveform is observed in a short-term spectrum to extract the phonemic information. The PCV is the feature of interest in speech. It happens to be meaningful to know the salient traits of the cepstrum. The cepstrum is obtained by taking inverse fourier transform of the logarithmic spectrum of the speech signal. It can be realized in four different ways such as real, complex, power and phase cepstrum.
The cepstrum has the advantage in determining the pitch as it is very effectual in separating the pitch and formants whereas it is not so in the logarithmic representation of the power spectrum. To authenticate this, power cepstrum is predominantly used as feature vector to represent more useful features of speech and music. The cepstrum is obtained from the spectrum after it is subjected to transformation using the mel scale. These mel frequency cepstral coefficients are very useful in determining the pitch. It is also advantageous to use cepstrum for the purpose of pitch detection because the low frequency periodic component and formants convolve in time domain and multiply in frequency domain respectively. Another extraordinary feature of cepstrum is that it is capable of expressing convolution of two signals as an addition of their complex cepstra.
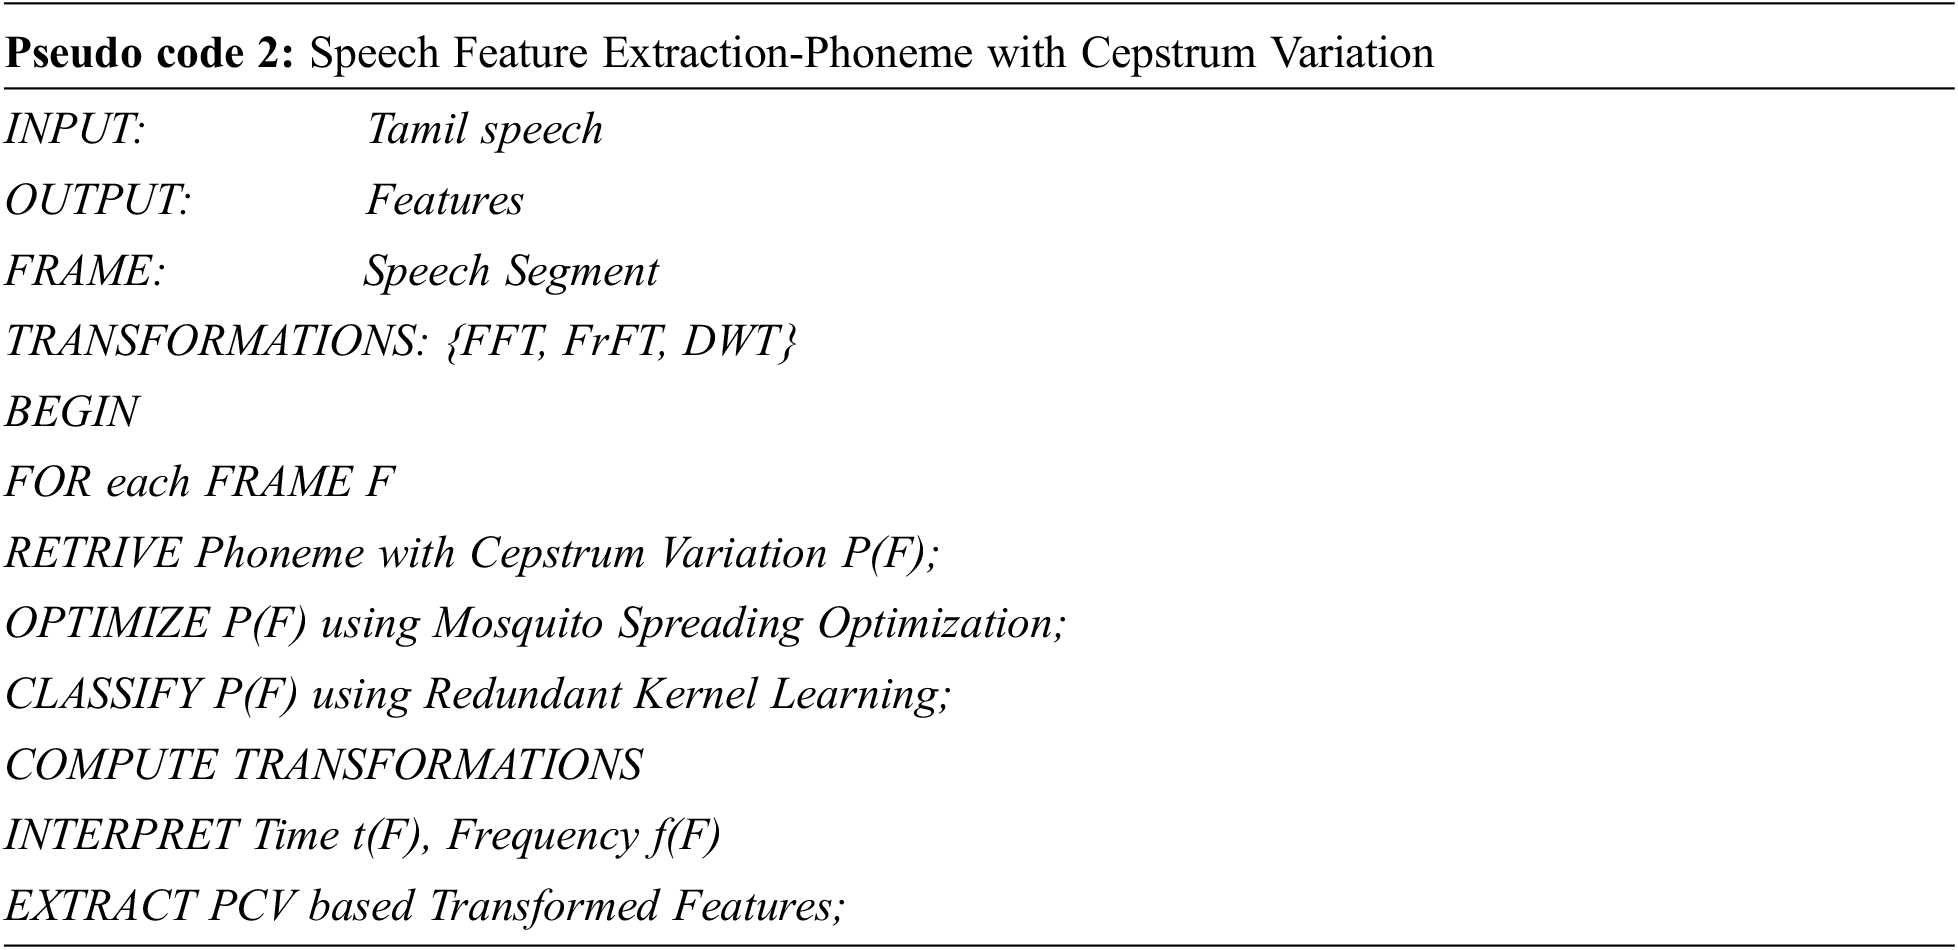
The pseudo code 2 illustrates the complete process of speech feature extraction which includes identifying and extracting the phoneme where variation is found in the cepstrum as speech features, selecting the optimal features using mosquito optimization algorithm and classifying the features using Redundant Kernel Learning algorithm.
4 Phoneme with Cepstrum Variation Based Feature Extraction
Let X be the input speech signal. It is subjected to preprocess and represented as Xk. The signal is presented in Discrete Cosine Transform as a preprocessing step for feature extraction.
where h–Denotes Coefficient value of transformation
After preprocessing, the signal must be normalized to obtain mean normalization for PCV feature extraction and is represented as,
This signal is presented to undergo windowing process and segmented into frames. Each frame is observed for phoneme having variation or difference in the pitch. This variation is examined with the help of cepstrum of the signal. The pitch determination is a very important step in extracting the meaningful and useful features. The phoneme in which cepstrum variation is observed is represented as,
where Xk–preprocessed input samples and M–average of XK.
The advantage of extracting the speech feature using phoneme and pitch variation according to Eq. (3) is that the entire speech signal can be observed as the signal is continuous in nature. It is operated to observe the signal thoroughly without leaving any portion of the cepstrum. XK, denotes the current phoneme in Eq. (3) and rest of the portion denotes the left and right position of the current phoneme. The intensity of pitch is determined by taking the difference between preprocessed signal and original signal. It is denoted by λi and described as,
where XK is the preprocessed speech and
5 Mosquito Spreading Optimization Algorithm
After extracting the features, optimal features must be selected. A new Mosquito Spreading Optimization (MSO) algorithm is proposed to select optimal features. The key idea behind the algorithm is to estimate the fittest particles as optimal features. The optimization algorithm works as follows.
The algorithm takes Feature matrix ‘T’ as an input and returns Selected Feature ‘ST’ as output. The Particles are provided as training features f(x). The center position of the Particles is extracted randomly by,
where d–Random value (Range from 0 to 1).
The initial fitness value is extracted using,
Where f(y) – Random particles, Varhigh – Higher limit of f(x), Varlow – Lower limit of f(x) and npar – Number of feature particles.
The next step is to estimate the maximum profit of initial iteration using the objective function given by,
where W–Maximum weight of Particles.
Initialize i = 1 and iterate the loop to extract cluster formation with objective function updated by,
For i = 1 to Number of iteration pp
If (
{
Update Particle, ‘Particleweight’ and co-ordinates
}
The particleweight and co-ordinates are updated using,
The distance between the particles and its corresponding weight updates is,
Where P(m)–Probability of number of Weights at each center location.
The weight of calculated distance is updated using,
The maximum profit is updated using,
Then set of Particles Position and Weight Position is updated by,
If (
{
Update
Update CKcenter to New Position
}
The updated Profit and Particles Center continue to form Cluster till the maximum number of iterations. Finally, the Updated Particles Center is extracted as Best Fitness value output ′BF′.
6 Redundant Kernel Learning Algorithm
The selected optimal features are further classified using Redundant Kernel Learning (RKL) algorithm. The optimal features are given as input to the learning algorithm and RKL applied is expressed as,
L = RKL (ST)
Then Signal-to-Noise ratio is computed for retrieved signal ‘L’
if SNR satisfied
{
Return L
else
{
Goto initialization of particles;
}
}
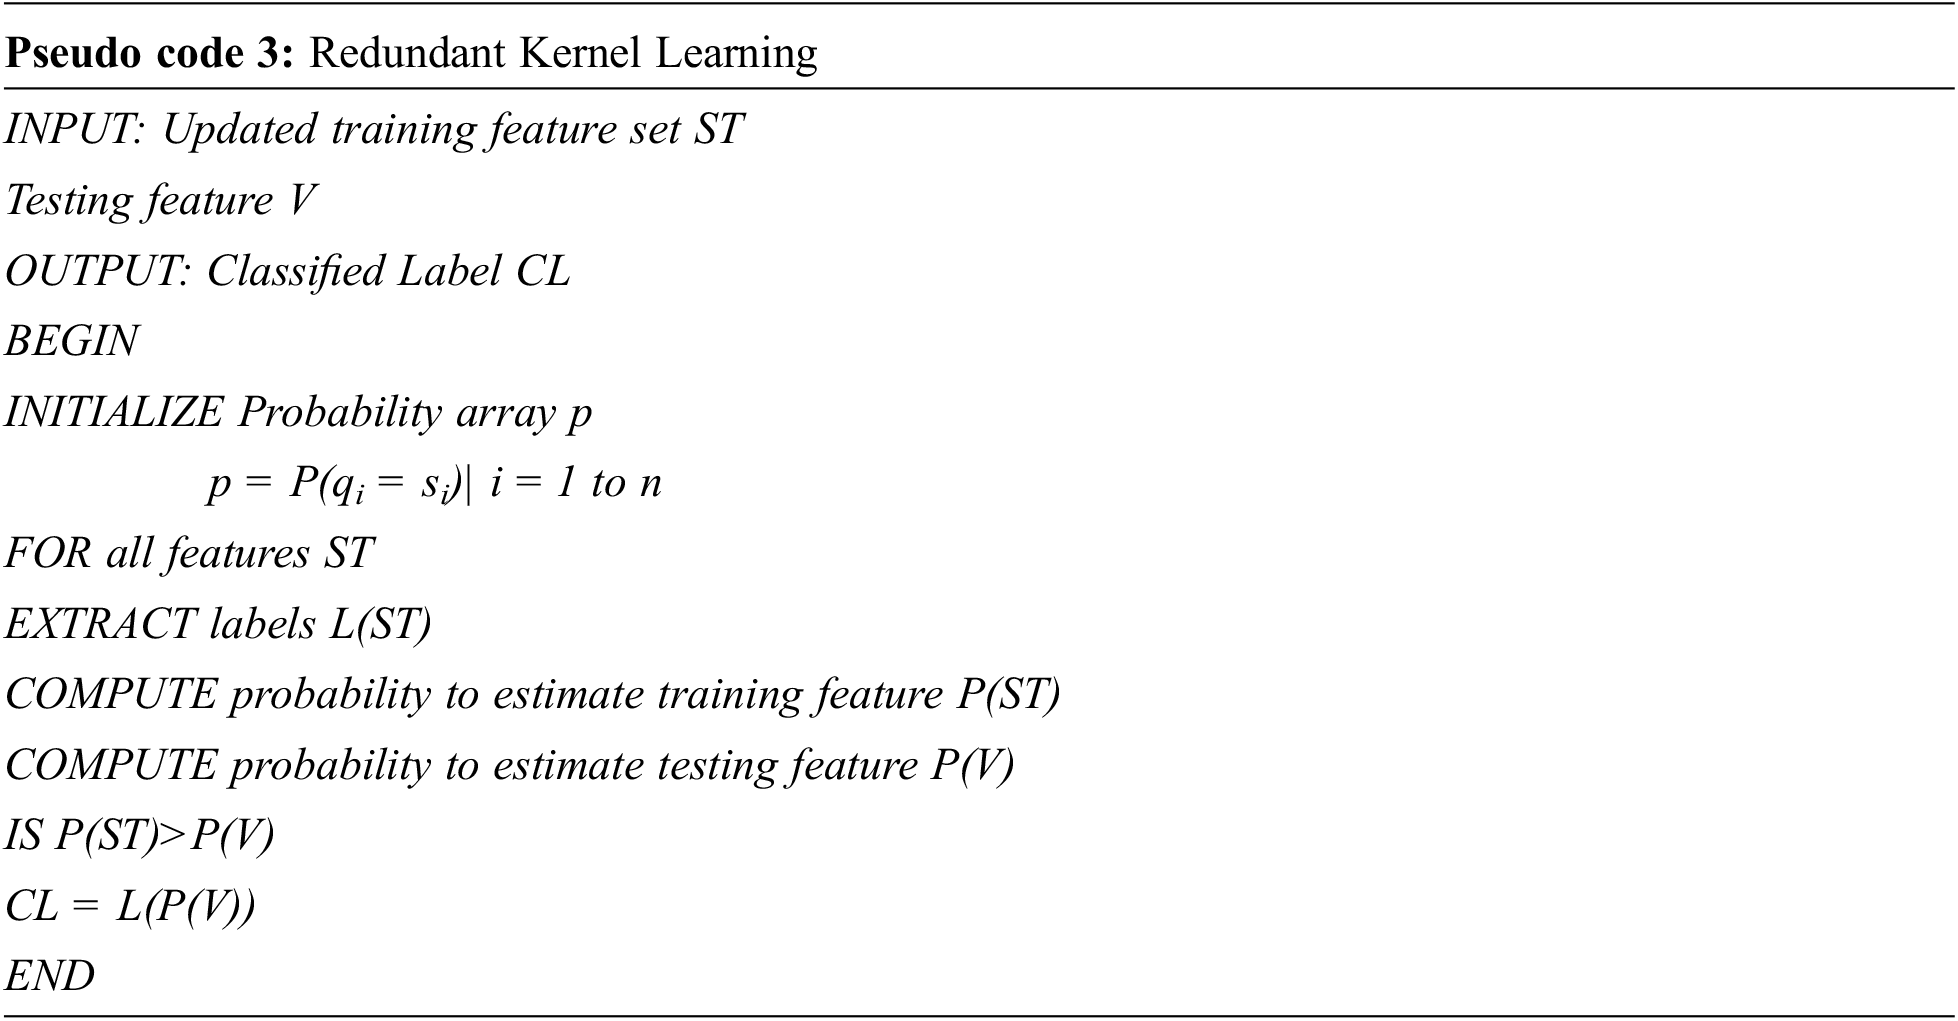
The pseudo code 3 illustrates how the learning algorithm is applied to classify the features and label them. The RKL learning algorithm is a special kind of machine learning algorithm which takes the training and testing data set represented in the form of matrix as its input and returns classified label after learning. The training set comprises the optimal features selected using MSO denoted by STr, the testing set denoted by V and initialize label L.
Initialize the Probability array,
p = P(qi = si) where, s–State of training set for i = 1, 2… N
N–Size of Training set ‘ST’
q–Fixed state sequence for the length of ‘V’
for (i = 1 to Row_size (V))
for (j = 1 to
qi,j = L(di); //Extract Corresponding labels of Training set.
where ‘m’–length of si and n’–length of Vi
Probability of estimating the training feature set
where N-size of training set ‘STr’
Probability of estimating the testing set
where M–size of testing set ‘V’
Check the condition for verifying the features, if condition satisfied, classify using label
if (P(STr|πi) > P (V))
CLi = L (P(V));
end if
end ‘j’ loop
end ‘i’ loop
A probability array p is also initialized. Si stores the extracted attributes of training set. qi,j holds the corresponding labels extracted from the training set. The probability of training features and testing features are estimated. If the probability of training feature is greater than the testing feature set, then classification is performed using neural network model and labeled. The optimal features obtained are used for learning purpose with the help of learning algorithm which is fed to the neural network model for further classification. Then, SNR values are computed for the retrieved signal and labeled according to the classification.
The results are improved by 14% using phoneme with cepstrum variation based feature extraction when compared to transformation based feature extraction techniques.
7 Simulation Results and Discussion
The simulation setup is created using MATLAB and different Tamil speech signal segments are chosen from the dataset. The signals are sampled at 8 KHz and distorted using white noise and street noise. The length of the test speech data segment is 180.6 s including the silence period. During the experimental analysis, 85% of the speech segments are classified as voiced speech.
The Fig. 3 shows the input speech signal and the signal after normalization is applied. The usual way of normalizing the speech is to multiply the signal by a factor of 1/max (signal).

Figure 3: Input speech signal and normalized signal
Figs. 4–6 shows the noise filtered signal, its initial spectrum for feature extraction and power spectrum of the speech respectively.
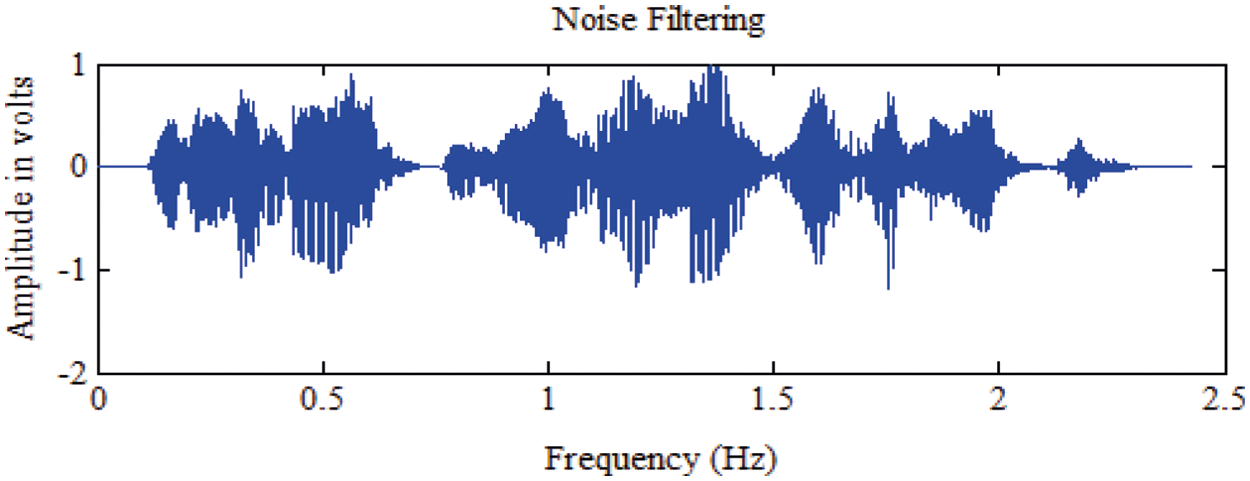
Figure 4: Noise filtered Signal
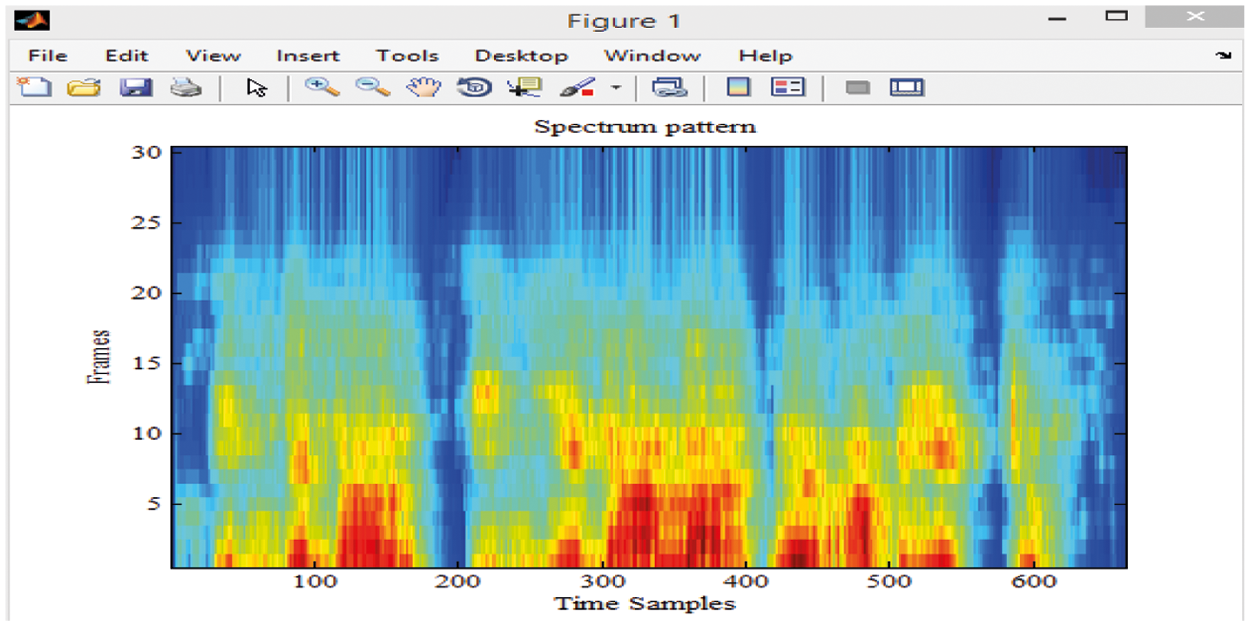
Figure 5: Spectrum pattern of the input sentence
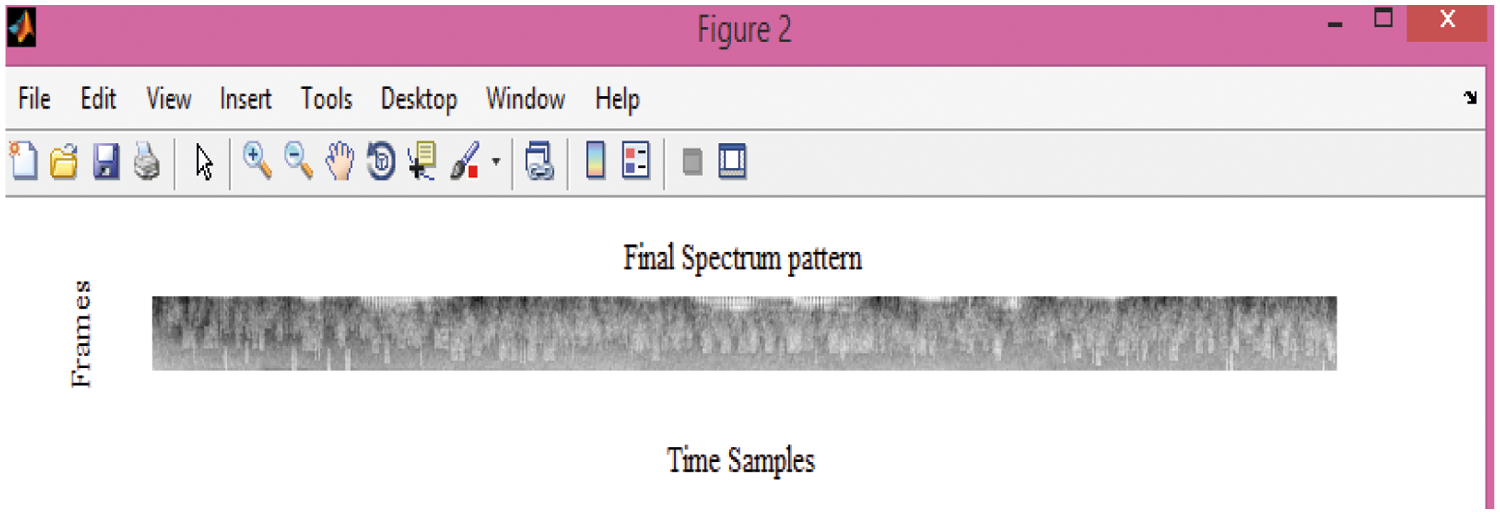
Figure 6: Power spectrum pattern of the input sentence
7.1 Speech Signal Using PCV Based Features After Applying Transformation
Fig. 7a shows the FFT spectrum of the processed speech, its pitch track, its peak point representation and the quality improved output. It is evident from the peak points that the rise and fall marked in red triangle and circle points indicate the places where pitch is to be modified. The overall pitch range can also be referred clearly with the help of pictorial representation of the pitch track of the signal. Similarly, the FrFT and DWT spectrum and its corresponding information are obtained with the help of Figs. 7b and 7c respectively.
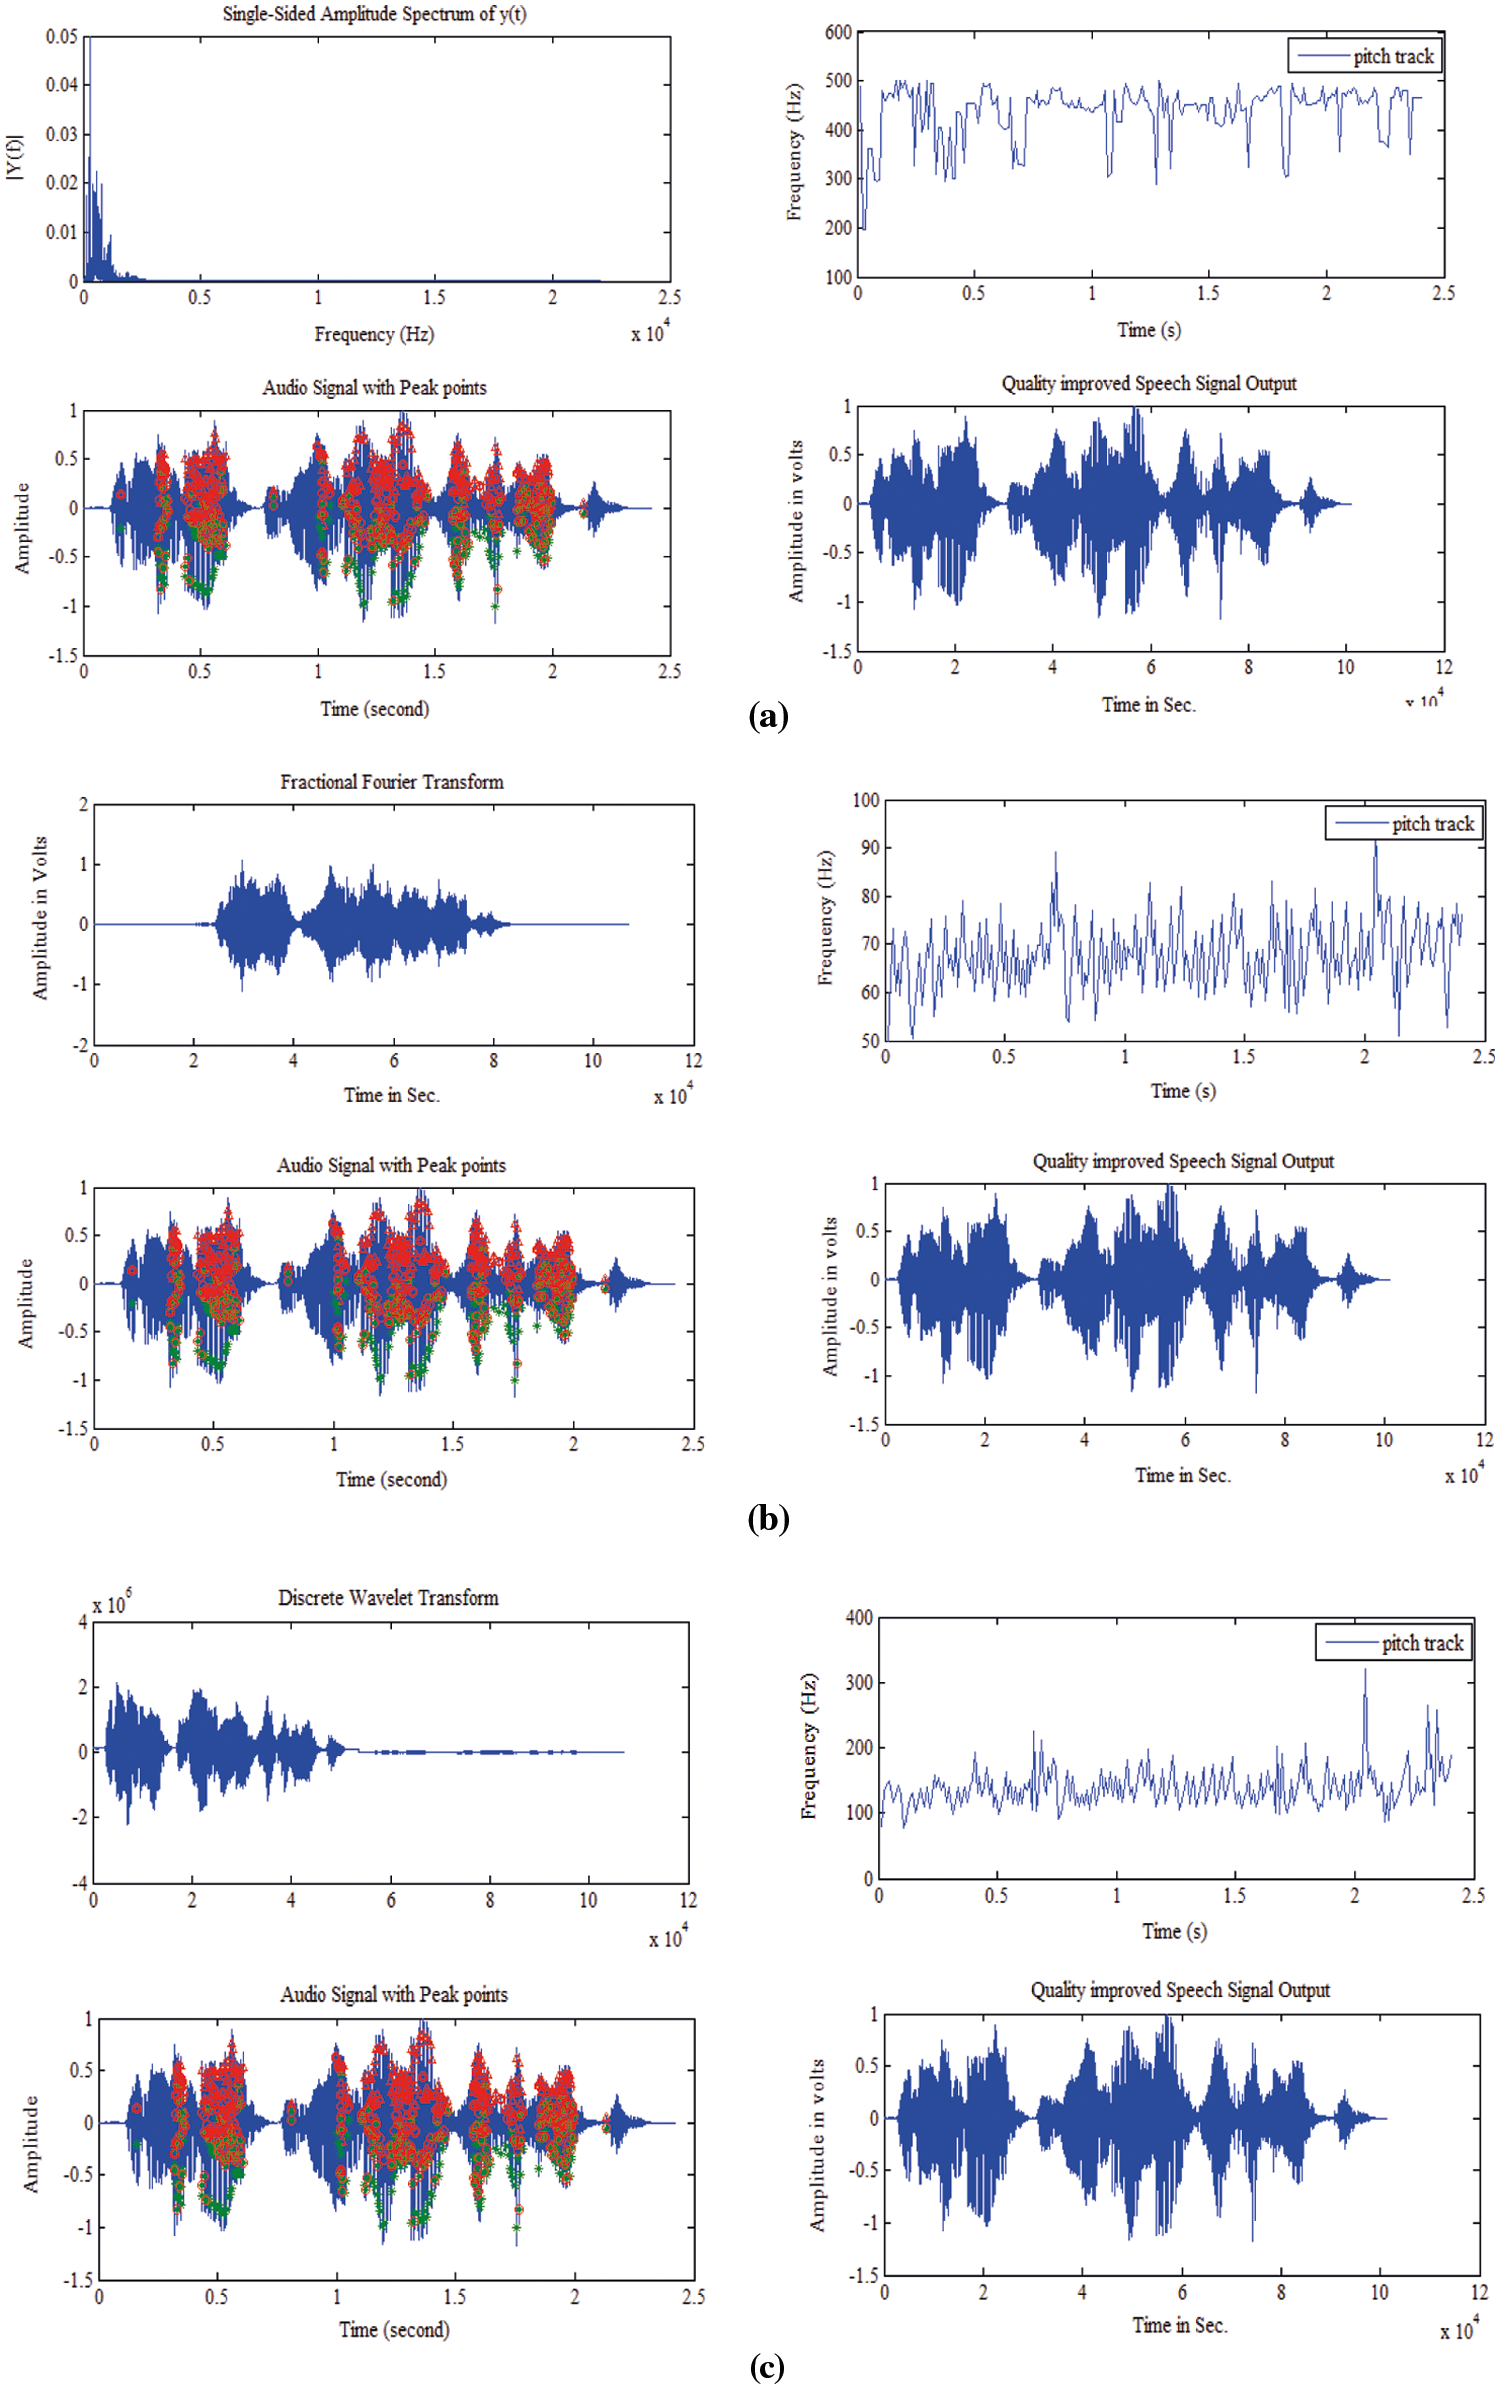
Figure 7: (a) FFT, (b) FrFT and (c) DWT with pitch track, peak points and quality enhanced speech output
The proposed PCV based feature extraction technique is evaluated using the objective measures such as Signal-to-Noise ratio (SNR), and Normalized Correlation coefficient (NCC).
Signal-to-Noise ratio (SNR): The Signal-to-Noise is one of the simplest and promising measures to evaluate the quality of the speech in terms of intelligibility. It is measured as the ratio of signal power to the noise power and represented by
where Psignal is the power of the signal and Pnoise is the noise power. SNR is always expected to be better associated with the Mean Opinion Score (MOS). It is also simple to compute and has been used predominantly to qualify the enhanced speech.
Normalized Correlation Coefficient (NCC): Correlation provides the similarity between two signals. Normalized correlation coefficient (NCC) ranges between 1 and −1. The upper bound of NCC is 1 and lower bound is −1. It is good to have larger NCC values, because greater the NCC values, more similar will be the signals. It is calculated as follows
Mean Opinion Score (MOS) is one of the most extensively used subjective measures to assess the quality of enhanced speech with respect to intelligibility and naturalness. It is a kind of listening test conducted using properly designed experimental setup. The listeners are called as subjects. The MOS values are scaled between 1 and 5. The MOS values of 1 indicates that the quality of speech is very poor, 2 indicates poor, 3 indicates fair, 4 indicates good and 5 indicates the quality is excellent. The choice of subjects can be native language speakers, non-native language speakers, age between 25 and 35 or age above 40.
SNR Results: Tab. 3 shows the comparison of SNR values obtained while prosody modification is done using information provided by FFT based MFCC feature, and PCV based feature. The comparison is done for the various types of intonation functions against various types of the sentences. It is evident from the table that PCV based feature provides useful information for pitch modification compared to FFT based MFCC features. The value of SNR for PCV based feature is approximately two-fold increase compared to FFT based MFCC feature extraction technique.

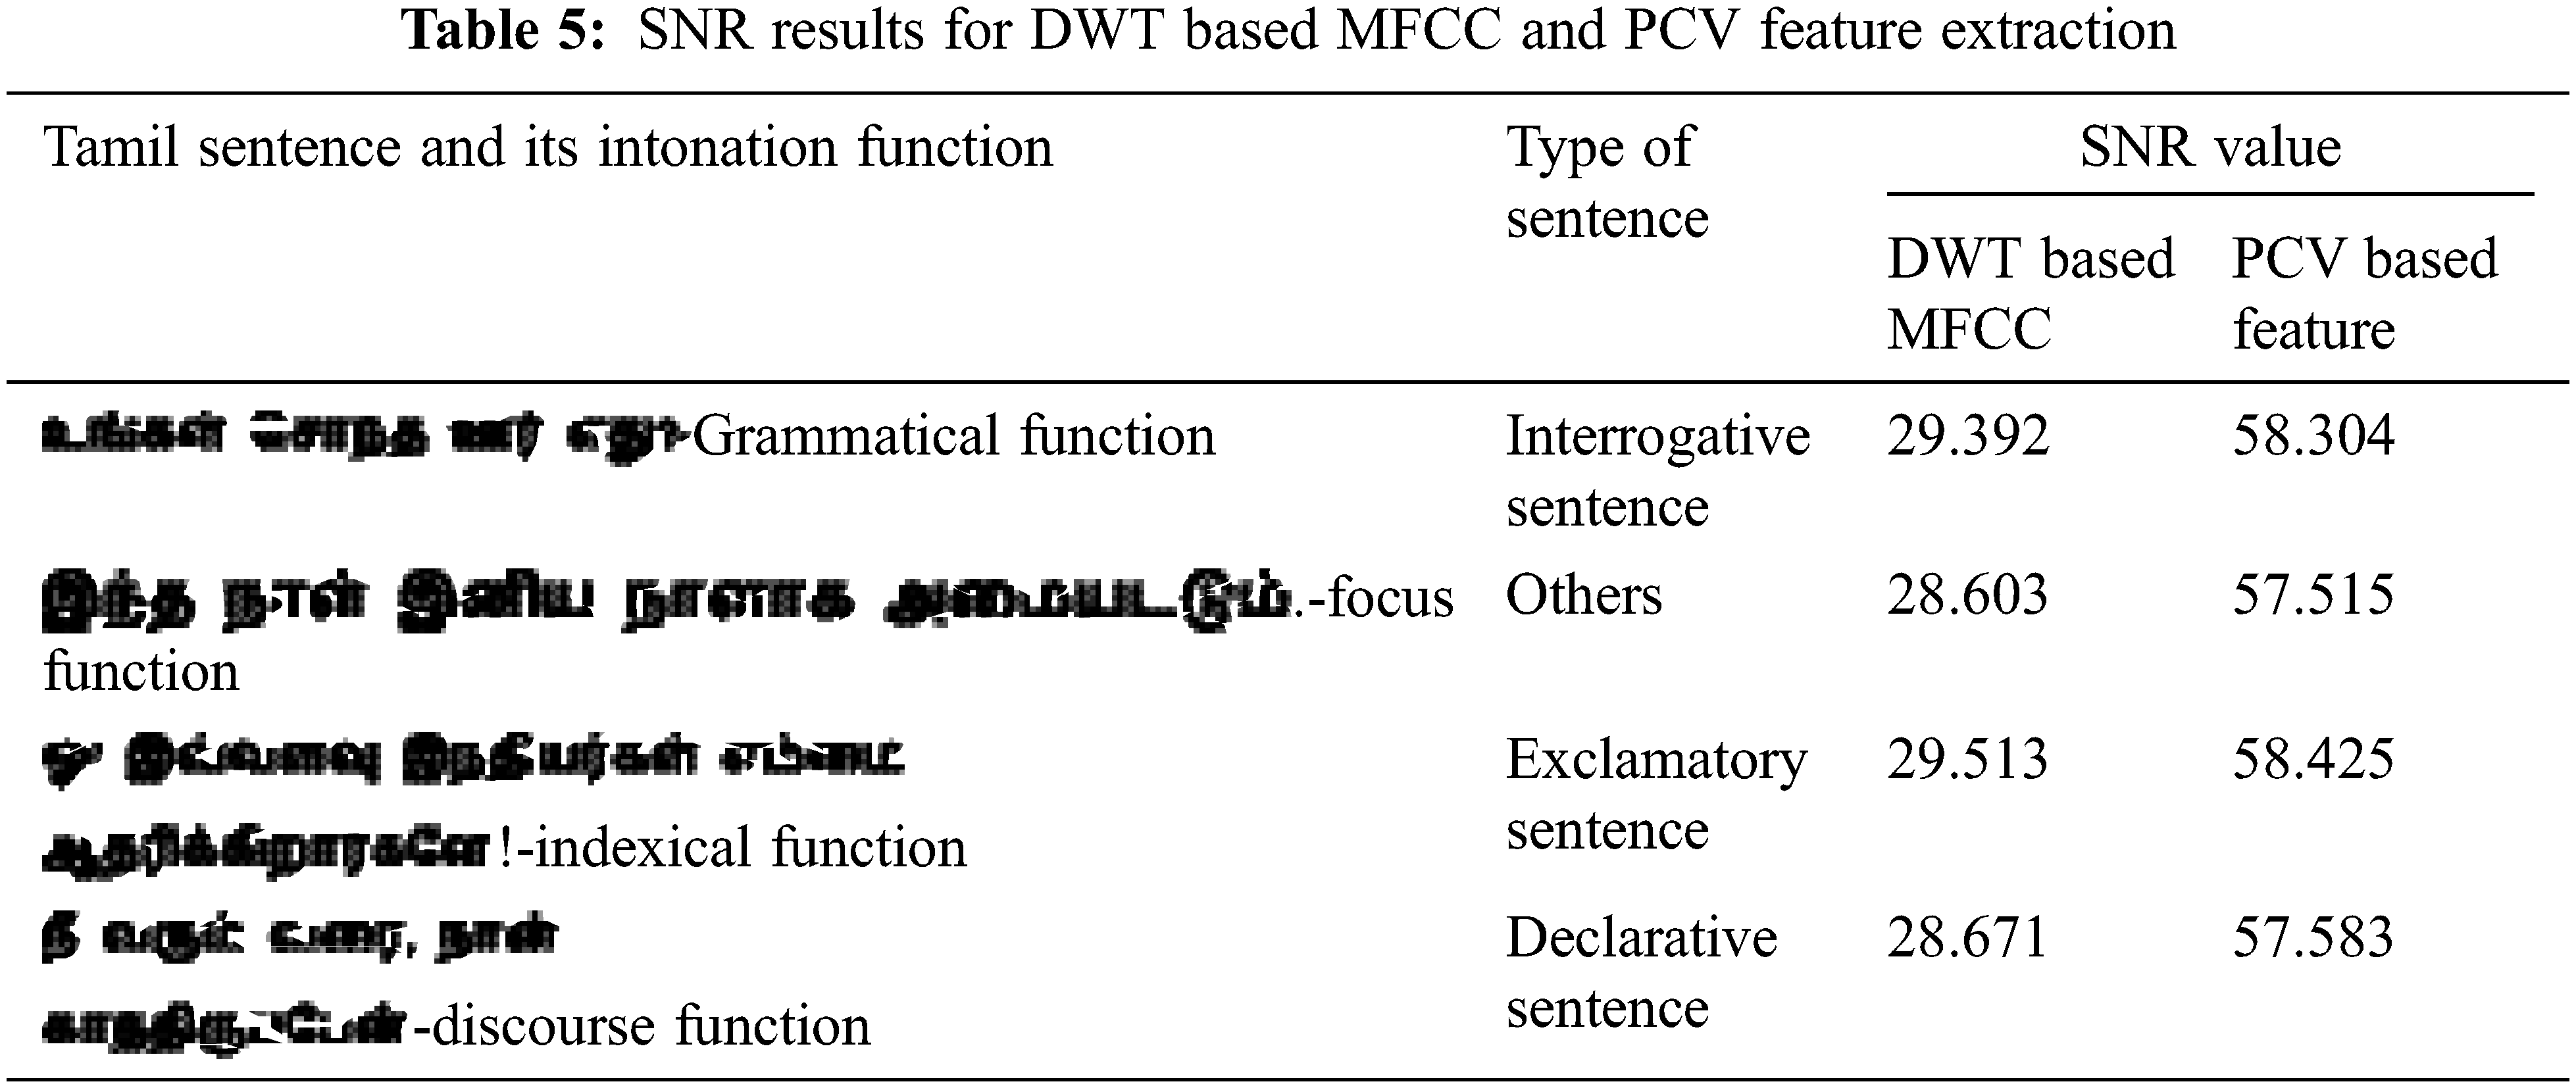
When the proposed intonation function based text feature extraction and PCV based speech feature extraction techniques are examined to identify the sentence type using special symbols present in the sentence and intonation function, the SNR value for the exclamatory sentence is higher than the other types of sentences. Tabs. 4 and 5 shows the comparison of SNR values obtained while prosody modification is done using information provided by FrFT based MFCC feature Vs PCV based speech feature, and DWT based MFCC Vs PCV based speech feature extraction respectively.

Figs. 8–10 shows the comparison of SNR values obtained for FFT, FrFT and DWT Vs PCV respectively.
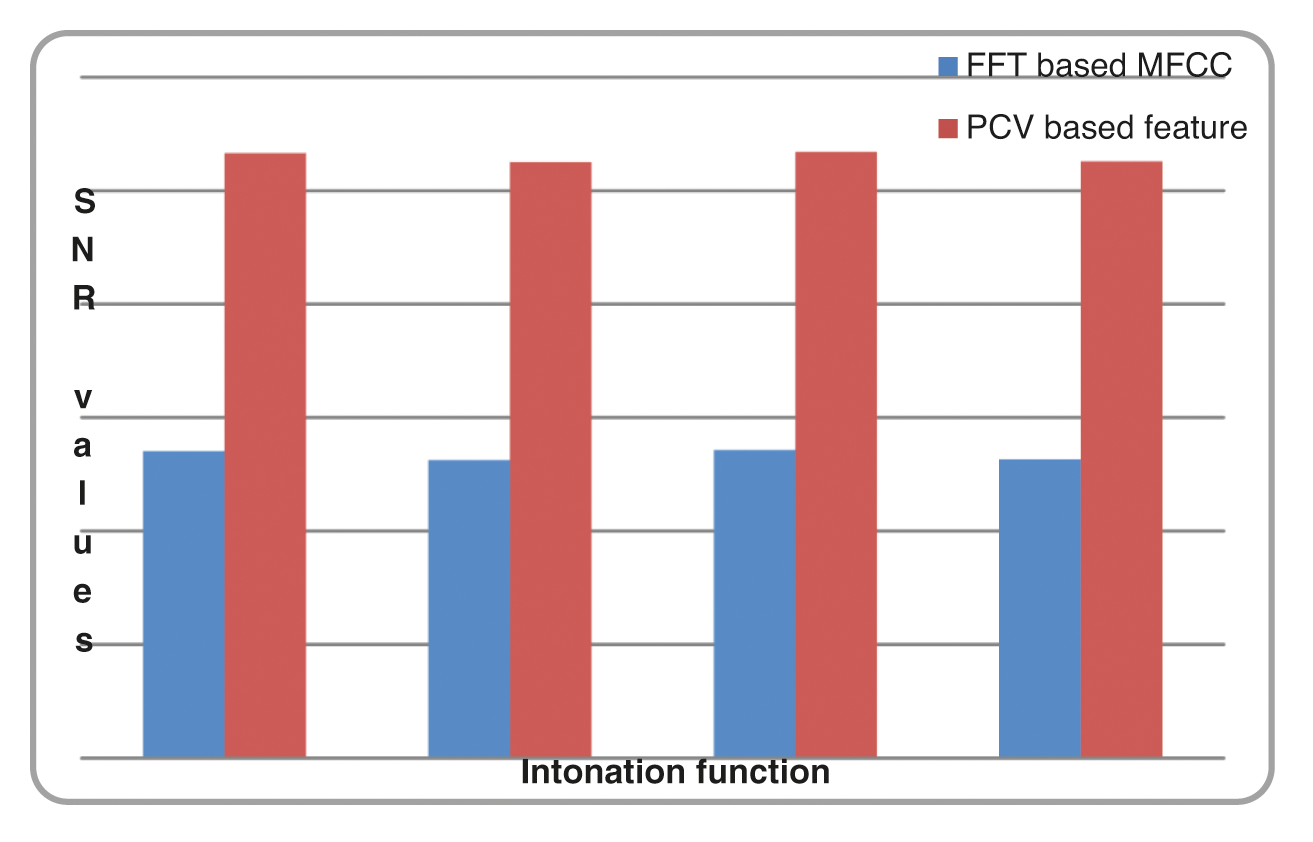
Figure 8: Comparison chart of SNR results for FFT based MFCC and PCV based optimized feature
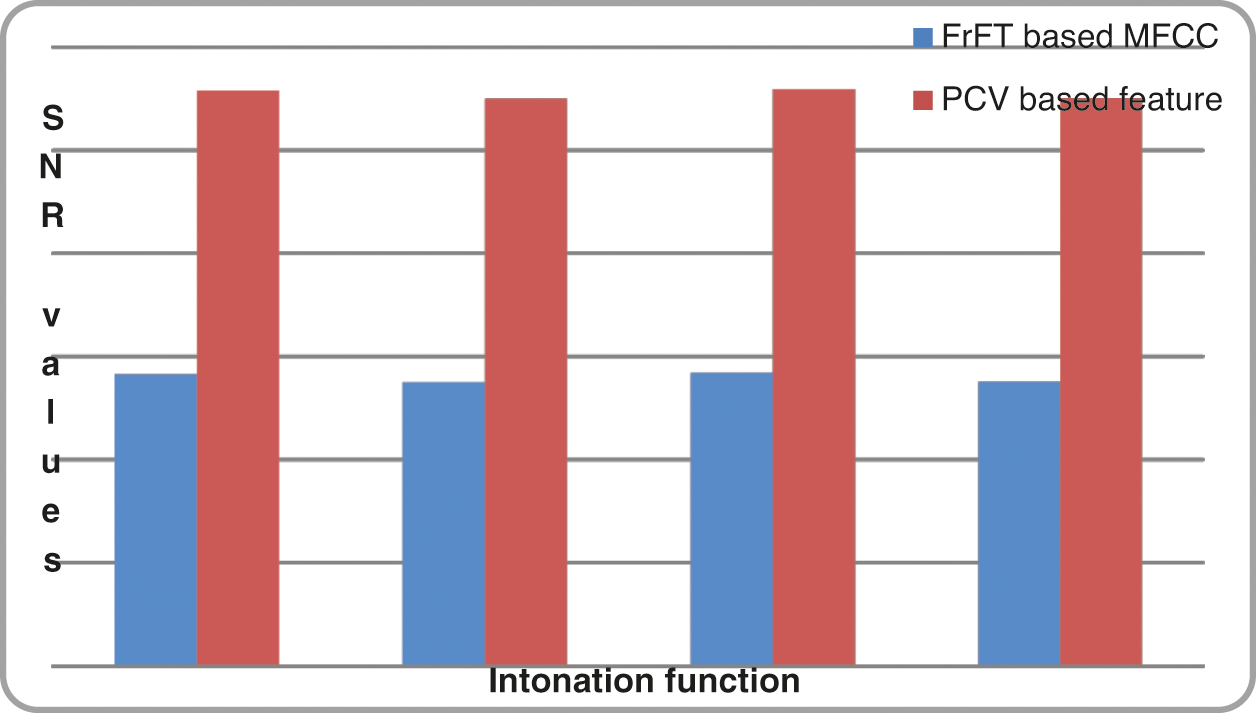
Figure 9: Comparison chart of SNR results for FrFT based MFCC and PCV based optimized feature
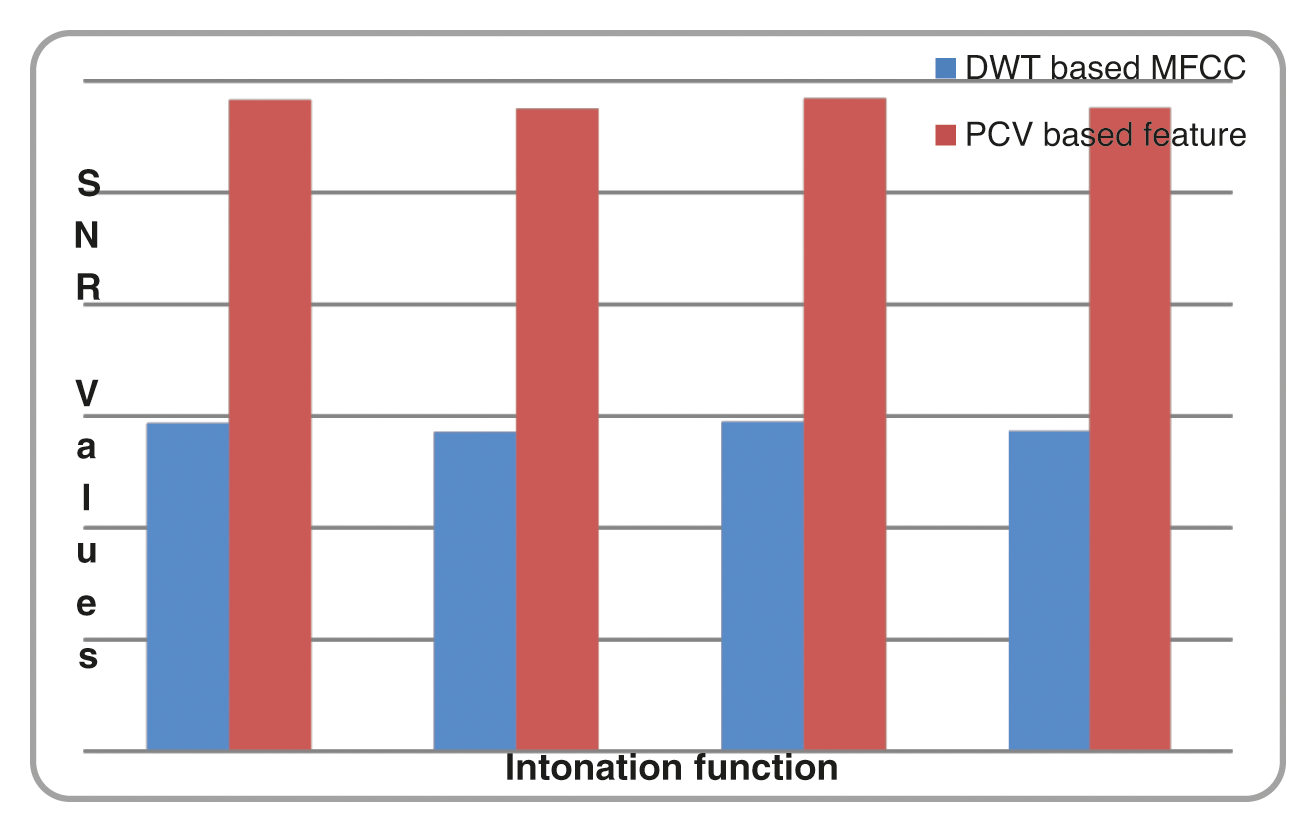
Figure 10: Comparison chart of SNR results for DWT based MFCC and PCV basedoptimized feature
NCC Results: Tab. 6 shows the comparison of NCC values between unprocessed signal and processed signal. The similarity check is done with reference to the natural speech produced by proficient native Tamil speaker. The unprocessed signal is the synthetic speech without being subjected to any quality improvement related process such as noise filtering, feature extraction and selection to incorporate prosody, and special production techniques. The processed signal is the synthetic speech subjected to quality enhancement related processes. The NCC values are comparatively high for processed input signal. The NCC values are also observed for Transformation features, MFCC features, Transformation based MFCC and PCV based features for each of the sentence. The NCC is an important objective measure always proportionate to the MOS subjective test results.

Tab. 7 shows the NCC values obtained for the input sentences are subjected to feature extraction through DWT transform, MFCC, Transform based MFCC and proposed PCV based technique.

Figs. 11 and 12 shows the comparison of NCC values of speech signal subjected to existing speech feature extraction and proposed PCV based speech feature extraction technique.
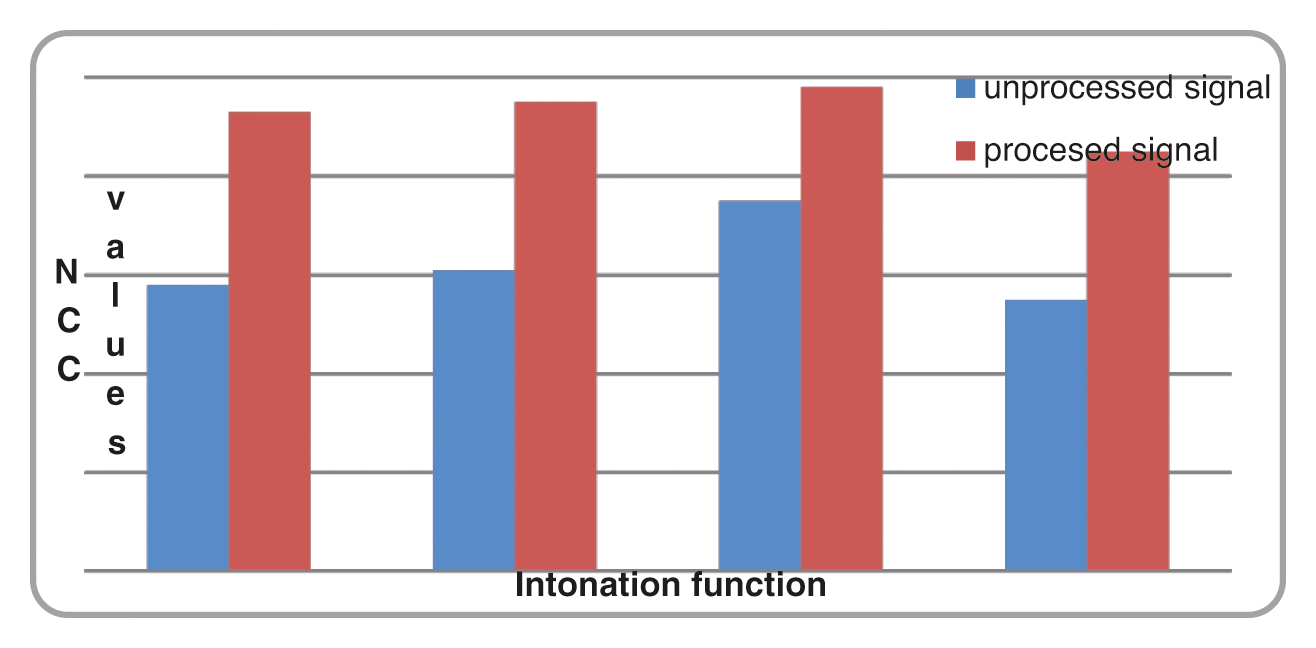
Figure 11: Comparison chart of NCC values for unprocessed and processed signal
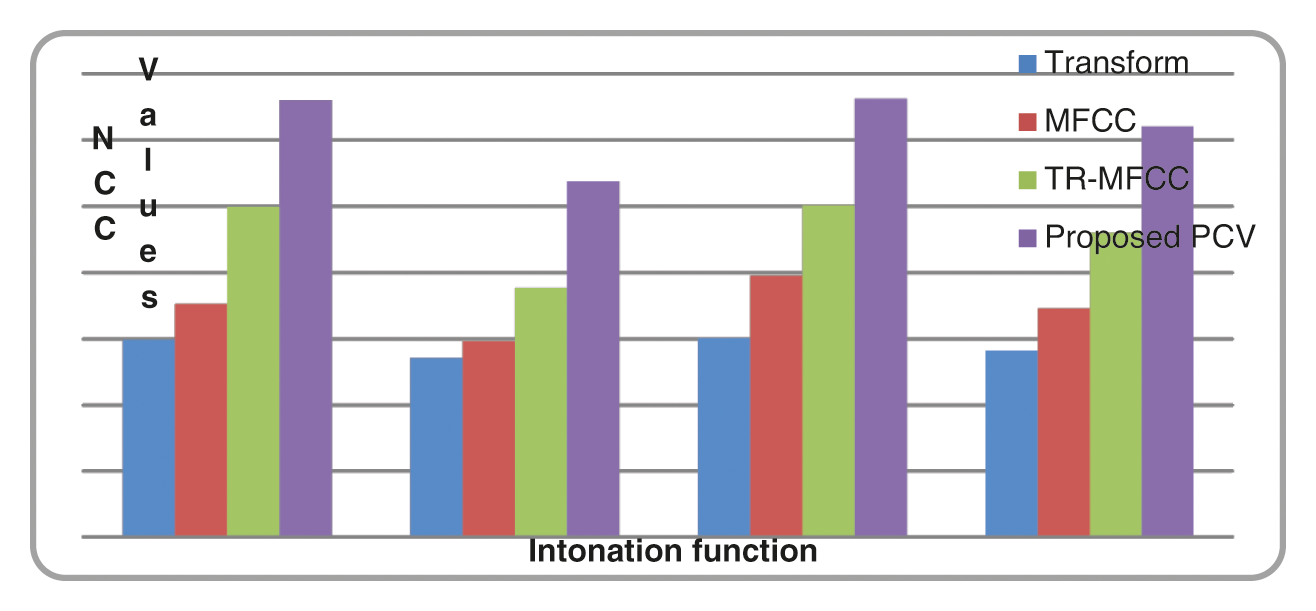
Figure 12: Comparison chart of NCC values transform, MFCC, transform based MFCC and proposed PCV based feature
MOS Results: Tab. 8 shows the MOS results with respect to intelligibility and naturalness of the enhanced speech using the proposed technique of PCV based optimal speech feature extraction in order to incorporate appropriate intonation component in Tamil TTS.
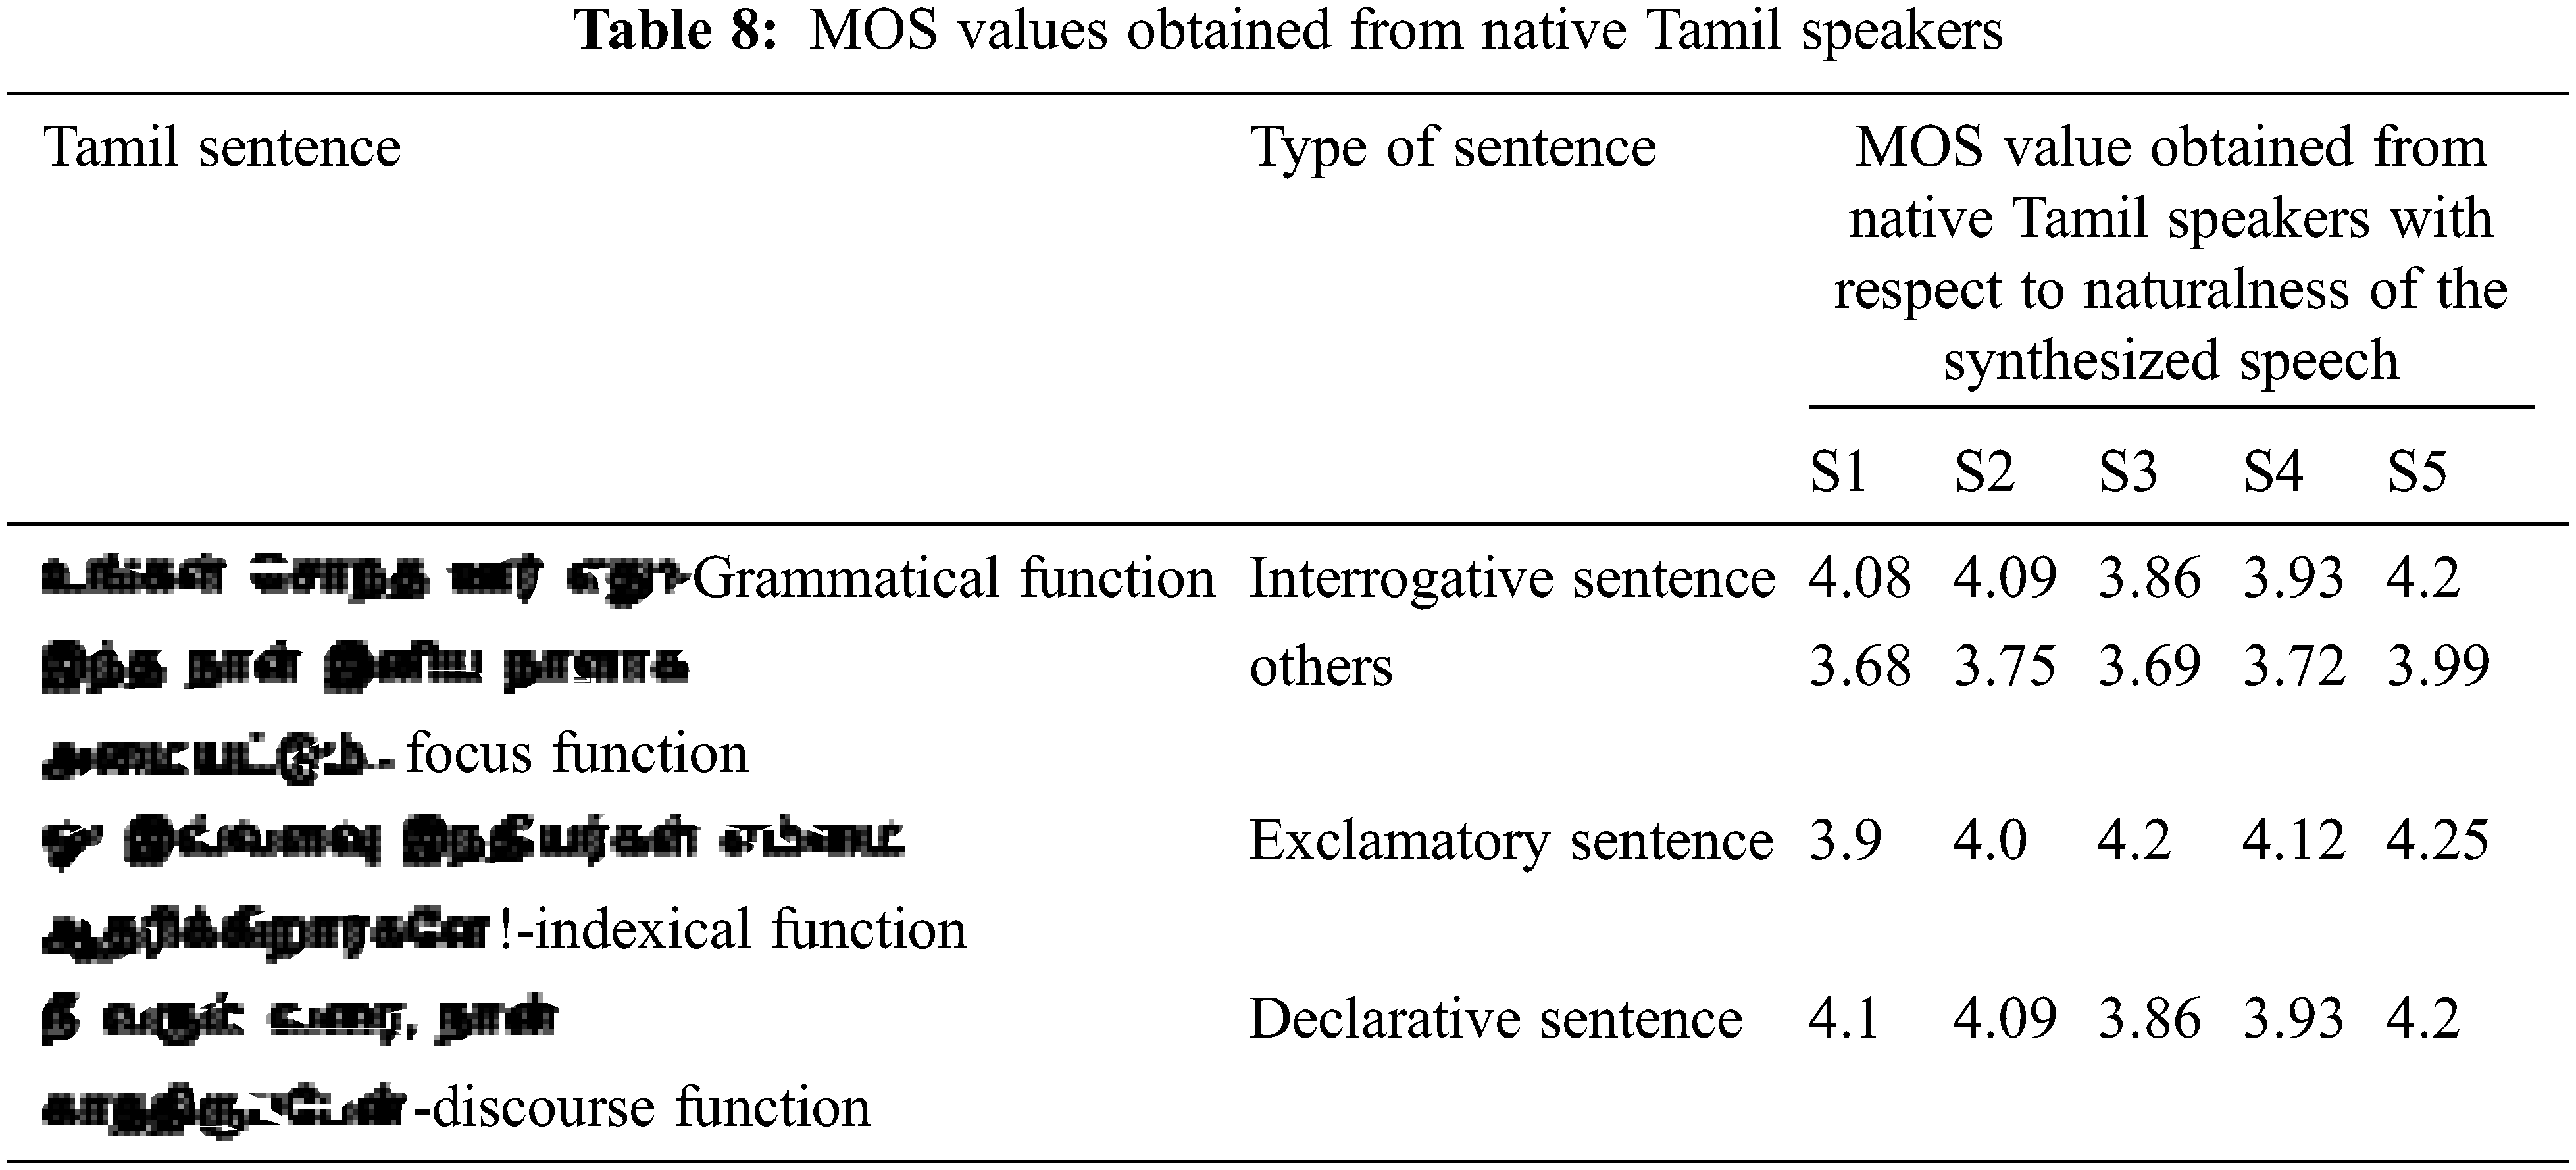
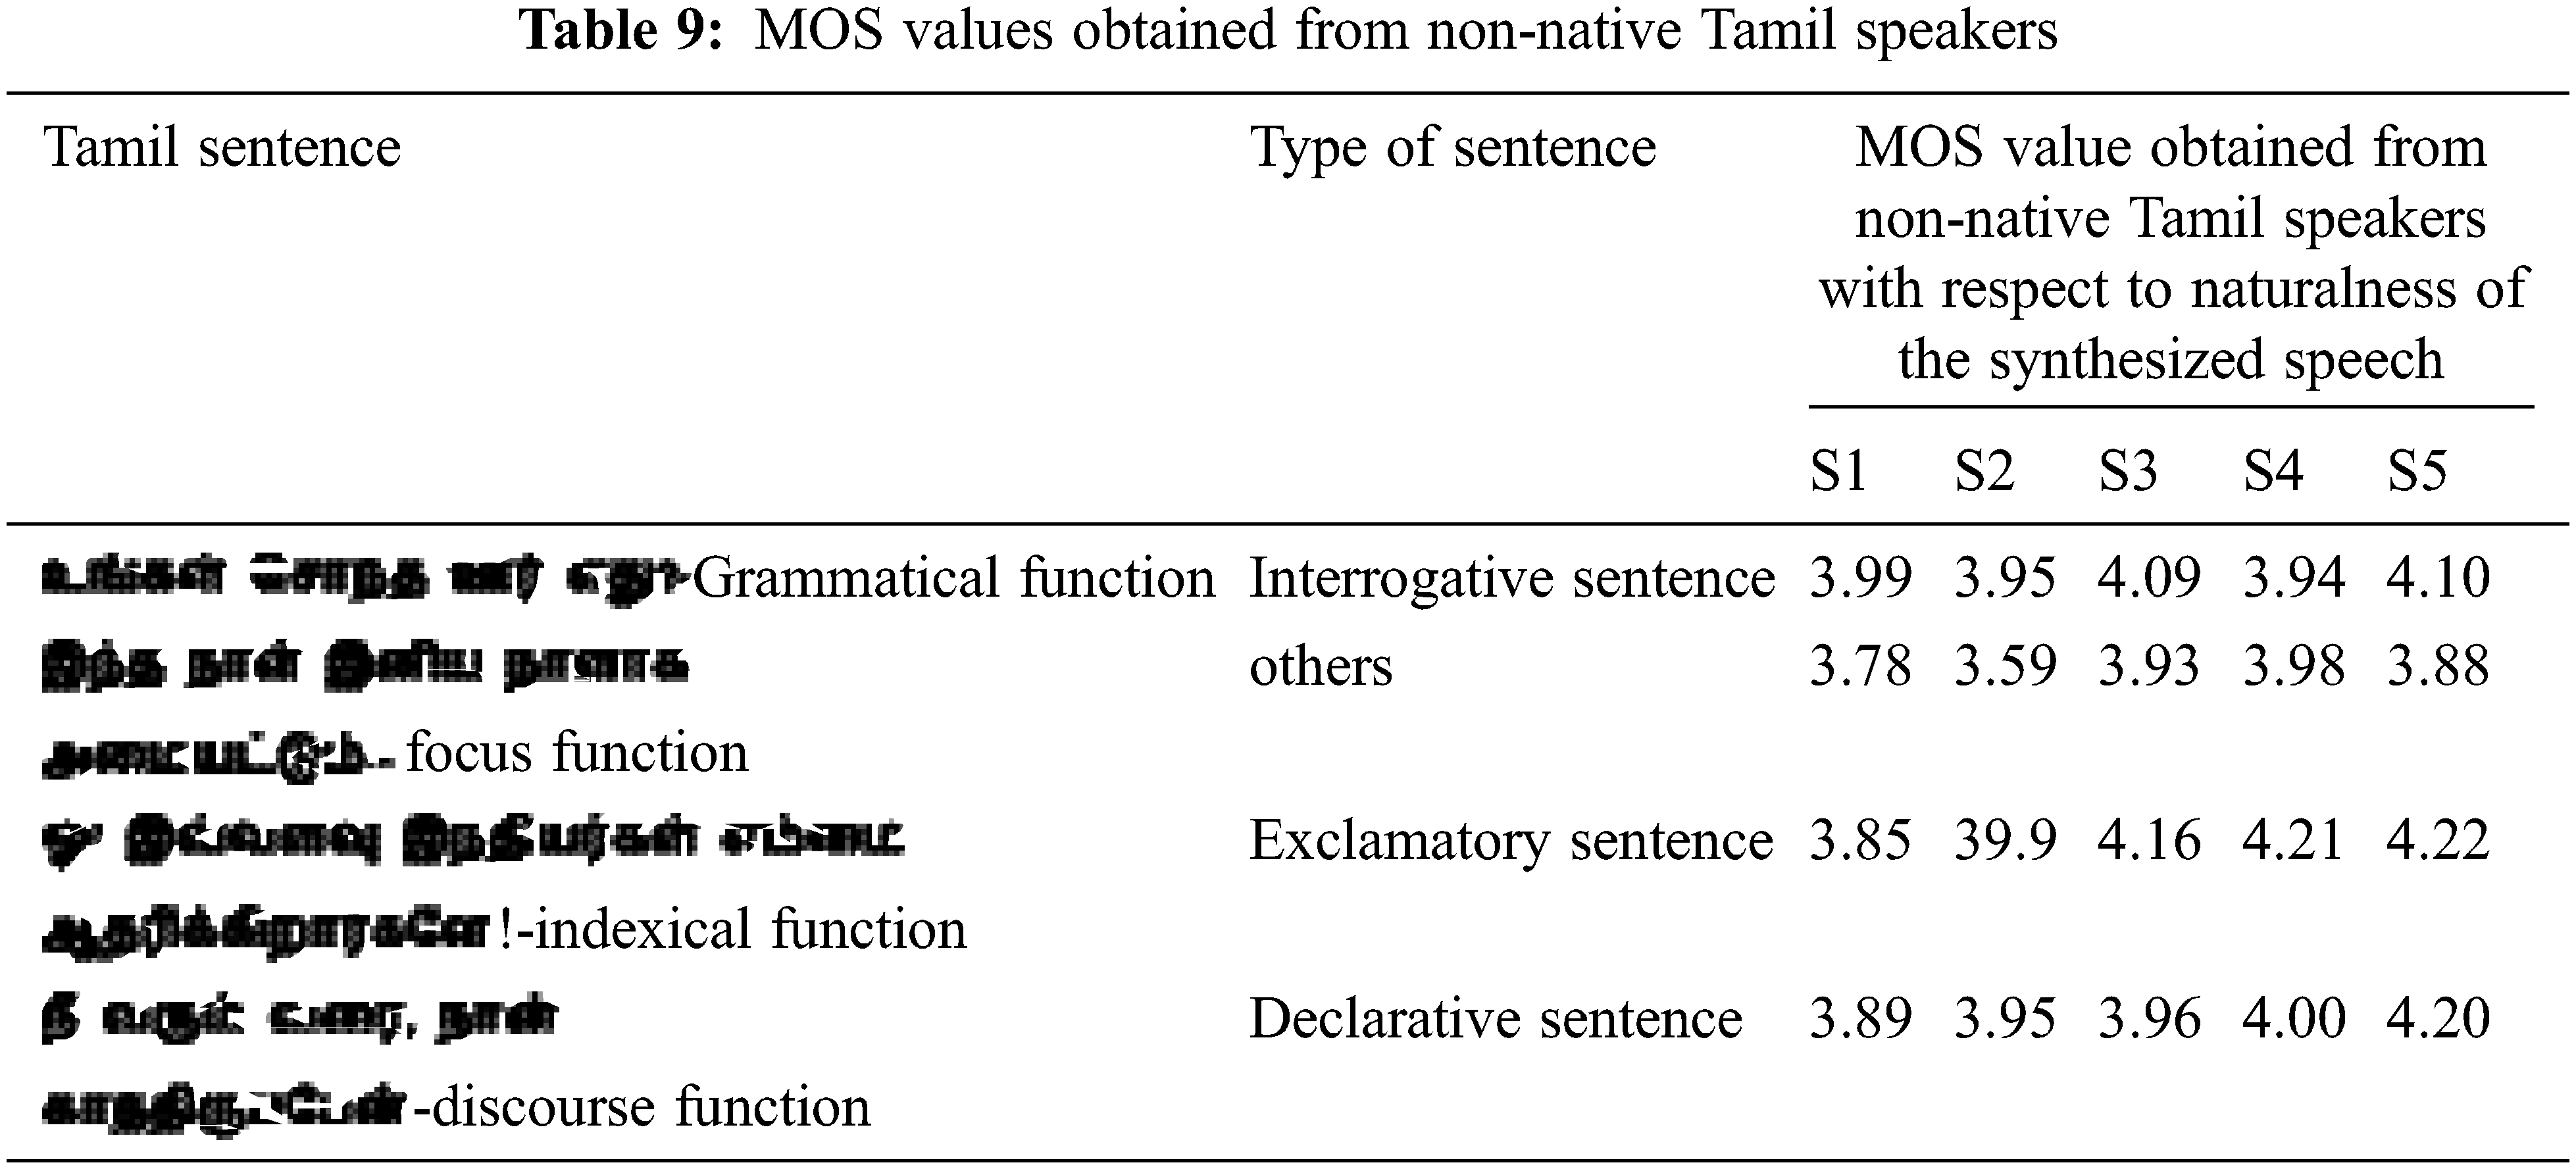
It is observed from the Tabs. 8 and 9 that the average MOS in terms of naturalness perceived by Tamil speakers are 4.08 for interrogative sentence, 3.76 for others category, 4.09 for exclamatory sentence and 4.036 for declarative sentence. The average MOS scores obtained from non-native Tamil speakers for the set of sentences is 4.01, 3.83, 4.08 and 4.00 respectively. The MOS values show good score for exclamatory sentences and are provided by both native and non-native Tamil speakers. This result validates the proposed technique of speech feature extraction in which extracting phoneme with cepstrum variation is a feature of interest.
This paper highlights the enhanced quality of speech in Tamil TTS. The work has proposed a completely new text and speech processing techniques. Special symbols present in the text enables extracting the intonation information, a prosodic component as the meaningful text feature. Speech feature extraction using phoneme with cepstrum variation as the feature choice is presented. The PCV based features are extracted and further selection is done to extract optimal features using Mosquito spreading optimization algorithm. A RKL learning classifier is used to classify the labeled outputs. The result is used to incorporate necessary prosody modification when the speech is synthesized. The merit of the proposed system is it eradicates the need to study the actual human articulatory mechanism which is extensive and tiresome process. The performance of the proposed approach is compared against the existing feature extraction techniques. The comparison results of objective measures such as SNR values, NCC values and subjective measure MOS shows the improvement in the quality of speech, in accordance with the proposed approach. From the results, it is evident that the quality of synthetic speech is enhanced by 14% when the proposed PCV based speech feature extraction is used rather than the transformation based MFCC.
Funding Statement: The authors received no specific funding for this study.
Conflicts of Interest: The authors declare that they have no conflicts of interest to report regarding the present study.
1. M. T. Makwana and D. C. Vegda. “Survey: Natural language parsing for Indian languages,” arXiv preprint arXiv:1501.07005, pp. 1–9, 2015. [Google Scholar]
2. B. Sudhakar and R. Bensraj, “Enhanced evaluation of sentiment analysis for tamil text-to-speech synthesis using hidden semi-markov model,” Communication on Applied Electronics, vol. 3, no. 6, pp. 13–16, 2015. [Google Scholar]
3. V. J. Pooja, B. M. Smitha, K. K. Pratik and R. R. Desmukh, “A comparative study between MFCC and DWT feature extraction technique,” International Journal of Engineering Research & Technology, vol. 3, no. 1, pp. 3124–3127, 2014. [Google Scholar]
4. K. C. Rajeswari and P. UmaMaheswari, “Feature extraction and analysis of speech quality for tamil text-to-speech synthesis system using fast Fourier transform,” Australian Journal of Basic and Applied Sciences, vol. 9, no. 35, pp. 349–356, 2015. [Google Scholar]
5. N. Shreya and G. Divya, “Speech feature extraction techniques: A review,” International Journal of Computer Science and Mobile Computing, vol. 4, no. 3, pp. 107–114, 2015. [Google Scholar]
6. A. Apte and H. Gado, “Tamil character recognition using structural features,” 2010. [Google Scholar]
7. V. Ramu Reddy and K. Sreenivasa Rao, “Two-stage intonation modeling using feed forward neural networks for syllable based text-to-speech synthesis,” Computer Speech and Language, vol. 25, no. 5, pp. 1105–1126, 2013. [Google Scholar]
8. A. R. Beigi and A. E. Rasekh, “Paragraph intonation patterns among Persian speakers’ English interlanguage: The diversity of paratones in focus,” Covenant Journal of Language Studies (CJLS), vol. 3, no. 1, pp. 1–17, 2015. [Google Scholar]
9. J. Romportl and J. Kala, “Prosody modeling in Czech text-to-speech synthesis,” in Proc. Sixth ISCA Workshop on Speech Synthesis, Bonn, Germany, pp. 200–205, 2007. [Google Scholar]
10. U. Shrawankar and V. M. Thakare, “Techniques for feature extraction in speech recognition system: A comparative study,” International Journal of Computer Applications in Engineering, Technology and Sciences, vol. 2, no. 2, pp. 412–418, 2013. [Google Scholar]
11. M. Shafi, M. S. Khan, N. A. Sattar, M. Rizwan, A. A. Baba et al., “Transform based speech enhancement using DCT based MMSE filter and its comparison with DFT filter,” Journal of Space Technology, vol. 1, no. 1, pp. 47–52, 2012. [Google Scholar]
12. P. K. Kurzekar, R. R. Deshmukh, V. B. Waghmare and P. P. Shrishrimal, “A comparative study of feature extraction techniques for speech recognition system,” International Journal of Innovative Research in Science, Engineering and Technology, vol. 3, no. 12, pp. 18006–18016, 2014. [Google Scholar]
13. V. K. Yadav, A. Jain and L. Bhargav, “Analysis and comparison of audio compression using discrete wavelet transform,” International Journal of Advanced Research in Computer and Communication Engineering, vol. 4, no. 1, pp. 310–313, 2015. [Google Scholar]
14. C. Rajeswari, B. Sathiyabhama, S. Devendiran and K. Manivannan, “Bearing fault diagnosis using wavelet packet transform, hybrid PSO and support vector machine,” Procedia Engineering, vol. 97, no. 1, pp. 1772–1783, 2014. [Google Scholar]
15. V. K. Sharma and A. P. Kumar, “Continuous telugu speech recognition by joint feature extraction of MFCC, MODGDF and DWPD techniques by PNN classifier,” International Journal of Pure and Applied Mathematics, vol. 118, no. 20, pp. 865–872, 2018. [Google Scholar]
16. D. Sheoran, P. Sangwan and M. Khanna, “Spectral feature extraction techniques for speech recognition,” International Journal of Multidisciplinary Research and Development, vol. 4, no. 6, pp. 33–38, 2017. [Google Scholar]
17. Y. Lee and T. Kim, “Robust and fine-grained prosody control of end-to-end speech synthesis,” in Proc. IEEE Int. Conf. on Acoustics, Speech and Signal Processing, Brighton, United Kingdom, pp. 5911–5915, 2019. [Google Scholar]
18. G. Sun, Y. Zhang, R. J. Weiss, Y. Cao, H. Zen et al., “Fully-hierarchical fine-grained prosody modeling for interpretable speech synthesis,” in Proc. ICASSP, Barcelona, Spain, pp. 6264–6268, 2020. [Google Scholar]
19. C. Miao, S. Liang, Z. Liu, M. Chen, J. Ma et al., “Efficient TTS: An efficient and high-quality text-to-speech architecture,” in ICML, pp. 7700–7709, 2021. https://icml.cc/Conferences/2021. [Google Scholar]
20. Mustaqeem and S. Kwon, “Att-net: Enhanced emotion recognition system using lightweight self-attention module,” Applied Soft Computing, vol. 102, pp. 107101, 2021. [Google Scholar]
21. Mustaqeem and S. Kwon, “1d-CNN: Speech emotion recognition system using a stacked network with dilated CNN features,” Computers, Materials & Continua, vol. 67, no. 3, pp. 4039–4059, 2021. [Google Scholar]
22. Mustaqeem and S. Kwon, “Optimal feature selection based speech emotion recognition using two-stream deep convolutional neural network,” International Journal of Intelligent Systems, 2021. [Online]. Available: https://doi.org/10.1002/int.22505. [Google Scholar]
 | This work is licensed under a Creative Commons Attribution 4.0 International License, which permits unrestricted use, distribution, and reproduction in any medium, provided the original work is properly cited. |