DOI:10.32604/iasc.2022.024538
| Intelligent Automation & Soft Computing DOI:10.32604/iasc.2022.024538 | |
| Article |
Extreme Learning Bat Algorithm in Brain Tumor Classification
1Department of Computer Science and Engineering, Kongu Engineering College, Erode, 638060, India
2Department of Statistics and Operations Research, College of Science, King Saud University, Riyadh, 11451, Saudi Arabia
3Department of Applied Cybernetics, Faculty of Science, University of Hradec Králové, Hradec Králové, 50003, Czech Republic
4Department of Mathematics, Faculty of Science, Mansoura University, Mansoura, 35516, Egypt
5Department of Computational Mathematics, Science, and Engineering (CMSE), Michigan State University, East Lansing, MI, 48824, USA
*Corresponding Author: Mohamed Abouhawwash. Email: abouhaww@msu.edu
Received: 21 October 2021; Accepted: 10 January 2022
Abstract: Brain tumor is considered as an unusual cell that presents and grows in the brain. Similarly, it may lead to cancerous or non-cancerous. So, to improve the survival rate of the patient and to give the best treatment at the earliest, it’s very necessary for early prediction of tumor. Accurate classification of tumor in the brain is important for improving the diagnosis. In accordance with that, various research programs are invited for the better treatment of the patients. Machine Learning (ML) algorithms are applied to help the health associates for the classification of brain tumor and present their diagnosis. This paper focuses primarily on brain tumors of meningioma, Glioma, and pituitary. Moreover, the manual evaluation of Magnetic Resonance Image (MRI) is a difficult process. For accessing MRI brain image in the aspects of its volume, boundaries, detecting tumor size, shape and classification are the challenging tasks. To overcome these difficulties, this paper proposes a novel approach in feature selection using bat algorithm with Extreme Learning Machine (ELM) and for enhancing the accurate classification by Transfer Learning (BA + ELM-TL). Here the data is pre-processed to remove noises; Stationary Wavelet Transforms (SWT) is used to extract the features from the MRI brain image. This paper has collected the dataset from fig share, whole brain atlas and TCGA-GBM data set. Therefore, it is proved that 92.6% is the accuracy of Bat algorithm, 90.4% for Extreme Learning algorithm and 98.87% for BA + ELM-TL.
Keywords: MRI; brain tumor; wavelet transform; bat algorithm; ELM; transfer learning
In medical field, the development of technology gives prompt diagnosis of MRI brain tumors, and it can be accessed by the tools of Computer Aided Diagnosis (CAD), MRI. Though, it can be identified by humans, it is difficult to monitor the huge volume of data for them. In brain tumor, detection at the early stage is done by expert in radiologist [1]. The diagnostics of brain tumor is dependent on the examination of the tissue, for which biopsy is needed. In order to get precise analysis, a diagnostic tool is required. The classification from MRI images is done using machine learning and artificial intelligence. In the field of medicine, these tools support for various medical branches including medical image processing. Different algorithms in machine learning are used in tumor image classification, and segmentation of image.
For brain tumor classification, this paper has used three well-known types of tumors like meningioma, glioma, and tumors in pituitary. The meningioma tumor arises from the membrane which surrounds the brain and mid part of the nervous system. Next, Glioma is initiated from the brain tissue. Lastly, tumors at Pituitary are similar to lumps that arise inside the skull [2–5]. Automatic computer aided diagnostics tools are used to process the clinical medical data such as detection of tumor, its location, size, and classification. Using MRI for the treatment process generates contrast in image and has non-invasive property [6].
The most important task in understanding the image is segmentation of image and only after that it helps in terms of feature extraction, feature selection, and implication in many real-life medical applications. For example, it can be used in the estimation of tumor size, tumor volume, classification of tissue in the brain image, and location of tumors and image registration. For monitoring clinical image data, the identification of tumor in the brain image is a critical task. However, recently there are numerous automatic tumor detection techniques that are proposed for brain tumor classification using deep learning algorithms.
To overcome these issues the proposed work has implemented feature selection using bat algorithm with extreme learning machine technique for accurate MRI classification of brain image using transfer learning. The contributions of the proposed work are given below:
1. To implement an enhanced version of feature selection using Bat algorithm with extreme learning machine via transfer learning.
2. Proposed work (BA + ELM-TL) generates the classification of brain image and establish better performance metric measures using Figshare dataset.
Rest of the research article is written as follows: Section 2 discusses the literature work on various classification of brain image processing and methods. Section 3 shows the algorithm process and general working methodology of proposed work. Section 4 evaluates the implementation and results of the study. Section 5 concludes the work and discusses the result evaluation.
In the medical field, the image analysis and the image processing of brain MRI are the most challenging tasks in producing high quality images for diagnosing the diseases. Brain tumor classification is manually an error prone, and it is a challenging one for the radiologists. Various multimodalities of MRI brain tumors are T1, T2, and Flair that are needed to be determined for texture and shape features of MRI image [7]. Computer Aided Diagnosis (CAD) system is the most popular technique in the diagnosis of MRI brain tumor [8]. In an automated processing of CAD system, the two-stage processes are exhibited. In the first step, it implements the preprocessing algorithm and extracts the features and in the second stage, it classifies the tumor image into a relevant group.
Various machine-learning techniques are used for segmentation and classification of MRI image that helps the neuro-oncologists for providing efficient treatment of brain tumor. In the classification of brain tumors, four types of sarcoma, tumor-free, metastasis and glioblastoma tumors are used and by the use of DNN, it produces 96.97% of accuracy [9]. In the literature, various modifications of pre-trained network were used for analysis of image, segmentation, and classification of brain images. Various techniques have been implemented in the brain tumor medical databases [10,11].
Classification of brain tumor using regions in the image augmentation process such as ring-form image partition and dilation of image help in the accurate classification. This approach got accuracy of 91.28% [12]. Statistical features are separated from the MRI brain image with the help of filters namely, Gabor and Discrete-Wavelet Transforms (DWT). Further Multi-Layer Perceptron (MLP) classifier algorithm is applied in training the model using statistical features. Dataset of Figsh is used and trained the model on the basis of 70:30 as training and validation set of images [13].
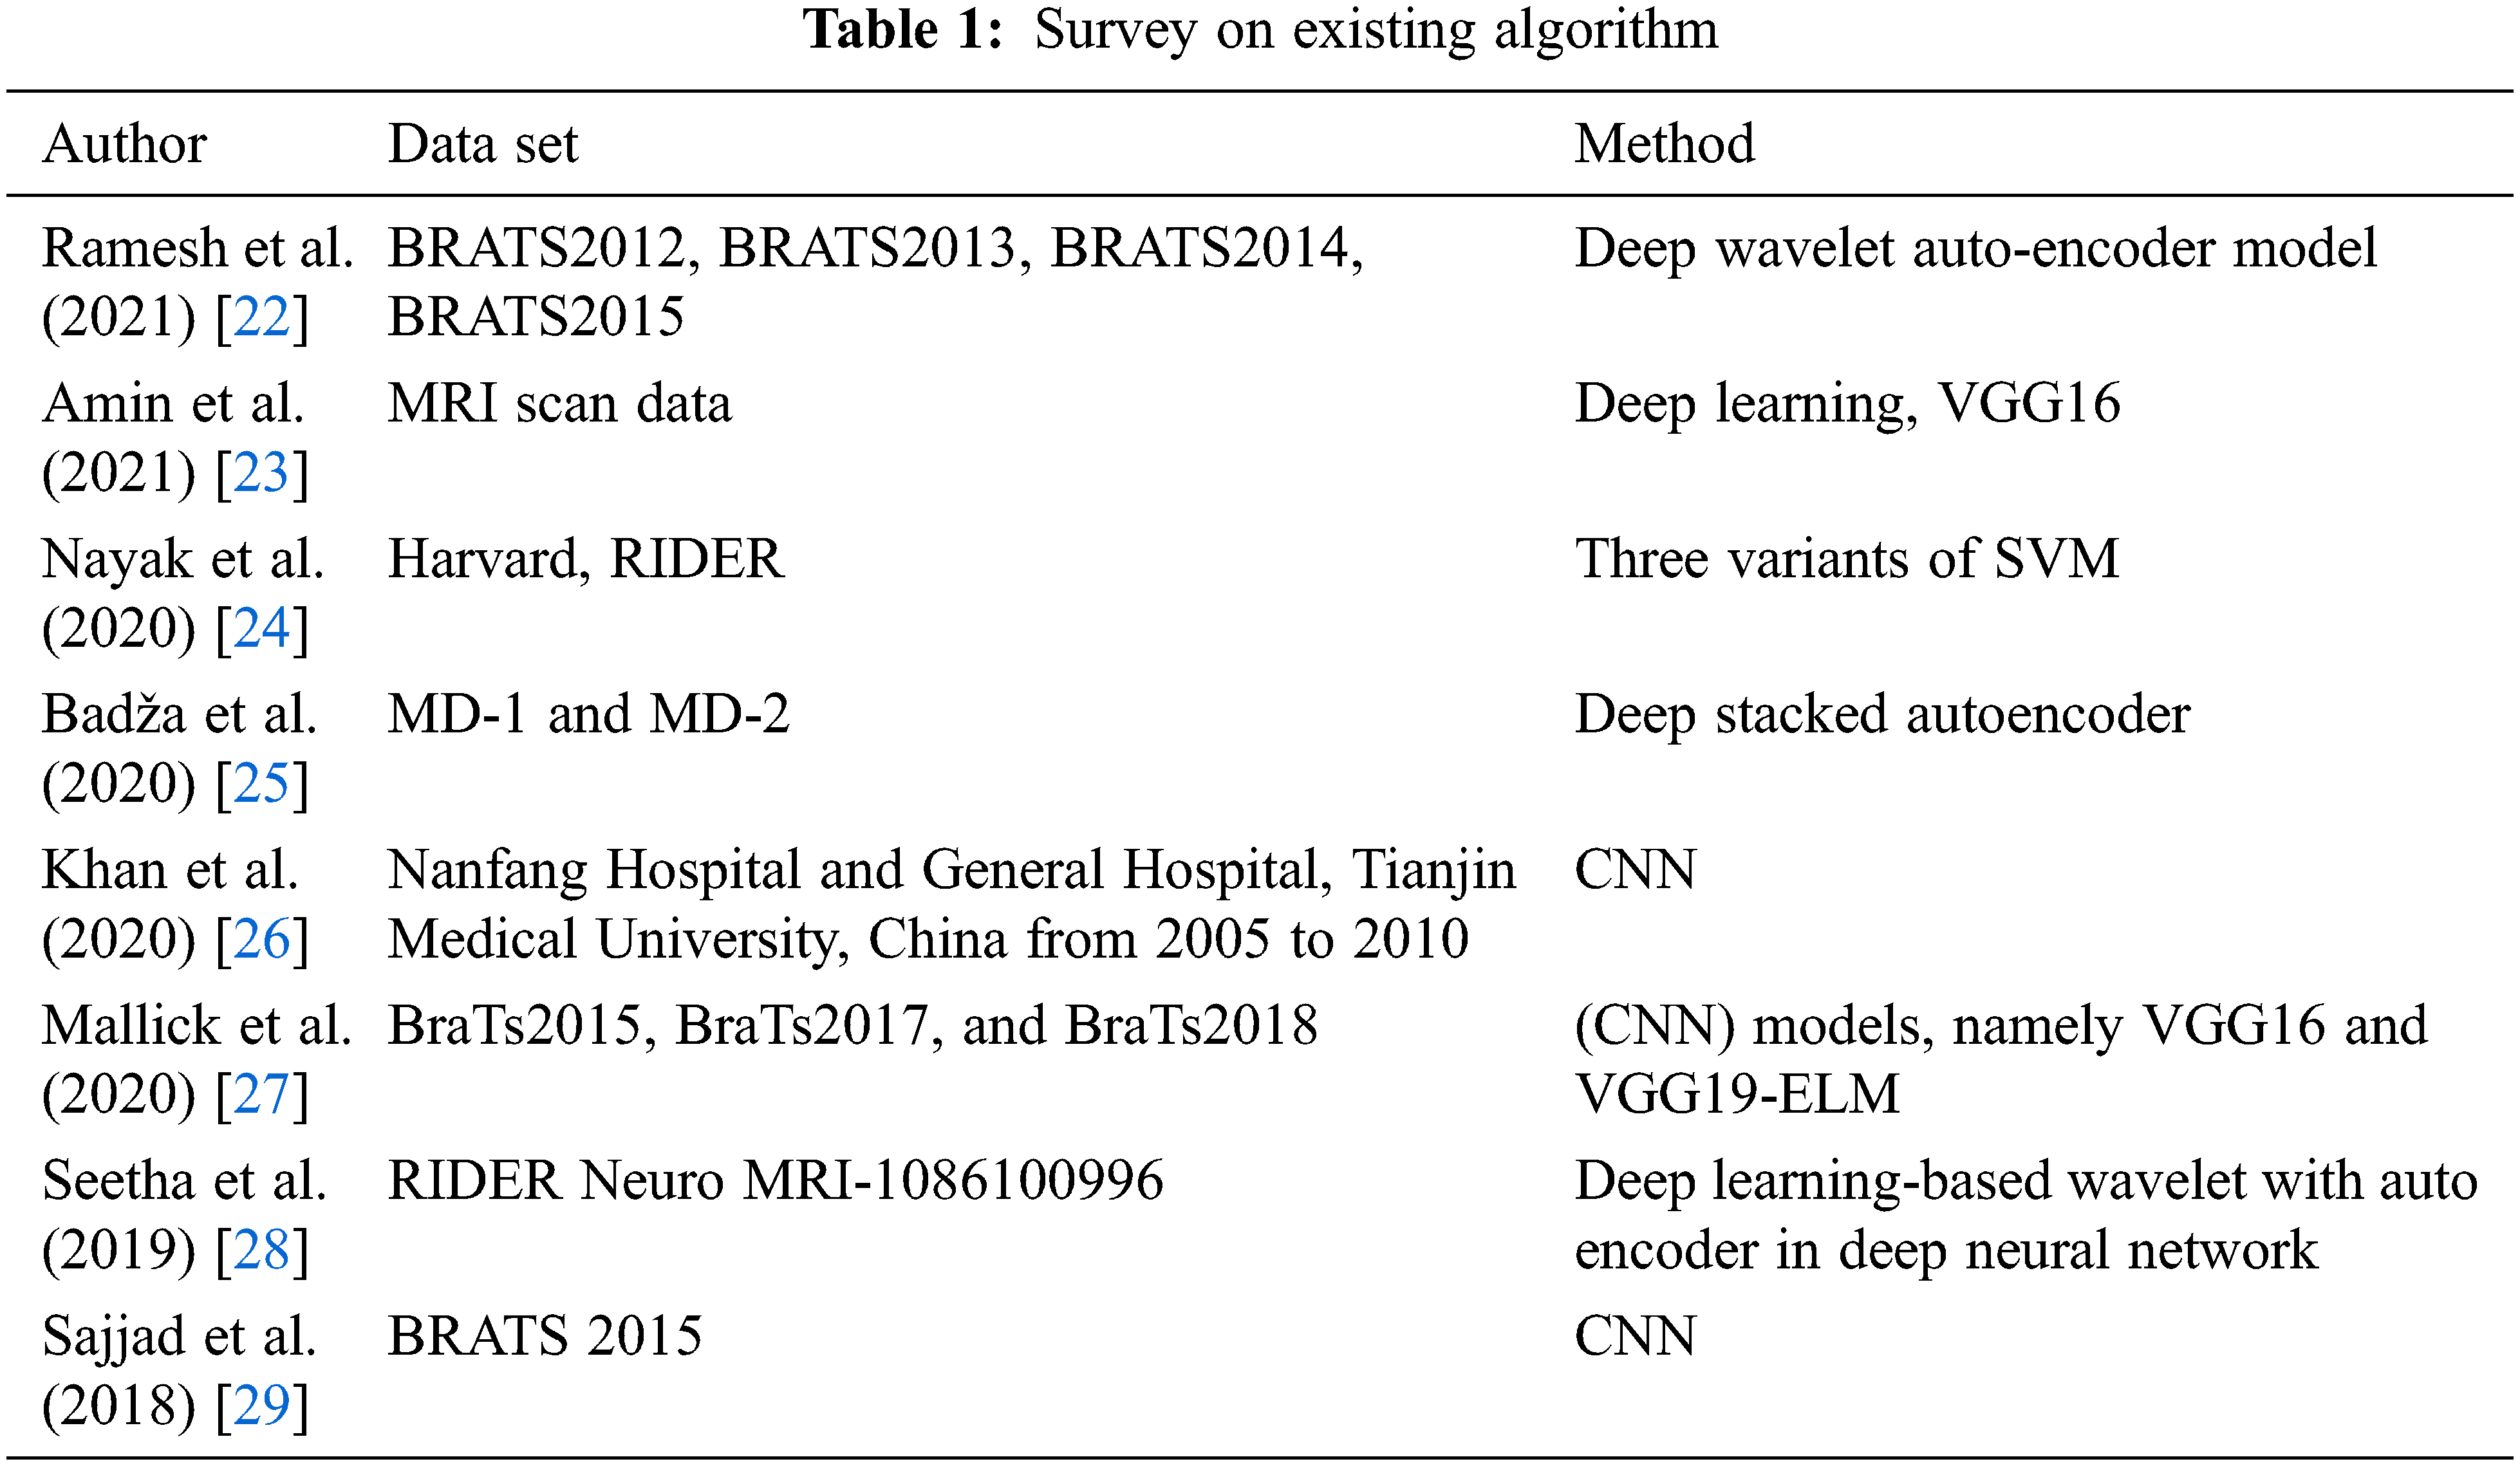
Bat algorithm was presented in Genetic Algorithms (GA) and Particle Swarm Optimization (PSO) and evaluated using benchmark functions [14]. This BA was outperformed in solving the problem of optimization like clustering, motor wheel optimization, constrained optimization, and global engineering optimization [15–20]. BA algorithm is more complicated in assigning the bat as agent with parameters of loudness, pulse rate, position, frequencies, and velocity [21]. Tab. 1 shows the existing algorithm.
3 Proposed Methodology for Classifying Brain Tumor
The process of classifying the brain tumors images is an essential one for the purpose of diagnosis. This proposed work BA + ELM-TL improves the performance of classification, requires less time complexity, high processing speed. It is computer based assisted for the classification of brain tumor and its diagnosis. This work needs three phases such as 1. Pre-processing, 2. Feature Extraction, 3. Feature Selection. Fig. 1 shows the architecture of the proposed work.

Figure 1: Architecture of proposed work
Proposed algorithm extracts the features from the MRI brain image using stationary wavelet algorithm and for feature selection using BAT with ELM algorithm in order to produce the output promptly. Therefore, transfer learning is adopted for providing fine tuning classification of tumor images.
To improve the MRI image quality and to enhance the parameters of MRI image, which is used for further processing by medical experts, pre-processing stage is needed, Fig. 2.

Figure 2: Stages in pre-processing
The stages involve in the pre-processing are:
Stage 1: Applying median filter in the development of brain image.
Stage 2: Data Augmentation
Stage 3: Normalization of the image using Min-Max Normalization Technique.
Fig. 2 shows the different stages of pre-processing.
3.1.1 Enhancing the Brain Tumor Image Using Median Filter
Scan the whole MRI brain image using 4 × 4 window size and calculate the median value for the image and the central pixel value is to be replaced by its median value. See Eq. (1).
where P represents a neighborhood pixel value defined by the user and the centered around location [m, n] in the image.
To get better quality of classification, MRI image data augmentation is applied. It involves transformation of MRI image by performing rotation and flipping operation. The study involves rotation of image using 90 degree and also the image is flipped horizontally [30].
3.1.3 Normalization of the Image Using Min-Max Normalization Technique
To normalize the input, MRI image of size 512 × 512 pixels is used and the value of intensity between 0, and 1 is evaluated using Eq. (2)
Here, pi is the normalized intensity value of position of image
3.2 Feature Extraction Using Stationary Wavelet Transform
In this proposed work, feature extraction of the image is used by Stationary Wavelet Transform (SWT). Here the input signal of the image is convolved with low pass filter value of low[img] and high pass filter value of high[img] and the coefficient number is twice with the input signal of the image in different sub-bands. Fig. 3 shows the single level sub-band technique of input brain image.

Figure 3: Single-level sub-band technique
In Fig. 3, Sub-band LL represents the horizontal and vertical low frequency components of the MRI brain image. Sub-band HH represents the horizontal and vertical high frequency components of the MRI brain image. Sub-band LH represents the horizontal low and vertical high frequency components of MRI brain image. Sub-band HL1 represents the horizontal high and vertical low frequency components of MRI brain image. Fig. 4 shows the level as single and stationary based wavelet transform decomposing the image into four sub-bands.
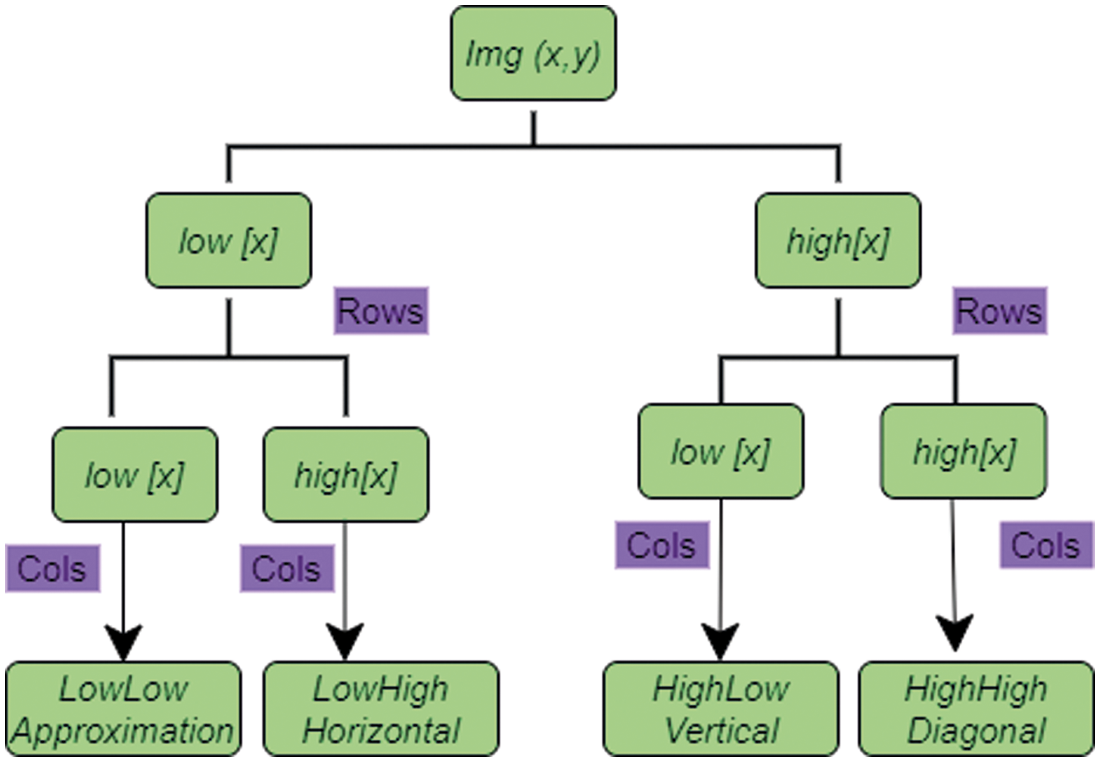
Figure 4: Single level of stationary based decomposition using wavelet transform
In Fig. 4, the MRI image Img(x, y) is splitted into four separate sub bands as 1) LowLow (LL), 2) LowHigh (LH), 3) HighLow (HL), and 4) HighHigh (HH) which represents approximately low resolution, and has information regarding horizontal, vertical, and diagonals of input image which produce the same x × y resolution. For extracting the features of input, brains image in ith level is given in Eq. (3):
where
The MRI brain images are available in various multi-modals. The selection of best features is essential in the classification of image. This proposed work implements Bat Algorithm with Extreme Learning via Transfer Learning (BA + ELM-TL).
It is based on the concept of Particle Swarm Optimization (PSO). Bats are mammals and it is capable of flying in sustainability. Echolocation is used so as to find food in microbats which avoid obstacles, locate the position in dark night. It updates their position and velocity in multidimensional searching space. Each microbat represents the echolocation of its pulse emission rate, a wavelength and frequency. Frequency of each microbat is defined as in Eq. (4):
where, frqi is frequency between the range of frqmin and frqmax. And the velocity of each microbat for jth iteration is given in Eq. (5):
where, veli(j) is velocity of microbat in jth iteration and xOPTI is the optimized solution in step j. Position calculation of each microbat in the jth iteration is given in Eq. (6):
where, xi(j) is the position of microbat in the jth iteration.
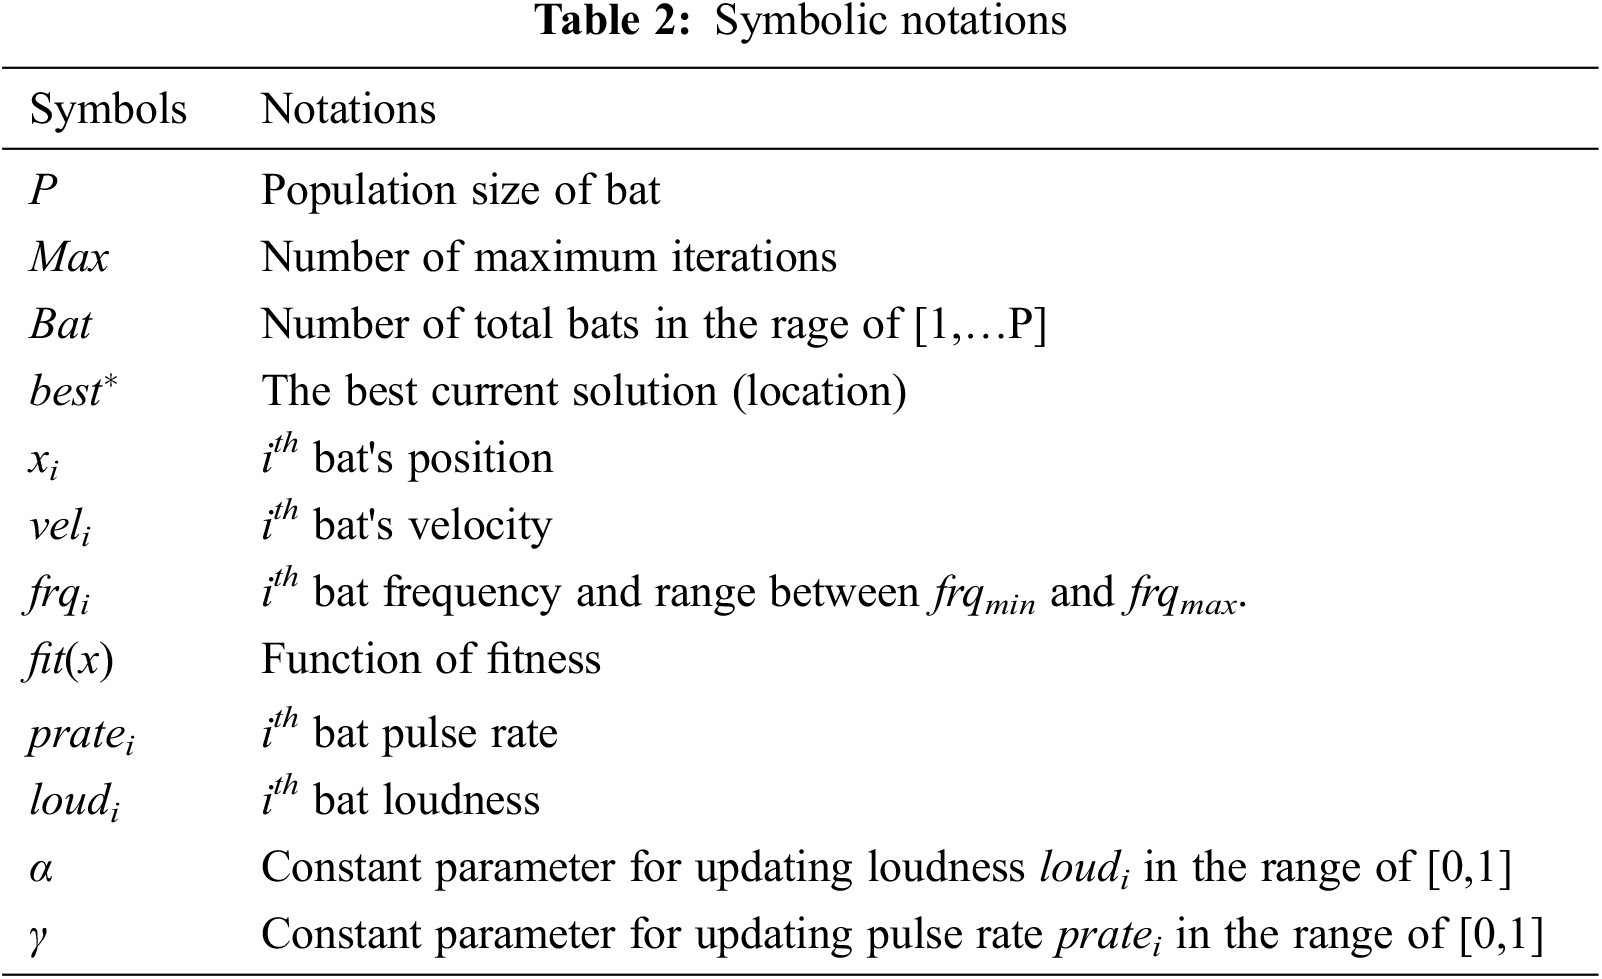
Tab. 2 shows the different notations that are used. Algorithm 1 describes the Bat Algorithm (BA) which is used for selecting the features of MRI brain image. The steps involved in the Bat Algorithm is given below:
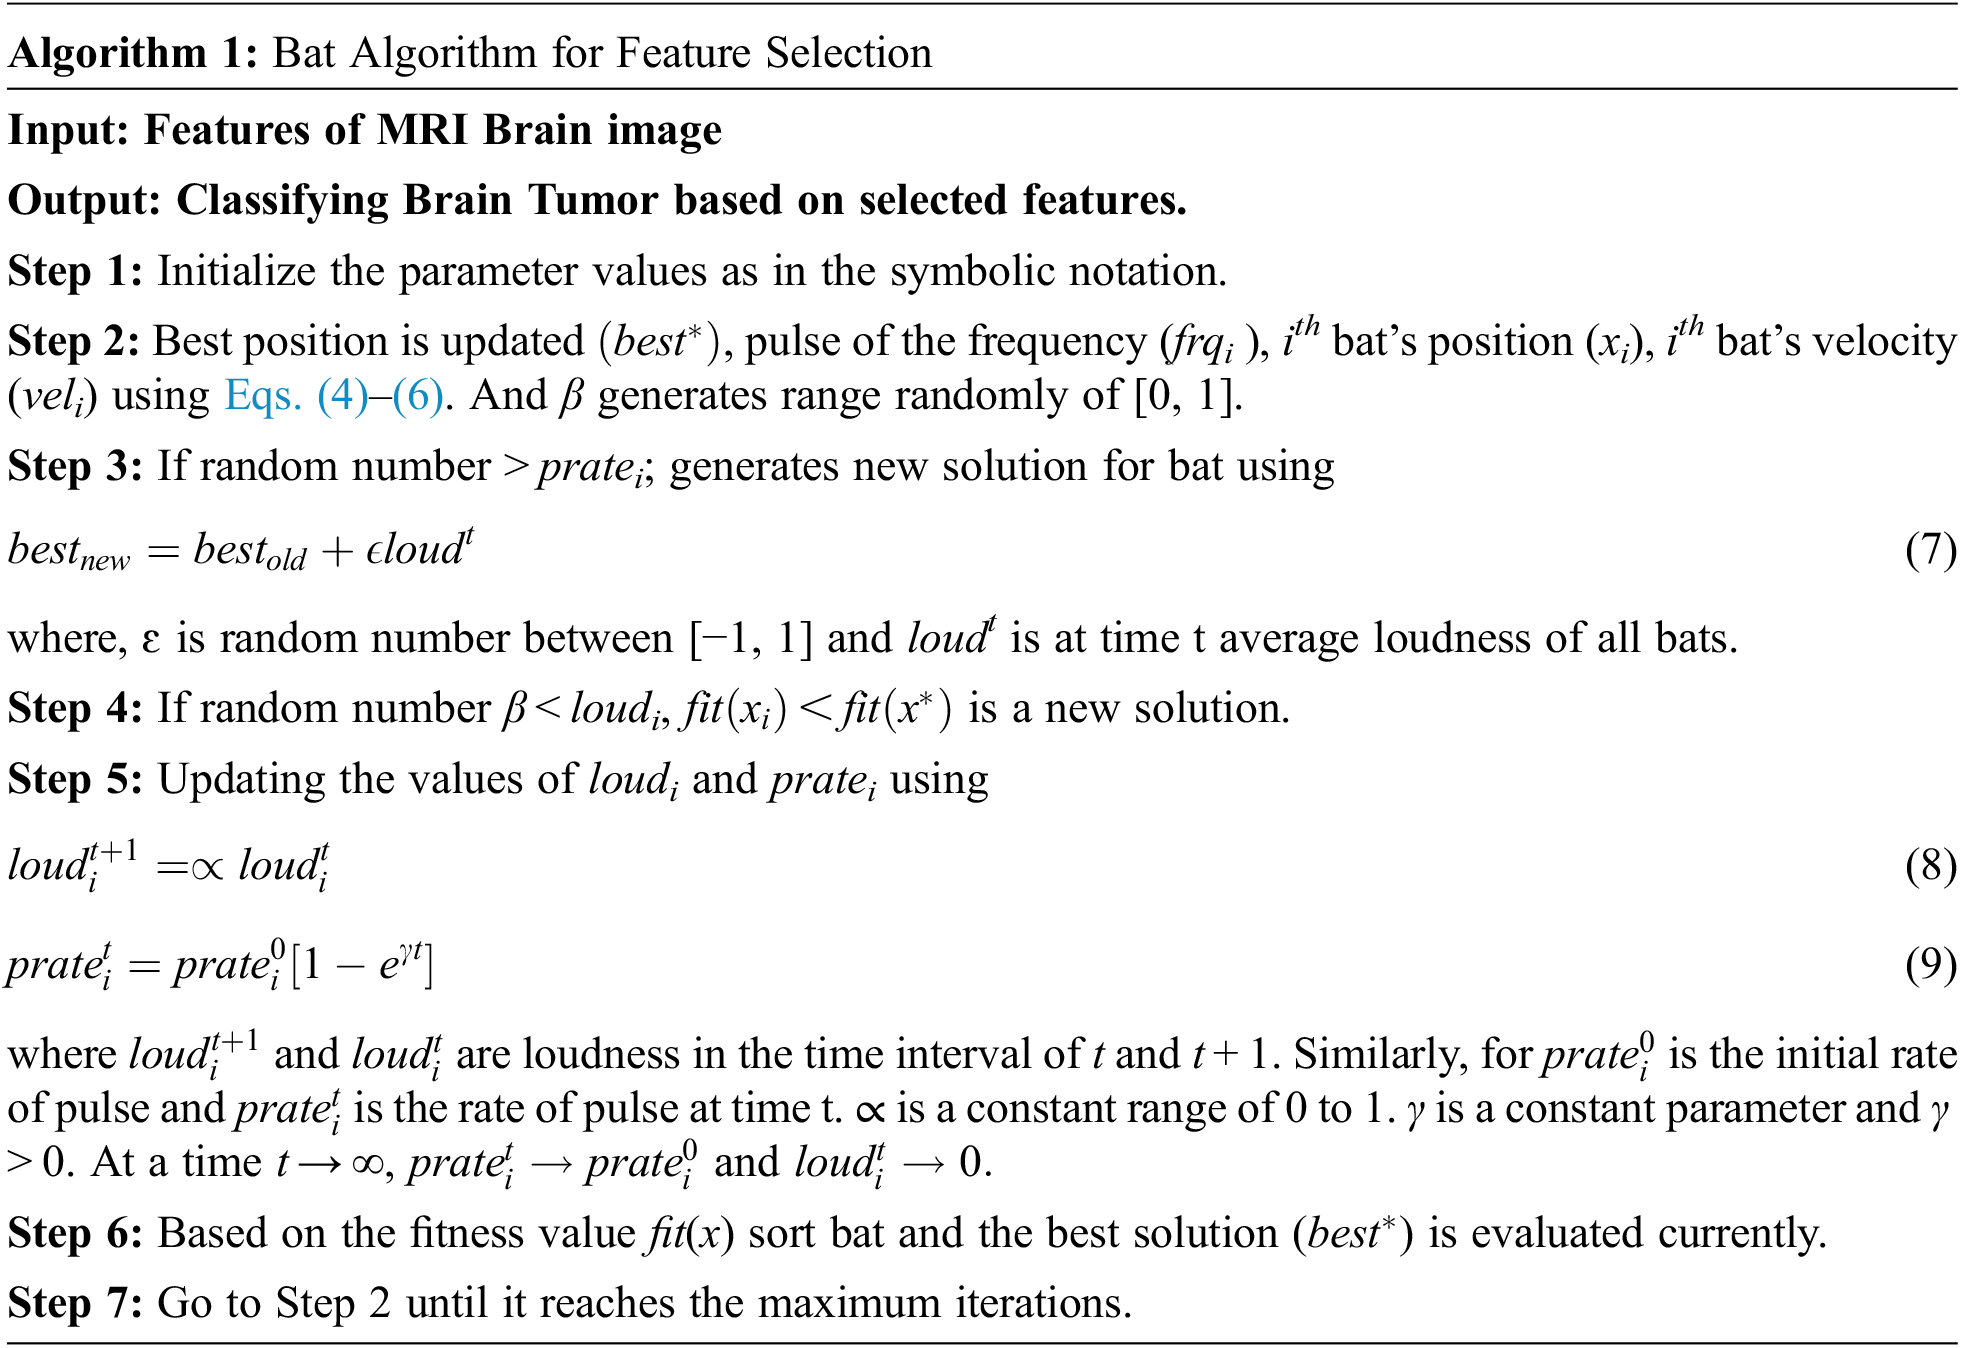
Algorithm 1 describes how tumor detection in the brain image is done by random choice of the pixel image with velocity at position, wavelength, frequency, and loudness to detect pixels of tumor tissue in the MRI brain image. By the adjustment of the wavelength value of the pixel and the closest pixel value of tumor can be checked out from the image. See Eqs. (7)–(9).
3.3.2 Extreme Learning Machine (ELM)
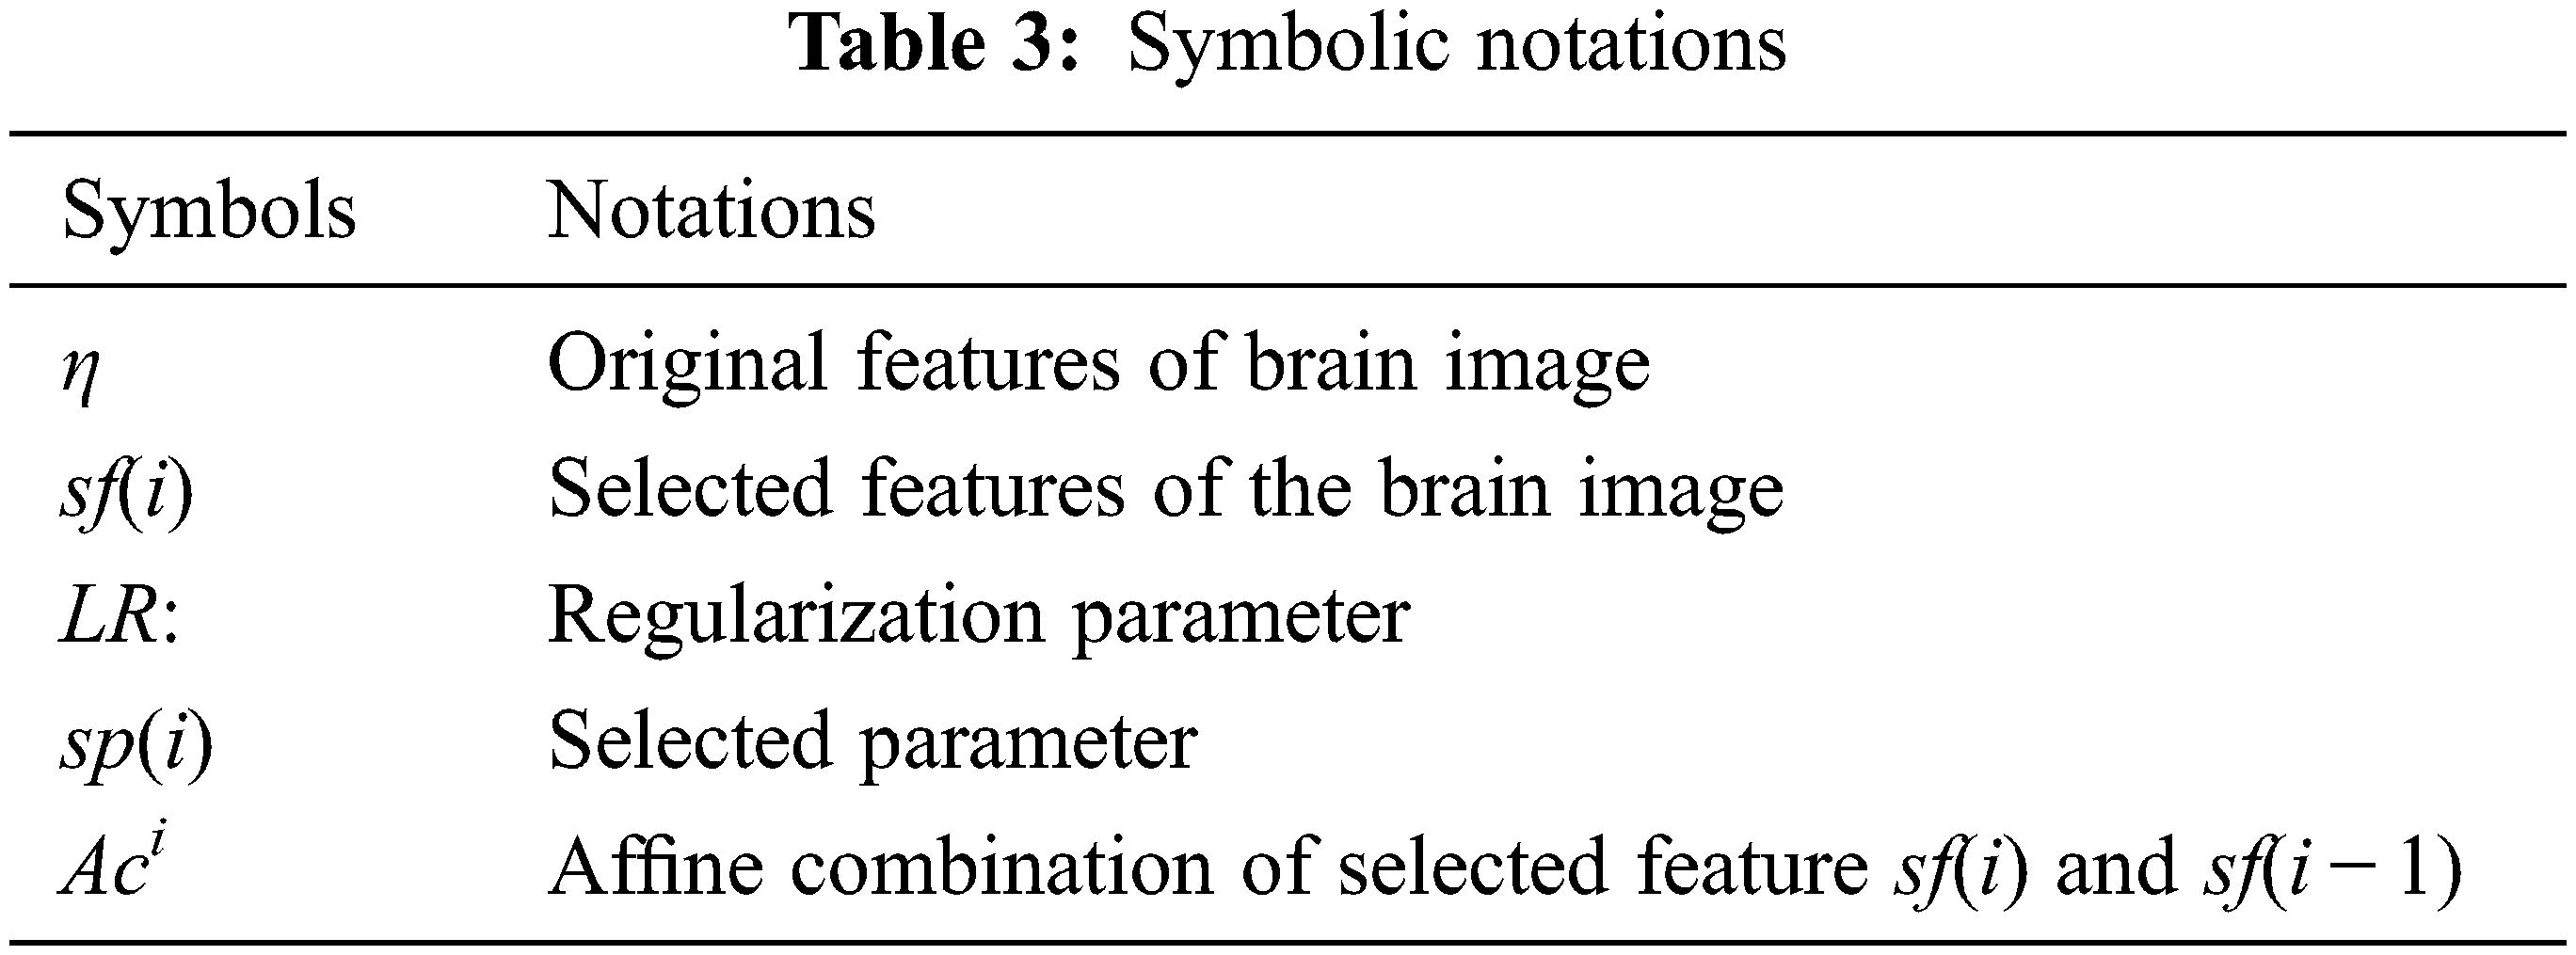
The aim of feature selection using ELM is used to reduce the feature redundancy and choose only robust exact features classification. And also, ELM is used to minimize the predictors and faster in execution. The working principle is given in Algorithm 2. Tab. 3 shows different notations that are used
Algorithm 1 presents the working principal of the proposed work:

Algorithm 2 is implemented and LRi is observed in the features of brain image, and
3.3.3 Feature Selection Using Bat with Extreme Learning Machine via Transfer Learning (BA + ELM-TL)
In the BRATS data set, training the model of VGG 19 using the same parameter values of Bat and ELM algorithm via Transfer Learning (TL) [31] is done. During the training process, read the input brain data set and evaluate the training in the ratio of 80:20 and each brain image label is defined. Then assign the training of input and output layer model. For VGG19 model, input convolution layer is applied using 64 filters with a size of 3 × 3 × 64 and the output is FC8. Afterwards, implement the activation function in the CNN model for the selected features of the brain image and train the model. The algorithm for BA + ELM-TLis given below:

The proposed Algorithm 3 shows the selected features of the brain image using ELM. Then from the selected features, optimized classification of brain tumor is found based on multiple fitness value. After that, calculate the fitness value for all pixels in the image. Randomly, generate the neighborhood pixel value and set it as the best. Next, evaluate the frequency and velocity for the best pixel values selected. Depending upon the velocity value, set min or max value. Then, update the location of bat. Each time, MSER value is evaluated and MSER is greater than or equal to 0.1. Next, update the features of the image. So, repeat the process for the maximum iterations. If search is not satisfied, the final iteration features were chosen for classification. At the same time, loudness is represented for a period of time it marks the changes in the features and also performs search for ith bat locally. The range of loudness is from minimum and maximum.
When the bat reaches the best solution, the loudness value gets decreased. The value of loudness and fitness plays an important role in finding the optimized solution.
For brain tumor classification, three datasets were used in this work. First dataset was from the open source that was the available dataset of fig share [32,33]. The second dataset contained images from the whole brain atlas [34]. Third data set images were collected from Cancer Genome Atlas Glioblastoma Multi-form (TCGA-GBM) dataset. In the first dataset data collected from 3064 T1-weighted, MRI brain images of 233 patients were diagnosed with Glioma, Meningioma, and Pituitary brain tumor types. Among this, it contained 1426 MRI brain images with glioma from 88 patients, 707 MRI brain images for meningioma from 83 patients and 931 MRI brain images of pituitary tumor from 62 patients. The images were available as .mat files and the size of each image was 512 × 512 [35]. Second data set contained 500 normal brain images. The third data set contained 262 MRI brain images [36].
Tab. 4 shows a comparison of existing and proposed BA + ELM-TL model. Here auto-encoder of Deep WAvelet with Deep Neural Network DWA-DNN technique is used for the classification of MRI brain tumor image classification which has got 92.16% of sensitivity, 94.26% of specificity, and 93.15% of precision. Detection of brain tumor images by Convolutional Neural Network (CNN) techniques had obtained 95% of specificity and 94.81% of precision. VGG16 methodology with Google Net model helped in brain tumor classification images and it had obtained 81.25% of sensitivity, 88.48% of specificity, and 89.66% of precision.
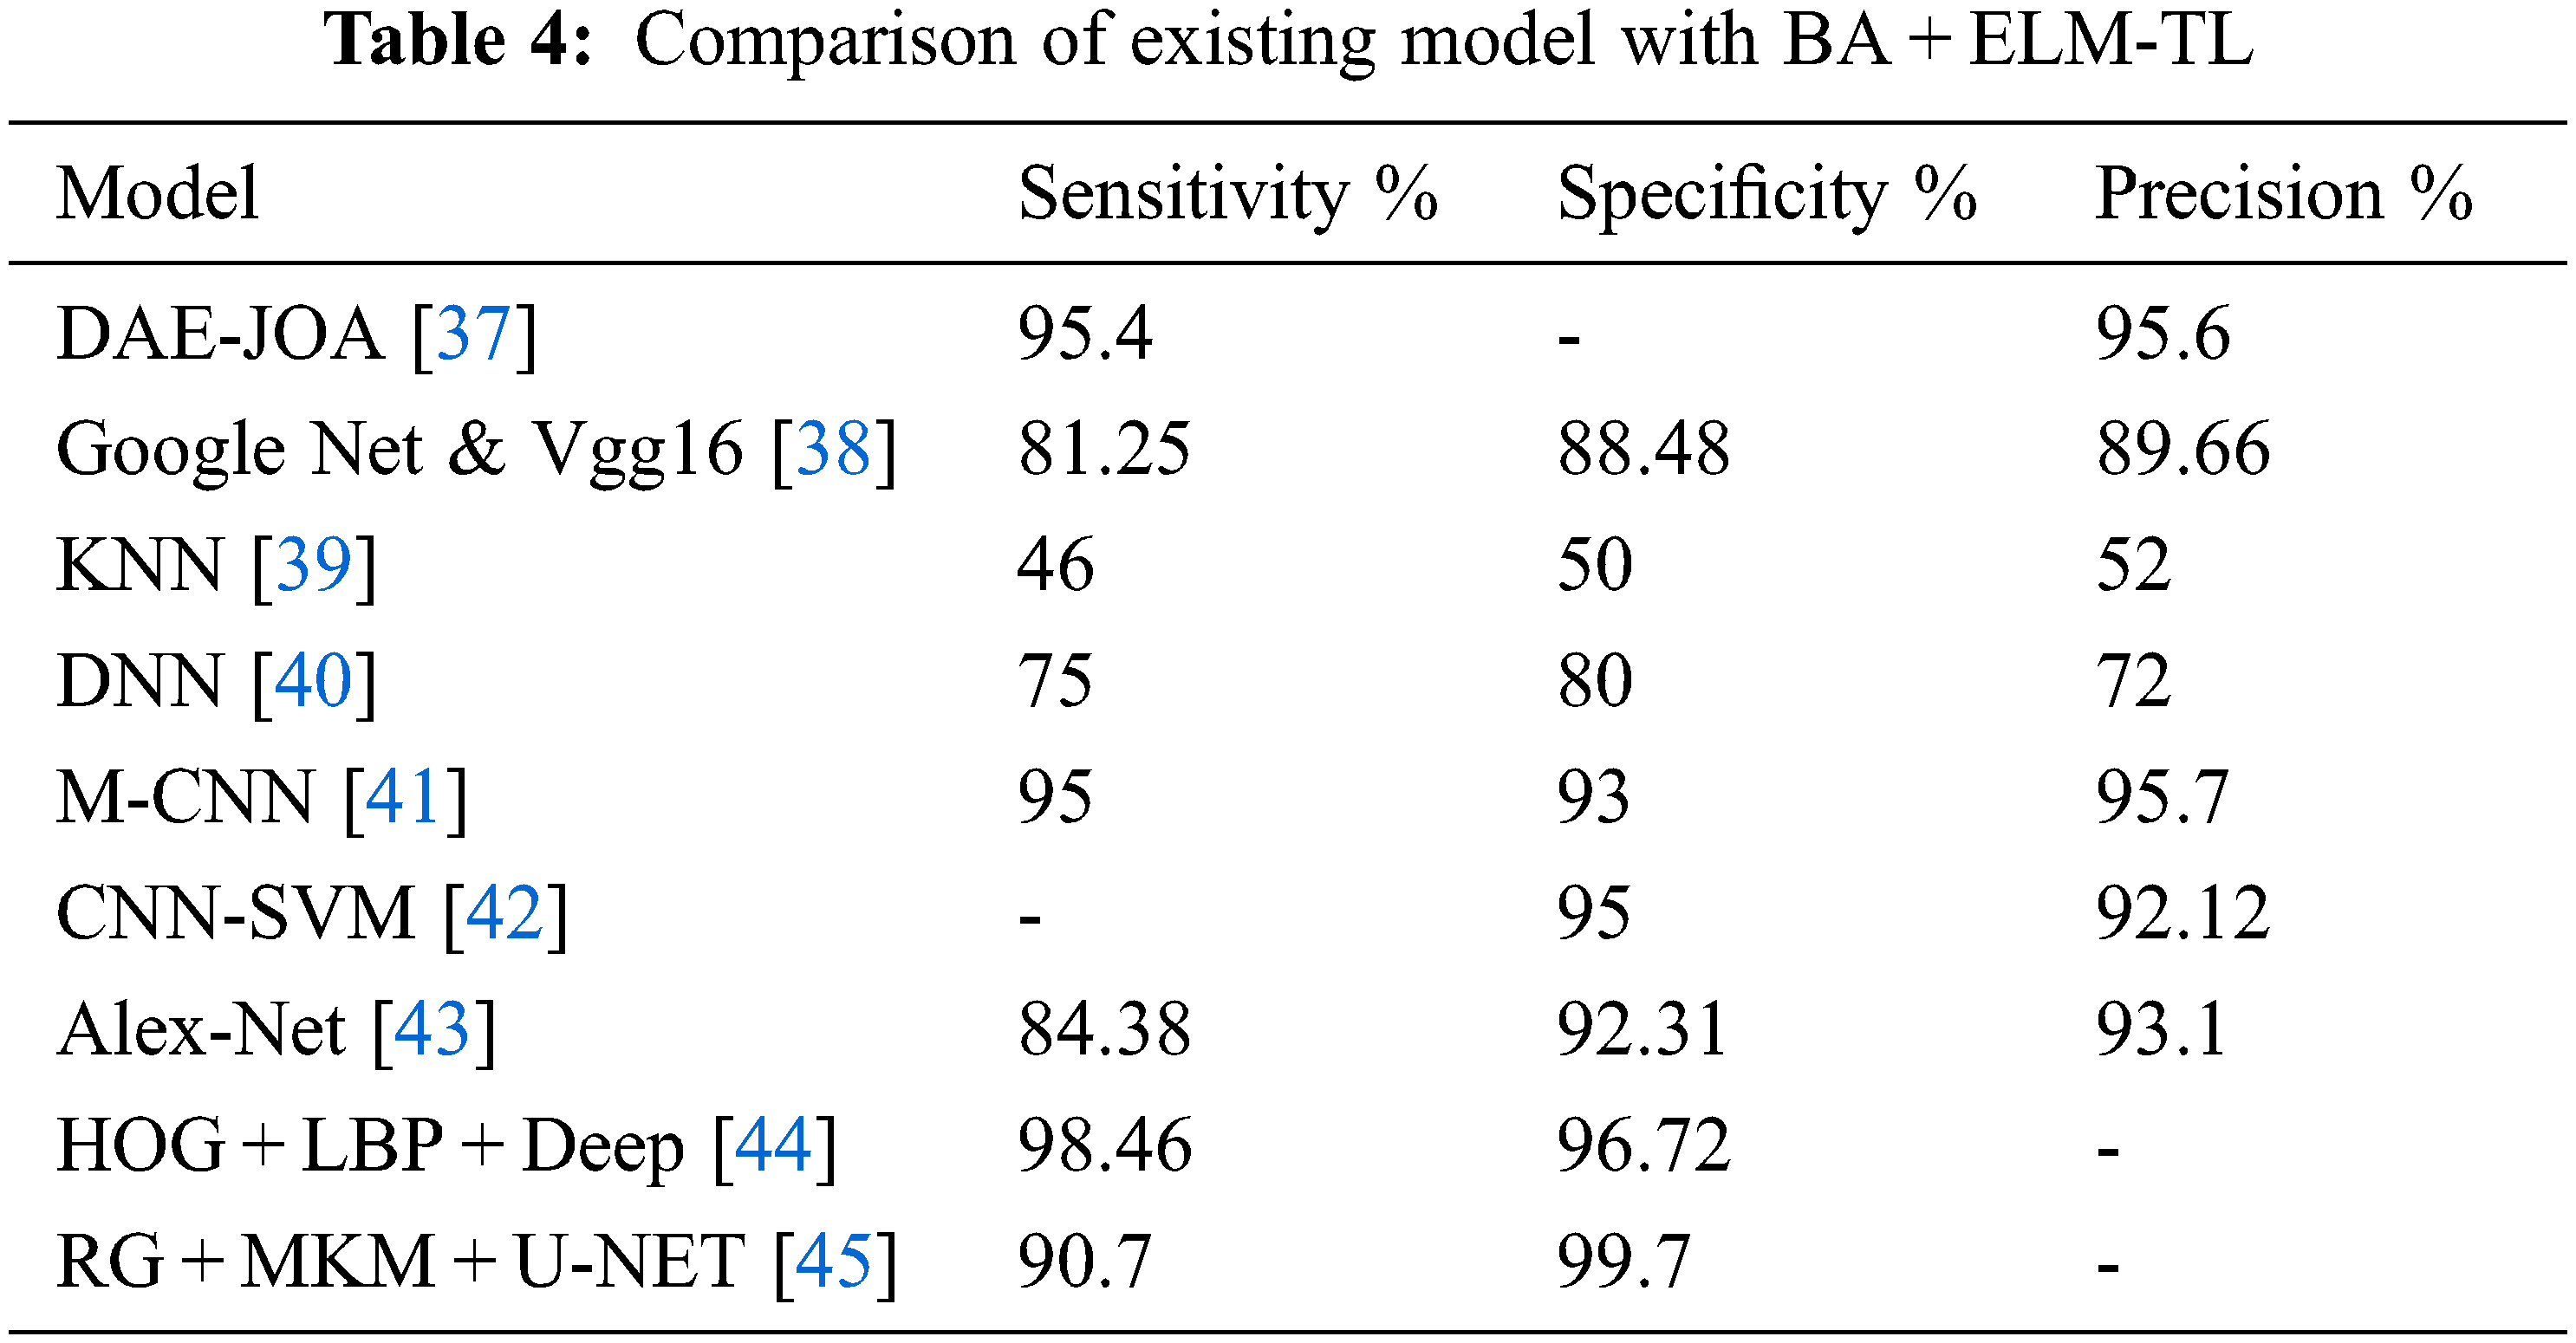
MRI Brain tumor classification using K-Nearest Neighbors (KNN) algorithm had produced 46% of sensitivity, 50% of specificity and 52% of precision. The DNN in brain cancer detection had produced 75% of sensitivity, 80% of specificity, and 72% of precision.
Classification of brain tumors using Modified-Convolutional Neural Network (M-CNN) had produced 95% of sensitivity, 93% of specificity, and 95.7% of precision. MRI image segmentation using Deep Auto-Encoder using Jaya Optimization Algorithm (DAE-JOA) model had performed sensitivity with 95.4%, and precision with 95.6%.
From Tab. 2, it is observed that the results comparison of existing models with the proposed bat algorithm and Extreme Learning Machine via transfer learning (BA + ELM-TL) model has achieved better performance in the aspects of sensitivity, specificity, and precision values.
For the proposed work, stationary wavelet transform is used for feature extraction. The various SWT sub-bands are HL, LH, LH + HL and LH + HH + HL which represents as vertical, horizontal, horizontal + vertical and horizontal + diagonal feature information + vertical. Tab. 5 shows the SWT sub bands for the selection of features in the brain image using Whole Brain Atlas, CE-MRI and fig share dataset.
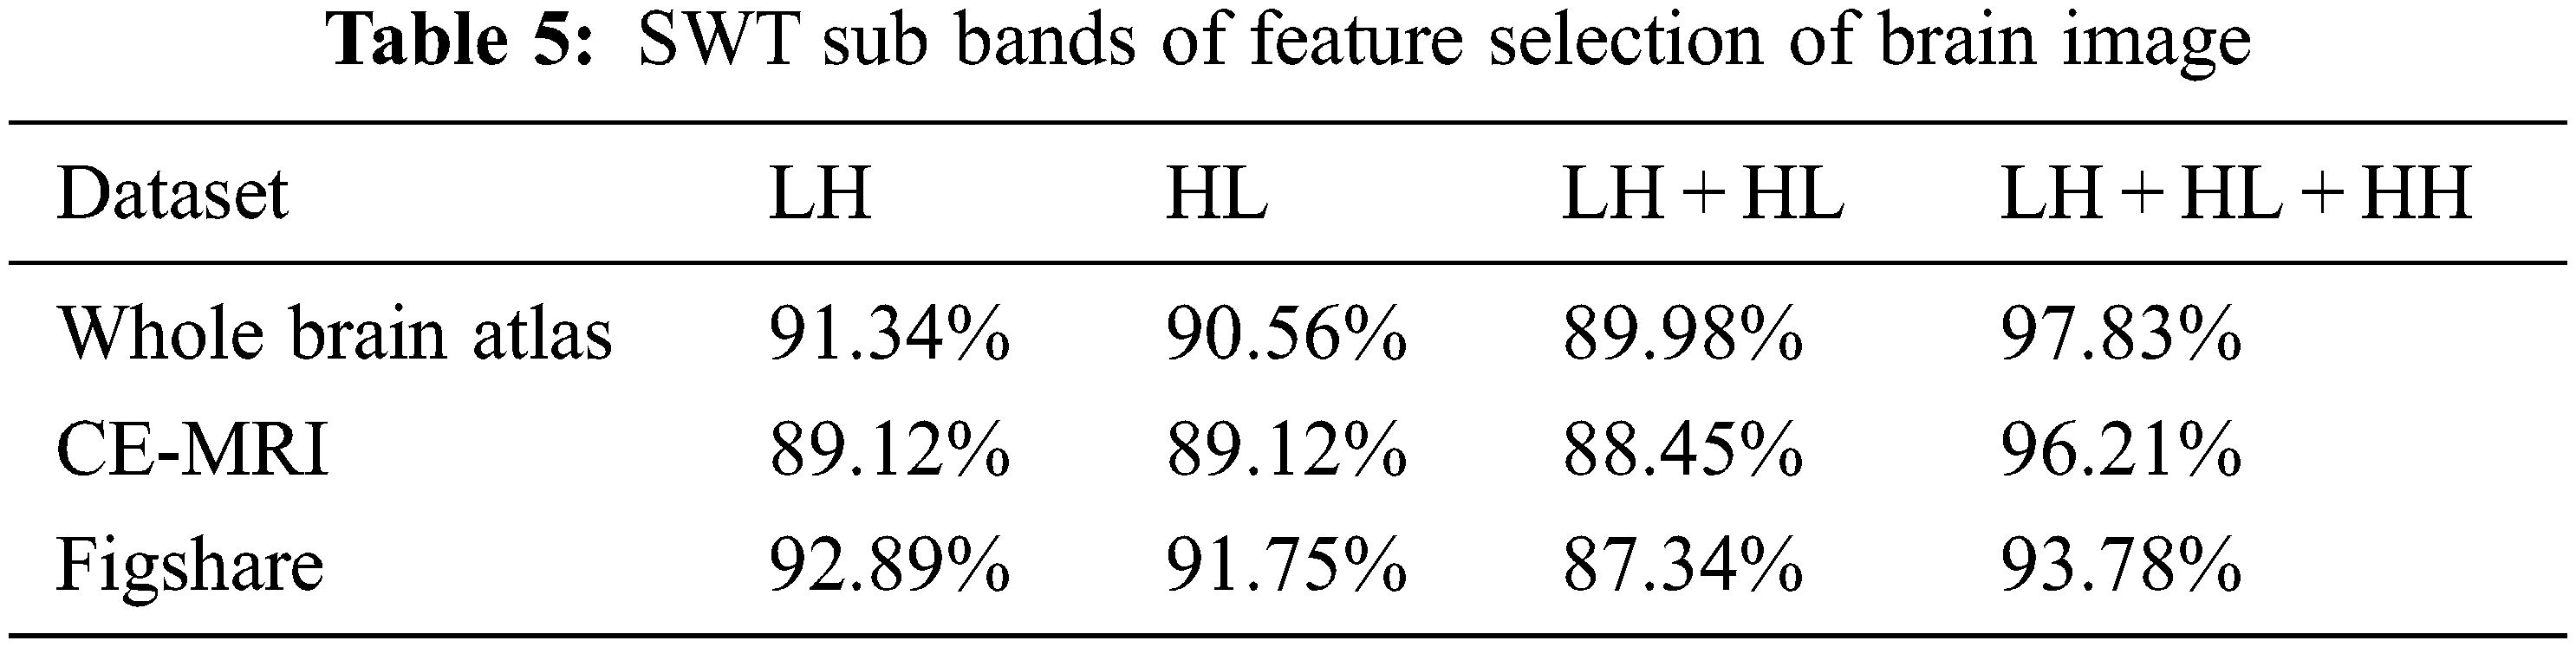
From Tab. 5, it is observed that horizontal + vertical + diagonal feature of brain image has produced the best result of 97.83% for Whole Brain Atlas dataset, 96.21% for CE-MRI dataset of and 93.78% for the dataset of figshare. Tab. 6 shows the comparison of various algorithms using figshare dataset.

Tab. 6 provides the comparison of various algorithm in the figshare dataset. The proposed algorithm had produced the best result with 98.45% for accuracy metric measures. This Tab. 6 contains only the accuracy metric measure because it is a common metric measure and uses for various algorithms. Tab. 7 shows the comparison of proposed work BA + ELM-TL model with existing model of Bat algorithm and Extreme Learning Machine model based on the performance metric measures of Disc Similarity Coefficient (DSC) value, FPR, FNR, JSI value.
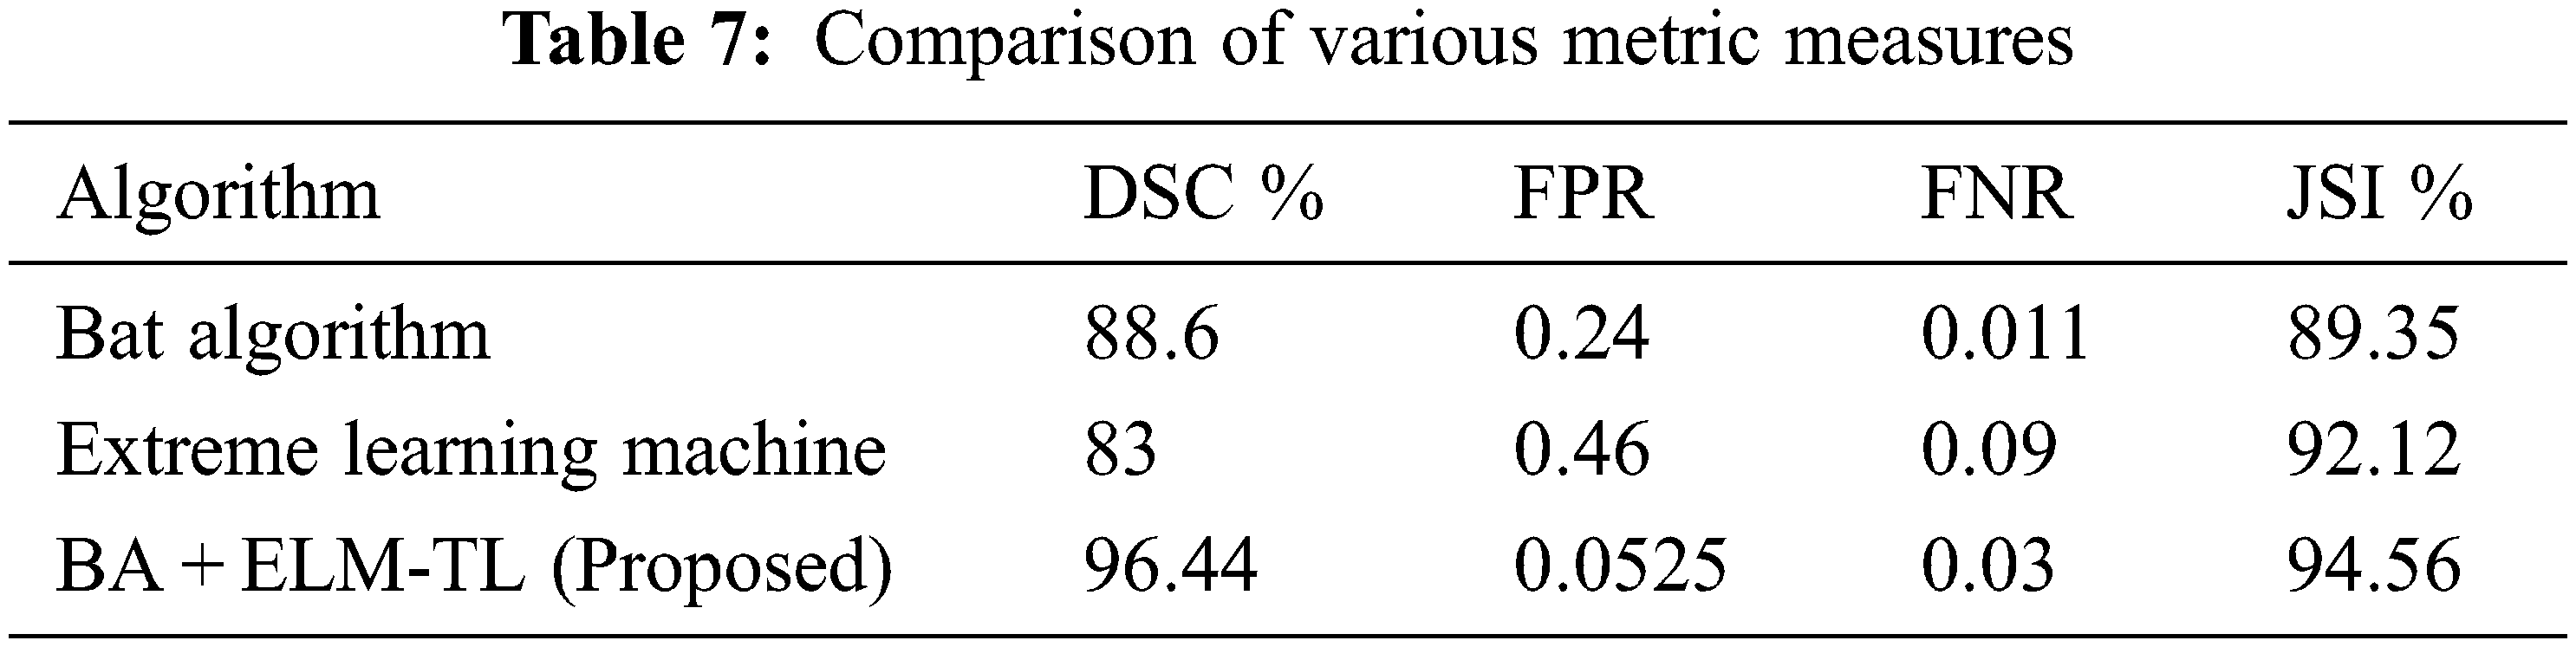
Tab. 7 describes a comparison between the proposed BA + ELM-TL model result with the existing models in the metric measures of DSC value which has highly achieved 96.44% compared to ELM of 83% and Bat algorithm with 88.6%. FPR rate proposed algorithm had secured 0.0525 rate and FNR rate 0.03 compared to the existing model. It was shown 94.56% for JACCARD Similarity Index (JSI). From Tab. 7, it was noticed that the overall performance of the proposed algorithm had obtained better experimental result. Youden index value is given in Fig. 5.
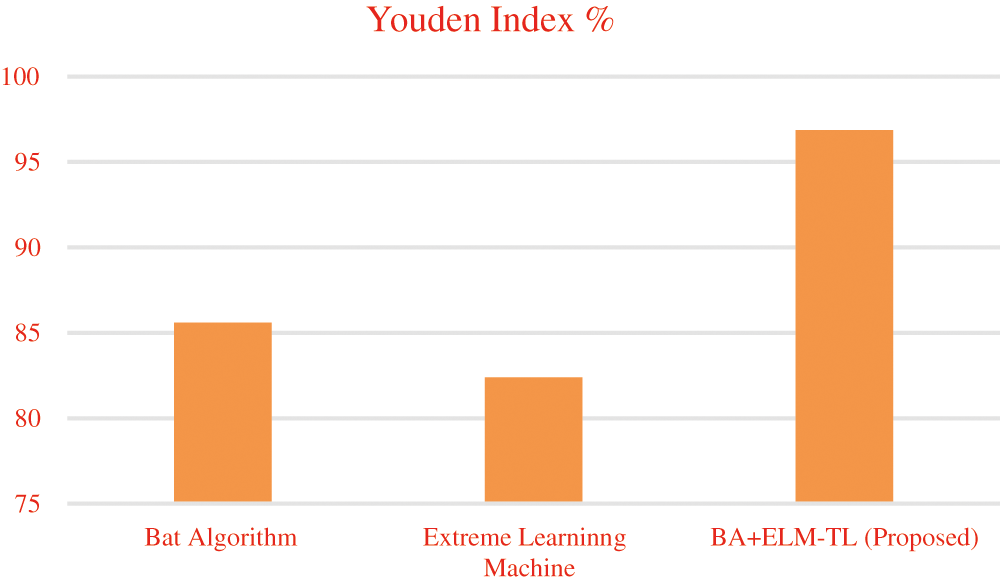
Figure 5: Youden index value for BA + ELM-TL
From the Fig. 5, it is observed that high Youden index value of the proposed work means that high index value produces positive results that are high when compared to the false positive.
In the classification of brain tumor images, accuracy is one of the most extensive of quality index rates [47–53]. Accuracy is defined as the ratio between number of correctly classified brain tumor images and total number of brain images in the dataset. Fig. 6 shows the accuracy of proposed work.

Figure 6: Accuracy
In Fig. 6, the accuracy is calculated for the classification of MRI brain tumor images using Bat Algorithm, Extreme Learning Algorithm and the proposed BA + ELM-TL. The proposed work gives accurate results. However, MRI brain image dataset contains unbalanced dataset. Further evaluation is needed in the proposed work with more performance metric measures that can be used with confusion matrix to evaluate the efficient classification of brain tumor images. The confusion matrix found out the correct and incorrect classification of brain tumor images in the tabular form. Tab. 8 shows a sample confusion matrix for the proposed work in meningioma, glioma and pituitary tumor images.

Tab. 9 shows the classification of three types of brain tumor images namely, meningioma, glioma and pituitary using proposed work.

Tab. 9 presents the performance of metric measures based on the aspects of precision, recall and specificity for the classification of three different brain tumor types. Here, for the proposed work Bat Algorithm with Extreme Learning Machine via Transfer Learning (BA + ELM-TL) is used. The specificity values for all types of MRI brain tumor images are high. It indicates the exact classification of samples of MRI brain image.
This paper presents a novel approach in the classification of brain tumor with an accurate and efficient model. In order to get an appropriate model, pre-processing steps are needed by applying median filter, data augmentation and normalization. The proposed techniques that were applied were from the concept of stationary wavelet transform for extracting the brain features of MRI images. The features selection was used with proven classifier models of Bat Algorithm with Extreme Learning Machine via Transfer Learning which improved the performance. This proposed system recorded the best classification of accuracy compared to all the related works. This paper collected the dataset from figshare, whole brain atlas and TCGA-GBM data set. The accuracy of Bat Algorithm was 92.6%, Extreme Learning Algorithm was 90.4% and BA + ELM-TL got 98.87%. In future, other metaheuristic algorithm can be implemented for further improvement in terms of accuracy, faster in execution.
Acknowledgement: Research Supporting Project Number (RSP-2021/323), King Saud University, Riyadh, Saudi Arabia.
Funding Statement: This project is funded by King Saud University, Riyadh, Saudi Arabia.
Conflicts of Interest: The authors declare that they have no conflicts of interest to report regarding the present study.
1. P. Afshar, K. N. Plataniotis and A. Mohammadi, “Capsule networks for brain tumor classification based on MRI images and coarse tumor boundaries,” in Proc. Int. Conf. on Acoustics, Speech, & Signal Processing (ICASSP), Brighton, UK, pp. 1368–1372, 2019. [Google Scholar]
2. B. Jabber, K. Rajesh, D. Haritha, C. Z. Basha and S. N. Parveen, “An intelligent system for classification of brain tumours with glcm and back propagation neural network,” in Proc. Int. Conf. on. Electronics, Communication and Aerospace Technology (ICECA), Coimbatore, India, pp. 21–25, 2020. [Google Scholar]
3. L. M. Deangelis, “Brain tumors,” New England Journal of Medicine, vol. 344, no. 2, pp. 114–123, 2001. [Google Scholar]
4. D. N. Louis, A. Perry, G. Reifenberger, A. Deimling, D. F. Branger et al., “The 2016 world health organization classification of tumors of the central nervous system: A summary,” Acta Neuropathological, vol. 131, no. 6, pp. 803–820, 2016. [Google Scholar]
5. S. Mahajan, A. Raina, M. Abouhawwash, X. Z. Gao and A. K. Pandit, “Covid-19 detection from chest X-ray images using advanced deep learning techniques,” Computers, Materials and Continua, vol. 70, no. 1, pp. 1541–1556, 2022. [Google Scholar]
6. Z. N. K. Swati, Q. Zhao, M. Kabir, F. Ali, Z. Ali et al., “Brain tumor classification for MR images using transfer learning and fine-tuning,” Computerized Medical Imaging and Graphics, vol. 75, pp. 34–46, 2019. [Google Scholar]
7. A. Gumaei, M. M. Hassan, M. R. Hassan, A. Alelaiwi and G. Fortino, “A hybrid feature extraction method with regularized extreme learning machine for brain tumor classification,” IEEE Access, vol. 7, no. 3, pp. 36266–36273, 2019. [Google Scholar]
8. H. Mohsen, E. S. Dahshan, E. S. Horbaty and A. B. M. Salem, “Classification using deep learning neural networks for brain tumors,” Future Computing and Informatics Journal, vol. 3, no. 1, pp. 68–71, 2018. [Google Scholar]
9. G. Litjens, T. Kooi, B. E. Bejnordi, A. A. Setio, F. Ciompi et al., “A survey on deep learning in medical image analysis,” Medical Image Analysis, vol. 42, pp. 60–88, 2017. [Google Scholar]
10. Z. Akkus, A. Galimzianova, A. Hoogi, D. L. Rubin and B. J. Erickson, “Deep learning for brain MRI segmentation: State of the art and future directions,” Journal of Digital Imaging, vol. 30, no. 4, pp. 449–459, 2017. [Google Scholar]
11. J. Cheng, W. Huang, S. Cao, R. Yang, W. Yang et al., “Enhanced performance of brain tumor classification via tumor region augmentation and partition,” PlOS one, vol. 10, no. 10, pp. e0140381, 2015. [Google Scholar]
12. M. R. Ismael and I. Abdelqader, “Brain tumor classification via statistical features and back-propagation neural network,” in Proc. Electro Information Technology (EIT), Rochester, USA, pp. 0252–0257, 2018. [Google Scholar]
13. X. S. Yang, “A new metaheuristic bat inspired algorithm,” in Proc. Nature Inspired Cooperative Strategies for Optimization (NICSO), Granada, Spain, pp. 65–74, 2010. [Google Scholar]
14. T. C. Bora, L. D. S. Coelho and L. Lebensztajn, “Bat inspired optimization approach for the brushless DC wheel motor problem,” IEEE Transactions on Magnetics, vol. 48, no. 2, pp. 947–950, 2012. [Google Scholar]
15. K. Khan, A. Nikov and A. Sahai, “A fuzzy bat clustering method for ergonomic screening of office workplaces,” in Proc. Conf. on Software, Services & Semantic Technologies (S3T), Bourgas, Bulgaria, pp. 59–66, 2011. [Google Scholar]
16. X. S. Yang and A. H. Gandomi, “Bat algorithm: A novel approach for global engineering optimization,” in Engineering Computations, vol.29, no. 5, pp. 464–483, 2012. [Google Scholar]
17. A. H. Gandomi, X. S. Yang, A. H. Alavi and S. Talatahari, “Bat algorithm for constrained optimization tasks,” Neural Computing and Applications, vol. 22, no. 6, pp. 1239–1255, 2013. [Google Scholar]
18. I. Fister, D. Fister and X. S. Yang, “A hybrid bat algorithm,” Arxiv Preprint Arxiv:1303.6310, 2013. [Google Scholar]
19. X. S. Yang, “Bat algorithm for multiobjective optimization,” International Journal of Bio-Inspired Computation, vol. 3, no. 5, pp. 267–274, 2011. [Google Scholar]
20. R. S. Parpinelli and H. S. Lopes, “New inspirations in swarm intelligence: A survey,” International Journal of Bio-Inspired Computation, vol. 3, no. 1, pp. 1–16, 2011. [Google Scholar]
21. I. Abd El Kader, G. Xu, Z. Shuai, S. Saminu, I. Javaid et al., “Brain tumor detection and classification on mr images by a deep wavelet autoencoder model,” Diagnostics, vol. 11, no. 9, pp. 1589, 2021. [Google Scholar]
22. S. Ramesh, S. Sasikala and N. Paramanandham, “Segmentation and classification of brain tumors using modified median noise filter and deep learning approaches,” Multimedia Tools and Applications, vol. 80, no. 8, pp. 11789–11813, 2021. [Google Scholar]
23. J. Amin, M. Sharif, M. Yasmin and S. L. Fernandes, “A distinctive approach in brain tumor detection and classification using MRI,” Pattern Recognition Letters, vol. 139, pp. 118–127, 2020. [Google Scholar]
24. D. R. Nayak, R. Dash, B. Majhi, R. B. Pachori and Y. Zhang, “A deep stacked random vector functional link network autoencoder for diagnosis of brain abnormalities and breast cancer,” Biomedical Signal Processing and Control, vol. 58, pp. 101860, 2020. [Google Scholar]
25. M. M. Badža and M. Č. Barjaktarović, “Classification of brain tumors from MRI images using a convolutional neural network,” Applied Sciences, vol. 10, no. 6, pp. 1999, 2020. [Google Scholar]
26. M. A. Khan, I. Ashraf, M. Alhaisoni, R. Damaševičius, R. Scherer et al., “Multimodal brain tumor classification using deep learning and robust feature selection: A machine learning application for radiologists,” Diagnostics, vol. 10, no. 8, pp. 565, 2020. [Google Scholar]
27. P. K. Mallick, S. H. Ryu, S. K. Satapathy, S. Mishra, G. N. Nguyen et al., “Brain MRI image classification for cancer detection using deep wavelet autoencoder-based deep neural network,” IEEE Access, vol. 7, pp. 46278–46287, 2019. [Google Scholar]
28. J. Seetha and S. S. Raja, “Brain tumor classification using convolutional neural networks,” Biomedical & Pharmacology Journal, vol. 11, no. 3, pp. 1457, 2018. [Google Scholar]
29. M. Sajjad, S. Khan, K. Muhammad, W. Wu, A. Ullah et al., “Multi-grade brain tumor classification using deep CNN with extensive data augmentation,” Journal of Computational Science, vol. 30, pp. 174–182, 2019. [Google Scholar]
30. K. Weiss, T. M. Khoshgoftaar and D. Wang, “A survey of transfer learning,” Journal of Big Data, vol. 3, no. 1, pp. 1–40, 2016. [Google Scholar]
31. S. Gupta, N. S. Punn, S. K. Sonbhadra and S. Agarwal, “MAG-Net: Mutli-task attention guided network for brain tumor segmentation and classification,” Arxiv Preprint Arxiv:2107.12321, 2021. [Google Scholar]
32. R. Suter, J. R. Blanco and N. G. Ayad, “Epigenetic pathways and plasticity in brain tumors,” Neurobiology of Disease, vol. 145, no. 3, pp. 105060, 2020. [Google Scholar]
33. C. Ge, I. Gu, A. S. Jakola and J. Yang, “Enlarged training dataset by pairwise gans for molecular-based brain tumor classification,” IEEE Access, vol. 8, pp. 22560–22570, 2020. [Google Scholar]
34. L. Scarpace, L. Mikkelsen, T. Cha, S. Rao, S. Tekchandani et al., “Radiology data from the cancer genome atlas glioblastoma multiforme [TCGA-GBM] collection,” The Cancer Imaging Archive, vol. 11, no. 4, pp. 1, 2016. [Google Scholar]
35. P. S. Raja, “Brain tumor classification using a hybrid deep autoencoder with Bayesian fuzzy clustering-based segmentation approach,” Biocybernetics and Biomedical Engineering, vol. 40, no. 1, pp. 440–453, 2020. [Google Scholar]
36. M. Toğaçar, B. Ergen and Z. Cömert, “BrainMRNet: Brain tumor detection using magnetic resonance images with a novel convolutional neural network model,” Medical Hypotheses, vol. 134, pp. 109531, 2020. [Google Scholar]
37. N. V. Chavan, B. Jadhav and P. Patil, “Detection and classification of brain tumors,” International Journal of Computer Applications, vol. 112, no. 8, pp. 1–18, 2015. [Google Scholar]
38. S. Pereira, A. Pinto, V. Alves and C. A. Silva, “Brain tumor segmentation using convolutional neural networks in MRI images,” IEEE Transactions on Medical Imaging, vol. 35, no. 5, pp. 1240–1251, 2016. [Google Scholar]
39. D. J. Hemanth, J. Anitha, A. Naaji, O. Geman and D. E. Popescu, “A modified deep convolutional neural network for abnormal brain image classification,” IEEE Access, vol. 7, pp. 4275–4283, 2018. [Google Scholar]
40. F. Özyurt, E. Sert and D. Avcı, “An expert system for brain tumor detection: Fuzzy C-means with super resolution and convolutional neural network with extreme learning machine,” Medical Hypotheses, vol. 134, pp. 109433, 2020. [Google Scholar]
41. R. Chelghoum, A. Ikhlef, H. Hameurlaine and S. Jacquir, “Transfer learning using convolutional neural network architectures for brain tumor classification from MRI images,” in Proc. Int. Federation for Information Processing (IFIP), Hersonissos, Crete, Greece, pp. 189–200, 2020. [Google Scholar]
42. E. S. S. Biratu, F. Schwenker, T. G. G. Debelee, S. R. R. Kebede, W. G. G. Negera et al., “Enhanced region growing for brain tumor MR image segmentation,” Journal of Imaging, vol. 7, no. 2, pp. 22, 2021. [Google Scholar]
43. T. Saba, A. S. Mohamed, M. El-Affendi, J. Amin and M. Sharif, “Brain tumor detection using fusion of hand crafted and deep learning features,” Cognitive Systems Research, vol. 59, pp. 221–230, 2020. [Google Scholar]
44. R. N. Lazuardi, N. Abiwinanda, T. H. Suryawan, M. Hanif and A. Handayani, “Automatic diabetic retinopathy classification with efficientnet,” in Proc. IEEE Region 10 Conf. (TENCON), Osaka, Japan, pp. 756–760, 2020. [Google Scholar]
45. A. Pashaei, H. Sajedi and N. Jazayeri, “Brain tumor classification via convolutional neural network and extreme learning machines,” in Proc. Int. Conf. on Computer Engineering and Knowledge (ICCKE), Mashhad, Iran, pp. 314–319, 2018. [Google Scholar]
46. S. Deepak and P. Ameer, “Brain tumor classification using deep CNN features via transfer learning,” Computers in Biology and Medicine, vol. 111, pp. 103345, 2019. [Google Scholar]
47. M. Abdel-Basset, R. Mohamed, N. M. AbdelAziza and M. Abouhawwash, “HWOA: A hybrid whale optimization algorithm with a novel local minima avoidance method for multi-level thresholding color image segmentation,” Expert Systems with Applications, vol. 190, no. 1, pp. 116145, 2022. [Google Scholar]
48. H. Seada, M. Abouhawwash and K. Deb, “Towards a better diversity of evolutionary multi-criterion optimization algorithms using local searches,” in Proc. of the 2016 on Genetic and Evolutionary Computation Conf. Companion, Denver, USA, pp. 77–78, 2016. [Google Scholar]
49. M. Abouhawwash and K. Deb, “Karush-kuhn-tucker proximity measure for multi-objective optimization based on numerical gradients,” in Proc. of the 2016 on Genetic and Evolutionary Computation Conf. Companion, Denver, USA, pp. 525–532, 2016. [Google Scholar]
50. M. Abouhawwash, M. A. Jameel and K. Deb, “A smooth proximity measure for optimality in multi-objective optimization using benson’s method,” Computers & Operations Research, vol. 117, no. 3, pp. 104900, 2020. [Google Scholar]
51. M. Abouhawwash and A. Alessio, “Develop a multi-objective evolutionary algorithm for pet image reconstruction: Concept,” IEEE Transactions on Medical Imaging, vol. 40, no. 8, pp. 2142–2151, 2021. [Google Scholar]
52. S. T. Suganthi, A. Vinayagam, V. Veerasamy, A. Deepa, M. Abouhawwash et al., “Detection and classification of multiple power quality disturbances in microgrid network using probabilistic based intelligent classifier,” Sustainable Energy Technologies and Assessments, vol. 47, no. 4, pp. 101470, 2021. [Google Scholar]
53. N. Mittal, H. Singh, V. Mittal, S. Mahajan, A. K. Pandit et al., “Optimization of cognitive radio system using self-learning salp swarm algorithm,” Computers, Materials & Continua, vol. 70, no. 2, pp. 3821–3835, 2022. [Google Scholar]
 | This work is licensed under a Creative Commons Attribution 4.0 International License, which permits unrestricted use, distribution, and reproduction in any medium, provided the original work is properly cited. |