DOI:10.32604/iasc.2022.024172
| Intelligent Automation & Soft Computing DOI:10.32604/iasc.2022.024172 | |
| Article |
An Experimental Approach to Diagnose Covid-19 Using Optimized CNN
1Department of Computer Science, Aligarh Muslim University, Aligarh, Uttar Pradesh, 202002, India
2Department of Information Technology, Bhagwan Parshuram Institute of Technology (BPIT), GGSIPU, New Delhi, 110089, India
3Department of Computer Science and Engineering, Maharaja Agrasen Institute of Technology (MAIT), GGSIPU, New Delhi, 110086, India
4Department of Electrical Engineering, Bharati Vidyapeeth’s College of Engineering, GGSIPU, New Delhi, 110063, India
5Department of Electrical Engineering, College of Engineering, Princess Nourahbint Abdulrahman University, Riyadh, 84428, SaudiArabia
6Department of Computer Science, Aligarh Muslim University, Aligarh, Uttar Pradesh, 202002, India
7Department of Computer Science, College of Computer and Information Sciences, MajmaahUniversity, Al Majmaah, 11952, Kingdom of Saudi Arabia
8Rajiv Gandhi University of Knowledge Technologies, Basar, Telangana, 504107, India
*Corresponding Author: Nitish Pathak. Email: nitishpathak2812@gmail.com
Received: 08 October 2021; Accepted: 19 January 2022
Abstract: The outburst of novel corona viruses aggregated worldwide and has undergone severe trials to manage medical sector all over the world. A radiologist uses x-rays and Computed Tomography (CT) scans to analyze images through which the existence of corona virus is found. Therefore, imaging and visualization systems contribute a dominant part in diagnosing process and thereby assist the medical experts to take necessary precautions and to overcome these rigorous conditions. In this research, a Multi-Objective Black Widow Optimization based Convolutional Neural Network (MBWO-CNN) method is proposed to diagnose and classify covid-19 data. The proposed method comprises of four stages, preprocess the covid-19 data, attribute selection, tune parameters, and classify covid-19 data. Initially, images are fed to preprocess and features are selected using Convolutional Neural Network (CNN). Next, Multi-objective Black Widow Optimization (MBWO) method is imparted to finely tune the hyper parameters of CNN. Lastly, Extreme Learning Machine Auto Encoder (ELM-AE) is used to check the existence of corona virus and further classification is done to classify the covid-19 data into respective classes. The suggested MBWO-CNN model was evaluated for effectiveness by undergoing experiments and the outcomes attained were matched with the outcome stationed by prevailing methods. The outcomes confirmed the astonishing results of the ELM-AE model to classify covid-19 data by achieving maximum accuracy of 97.53%. The efficacy of the proposed method is validated and observed that it has yielded outstanding outcomes and is best suitable to diagnose and classify covid-19 data.
Keywords: Novel corona virus; classify; CNN-convolutional neural network; tuning hyper parameter; black widow optimization
Coronavirus disease (COVID-19) laid major effects all over the world’s economic growth since past two years [1]. On 11th March-2020, the World Health Organization (WHO) proclaimed COVID-19 a pandemic. Germany, France, Vietnam, New Zealand, South Korea, Saudi Arabia, Taiwan, and other countries have successfully limited the spread of COVID-19. While certain countries, including Brazil, the United States and India have been battling the pandemic for a long time. Dating 25th of March to the 31stJune-2020, India was under the toughest lockdown in its history to stop the coronavirus’s spread. However, the Indian government began exposing lockdown all over the country in stages beginning from 1st July 2020 till 31st August-2020, because a developing country like India cannot afford to lose money due to phase by phase lockdown [2]. Phase-1 lockdown lasted from 1st July to 30th July-2020, with the second phase starting from 1st August to 31st August-2020, and the third phase starting from 1st September to 31st October-2020 [3]. When the country was reopened for business, the Indian government established rules for organizations, both public and private, on how to resume operations, transportation, and various social, business and religious events. COVID-19 has so far eluded scientists’ efforts to discover a cure [4]. Sore throat, sneezing, diarrhea, loss of smell and taste, cough and tiredness are some of the symptoms of the patients suffering from this deadly virus. Early diagnosis of the disease can aid in the timely isolation and monitoring of patients. Patients with pneumonia, a side consequence of COVID-19 infection can be diagnosed using machine-based technologies that identify pictures from X-rays of the lungs. Machine learning based techniques are used to accurately detect the presence of COVID-19. Developing nations are exposed to the novel virus and there is no way to properly determine if a person is affected by COVID-19 because of existence of people in huge numbers [5]. Several approaches for detecting COVID-19 from Computed tomography (CT) scan images have been proposed. However, in long-tailed distributions, these techniques fail to produce the optimal results [6]. It’s possible that the COVID-19 dataset contains triplets-labeled data occurrences that can be used to distinguish between infected and healthy people [7]. Similarly, some databases contain CT scans that aren’t labeled, making it difficult to interpret the results. Large datasets make it more challenging for current algorithms to detect COVID-19 in CT scans. These flaws have prompted researchers to look for novel methods using machine learning [8]. In order to identify COVID-19 from image data, machine learning methods such as Artificial Neural Network (ANN) [9], Support Vector Machine (SVM) and Bayesian Network (BN) are utilized. These machine learning algorithms, on the other hand, are not ideal for dealing with large image databases. Therefore, in the current scenario deep learning is the primary method for detecting COVID-19 from the image. Deep learning methods are used to detect COVID-19and can handle large data [10]. Deep Neural Network (DNN) [11], Deep Belief Neural Network (DBNN) [12], and CNN [13] are some of the deep learning approaches that may be used to indicate the presence of COVID-19 in images. Many contributions make use of deep learning approaches. Among these, CNN is the most effective method for image processing tasks, particularly for region-of-interest detection and verification. However, during the diagnosis of COVID-19 from pictures, CNN may be influenced by undefined structure. Many optimization strategies, such as the Genetic Algorithm (GA) [14], Particle Swarm Optimization (PSO) [15], and Ant Lion Optimization (ALO) are used to improve the performance of CNN structures. An optimization approach is used to choose the best hyper parameters. Convergence can be trapped by any optimization process. In the below Fig. 1 the process of detecting COVID-19 automatically from CT images or chest X-ray using optimized DNN is shown clearly and yields diagnosis results as accurate as possible in the Internet of Things (IoT)environment.
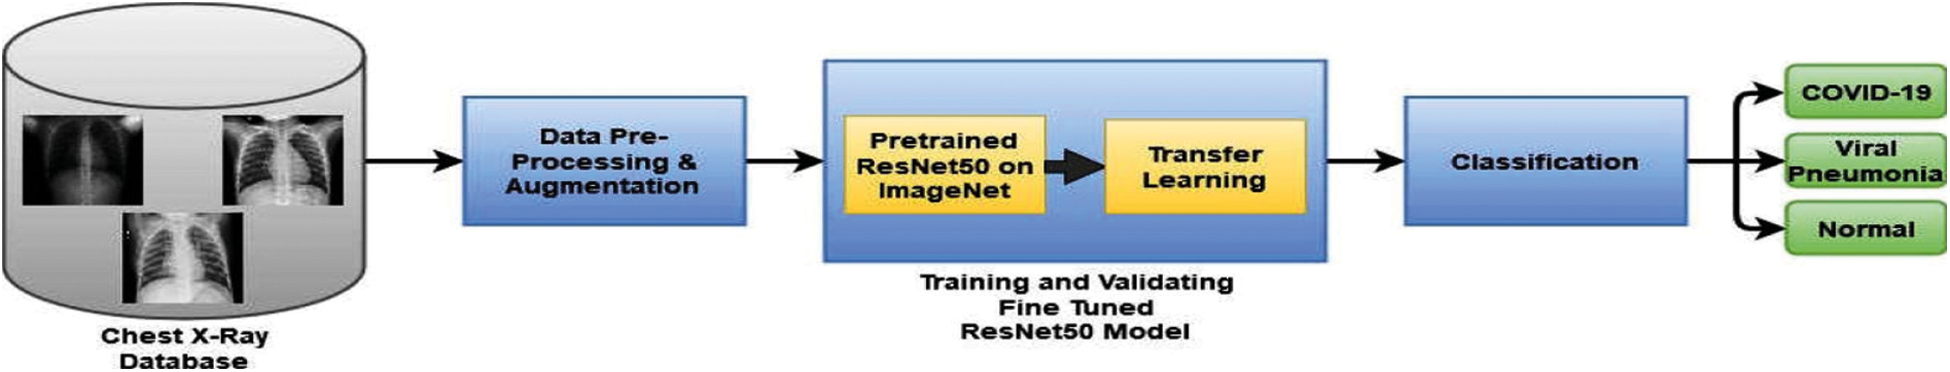
Figure 1: Covid-19 automatic detection using novel DNN
Using MBWO-CNN, a COVID-19 diagnostic and classification model is suggested in the current research work. COVID-19 is detected, classified and well analyzed using the suggested MBWO-CNN model. Parameter adjustment, classification, pre-processing and feature extraction are the four processes involved in this approach. The input images are first preprocessed, then CNN-based feature extraction is performed.
Numerous approaches for predicting the existence of COVID-19 have been proposed by the researchers. This section reviews some of the methods. Gifani et al. [16] used an ensemble of deep learning algorithms to present an autonomous COVID-19 identification approach. There were 15 CNN frameworks pre-trained employed, including Inception ResNext50, ResNet v2, Xception, DenseNet121, NasNetMobile, ResNet-50, NasNetLarge, SE ResNet50, InceptionV3 and Efficient Nets B0-B5which were fine-tuned based on the objective job. For COVID-19 detection, CNN was used. From there onwards, a strategy used by a group was established that relied primarily on the polls of the best combination transmit learning that is in-depth, which improved the approval process. In addition, CT scan images from the publicly available databases were utilized in this study. This database contains 349 CT filters that were COVID-19 positive and 399 CT filters that were COVID-19 negative, indicating either normal or different types of lung infections. Comparing to individual transfer learning structures, the performance of transactional learning design, MBWO-CNN model had the highest performance in terms of accuracy 0.912. Singh et al. [17] proposed an in-depth learning approach for the COVID-19 series, which included the utilization of chest CT scan pictures, whereas normal patients were used as controls. Following the gathering of image, the data was analyzed and supplemented using deep learning-based CNN models. After then, the results were compared. The author compared the accuracy results of the Inception MBWO-CNN model in this study. The researcher used the Kaggle repository to obtain 6512 chest X-ray pictures in order to evaluate the suggested model’s accuracy. The authors employed 5566 of these images for training, while the remaining 966 images were used for validation. In comparison to previous models, the MBWO-CNN model was found to have the best accuracy of 96.93%, in recognizing COVID-19 using chest X-ray image by Jain et al. [18]. The suggested model in this study simply illustrates the potential for classifying patients as COVID-19 or non-COVID-19, with no claim to medical accuracy. The study proved that such deep learning approaches could be used for diagnostic procedures and should be automated. Over-fitting would have resulted in high accuracy, which may be verified with new datasets. Deep learning prediction concept was established by Azemin et al. [19]. Images of COVID-19 chest X-rays are rare and difficult to come by. As a result, generalization and the Validation of unique models is needed using deep learning and it helps to identify the presence of corona virus from the image data. Images from CT scan are easily accessible because radiographs of the chest provide a lot of information and is taken as train data in this study. COVID-19 has been linked to clinical results, while the images from COVID-19 confirmed the presence of virus from test data by employing Resnet-101-based deep learning model using CNN. This architecture has previously been trained to recognize targets in image. They are also retrained to recognize anomalies in chest X-rays. The model’s performance was evaluated using several metrics such as accuracy, sensitivity, specificity and receiver operating characteristic (ROC) measure by obtaining the results of 72.8%, 95.10%, 95.10%, and 95.78% respectively. The use of this study was that labels were produced and are in significant clinical correlation with respect to COVID-19 patients, and the use of publically data available for testing treatments are two of this study strengths. Analysis of COVID-19, Narin et al. [20] provided five deep learning-based architectures that have been pre-configured. ResNet50, ResNet152, Resnet 101 and InceptionV3 are among the five models available. To diagnose covid-19, the algorithms Inception-ResNetV2 and Inception-ResnetV1 were proposed using chest X-ray radiographs patients with pneumonia. Using 5-layer cross-validation, three separate double orders were created with four classes viral pneumonia, normal (solid), COVID-19, and bacterial pneumonia. Among the designs utilized in the study, the existing model ResNet50 provided the most significant results in terms of processing 98.8% for Dataset-3, 98.6% for Dataset 2, and 97.25% accuracy for Dataset-1. The authors collected tweets related to impact of COVID-19 in India and it was found that Machine Learning Programming(MLP) obtained outstanding results in classifying the tweets in terms of high accuracy with 97%, low root mean square error-0.12, precision and recall-0.97. The outcomes also specify good F-Score-0.95 and ROC Curve area-0.99 [21]. Also tweets related to cyber-attacks amidst this pandemic were classified using MLP, Adaboost and SVM. It was observed that support vector machine yielded high accuracy of 94% in classifying Covid-19, followed by decision tree with accuracy of 88% among other classifiers. The results were evaluated on different metrics like error rate, precision recall, and F-Score. SVM yielded high results among all [22].
The MBWO-CNN method’s working procedure is depicted in Fig. 2. The input image is first parsed, which includes resizing the image to a predetermined size and class tagging. The preprocessed image is next subjected to feature extraction. The hyperparameter tuning procedure aids in the choosing of the CNN model’s initial hyperparameters. Finally, the selected features are categorized, and the images are categorized as either COVID or non-COVID using the relevant class labels.
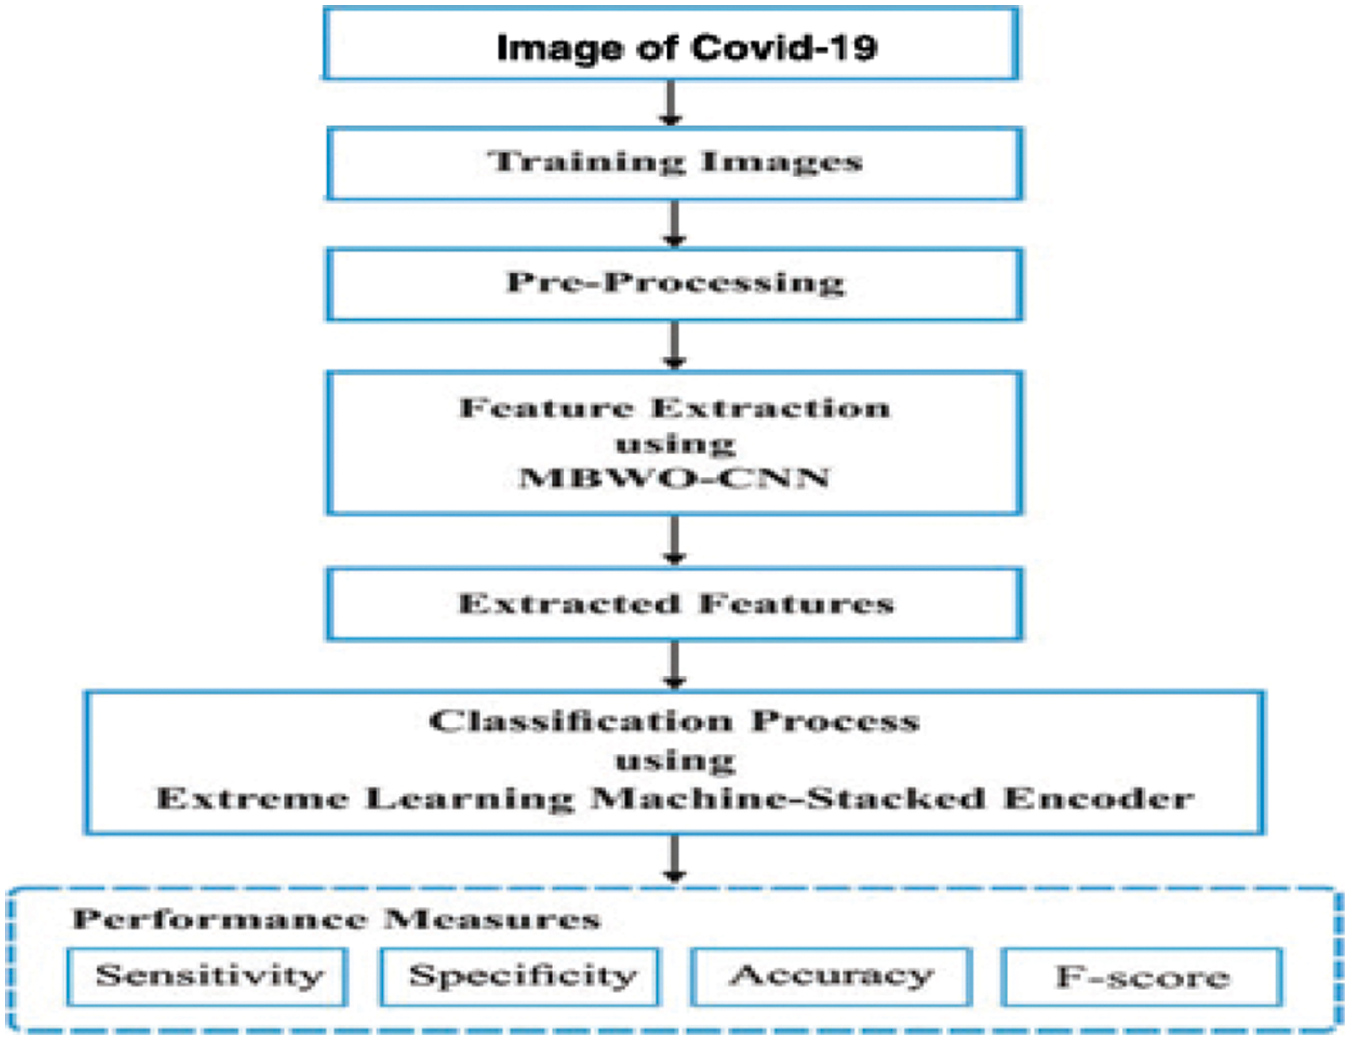
Figure 2: MBWO-CNN model block diagram is proposed
3.1 Extraction of Features (EF)
The MBWO-CNN model is used to extract the features image after it has been prepared. The use of the MBWO algorithm aids during the choice of CNN’s initial hyper parameters.
3.1.1 Convolutional Neural Network (CNN)
CNN is a Deep Learning (DL) model subcategory that signifies the greatest accomplishment from image processing. During the image classification phase, CNN is mostly used to examine visual pictures. CNN is the most favored since it combines both hierarchical architecture and excellent picture feature extraction. The layers are initially assembled in a three-dimensional style. The neurons in the applying layers aren’t the same as the entire secondary layer’s population of neurons. In the other words, the secondary layer also has a limited number of neurons. As a result, they are reduced to a single vector containing all possible values which are further combined in the depth dimension. The training and testing procedures of Deep Convolutional Neural Networks (DCNN) in the categorization of COVID-19 are shown in Fig. 3. The picture depicts how the CNN classification model uses many layers to create and test strategy. The features of chest CT images are accurately examined to characterize COVID-19 infection in either infected or uninfected patients. To find duplicate classifications and analyze the pictures, COVID-19 illness categorization is done using chest CT scan. The processes outlined below are taken to classify COVID-19 affected patients using the CNN methodology.
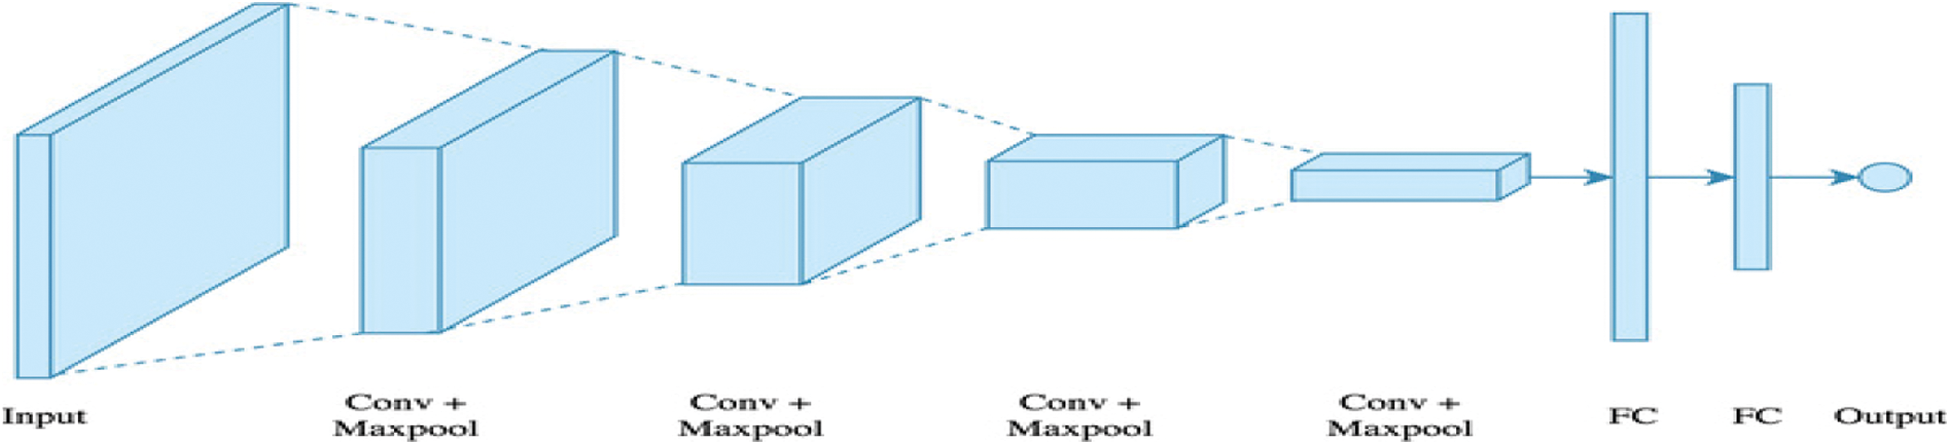
Figure 3: CNN’s structure
Input, hidden layers and output make up CNNs. Convolution, pooling, Rectified Linear Unit (ReLU) and Fully Connected (FC) layers are usually found in the hidden layers.
• The input for the convolution layer is a convolution task. It passes the data to the following layer.
• Clustering results with a neuron present the succeeding layer are concatenated in the pooling layer.
• Fully Connected layers form a single layer that connects all of the neurons, with additional neurons
appearing in successive layers. The neurons of the FC layer get input from all of the present layer’s
parts.
The CNN algorithm works by extracting features from images. There is no need to manually extract features. As a result, the features are unequipped, and information is gained during network training with a collection of images. The DL model is particularly efficient in computer vision operations to perform the training process. CNN’s use a large number of hidden layers to do feature prediction. The layer makes learned features more challenging [23,24].
3.1.2 Fitness Function with Multiple Objectives
CNN learns experience through issues with hyper parameter tuning, according to the literature. Batch size, activation functions, stride, momentum, hidden layer, kernel size, kernel type, padding, learning value and count of epochs are the hyper parameters. Some variables need to be fine-tuned. The following is an example of a multi-objective Fitness Function (FF).
αn and αp, respectively, denote the sensitivity and specificity qualities. The number of true positives that are accurately categorized is processed by sensitivity, which is a true positive rate. The confusion matrix is used to estimate sensitivity (αn), which can be calculated statistically based on the literature.
False Negative (FN) and True Positive (TP) measurements are referred to as
αn is chosen as a number between 0 and 100. αn considers the value of ‘100’ to be realistic. The ratio of correctly categorized True Negatives (TN) is determined by specificity (αp), which is evaluated as follows.
F1-score = combination of precision/Recall or =2
Accuracy = Correct Prediction/Total Prediction
False Positive (FP) and True Negative (TN) measurements are denoted by
αn belongs to the range [0,100]. It’s possible to think about the phenomenon of αp approaching 100.
The flowchart of the BWO method is shown in Fig. 4. The Evolutionary Algorithm (EA) works in the same way as the anticipated approach based on spider position at the start. All of the spiders arrive at a viable solution using this strategy. The first spiders try to reproduce a new generation of spiders. Once the mating is finished, the female black widow devours the male. Spider lings emerge from the egg sacs when the eggs are laid [25]. It stays on the maternal web for a few days, maybe even a week. Sibling cannibalism is observed throughout this time.
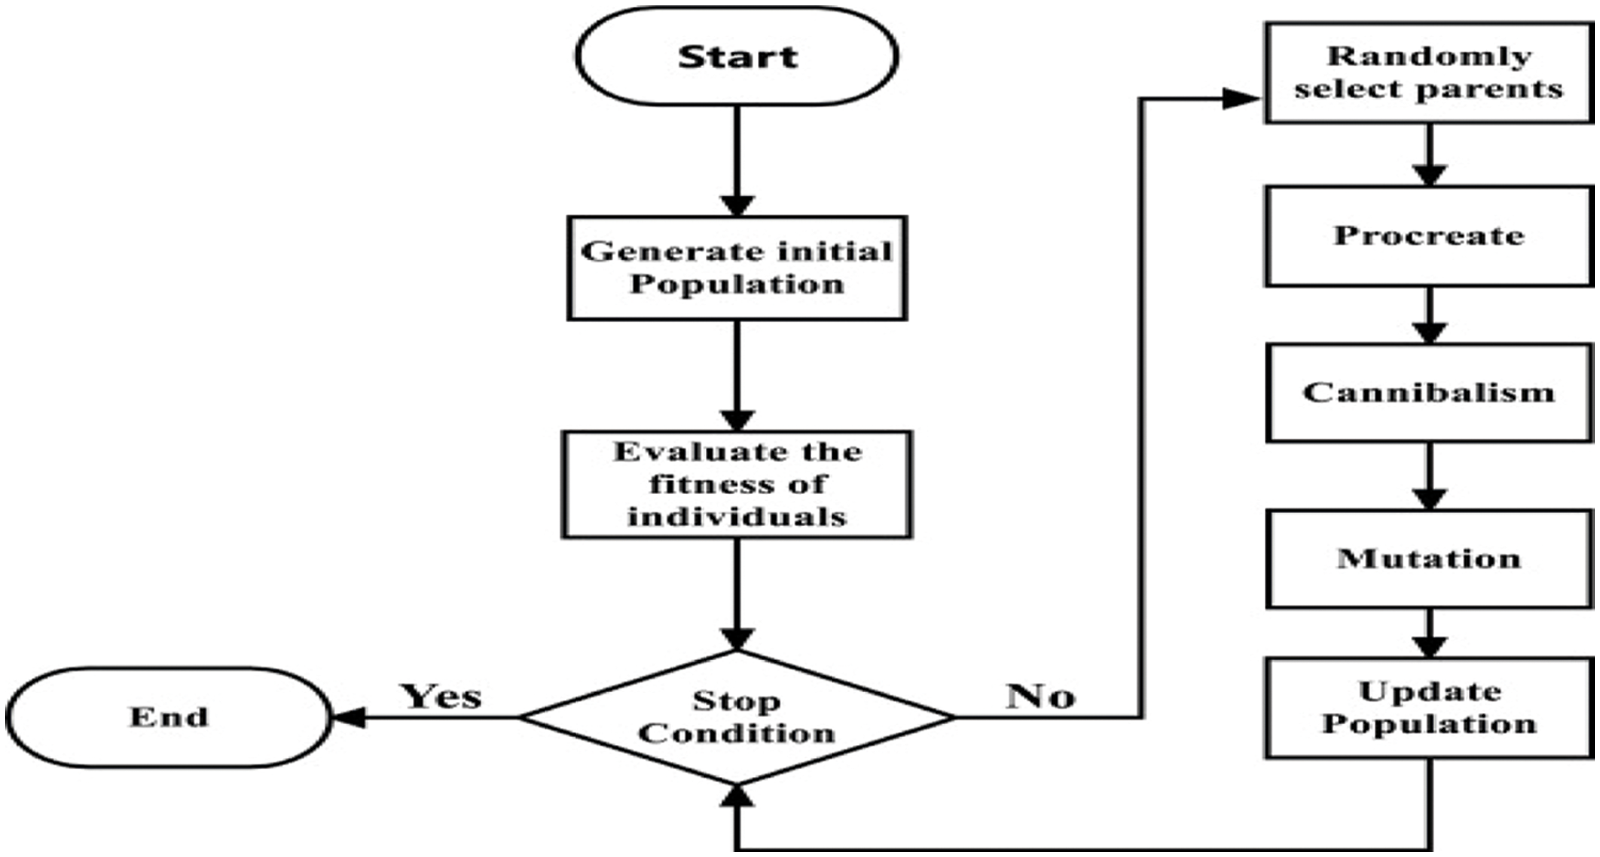
Figure 4: Black widow optimization algorithm flowchart
(i) The Begin Population
The optimization challenge can be solved by employing problem score metrics to create a good framework for a problem-solving solution. The structure is referred to particle position and chromosome in Genetic Algorithm(GA) and particle swarm optimization (PSO) techniques, respectively. However, in black widow optimization, it is referred to as a “widow.” Currently, it is suitable in the shape of a black widow spider and is expected to face all difficulties. The measurements of black widow spiders are depicted by these black widow spiders’ variables that cause issues. Furthermore, the architecture is illustrated in order to resolve the standard functions as a collection.
A widow is described as such an array of 1*N that reflects a remedy for problem and is expressed as follows for N dimensional optimization problems.
The floating-point value is represented by the variable measurements (x1, x2…, xN). The fitness of a widow is determined by calculating the Fitness Function (FF),F for a widow of a certain variable (x1, x2…. , xN). Hence,
Along with assistance of the current population of spiders, a proposed widow matrix of size Np*N is built in order to launch the optimization technique, where, Np is also represented floating-point value. After that, a set of parents chosen at random to determine pro-development through mating. Once the mating is complete, male black widows are consumed by females.
(ii) Procreate
Pairs begin to mate and give birth to the following generation since they are autonomous in nature. The web is where the mating takes place. Throughout each mating, approximately 1,000 eggs are laid. Some of the spider lings die for various reasons, but the healthy one survives. An array called ‘alpha’ is created for reproduction. This is done to make sure the widow array is correct produced using random offspring values when the specified function is used. The parents are represented by x1 and x2, while the offspring are represented by O1 and O2.
It is repeated for
(iii) Cannibalism
So far, three varieties of cannibalism have been observed. After mating, a female BW consumes the male, which is known as sexual cannibalism. Fitness tests are used to assess both female and male participants. Second, when a healthy spider ling consumes the vulnerable ones, this is known as sibling cannibalism. Cannibalism Rating (CR) is calculated based on the number of survivors [26]. In the third type, the mother is preyed upon by the baby spiders. The fitness tests are used to distinguish between strong and weak spider lings.
(iv) Mutation
Individual mutations values are selected at random to create a population in this method. In the array, the chosen solutions are swapped out in random order and mutation rate is used to calculate it.
3.2 Classification Based on Extreme Learning Machine- Stacked Autoencoder (ELM-SA)
For the purpose of classification, the latest studies have used ELM-SA. It takes the features it has gathered and assess the likelihood of things being present in an image. Both activation and deactivation have the same function. In establishing non-linearity and reduce overfitting, a dropout layer is used [27]. Extreme Learning Machine (ELM) stands for a single hidden layer in a feed-forward neural network(SLFN).Because activation functions that are non-linear are used in SLFN, the buried layer is non-linear. In other words, there is no activation function in the output layer and is linear. It has three layers: an input layer, a concealed layer, and an output layer. Assume x is a training scenario, and that f(x) is the CNN simulation result. The technique presented below implies SLFN as well as k hidden nodes.
where G(w, b, x) denotes the activation function of the hidden layer. The input weight matrix that connects the input and hidden layers is defined by w, the hidden layer’s bias weight is denoted by the letter b and the weight of output hidden layers is denoted by A = [A1,A2,A3…Am].A = ELM makes use of d input neurons, n training instances, there are m output neurons and k hidden neurons (i.e., m classes) whereas Eq. (7) is written as follows:
where Kj is the m-dimensional output vector required for the i-th training instance xi, from the input layer to the j-th hidden neuron, the j-th weight vector is denoted by d-dimensional wj and the bias of the j-th hidden neuron is described by bj, (wj, xi) refers to the inner product of wj and xi in this technique. As an activation function, the sigmoid function s is used as a result, the equation can be used to define the result of the j-th hidden neuron below.
where the arithmetic expression exp(.) of exponents, and the steepness attribute is represented by M2.This technique Eq. (8) is restructured in row and columns as follows:
where T∈Rn*m is the desired outcome, A ∈ Rn*k. L=
Eq. (12) is then used to calculate ELM’s output:
where the output weights are =[ β1,…,βh] and l(x)=[l(x1),………..l(xn)] the feature space for such an input sample x is l(x)=[l(x1),………..l(xN)] , where
So for n input samples, we can get L =
L is the Moore-Penrose generalized inverse of matrix L+ and T =
In general, Eq. (14) could be used to address the learning problem:
where C denotes the regularization factor, implying that we not only estimate the least norm of but also minimize training error. We can get more robust approach in this way. The output weights can then be determined as follows:
Then, using the minimum norm least-squares solution, A is obtained:
ELM is represented as follows: where C is a regularization,
Through a kernel function, Kernel-based ELM (KELM) is now available. Suppose
where
The symbols xi and xj show the i-th and j-th training occurrences, respectively. After that, the consequences of KELM are represented as follows, swapping LLT for B.
where FELM(x) denotes the KELM method results of the simulation, in addition l(x)LT =
The hiding node count is estimated and fixed in KELM, which is a key aspect. It does not contain any arbitrary feature mappings. Furthermore, due to the presence of the kernel technique, processing time is limited to ELM. The ELM-AE technique’s framework is depicted in Fig. 5 [28]. It highlights the traits based on individual measurements. Models Extreme Learning Machine (MELM)is a Multilayer Neural Network (MNN) that consists of many ELM-AEs stacked together. The ELM-AE technique’s framework is depicted in Fig. 5. It highlights the traits based on individual measurements. MELM is a Multilayer Neural Network (MNN) that consists of many ELM-AEs stacked together.
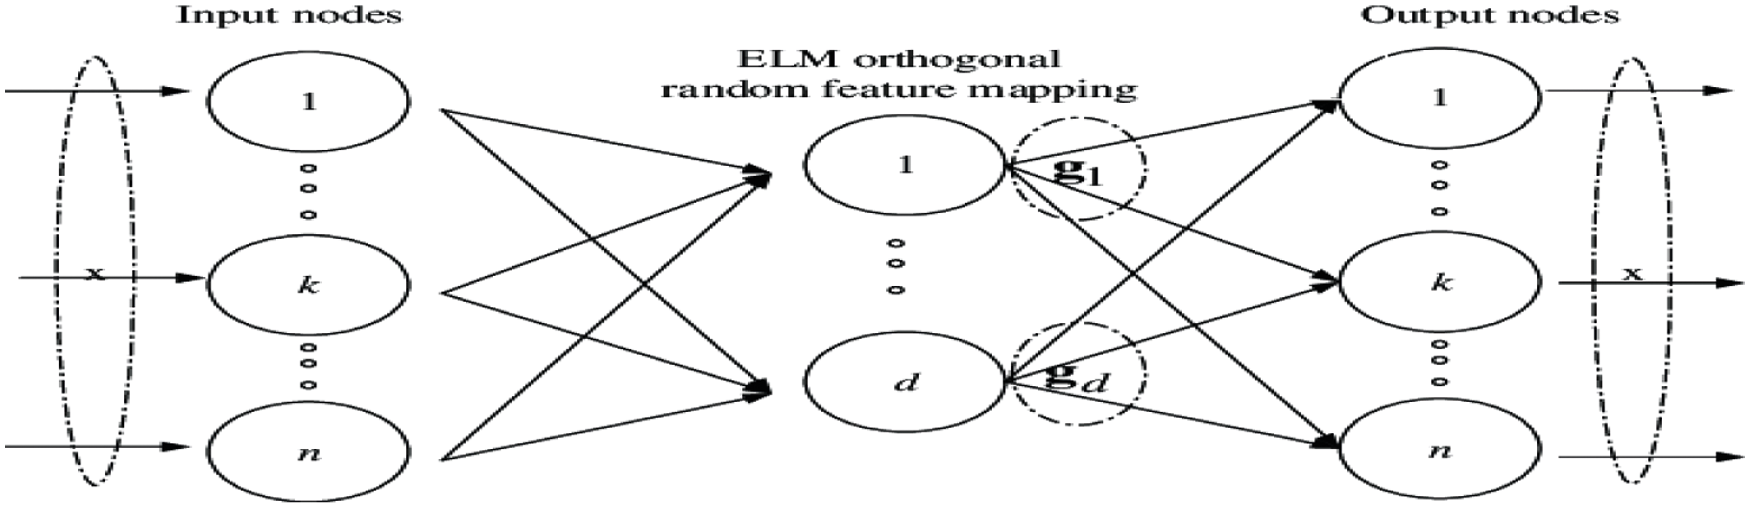
Figure 5: The structure of the ELM-AE model
Suppose X(i)=
Where Li represents the i-th hidden layer’s resulting matrix when Xi is used, and λi has been resolved as follows:
Furthermore,
where X^ stands for Xi final implications. X^ is used as a hidden layer, resulting in the estimate of final weight β^, and it is performed as follow.
The classifiers results are obtained, in the classification of chest X-ray images using the MBWO-CNN model [29] dataset is discussed in this part. X-rays of the chest from COVID-19 and non-COVID individuals are included in the dataset [30]. COVID-19 has a total of 230 images, while the total number of image graphs in normal class is 29. Fig. 6, depicts some of the study’s test image graphs.
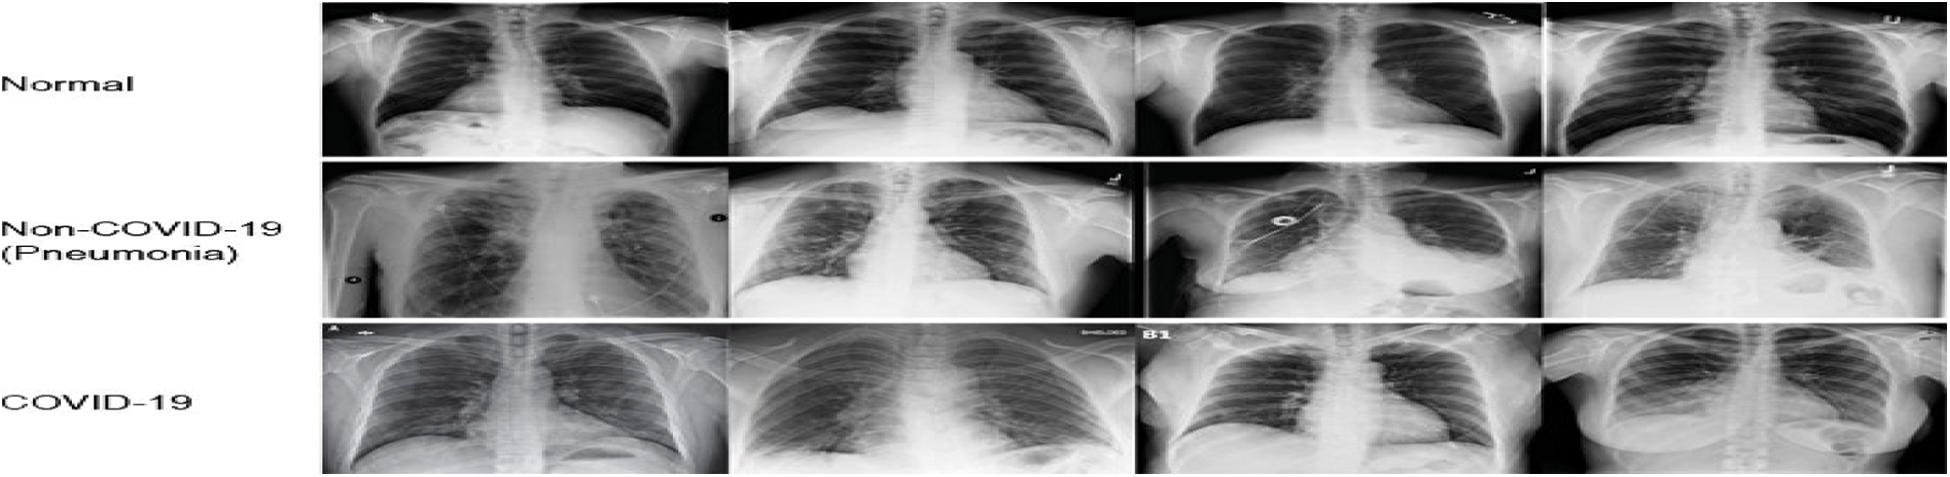
Figure 6: Normal, non- COVID-19 and COVID-19
The findings of the MBWO-CNN model produced a classifier analysis are shown in Tab. 1 and Figs. 7 and 8 in terms of various metrics and run counts. The MBWO-CNN is used in the first execution run. The model had a maximum 95.90% F-score, sensitivity of 95.10%, an accuracy of 95.10%, a specificity of 95.78%, and precision was 96.78%. Similarly, when run is 2, the MBWO-CNN model is used. The maximum 95.65% F-score, sensitivity was 95.16%, the accuracy was 96.22%, the specificity was 97.12%and the precision was 96.22%. Observing this, the MBWO-CNN model exhibited when run 3 was executed. F-score of the is 96.32%, 95.18% maximum sensitivity, 96.90% accuracy, 96.87% specificity and the precision was 96.22%. At the same time, the MBWO-CNN model had the highest F-score of 96.95%, sensitivity of 96.20%, accuracy of 97.10%, specificity of 96.15% and the precision was 97.43%when run 4 was completed. The MBWO-CNN model, on the other hand, reported a maximum F-score of 97.15%, sensitivity of 96.53%, accuracy of 96.67%, specificity of 96.53%, and the precision was 97.43%while running with run 5. Similarly, the MBWO-CNN model achieved maximum F-score of 98.13%, sensitivity of 98.22%, accuracy of 96.87%, specificity of 97.53%, and the precision was 98.53% in execution run 6. Under the execution of run 7, the suggested MBWO-CNN model achieved the maximum F-score of 97.45%, sensitivity of 96.42%, accuracy of 97.54%, specificity of 96.21% and the precision was 97.53%. The MBWO-CNN model had the highest F-score of 98.40%, sensitivity of 97.43%, accuracy of 97.10%, specificity of 96.83% and the precision was 97.53%when run 8 was done. During the execution of run 9, the suggested model achieved maximum F-score of 97.61%, sensitivity of 96.76%, accuracy of 98.30%, specificity of 97.85% and the precision was 97.43%. Simultaneously, the MBWO-CNN model achieved maximum F-score of 98.09%, sensitivity of 96.78%, accuracy of 97.53%, specificity of 96.56% and the precision was 97.53% during the execution run of ten.
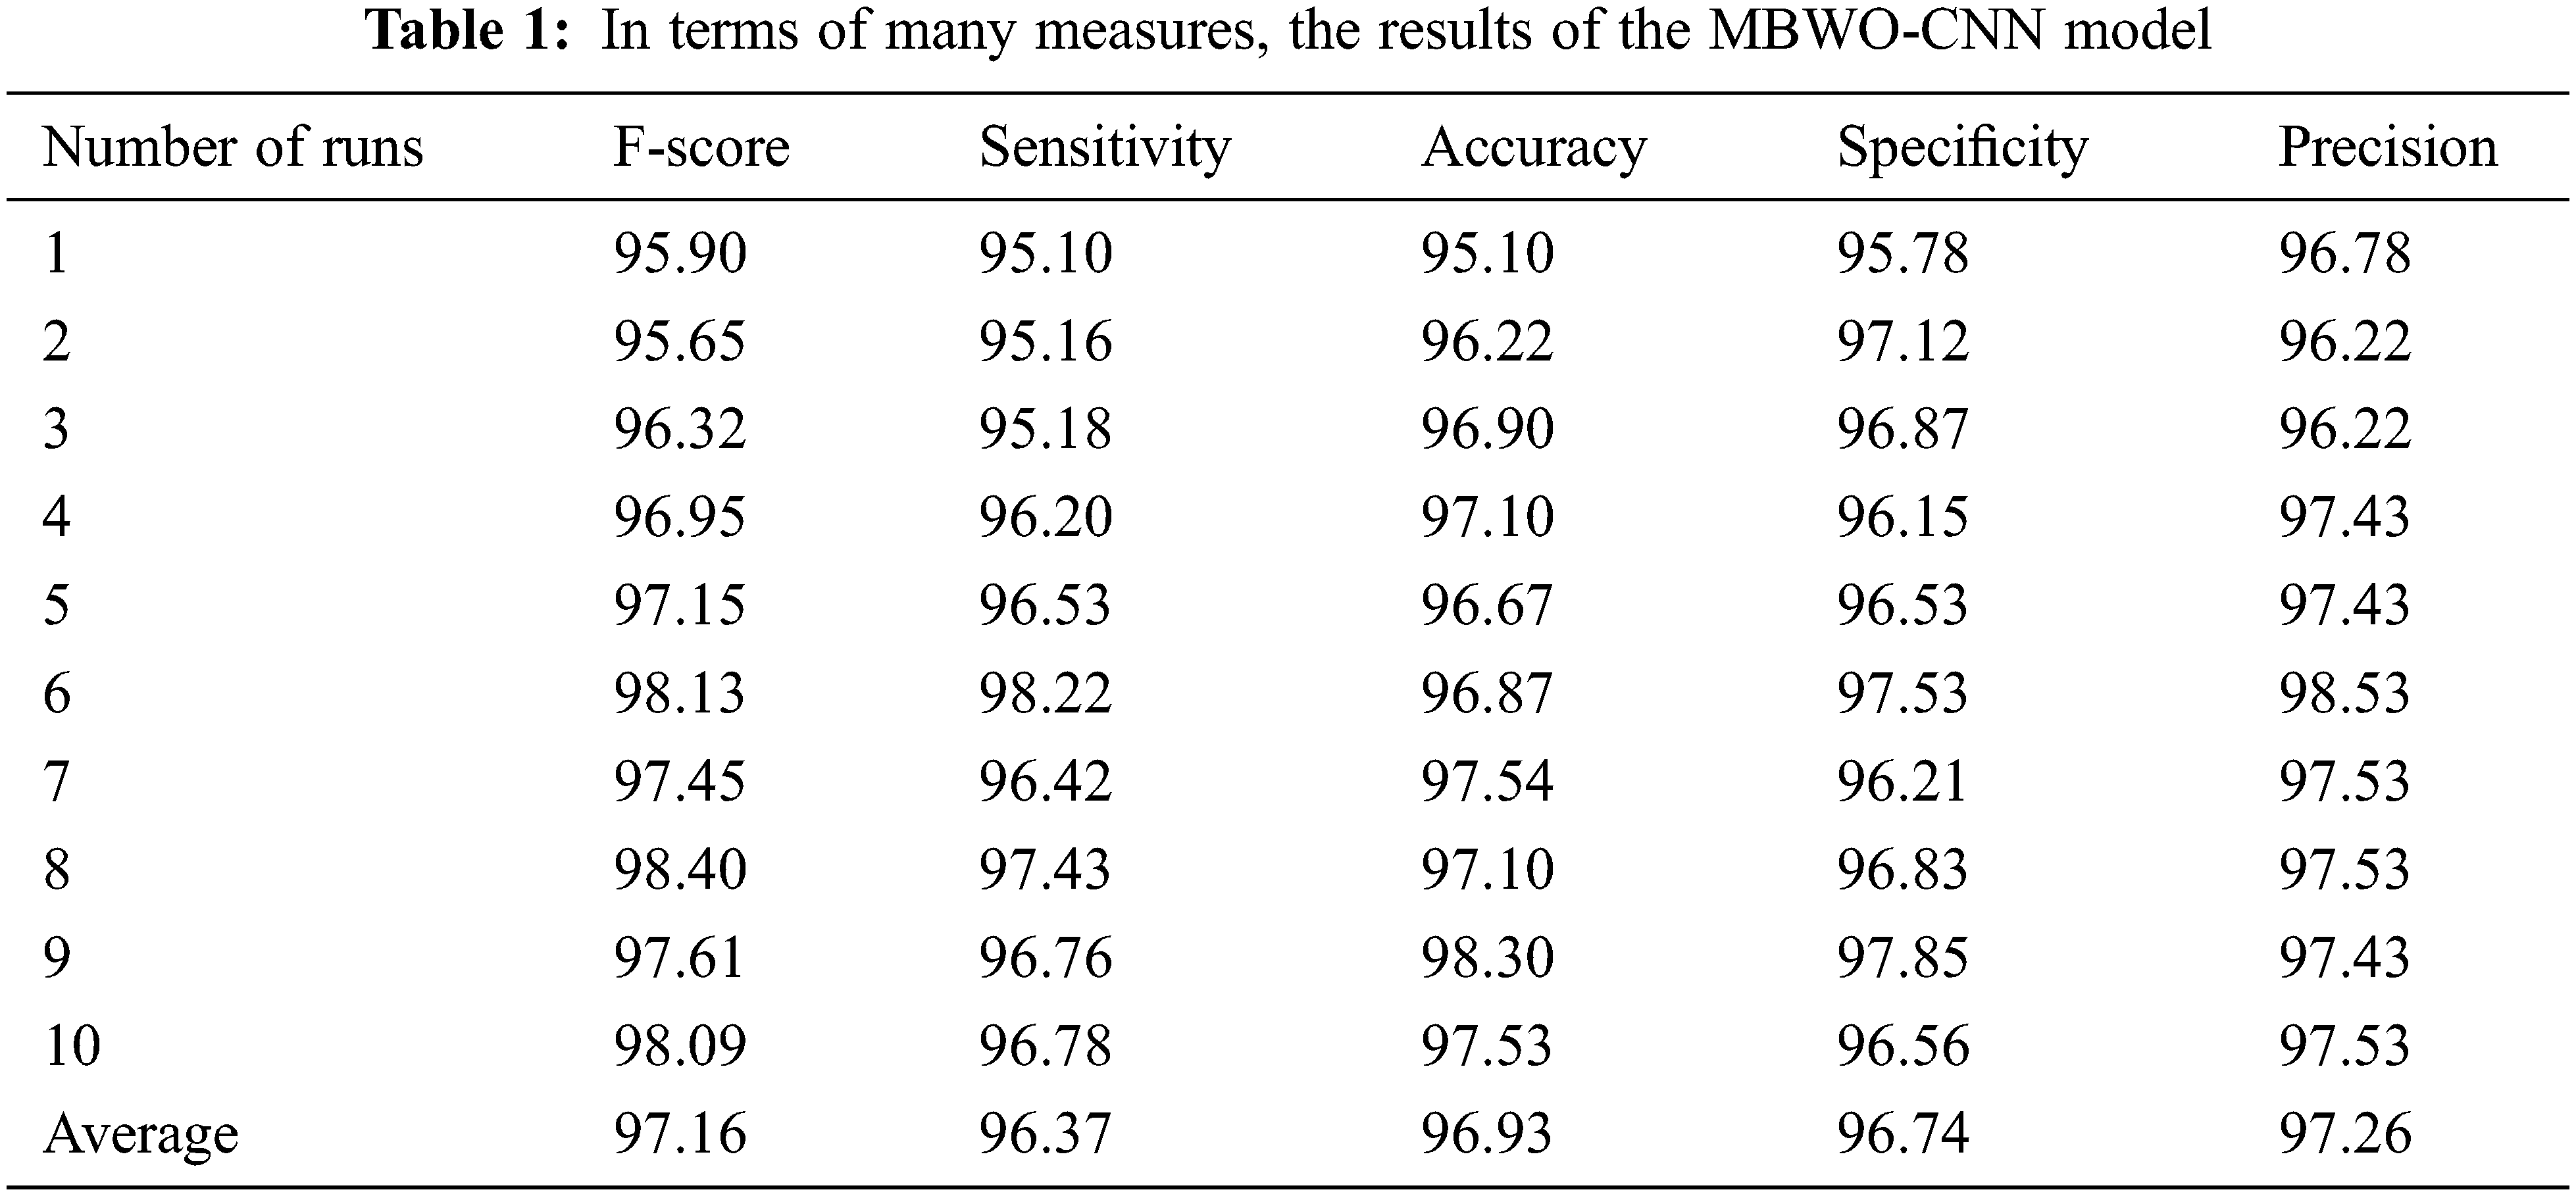
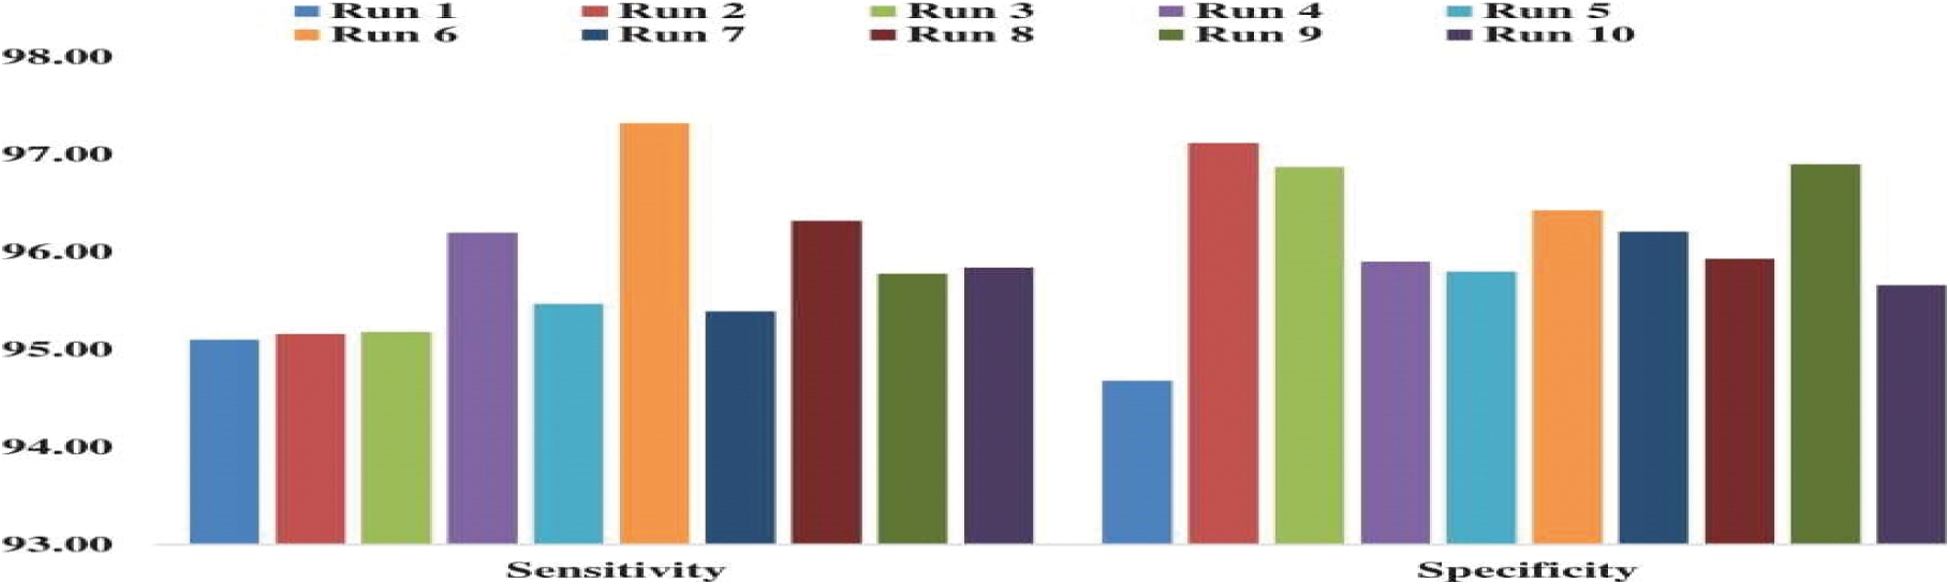
Figure 7: MBWO-CNN model sensitivity and specificity analyses
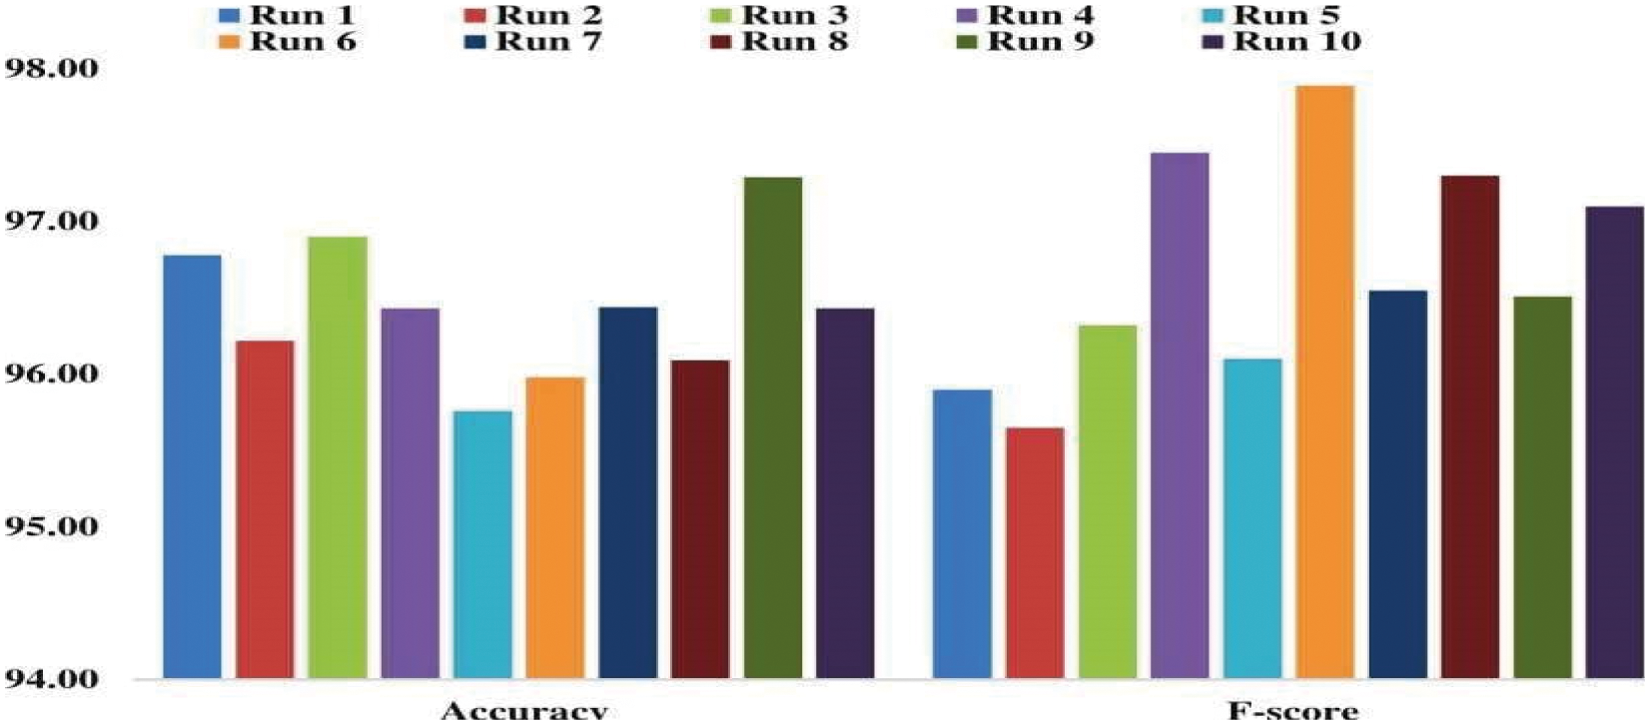
Figure 8: MBWO-CNN model F-score and accuracy analysis
Fig. 9 illustrates the average analysis and findings of the MBWO-CNN model in terms of various metrics. As demonstrated in the graph, the MBWO-CNN model has a maximum F-score of 97.16%, sensitivity of 96.37%, an accuracy of 96.93%, a specificity of 96.74%, and the precision was 97.26%.
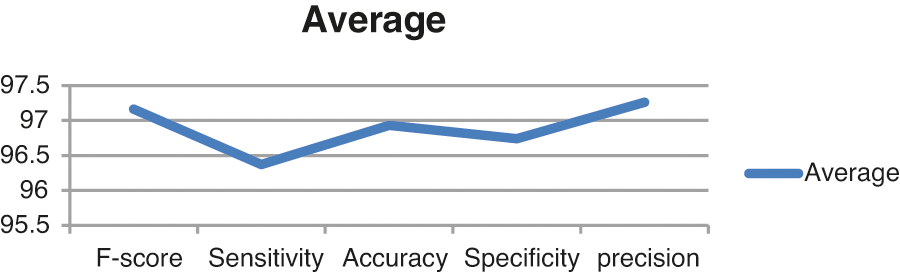
Figure 9: MBWO-CNN model average analysis
Fig. 10 displays the results of comparing the MBWO-CNN model to different models in terms of specificity and sensitivity. As indicated in the figure, the CNN model produced a minimal classifier result with 87.95% specificity and 88.83% sensitivity. With a specificity of 87.96% and a sensitivity of 88.83%, The Multi-Layer Perceptron(MLP) model seems to be a better classifier by a small margin. With a sensitivity of 89.58% and a specificity of 88.84%, the Adaptive neuro fuzzy inference system (ANFIS) model produced slightly better classification. Furthermore, the Decision Trees (DT) model intended to show a moderate outcome with a specificity of 89.83% and sensitivity of 88%. The Logistic Regression (LR)model generated acceptable results with a specificity of 91.24% and sensitivity of 94%.The XGBoost model also had a specificity of 87.87% and sensitivity of 88.83%, all of which were appropriate. The K-Nearest Neighbor (KNN) model has a moderate a specificity of 91.55% and sensitivity of 90%, which is consistent with this observation. The sensitivity of the RNN model was 93.05%, while the specificity was 91.77%. Similarly, the Artificial Neural Network (ANN) model beat earlier approaches, with a specificity of 92.66% and a sensitivity of 94.88%.Following that, the CNN Long Short-Term Memory (CNNLSTM) model yielded moderate outcome with 92.88% specificity and 93.24% sensitivity. Despite the fact that the Deep Transfer Learning (DTL) model had a moderate a specificity of 93.13% and sensitivity of 90.21%. In terms of specificity and sensitivity, the Coronet model outscored all previous models by 93.04% and 91%, respectively. The Long Short-Term Memory (LSTM) model, like the others produced good results, with specificity of 94.52% and sensitivity of 94.52%, respectively. Furthermore, with specificity of 93.57% and sensitivity of 95.13%, the CNN Recurrent Neural Networks(CNNRNN) model produced competitive results. The suggested MBWO-CNN model has beaten all other techniques by yielding specificity of 97.25% and sensitivity of 96.88%.
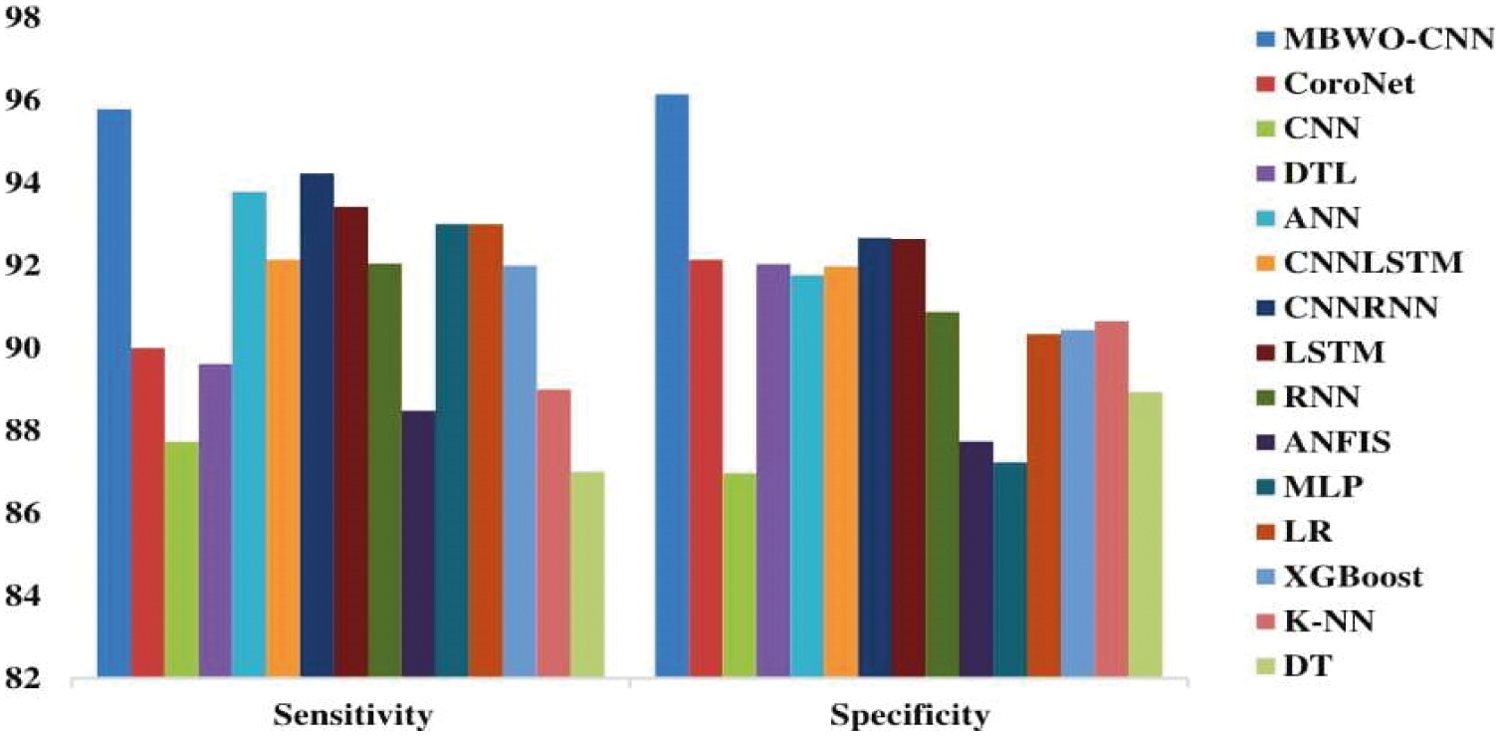
Figure 10: Sensitivity and specificity study of the MBWO-CNN model in comparison to other models
Fig. 11 illustrates the comparison results of the MBWO-CNN model to other models in terms of accuracy and F-score. With a F-score of 91.02% and accuracy of 85.17%, the CNN-LSTM technique produced the worst classifier results, as seen in the graph. With a F-score of 91.51% and accuracy of 85.26%, the Recurrent Neural Networks (RNN) model had slightly better classifier performance. With a F-score of 92.10% and accuracy of 86.76%, the CNN-RNN model produced somewhat ideal classification results. The ANN model also performed well, with a F-score of 92.24%and accuracy of 87%. Furthermore, with F-score of 92.79% and accuracy of 87.76%, the LSTM approach produced tolerable results. Similarly, The DT model had an F-score of 88% and yielded good accuracy of 87.81%. The CNN model achieved an F-score of 90.55% and had moderate accuracy of 88.26%. The ANFIS model yielded F-score of 90.05% with accuracy of 89.12%. Furthermore, with accuracy of 89.81% and an F-score of 90%, the KNN model outperformed earlier models. Following that, the CoroNet model was able to predict a mild outcome with an F-score of 92% followed by accuracy of 92.31%. Despite the fact that the DTL approach had an F-score of 91.53% and decent accuracy of 91.85%, in terms of F-score 91.53% and accuracy of 92.47%, the XGBoost approach exceeded all previous models. Simultaneously, The F-score of the LR model was 93.22%, and the accuracy was 93.22%.The MLP model gave competitive performance, with a F-score of 94% and accuracy of 94.23%. However, with an F-score of 97.78% and accuracy of 97.53%, the suggested MBWO-CNN model outperformed all other models. The findings of the preceding research indicate that the MBWO-CNN model is a useful tool for diagnosing and classifying COVID-19.
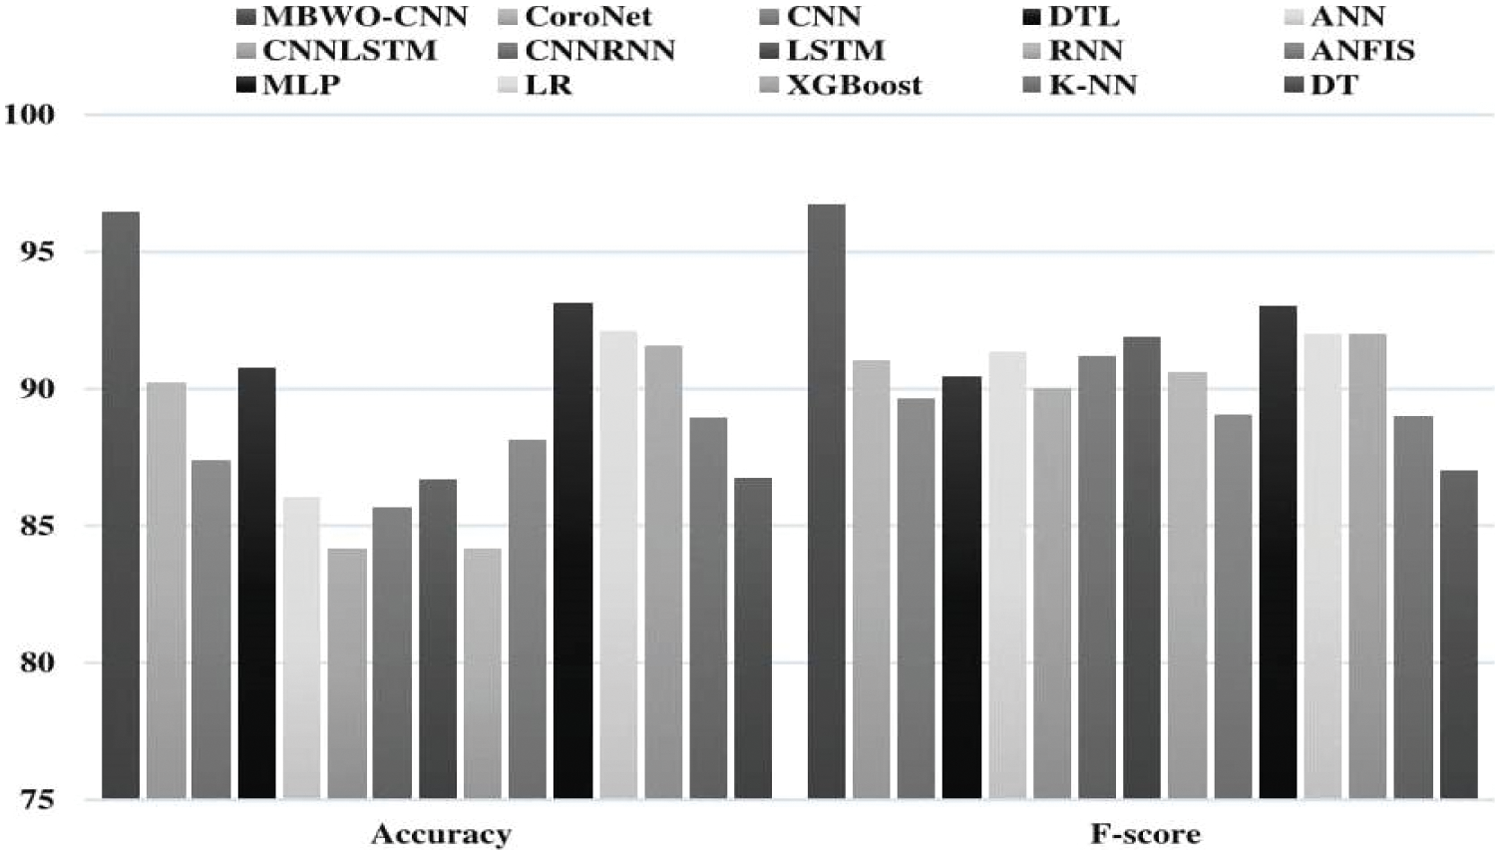
Figure 11: A comparison of the MBWO-CNN model’s accuracy and F-score with other models
In this research work, we proposed an efficient MBWO-CNN method to diagnose and classify covid-19 data. Preprocessed input image was tuned and synchronized according to static dimensions and later attribute selection was carried out. Tuned hyper parameters assisted in the collection of preliminary hyperparameters of CNN model. To conclude, the attribute vectors are categorized and the images were classified into proper class labels ascovid-19 or non-covid-19. A thorough and fairer research was accomplished to evaluate the efficiency of the suggested MBWO-CNN method in detecting the conduct. The outcomes were examined further on some aspects. The suggested MBWO-CNN method attained high classification accuracy of 97.43%, sensitivity of 96.68%, and specificity of 97.25%. Consequently, this research work proved the efficacy of MBWO-CNN method and well-thought-out as an efficient model to diagnose and classify covid-19 data. Soon, this suggested method will be used in IoT and diagnostic tools associated with cloud in order to support and assist distant sufferers.
Funding Statement: The authors received no specific funding for this study.
Conflicts of Interest: The authors declare that they have no conflicts of interest to report regarding the present study.
1. M. A. Khan, S. Kadry, Y. D. Zhang, T. Akram, M. Sharif et al., “Prediction of COVID-19-pneumonia based on selected deep features and one class kernel extreme learning machine,” Computers & Electrical Engineering, vol. 90, pp. 106960, 2021. [Google Scholar]
2. S. R. Nayak, D. R. Nayak, U. Sinha, V. Arora and R. B. Pachori, “Application of deep learning techniques for detection of COVID-19 cases using chest X-ray images: A comprehensive study,” Biomedical Signal Processing and Control, vol. 64, no. 10223, pp. 102365, 2021. [Google Scholar]
3. Z. Wang, L. Li, M. Song, J. Yan, J. Shi et al., “Evaluating the traditional Chinese medicine (TCM) officially recommended in China for COVID-19 using ontology-based side-effect prediction framework (OSPF) and deep learning,” Journal of Ethnopharmacology, vol. 272, pp. 113957, 2021. [Google Scholar]
4. S. Bhattacharya, P. K. R. Maddikunta, Q. V. Pham, T. R. Gadekallu, C. L. Chowdhary et al., “Deep learning and medical image processing for coronavirus (COVID-19) pandemic: A survey,” Sustainable Cities and Society, vol. 65, no. 13, pp. 102589, 2021. [Google Scholar]
5. H. Abbasimehr and R. Paki, “Prediction of COVID-19 confirmed cases combining deep learning methods and Bayesian optimization,” Chaos, Solitons & Fractals, vol. 142, pp. 110511, 2021. [Google Scholar]
6. I. Shiri, A. Akhavanallaf, A. Sanaat, Y. Salimi, D. Askari et al., “Ultra-low-dose chest CT imaging of COVID-19 patients using a deep residual neural network,” European Radiology, vol. 31, no. 3, pp. 1420–1431, 2021. [Google Scholar]
7. C. Shorten, T. M. Khoshgoftaar and B. Furht, “Deep learning applications for COVID-19,” Journal of Big Data, vol. 8, no. 1, pp. 1–54, 2021. [Google Scholar]
8. K. E. ArunKumar, D. V. Kalaga, C. M. S. Kumar, M. Kawaji and T. M. Brenza, “Forecasting of COVID-19 using deep layer recurrent neural networks (RNNs) with gated recurrent units (GRUs) and long short-term memory (LSTM) cells,” Chaos, Solitons & Fractals, vol. 146, no. 1, pp. 110861, 2021. [Google Scholar]
9. N. Shatnawi and H. A. Qdais, “Assessing and predicting air quality in northern Jordan during the lockdown due to the COVID-19 virus pandemic using artificial neural network, Air Quality,” Atmosphere & Health, vol. 14, no. 5, pp. 1–10, 2021. [Google Scholar]
10. M. Turkoglu, “COVIDetectionet: COVID-19 diagnosis system based on X-ray images using features selected from pre-learned deep features ensemble,” Applied Intelligence, vol. 51, no. 3, pp. 1213–1226, 2021. [Google Scholar]
11. W. M. Shaban, A. H. Rabie, A. I. Saleh and M. A. A. Elsoud, “Detecting COVID-19 patients based on fuzzy inference engine and deep neural network,” Applied Soft Computing, vol. 99, no. 8, pp. 106906, 2021. [Google Scholar]
12. D. N. Le, V. S. Parvathy, D. Gupta, A. Khanna, J. J. P. C. Rodrigues et al., “IoT enabled depthwise separable convolution neural network with deep support vector machine for COVID-19 diagnosis and classification,” International Journal of Machine Learning and Cybernetics, vol. 12, no. 11, pp. 1–14, 2021. [Google Scholar]
13. E. H. Houssein, Z. Abohashima, M. Elhoseny and W. M. Mohamed, “Hybrid quantum convolutional neural networks model for COVID-19 prediction using chest X-ray images,” Image and Video Processing, vol. 2102, pp. 1–22, 2021. [Google Scholar]
14. S. Sharma and A. Jain, “An algorithm to identify the positive COVID-19 cases using genetic algorithm (GABFCov 19),” Journal of Interdisciplinary Mathematics, vol. 24, no. 1, pp. 109–124, 2021. [Google Scholar]
15. R. S. M. L. Patibandla and V. L. Narayana, “Computational intelligence approach for prediction of COVID-19 using particle swarm optimization,” in Computational Intelligence Methods in COVID-19: Surveillance, Prevention, Prediction and Diagnosis, Proceedings: Studies in Computational Intelligence book series (SCI, volume 923), Springer, Singapore, pp. 175–189, 2021. [Google Scholar]
16. P. Gifani, A. Shalbaf and M. Vafaeezadeh, “Automated detection of COVID-19 using ensemble of transfer learning with deep convolutional neural network based on CT scans,” International Journal of Computer Assisted Radiology and Surgery, vol. 16, no. 1, pp. 115–123, 2021. [Google Scholar]
17. D. Singh, V. Kumar and M. Kaur, “Densely connected convolutional networks-based COVID-19 screening model,” Applied Intelligence, vol. 51, no. 5, pp. 1–8, 2021. [Google Scholar]
18. R. Jain, M. Gupta, S. Taneja and D. J. Hemanth, “Deep learning based detection and analysis of COVID-19 on chest X-ray images,” Applied Intelligence, vol. 51, no. 3, pp. 1690–1700, 2021. [Google Scholar]
19. M. Z. C. Azemin, R. Hassan, M. I. M. Tamrin and M. A. M. Ali, “COVID-19 deep learning prediction model using publicly available radiologist-adjudicated chest X-ray images as training data: Preliminary findings,” International Journal of Biomedical Imaging, vol. 2020, pp. 1–7, 2020. [Google Scholar]
20. A. Narin, C. Kaya and Z. Pamuk, “Automatic detection of coronavirus disease (covid-19) using x-ray images and deep convolutional neural networks,” Image and Video Processing, vol. 24, no. 3, pp. 1207–1220, 2021. [Google Scholar]
21. J. Sultana, M. U. Rani, S. Aslamand and L. AlMutairi, “Predicting indian sentiments of COVID-19 using MLP and adaboost,” Turkish Journal of Computer and Mathematics Education, vol. 12, no. 10, pp. 706–714, 2021. [Google Scholar]
22. J. Sultana and A. K. Jilani, Classifying cyberattacks amid COVID-19 using support vector machine,” in EAI/Springer Innovations in Communication and Computing, Springer, pp. 161–175, 2021. [Google Scholar]
23. D. A. Pustokhin, I. V. Pustokhina, P. N. Dinh, S. V. Phan, G. N. Nguyen et al., “An effective deep residual network based class attention layer with bidirectional LSTM for diagnosis and classification of COVID-19,” Journal of Applied Statistics, vol. 2020, pp. 1–18, 2020. [Google Scholar]
24. K. Shankar and E. Perumal, “A novel hand-crafted with deep learning features based fusion model for COVID-19 diagnosis and classification using chest X-ray images,” Complex & Intelligent Systems, vol. 2020, pp. 1–14, 2020. [Google Scholar]
25. V. Hayyolalam and A. A. P. Kazem, “Black widow optimization algorithm: A novel meta-heuristic approach for solving engineering optimization problems,” Engineering Applications of Artificial Intelligence, vol. 87, no. 1, pp. 1–28, 2020. [Google Scholar]
26. L. R. Fox, “Cannibalism in natural populations,” Annual Review of Ecology and Systematic, vol. 6, no. 1, pp. 87–106, 1975. [Google Scholar]
27. C. R. Rao and S. K. Mitra, Generalized Inverse of Matrices and its Applications, Vol. 135, New York: John Wiley, pp. 197, 1971. [Google Scholar]
28. L. L. C. Kasun, H. Zhou, G. B. Huang and C. M. Vong, “Representational learning with extreme learning machines for big data,” IEEE Intelligent Systems, vol. 61, no. 6, pp. 32–48, 2015. [Google Scholar]
29. J. P. Cohen, P. Morrison, L. Dao, K. Roth, T. Q. Duong et al., “Dataset,” 2020. [Online]. Available: https://github.com/ieee8023/covid-chestxray-dataset,. [Google Scholar]
30. https://www.kaggle.com/plameneduardo/sarscov2-ctscan-dataset. [Google Scholar]
 | This work is licensed under a Creative Commons Attribution 4.0 International License, which permits unrestricted use, distribution, and reproduction in any medium, provided the original work is properly cited. |