DOI:10.32604/iasc.2022.024746
| Intelligent Automation & Soft Computing DOI:10.32604/iasc.2022.024746 | |
| Article |
A Novel Deep Learning Framework for Pulmonary Embolism Detection for Covid-19 Management
1Department of Computer Science and Engineering, Kalasalingam Institute of Technology, Srivilliputhur, 626126, Tamil Nadu, India
2Department of Electronics and Communication Engineering, P.S.R. Engineering College, Sivakasi, Virudhunagar, 626140, Tamil Nadu, India
*Corresponding Author: S. Jeevitha. Email: jeevithapapers2021@gmail.com
Received: 29 October 2021; Accepted: 29 January 2022
Abstract: Pulmonary Embolism is a blood clot in the lung which restricts the blood flow and reduces blood oxygen level resulting in mortality if it is untreated. Further, pulmonary embolism is evidenced prominently in the segmental and sub-segmental regions of the computed tomography angiography images in COVID-19 patients. Pulmonary embolism detection from these images is a significant research problem in the challenging COVID-19 pandemic in the venture of early disease detection, treatment, and prognosis. Inspired by several investigations based on deep learning in this context, a two-stage framework has been proposed for pulmonary embolism detection which is realized as a segmentation model. It is implemented as a cascade of convolutional superpixel neural network and a regularized UNet network for the segmentation of embolism candidates as well as embolisms, respectively. The proposed model has been tested with two public datasets and it has achieved a testing accuracy of 99%. The proposed model demonstrates high sensitivities of 88.43%, 88.36%, and 89.93% at 0, 2, and 5 mm localization errors, respectively for two false positives and they are superior to the state-of-the-art models, signifying potential applications in the treatment protocols of diverse pulmonary diseases and COVID-19.
Keywords: Computed tomography angiography; superpixel CNN; UNet; plmonary embolism; COVID-19
Pulmonary Embolism (PE) is a blood clot in the lung caused by Deep Vein Thrombosis (DVT) which originates in the right heart chambers, leg, pelvis, renal veins, etc. In succession to myocardial infarction and stroke, venous thromboembolism is identified to be the third most diagnosed cardiovascular disorder. A recent study on the diagnosis of PE by Ishaaya et al. [1] reveals that dyspnea and chest pain are the common symptoms of PE and they are nonspecific clinical presentations, associated with several cardiopulmonary diseases. There are several causes of PE such as muscle tears, fractures, cancer, obesity, hormone imbalance, surgeries, etc. PE is correlated with mortalities due to cardiac disorders, early detection of which can considerably improve the treatment results.
Further, current clinical studies [2–4] have reported intersections of PE and COVID-19 by recording 23% of PE incidences in COVID-19 patients. It has been identified that COVID-19 patients with PE require frequent mechanical ventilation support compared to those without PE. Presently, many investigations on the association [5,6] between PE and COVID-19 have revealed the prevalence of overlapping symptoms of Acute Respiratory Distress Syndrome (ARDS), characteristic of COVID-19 infections and PE. With the global infiltration of COVID-19, diagnosis of PE with symptoms atypical to COVID-19 is very essential for emergency clinical interventions.
Computed Tomography Pulmonary Angiography (CTPA) [7] featuring high sensitivity and specificity is highly desirable, due to its minimum invasiveness. Further, along with pulmonary arteries, this modality also captures etiologies of several disorders such as pneumonia, musculoskeletal injuries, pericardial and vascular disorders, coronary artery disease, etc. A most recent review by Kwee et al. [8] reveals that the frequency of PEs in CTPA images of COVID-19 patients is high in the intensive care units (ICU) compared to emergency departments and general wards. Similarly, a recent retrospective [9] study with CTPA images also shows high incidences of PE in COVID-19 patients.
Examination of a CTPA image volume comprising hundreds of slices for PE detection is highly time-consuming and challenging for expert radiologists, due to the asymmetric pulmonary vasculature. The representative works founded on machine learning approaches reported in [10,11], in the past two decades. However, these approaches are reported to generate a large number of false positives, calling for excessive efforts by radiologists in resolving the detection results.
With the evolution of the deep learning paradigm, several works on PE detection based on Convolutional Neural Network (CNN) models introduced in recent years. The first work in this context reported in [12], follows a unique vessel-aligned multi-planar image representation of CTPA images featuring compactness, consistency, and expandability. This system demonstrates a sensitivity of 83% with 2 false positives per volume.
Inspired by this framework and several deep learning-based PE detection models, in the present study, a novel two-stage PE detection model called the SCNN-UNet, which comprises a superpixel CNN and a variant of the UNet has been proposed. The contributions of this research and potential features of the SCNN-UNet framework are depicted below.
• An integral framework for PE detection comprising a superpixel CNN and UNet featuring high accuracy and sensitivity
• The superpixel CNN performs PE candidate detection with low false positives
• The regularized UNet demonstrates accurate PE detection which generalizes well
• This model is trained and verified by two large scale datasets with non-overlapping training and testing images
• The proposed model can be extended to a wide spectrum of pulmonary diseases by transfer learning
The coexistence of COVID-19 and PE, two life-threatening illnesses, in the same patient presents a unique challenge. Guidelines have delineated how best to diagnose and manage patients with PE. The performance of this model has been evaluated with two standard datasets and a global segmentation accuracy of 99% with very low false-positive has been achieved. This model establishes superior performance compared to the state-of-the-art approaches and is suitable for integration with CTPA image examination protocols for accurate detection of PEs in the treatment regimen of COVID-19 and other pulmonary pathologies.
The rest of the paper is organized as below. In Section 2, a review of deep learning-based PE detection approaches is presented and in Section 3, the datasets used, mathematical foundations, and implementation of the proposed system are described. In Section 4, the proposed model with the schematics of subnetworks has been illustrated. Experimental results are given in Section 5 and detailed comparative analysis is given in Section 6. The paper is concluded in Section 7 with directions for future research.
In this section, a review of deep learning models for PE management and relevant CNN models has been presented to provide insight into the relevant works. A review [13] of the deep learning models for medical image investigation gives a comprehensive account of various CNN models employed in medical image investigation tasks of multiple pathologies and organs. In a two-stage model proposed in [14], masks are defined on the candidate emboli regions in the first stage and Multiple Instance Learning (MIL) is employed to detect PE from the masked volumes in the second stage. In this approach, 2D UNet [15] is employed in the first stage to process stacks of 2D slices to construct the masks. A 2D Convolutional Long Short-Term Memory (CLSTM) [16] model which captures Spatio-temporal correlations within CT volumes is employed as a feature extractor. This model demonstrates Area Under Curve (AUC) scores of 0.94 and 0.85 for validation and test datasets, respectively.
The CNN model proposed in [17] comprises a sequence of three sub-networks viz. a 3D network for detecting prospective regions containing PEs, which predicts the target class of the input from the cross-sections of the transformed candidates. This model achieves a sensitivity of 80.7% with two false positives per volume at 5 mm localization error. Similar to this model, a two-stage network performs candidate selection and false-positive elimination in stage one with two sub-networks, and classification is done in stage two with a 2D ResNet18 [18] model. The first stage is implemented with two subnets and a 3D Fully Convolutional Neural Network (FCN) based candidate proposal subnet is followed by a subnet based on vessel-aligned candidate transformation for false-positive removal. This model achieves sensitivities of 75.5% and 76.3% for the PE Challenge [19] and PE129 datasets, respectively.
Unlike the approaches which find the candidate points and evaluate them to discriminate as PE or non-PE, this approach formalizes PE detection as a segmentation problem. It segments the CTPA volumes by training three networks viz. 2D, 2.5D, and 3D with different slice types such as 2D slices, a stack of 5 2D slices, and 3D slices. This is followed by transforming the segmented output into emboli coordinates by assigning a probabilistic score to each coordinate based on its proximity to the center of the emboli.
Acute or chronic PEs manifest in pulmonary arteries and are attached to the walls. In CTPA images, both kinds of PEs are seen as dark regions with CT values in the range [−50 100] Hounsfield Units (HU), within bright vessels. However, the pixels closer to the vessel boundaries also fall in the same HU range. The separation of PE pixels from these pixels is a non-trivial problem. The tobogganing algorithm [20,21] separates the PE pixels by sliding the voxels in the range [−50 100] to the neighboring voxels with minimal CT value and clustering the voxels which do not slide into the neighboring regions with CT values below -50. The CNN models are then trained with these candidates to detect the presence and absence of PEs in CT volumes.
In line with this, the most recent work on COVID-19 lesion segmentation from lung CT images with UNet and four variants employing Attention Gate (AG) mechanism, dense networks, Improved Dilation Convolution (IDC), and their combinations is proposed in [22]. The AG-UNet employs an attention mechanism to focus on target regions of varying shapes and sizes, assigning higher weights to these regions for precise segmentation of lesions. The DA-UNet adds two dense networks and an AG module to the UNet, where each dense network comprises a set of convolution and pooling layers, numerous dense blocks, and transition layers. The IDA-UNet is built by adding the IDC and AG modules to the UNet. The IDC module connects the encoder-decoder pipelines of the UNet to increase the size of the receptive field providing broader views of the images. From this review, it is perceived that recent automated PE detection systems are based on pre-trained CNN models and they are adapted to the CTPA image dataset by transfer learning. A COVID-19 specific characteristics confound both the diagnosis and treatment of PE. Hence, the modification of established algorithms [23]. An advantage of a team-based method for decision-making and coordination of care, such as that offered by pulmonary embolism response teams.
3.1 Dataset and Implementation
In this research, the proposed model has been trained and tested with two publicly available datasets namely the FUMPE (Ferdowsi University of Mashhad’s PE) [24] dataset and the CAD-PE challenge dataset. The FUMPE dataset consists of 3D CTPA a volume of 35 different patients with 8792 slices altogether and the CAD-PE dataset contains 91 CTPA volumes.
Initially, the superpixel CNN is trained to segment the PE candidates from the CTPA slices with a training dataset comprising 1000 images from each dataset. This dataset is augmented with 1000 more image slices from each dataset by scaling, rotation, and flipping operations on the original slices. The superpixel CNN trained with these 4000 slices is tested with 1000 images from each dataset.
The UNet model is trained and tested to segment the PEs from the PE candidates with slices of both datasets. Initially, the UNet segmentation model is fine-tuned with 2000 images from the FUMPE dataset, augmented with 2000 additional images and 9736 slices of 20 CTPA volumes from the CAD-PE dataset. This model is tested with 6792 CTPA slices of the FUMPE dataset and 8487 slices from 20 CTPA volumes of the CAD-PE dataset. Due to the large volume of slices in the 91 CTPA volume CAD-PE dataset, slices are considered only from twenty independent CTPA volumes.
The proposed model performance is evaluated with the ground truth labels accompanying the CTPA volumes of both datasets. The description of the dataset is represented in Tab. 1.
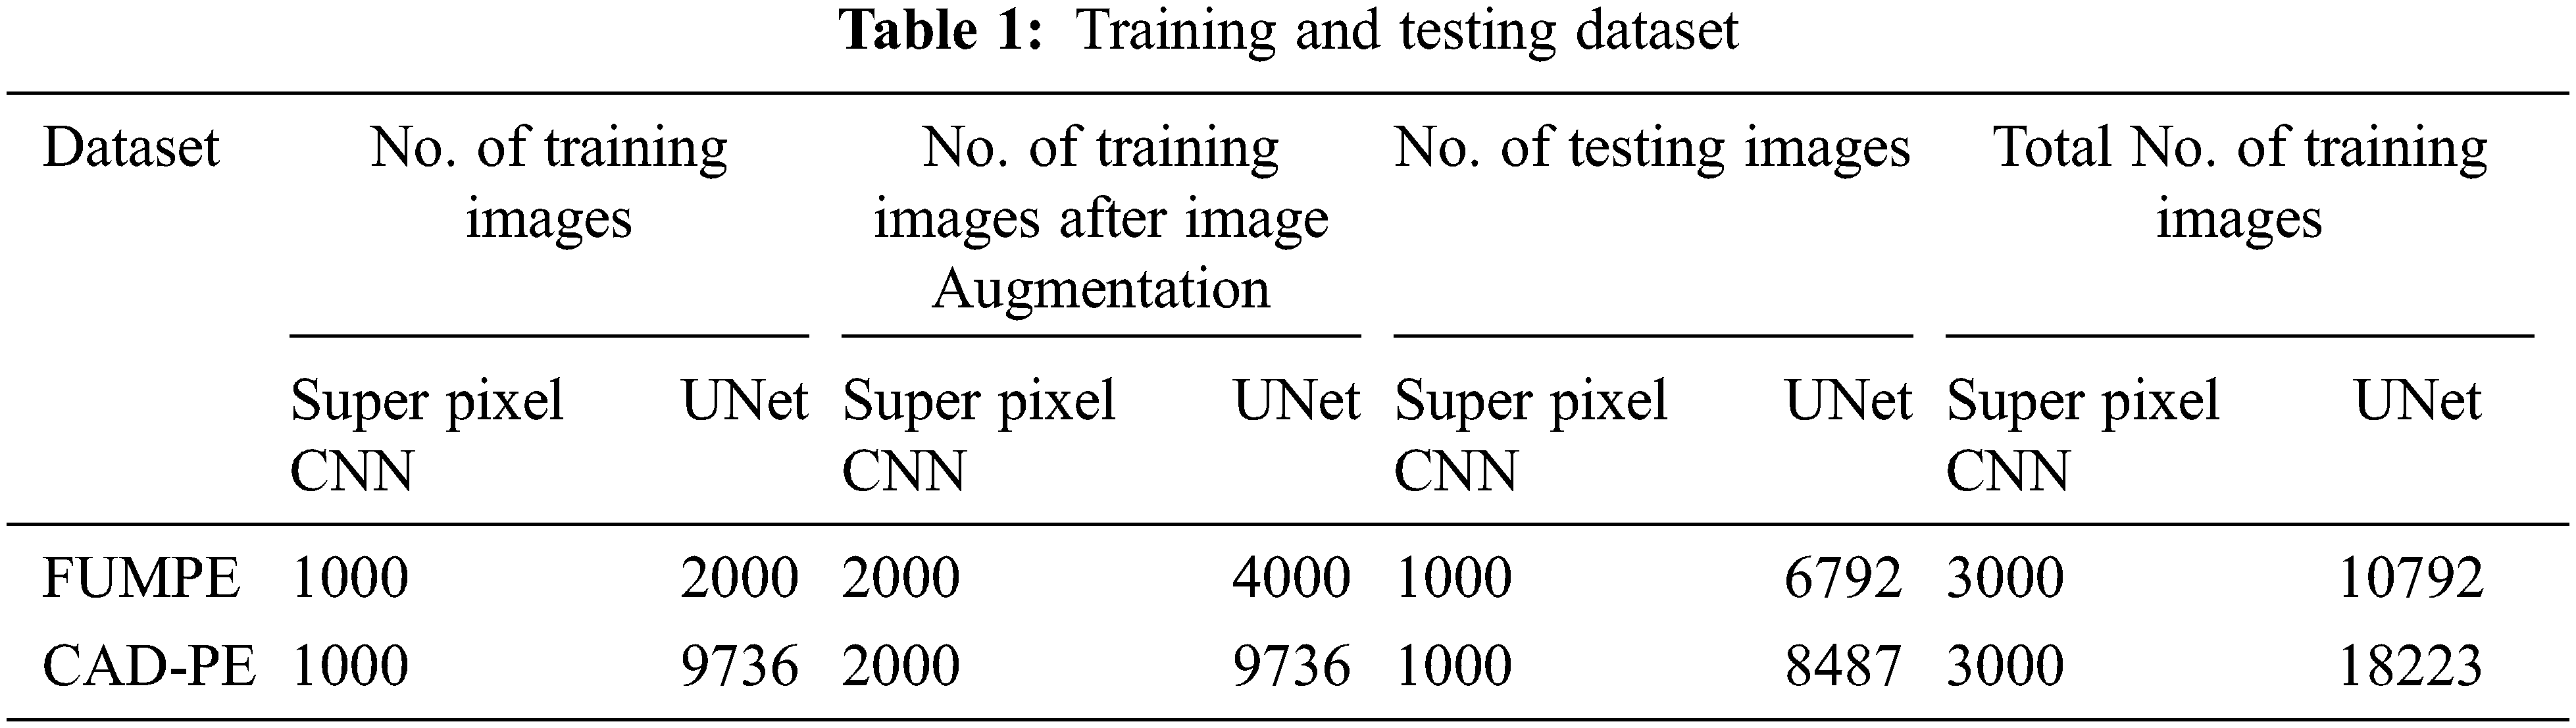
It must be noted that the CAD-PE UNet training dataset is not augmented, as it fine-tunes the already trained UNet. In the above table, images refer to CTPA slices.
Both the FUMPE and CAD-PE datasets consist of grayscale images and binary labels of dimension 512 × 512. The CTPA slices are converted into RGB images of size 256 × 256 and the labels are resized to 256 × 256. The testing datasets are subsets of the original datasets without augmentation which do not overlap with the training images. The proposed method is applied with Matlab 2020b software in an i7-7700 K processor with 32GB DDR4 RAM equipped with an NVIDIA Ge Force GTX1060 3GB Graphics card.
The features of compactness, consistency, and expandability for data augmentation can be realized with a less computational intensive superpixel segmentation approach. A superpixel is a concise semantic representation of a pixel’s group with similar pixel intensities. Superpixel segmentation has a wide range of scientific and surveillance applications including tissue/organ segmentation in medical images, object recognition, detection, etc. With the introduction of the Simple Linear Iterative Clustering (SLIC) [25] algorithm, several superpixel segmentation algorithms have been proposed. This algorithm clusters pixels within rectangular windows into superpixels based on distance measures between color and spatial vectors of the image pixels. Recently, conventional deep-learning classification or segmentation models, which accept raw input images, are integrated with superpixel segmentation algorithms. The superpixel-driven CNN models are comparatively better in capturing salient regions and objects from images and they find applications in medical image investigation [26,27].
In this paper, a superpixel CNN based on Gaussian Mixture Model (GMM) [28] superpixels has been employed as a sub-network for PE candidate selection and false-positive elimination. The GMM superpixels are superior to the SLIC superpixels in capturing homogeneous regions of arbitrary shape and size without constraints on the shape of the superpixels. An illustration of the SLIC and GMM superpixel segmentations on CTPA images is shown in Fig. 1. It is seen that the segmentation accuracy is better with GMM superpixels.
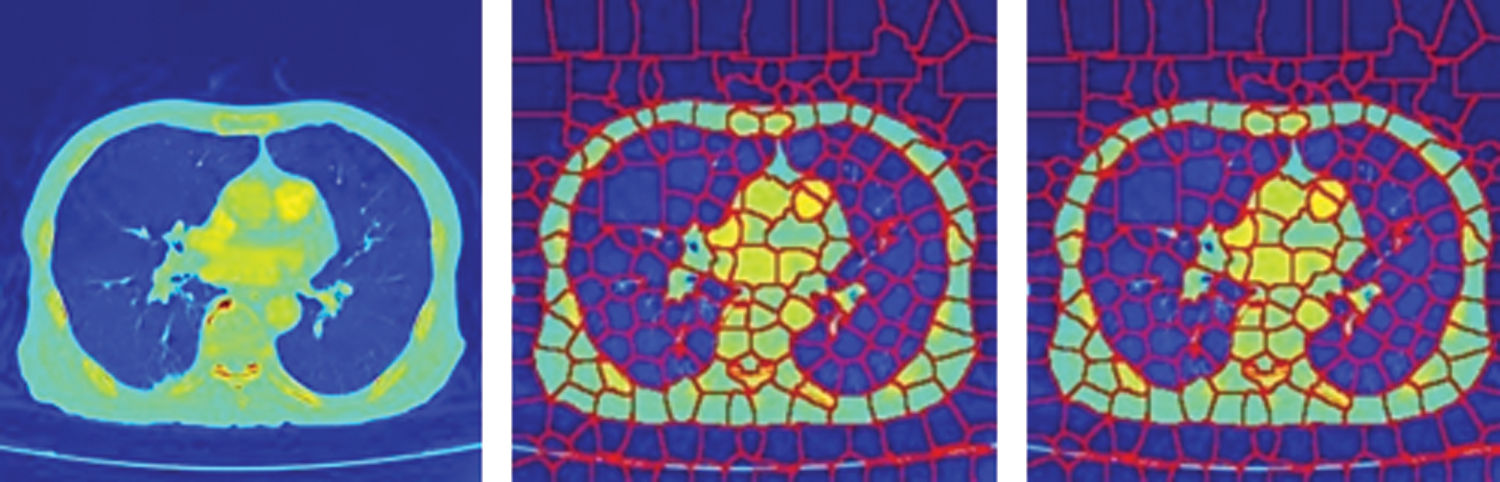
Figure 1: SuperPixel segmentation of CTPA images (a) CTPA slice (b) SLIC super pixel segmentation (c) GMM super pixel segmentation
The mathematical aspects of GMM superpixel segmentation are given below. Generally, a Gaussian process is stochastic which demonstrates a normal distribution on the linear combination of random variables of a finite set. This feature is leveraged in diverse clustering algorithms in machine vision problems. A Gaussian model learns from the training data points and predicts the response for an arbitrary input. In a Gaussian model, each pixel is modeled with a Gaussian distribution mixture so that, it is extended to superpixel segmentation where each superpixel is associated with one of the distributions. A superpixel label is assigned to a pixel-based on Expectation-Maximization (EM) and posterior probability described as below.
Assumed an image I of size M × N, the total number of pixels in the image is T=M × N. Each pixel in the image is allocated with an index i in the range [0 T-1]. Unlike the SLIC algorithm in which the user inputs the number of superpixels, the GMM superpixel algorithm accepts the inputs dxand dythat is maximum window sizes of the superpixels along the vertical and horizontal path. These values are chosen such that M mod dxand N mod dyevaluate 0 and the number of superpixels L is computed as in Eq. (1). The set of L superpixel labels is defined as {0, 1,… L-1}.
Generally, the probability density function (pdf) for a random variable x following a normal distribution is given in Eq. (2).
where σ is the standard deviation and μ is the mean. A superpixel l
where ϴl={μl,∑l} and D is the number of components in z.
A pixel i belongs to a superpixel l, only if i exists in the pixels set Il which is defined via the Eq. (4), where b and c refer to the lower and upper bounds of the superpixel l, respectively.
where
For a superpixel l
From the illustrations and the mathematics behind the GMM superpixel segmentation, it is seen that these pixels offer a good trade-off between regularity and precision. Further, the mathematical computations in GMM superpixel segmentation can be parallelized by increasing the segmentation speed. In this paper, a GMM superpixel-based CNN subnet has been built based on the ResNet18 model pre-trained with the ImageNet [29] dataset for PE candidate selection and false-positive removal.
A proposed PE detection network is modeled as a segmentation system as exposed in the schematic diagram in Fig. 2. The training and the testing phases of the two subnets are defined in the following subsections.
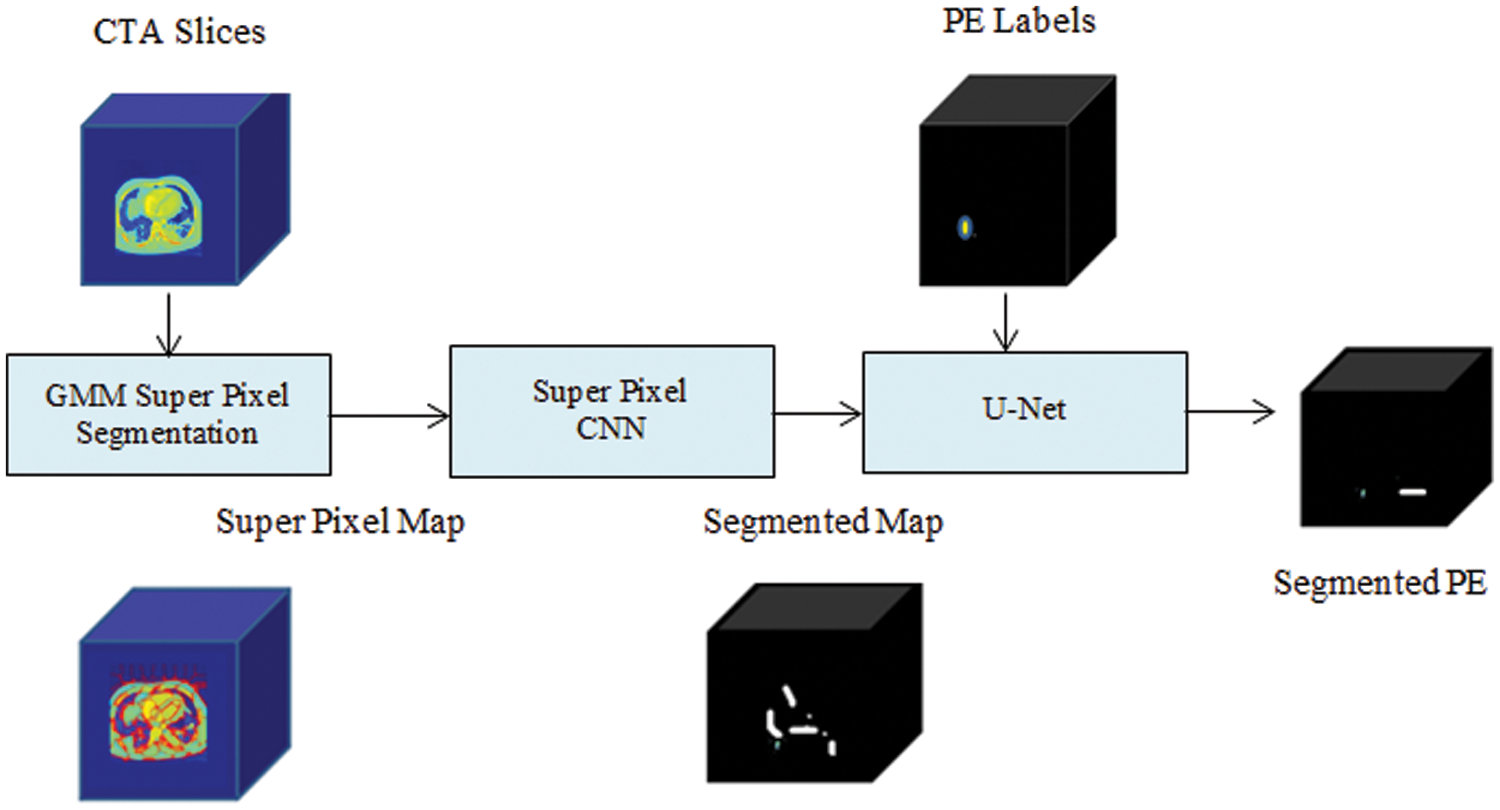
Figure 2: Schematic of SCNN-UNet PE detection model
4.1 Superpixel CNN Training and Testing
As shown in Fig. 2, each CTPA slice is segmented into superpixels and the superpixel CNN is trained with each superpixel extracted from the superpixel map. The PE candidate selection and false-positive removal operations are explained with GMM superpixel segmentation and pooling operations as below. The superpixel pooling layer is added to the ResNet18 model as shown in Fig. 3.
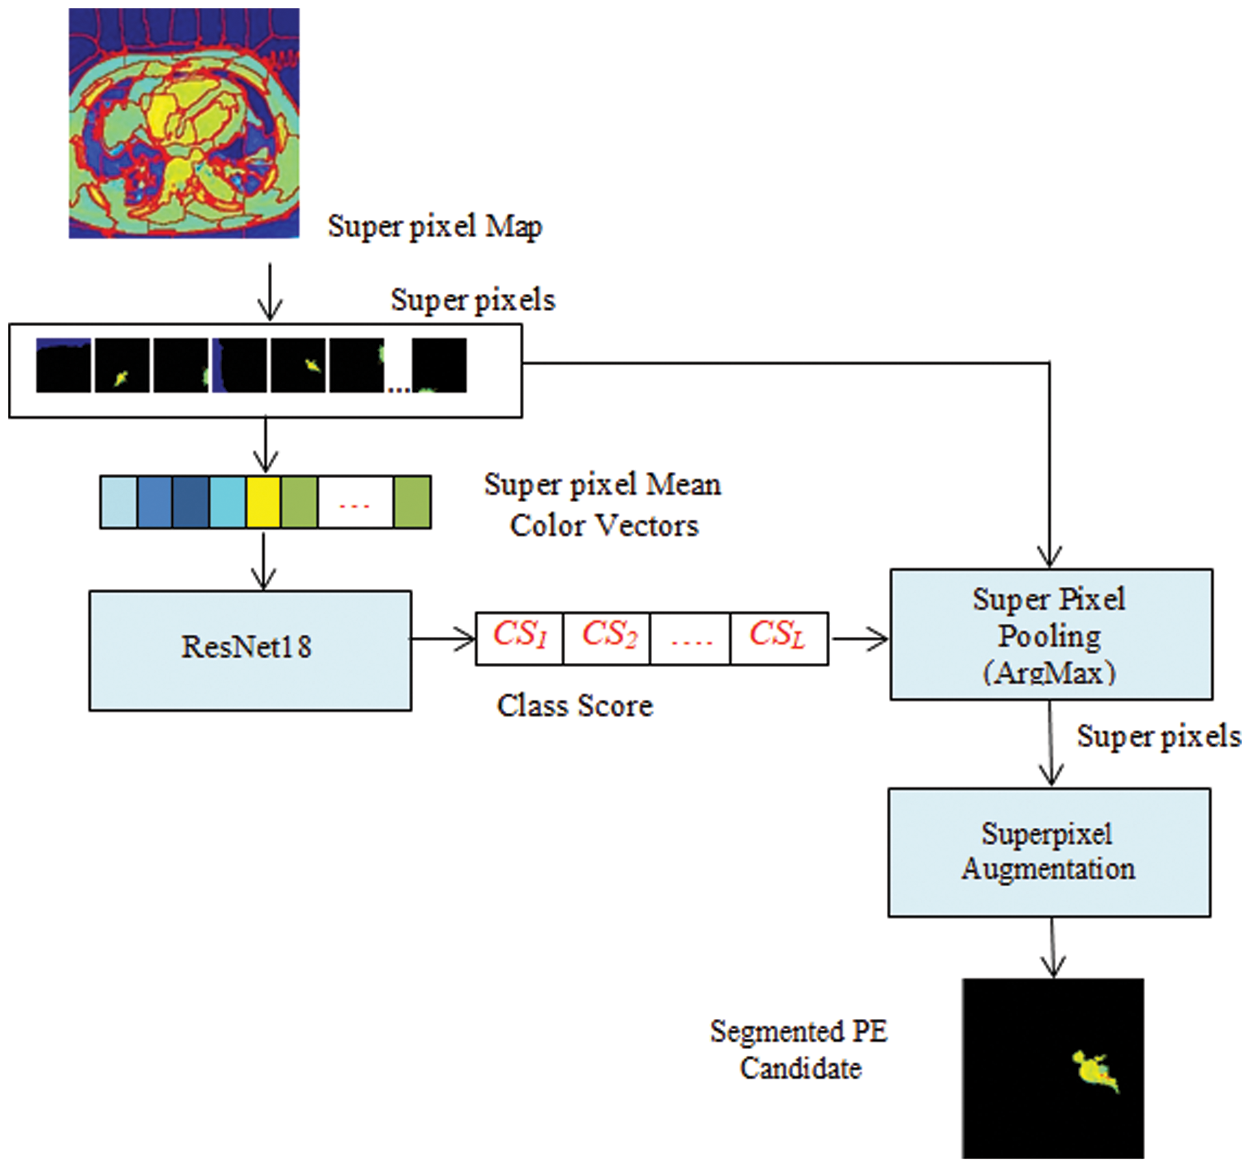
Figure 3: Superpixel CNN architecture
Given a CTPA volume V comprising a set of N slices {Si| iɛ[1 N]}, each slice Siis converted into an RGB image Ii. By GMM superpixel segmentation, each image Iiis divided into a set of L superpixels {SPi| iɛ[1 L]}. The ResNet18 based Superpixel CNN is trained to discriminate each superpixel SPiinto a PE candidate or background based on the mean color of the superpixel. By labeling the superpixels with the mean color superpixel regions, it is understood that these superpixels carry one of the color labels in the set {’Yellow’, ‘Olive’, ‘Teal’, ‘Blue’, ‘Aqua’, ‘Silver’, ‘Navy’} as shown in Fig. 4. It can be seen that the superpixels labeled ‘Silver’, ‘Aqua’ and ‘Teal’ are prospective PE candidates while the others can be eliminated as background. The steps for the extraction of PE candidates from the slices are given in Algorithm 1.
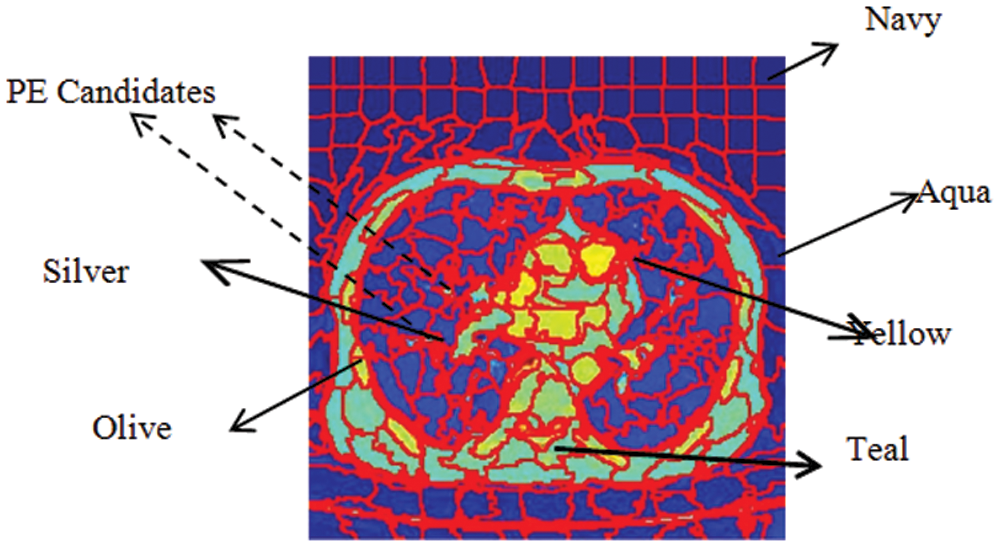
Figure 4: Color labels and PE candidates of superpixels
The superpixel CNN is trained with color-labeled superpixels extracted from the training dataset to discriminate the PE candidates and the background by superpixel pooling which is implemented as a maximization operation.
After color labeling, each superpixel is resized to 224 × 224 × 3 to match the ResNet18 network input size. Corresponding to each color label, the target class of each superpixel is assigned to be PE or background. In the ResNet18, a binary classifier is trained with these superpixels to classify them into the target classes and it assigns a class score CSito each superpixel SPi. The superpixel pooling layer performs a maximization operation on the class scores as in Eq. (10) to select the superpixels ascribing to the PE regions for each slice Sjto separate the PE candidate Segj.
After training, this network is tested to segment PE candidates of arbitrary CTPA slices. The training and the testing accuracies of the superpixel subnet are shown in the plots in Fig. 5 which depict the learning ability of the subnet.
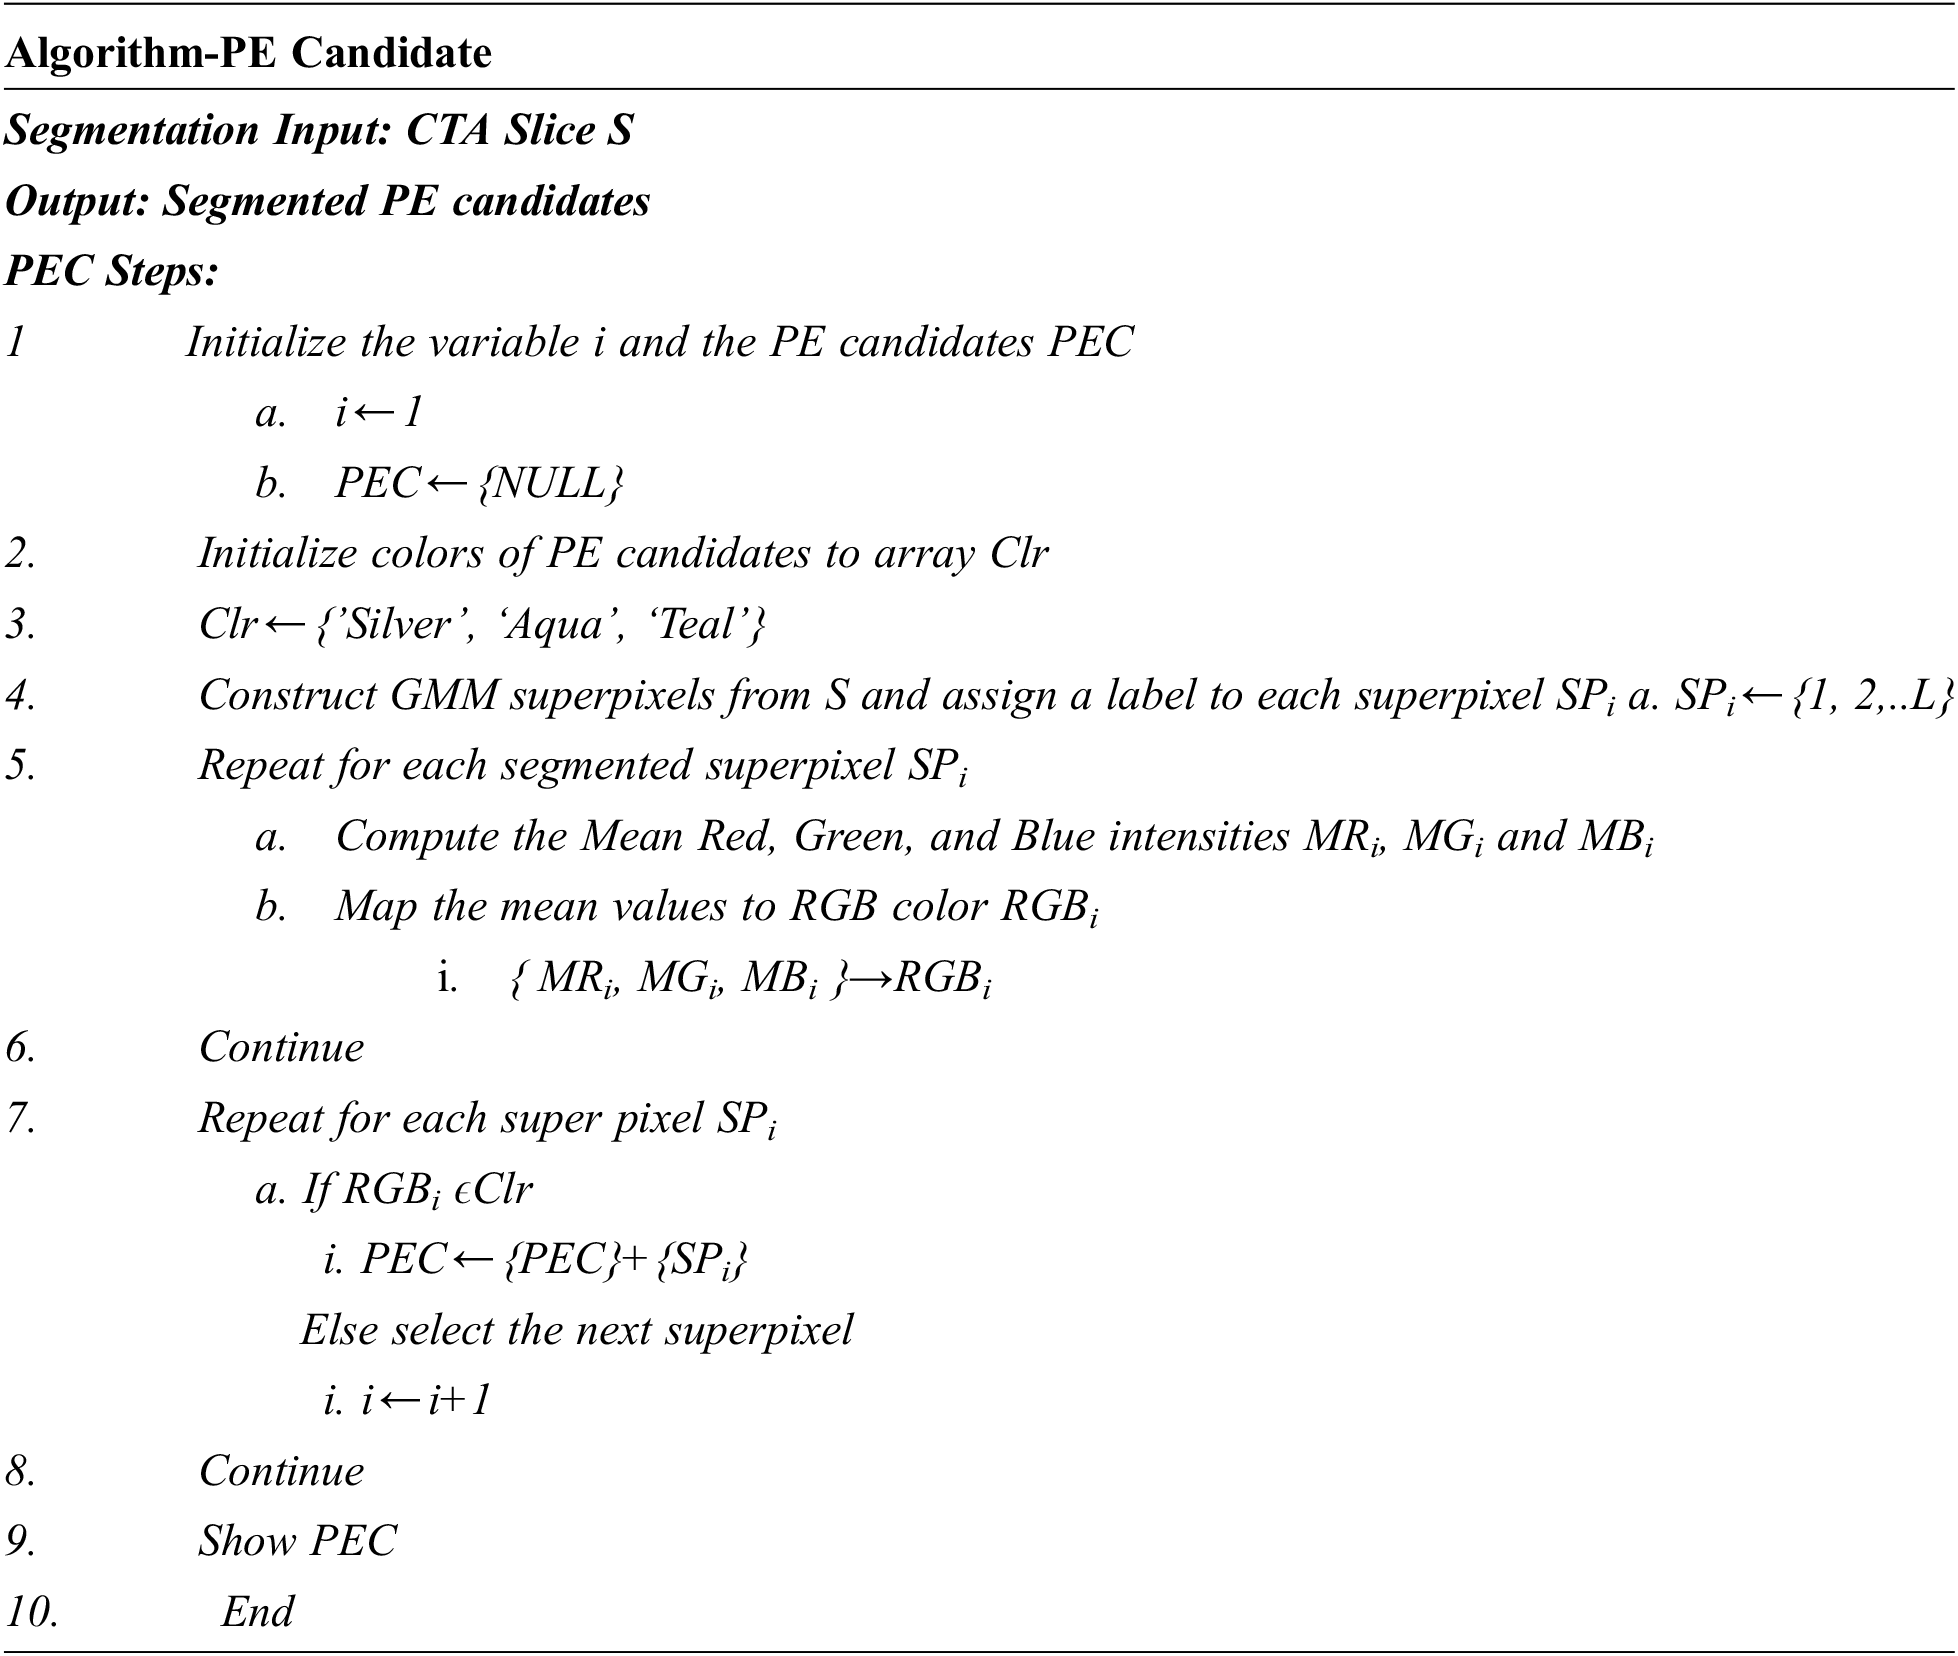
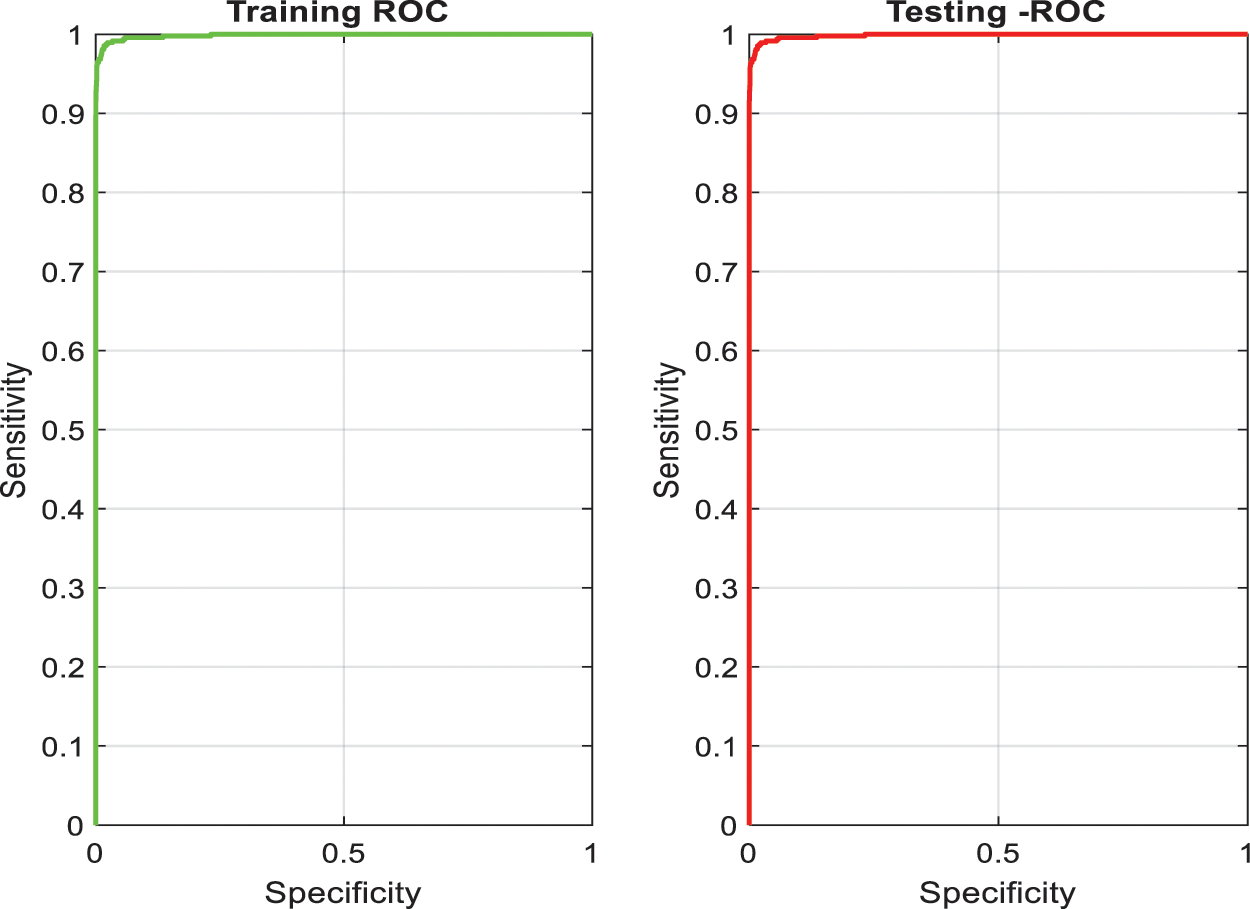
Figure 5: Training and testing accuracy of superpixel subnet
The UNet CNN features an asymmetric design with contracting and increasing directions at the left and right, respectively. The three stages UNet schematic employed in PE segmentation is exposed in Fig. 6. This network is applied with 46 layers with encoder each stage comprising two sequences of the ReLU layers and 3 × 3 convolutional followed via 2 × 2 Maxpooling layer. And also, the decoder contains a deconvolution layer, two sets of 3 × 3 convolutional and ReLU layers in each stage. Further, this network also contains two dropout layers to prevent the network from overfitting.
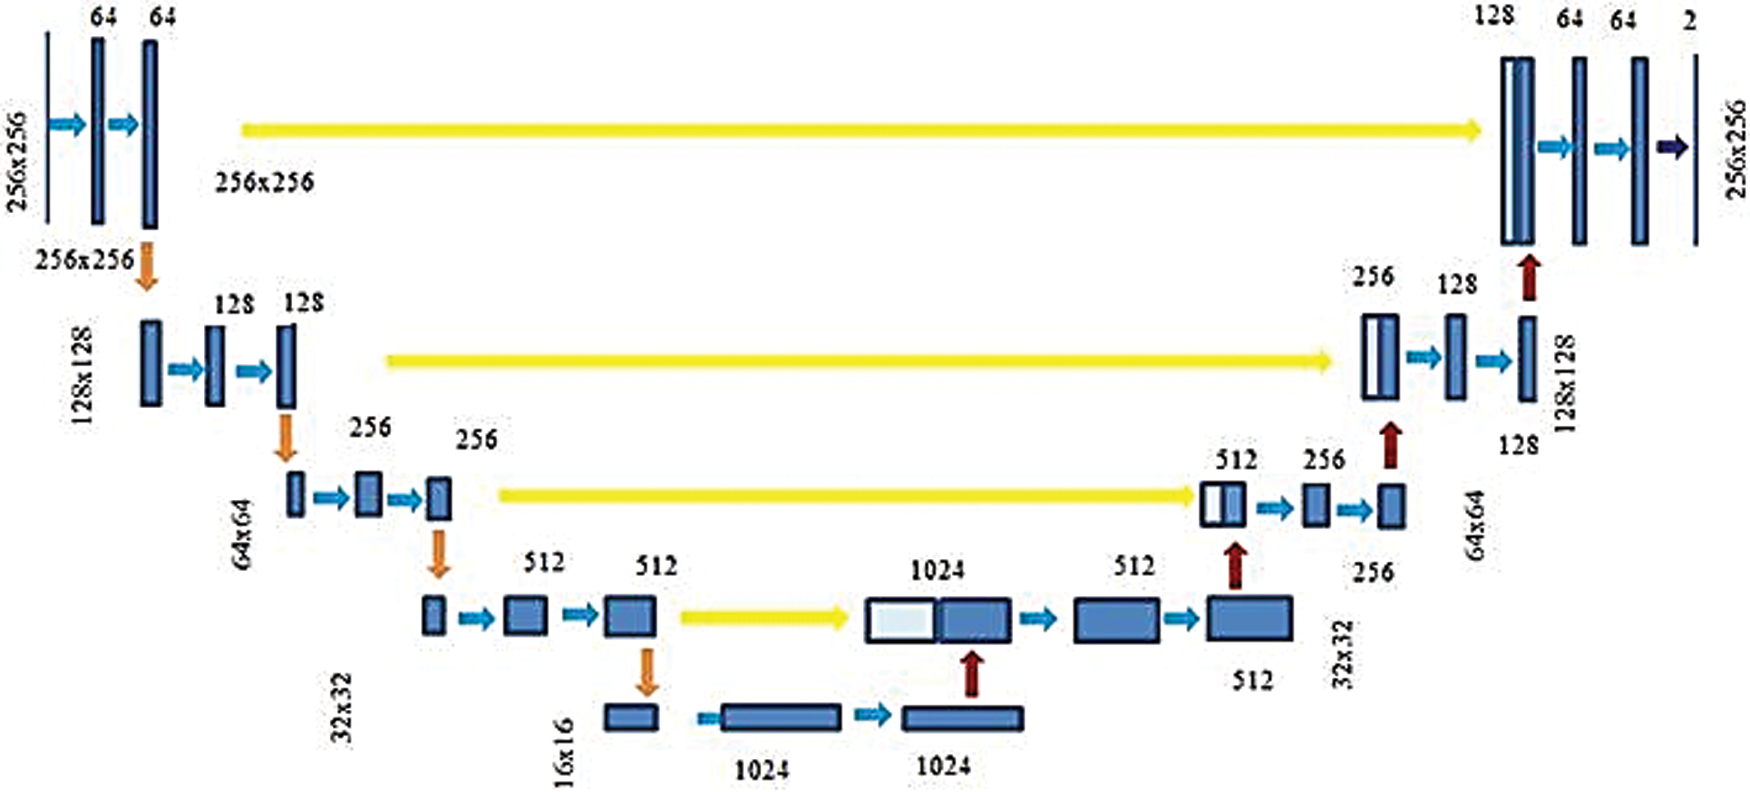
Figure 6: Three-stage U-Net architecture
Finally, a convolutional layer in the expansion step is tracked via a pixel classification layer and softmax layer. The normalized exponential softmax function used in this layer is a multiclass generalization of the conventional sigmoid function. A pixel-wise softmax function combined by Binary Cross-Entropy (BCE) loss function is implemented on the feature map obtained from the last convolutional layer. The softmax layer determines the probability that each pixel belongs to a specific class. A softmax layer, pixel classification layer allocates a category label to every pixel in the input image. while minimizing a BCE loss function.
An L2 regularisation term to the BCE loss function in addition to including two dropout layers in the UNet. The BCE loss function is provided in Eq. (11). For a classification model that encodes the given input into C mutually exclusive classes.
where I is the total number of inputs, Tijis the indicator that the sample I belongs to a class, and Yijis the probability by which i belongs to j, as evaluated by the softmax function. For a binary classification model proposed in this research, which segments PE and background pixels, given image I of dimension M × N, with P=M × N pixels, the BCE loss function can be expressed as in Eq. (12).
where Tijdenotes the pixel target class i, i.e., PE or background and Yij is the probability with which i belongs to PE or background as evaluated via a softmax function. The PE segmentation problem can be conceptualized as a classification problem by minimizing the cross-entropy loss. A large margin regularization approach for cross-entropy loss optimization introduced in [30] determines better optimization and generalization compared to new optimization functions. Regularization is proposed in the deep learning method via adding the regularization term to the loss functions to suppress overfitting and to enable the models to generalize to new input. In the proposed PE segmentation problem, the L2 normalization is employed by adding a regularization term to the loss function as in Eq. (13).
where W is the weight of the model and is the regularization parameter.
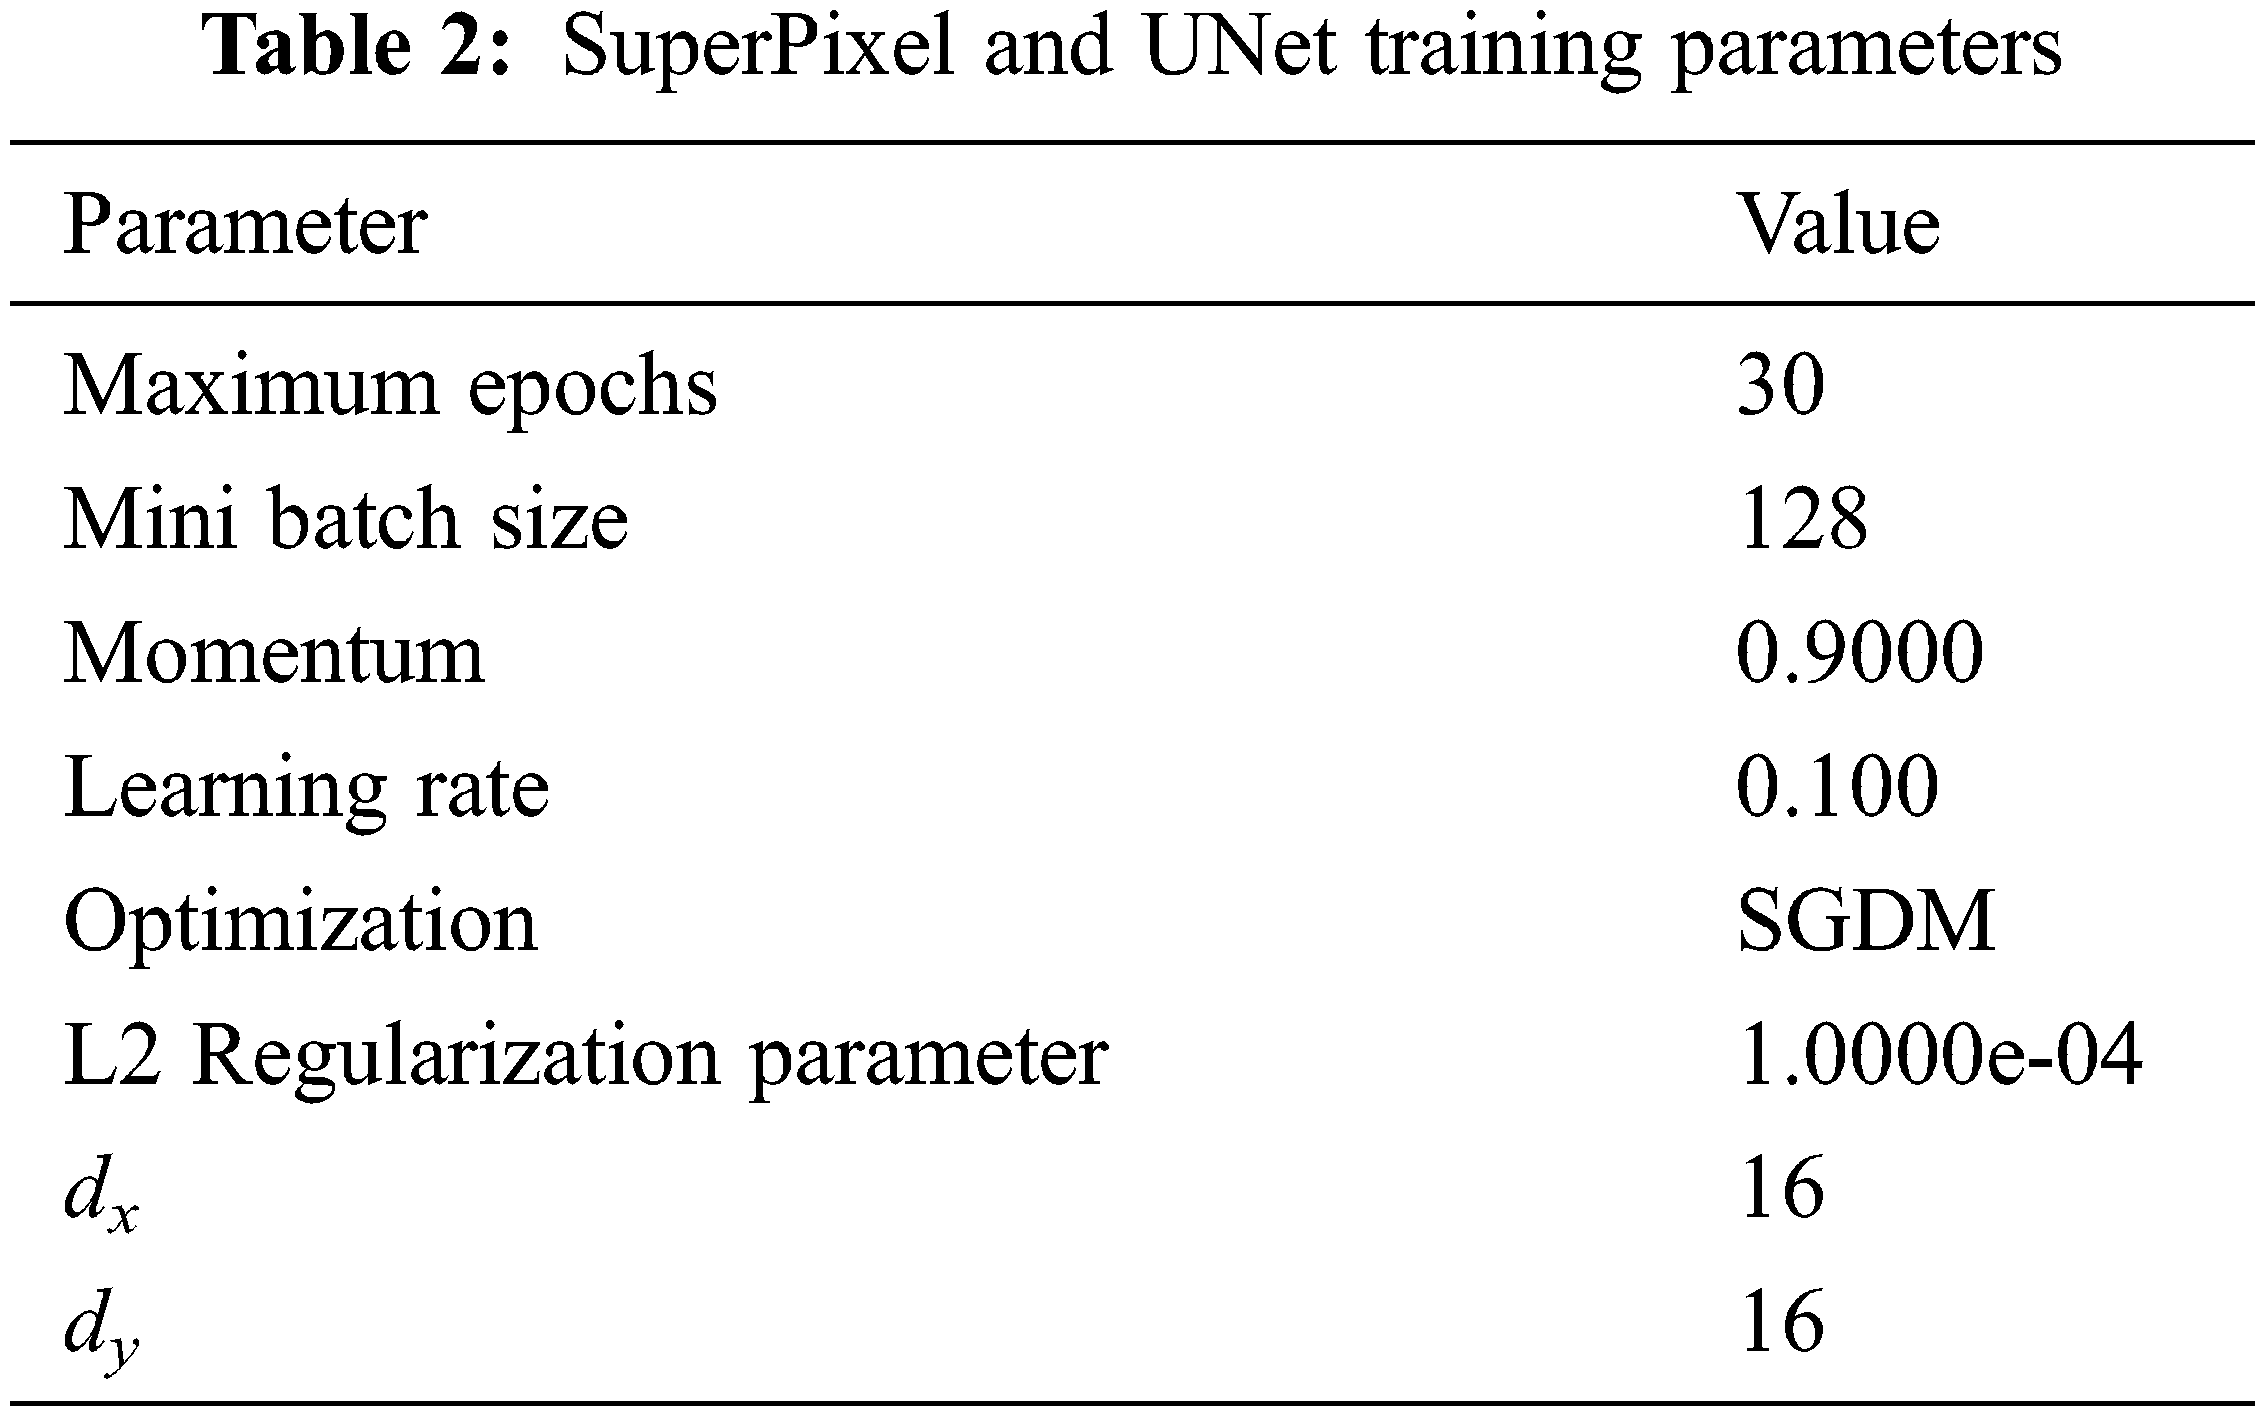
It is seen that the cross-entropy loss is influenced via the model weight then regularization is controlled via λ. When the value of λ is small, the model will tend to overfit and it will tend to underfit for larger values. The Stochastic Gradient Descent with Momentum (SGDM) is maximized by assuming 0.9 for the momentum. The parameters for training the superpixel CNN and the UNet Networks are given in Tab. 2.
The performance of the segmentation framework has been evaluated on the FUMPE and the CAD-PE datasets. The test images are overlaid with ground truth labels, PE candidates, segmented PEs, and the overlays of segmented labels and the test images are shown in Fig. 7. It is noted that the PEs are precisely segmented from the test images. It is also seen that the false positives are eliminated attributed to the superpixel CNN. The proposed model performance is calculated with quantitative metrics for the two datasets as in Tab. 3.
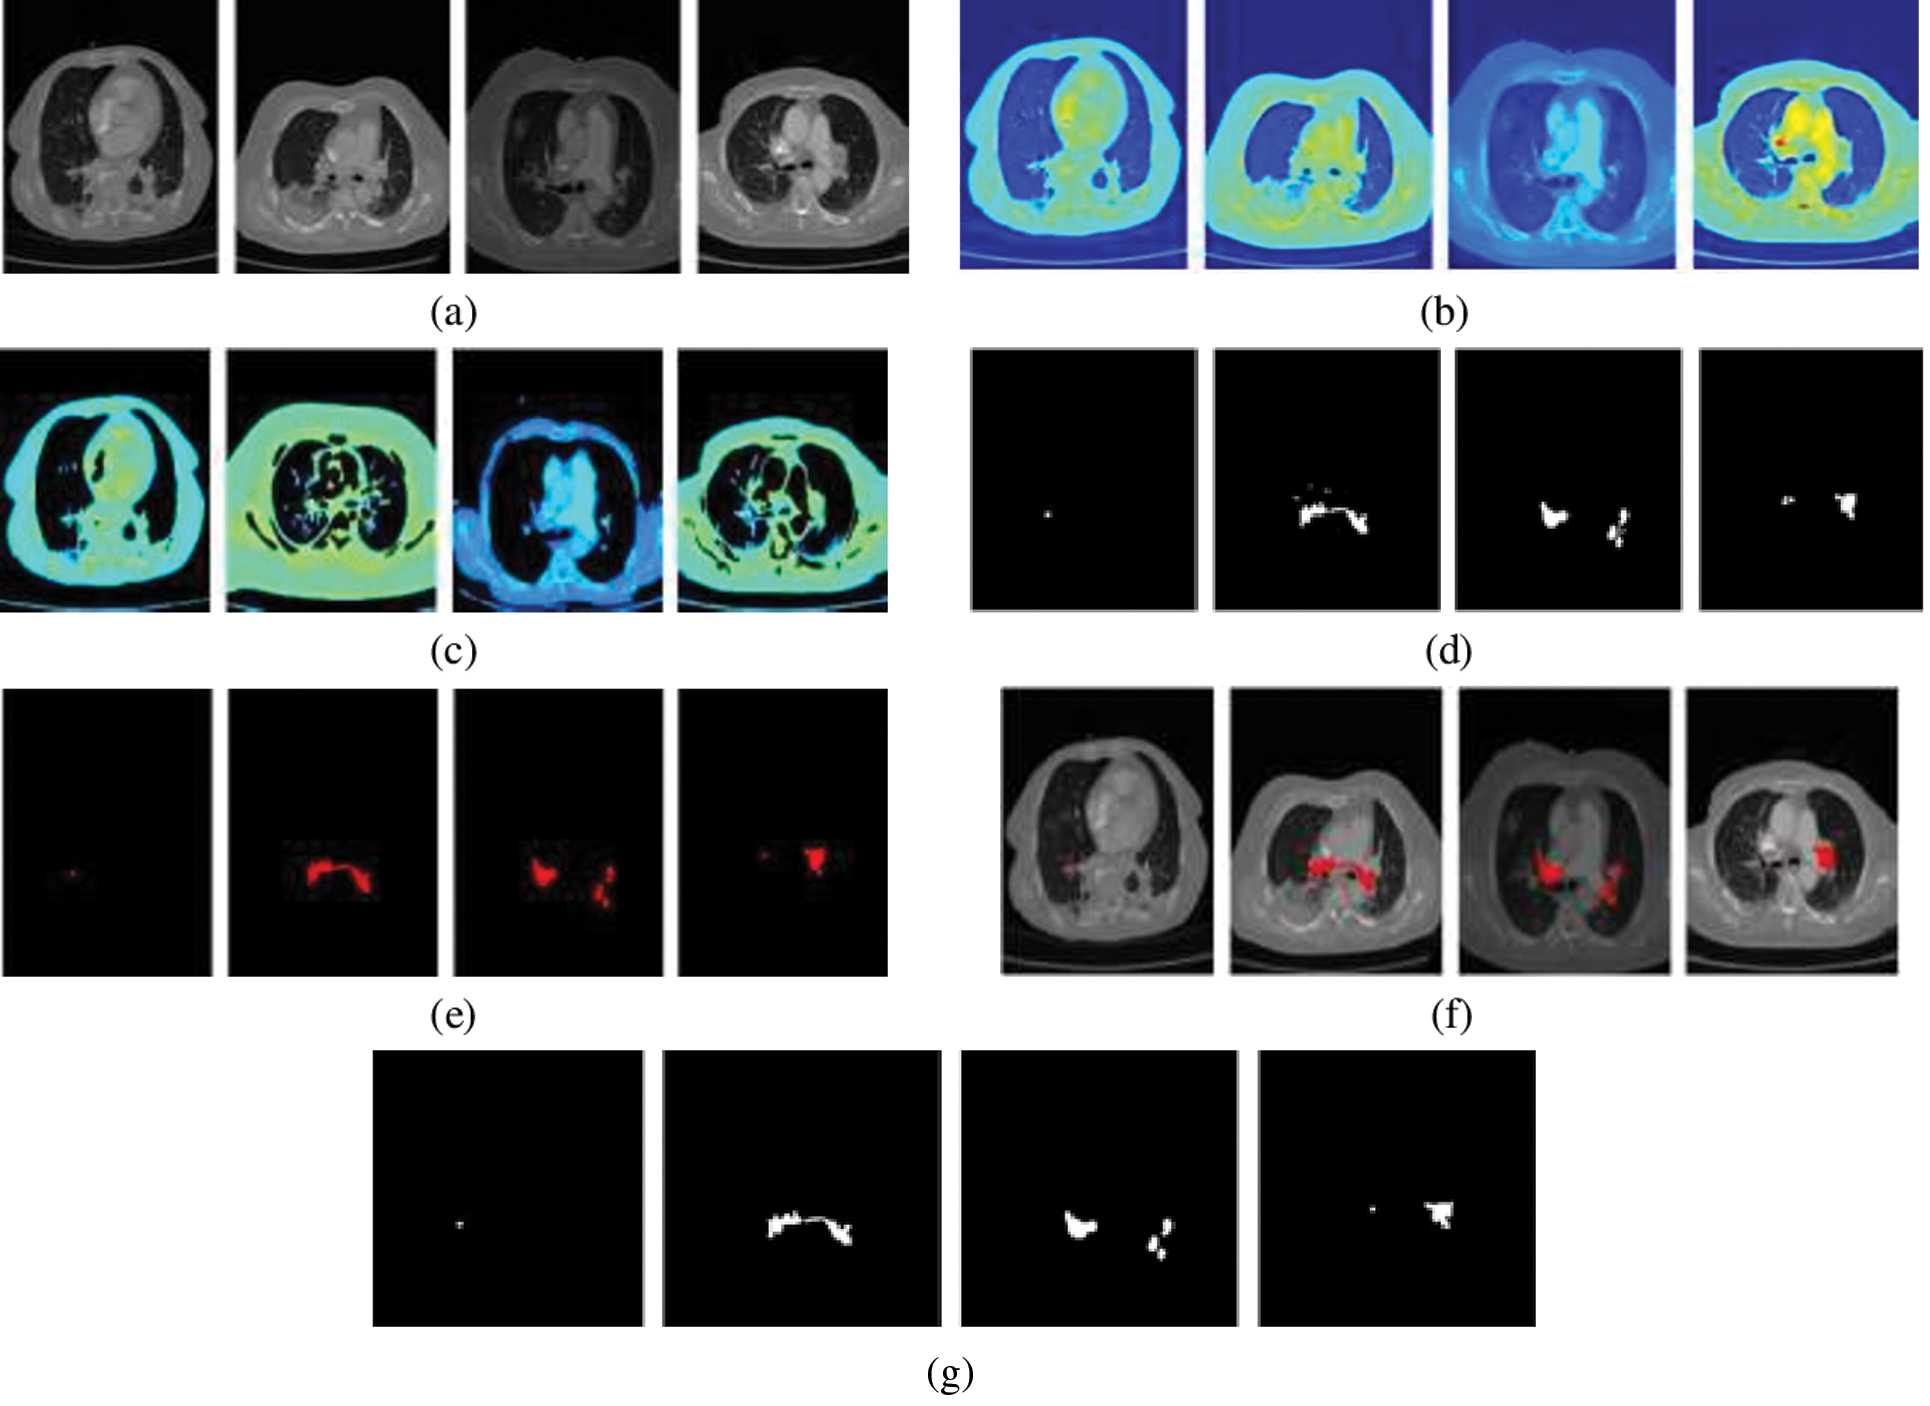
Figure 7: PE segmentation results (a) CTPA slice (b) CTPA slice in RGB (c) Superpixel segmented CTPA (d) PE candidate (e) segmented PE (f)segmented PE on CTPA slice (f) ground truth
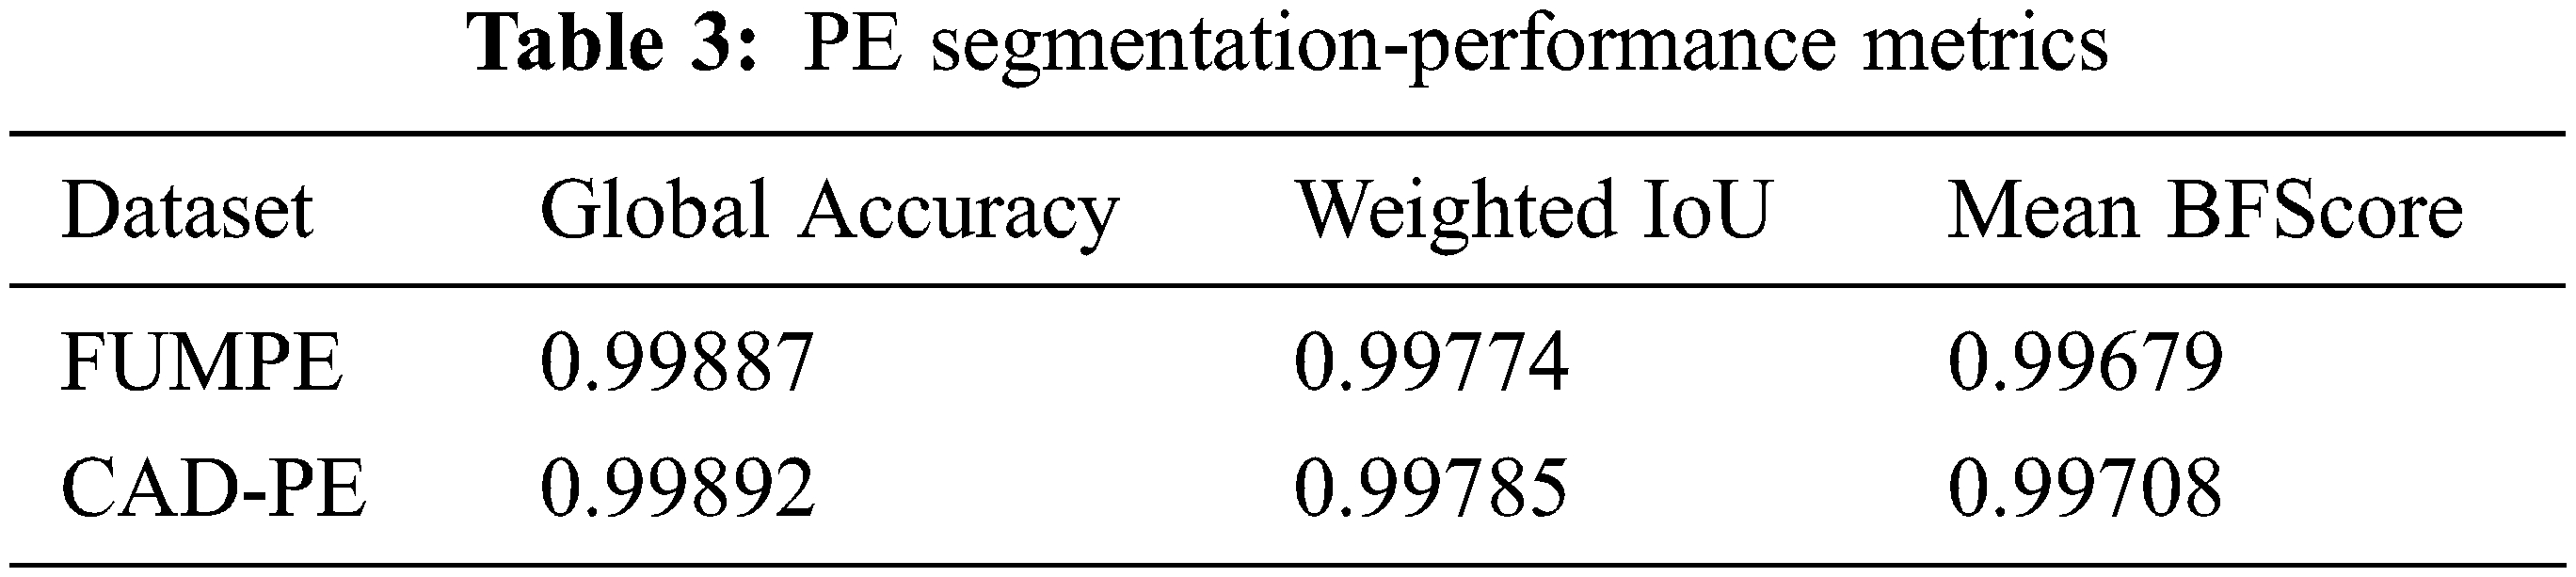
It can be identified that the best performance metrics are attained for the CAD-PE dataset. Compared to the conventional performance metrics, sensitivity analysis is highly desirable in PE detection as it evaluates the ability of the system to correctly identify the affected subjects. Hence, the PE detection systems are evaluated and compared to sensitivity rather than any other metrics. For a fair evaluation, the proposed sensitivity model is compared with that of the state-of-the-art methods at localization errors ɛ assuming 0, 2, and 5 mm, at two false positives per scan with the CAD-PE dataset.
A comparison of the per embolus sensitivity and false positives is presented with state-of-the-art approaches in Tab. 4.
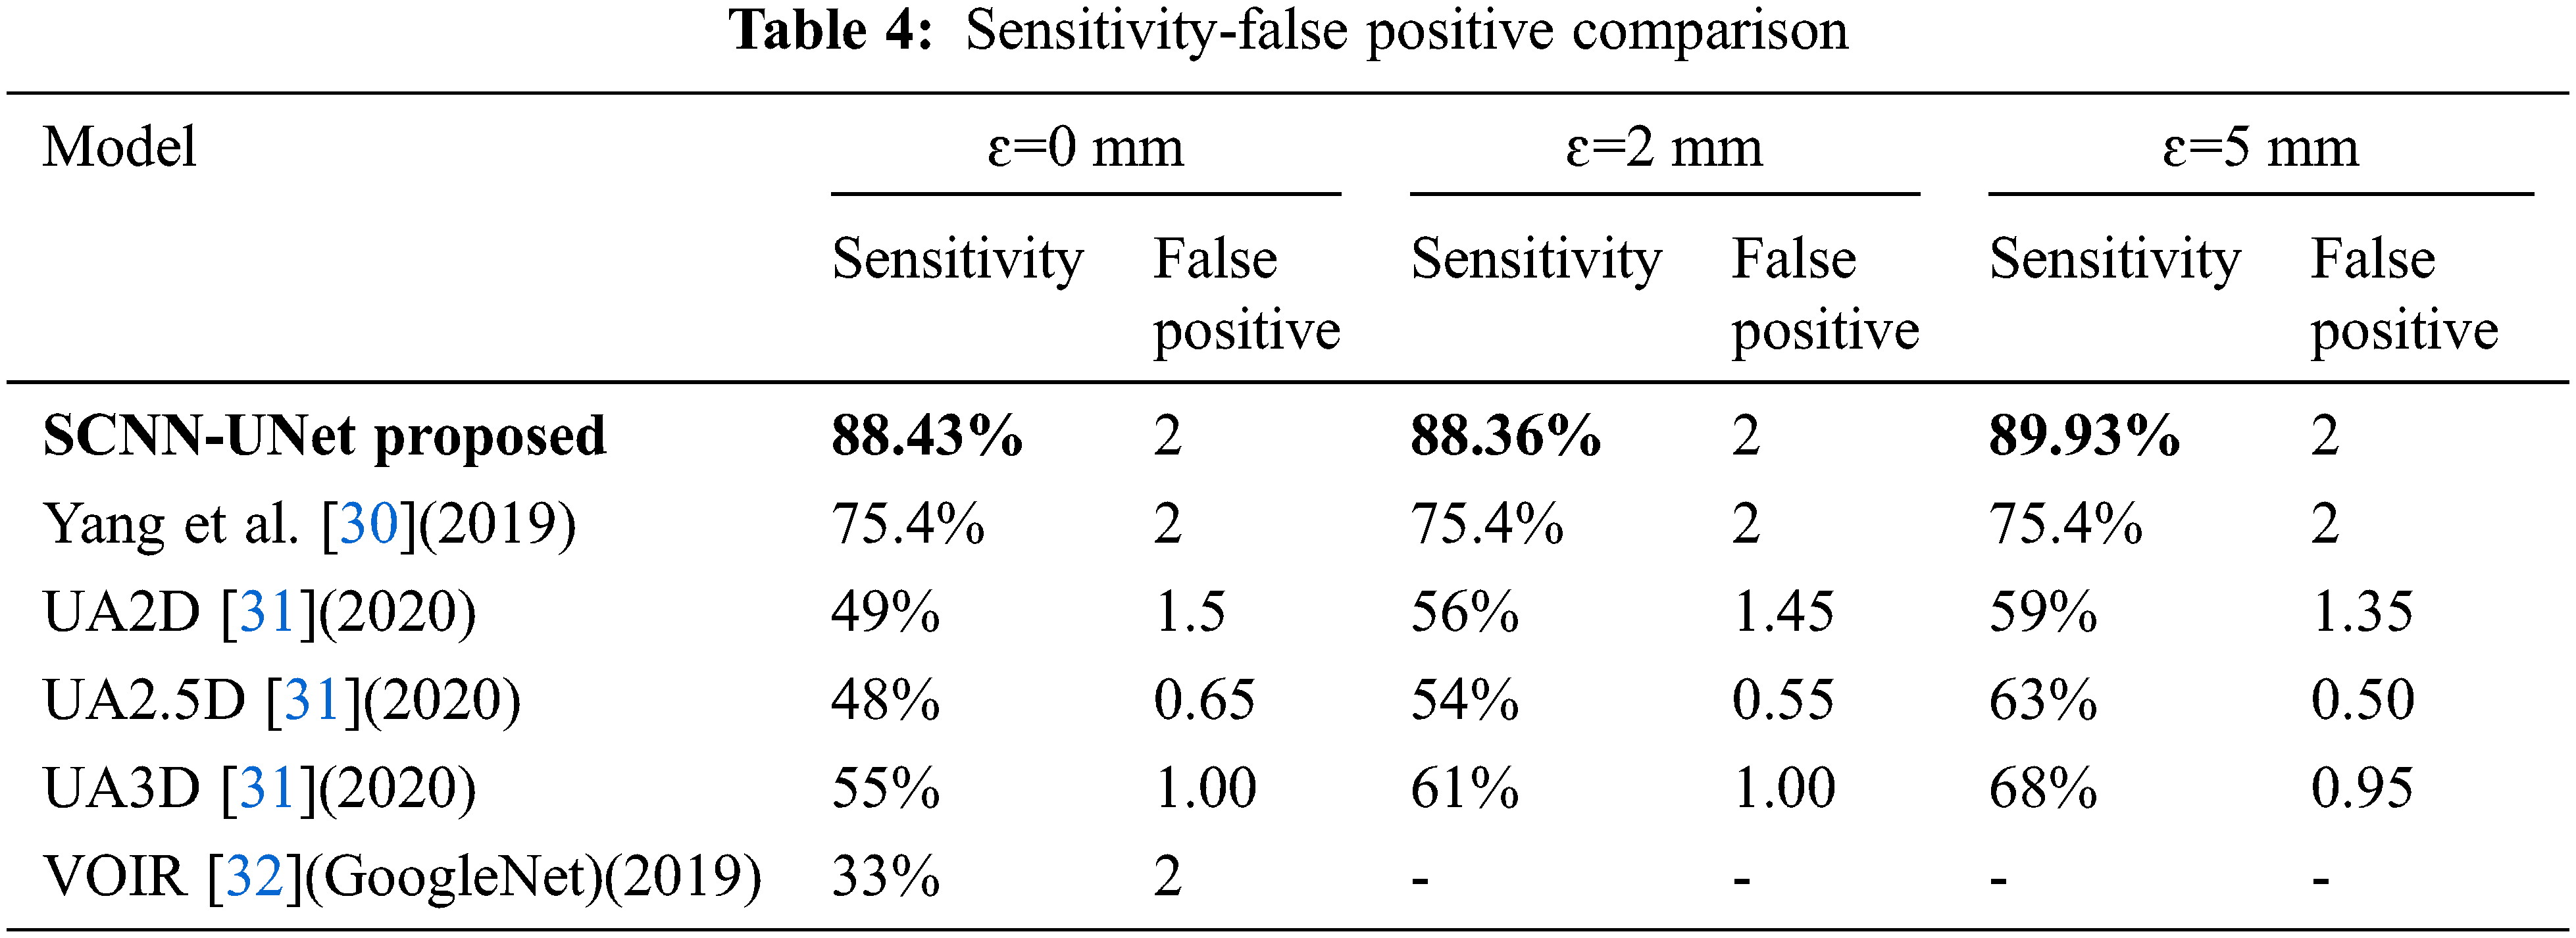
It has been already established in [30] that the 3D CNN-based framework is superior to the best models proposed in the CAD-PE challenge. Hence for comparison, the model proposed in [31], three models of [32], and the GoogleNet trained on the CTPA images following VOIR have been considered. However, the models in [33] are evaluated only under ɛ=0 mm and out of which, the deepest GoogleNet is chosen. High sensitivity and low false positives in the range from 1 to 5 are highly desirable in PE detection systems. Hence, the model sensitivity is evaluated at two false positives.
Sensitivity is a significant metric in the PE detection models. Excluding the proposed model, high sensitivity is observed for the 3D model when compared to the 2D and 2.5 models. However, an increase in false positives is also seen in the 3D model. The sensitivity is constant for two false positives under the three localization errors [34]. The quantitative outcomes exposed that the proposed design comprising 2D convolution networks is superior to the state-of-the-art methods under all the localization errors with high sensitivity at ɛ=5 mm.
Though the construction of 3D network classifiers processing 3D CTPA volumes is comparatively less complex, the robustness of these models depends on complex algorithms for semantic segmentation of PE candidates across multiple slices and discrimination of PEs from non-PEs. Though image features aggregated from multiple slices are used in PE detection in 3D CNNs, detection accuracy is independently improved considering the 2D slices, as the PE is observed in multiple slices. Further, processing 3D slice volumes directly will considerably reduce the training speed of the network.
In addition to sensitivity, the Area Under Curve (AUC), accuracy, and F1 scores are evaluated for the proposed system. Though the proposed model demonstrates high-performance metrics for the FUMPE and CAD-PE datasets, comprehensive results are not available for these datasets with representative works. It is seen from Tab. 5 that the best AUC, accuracy, and F1 values achieved by the SCNN-UNet model are very high compared to the state-of-the-art models.
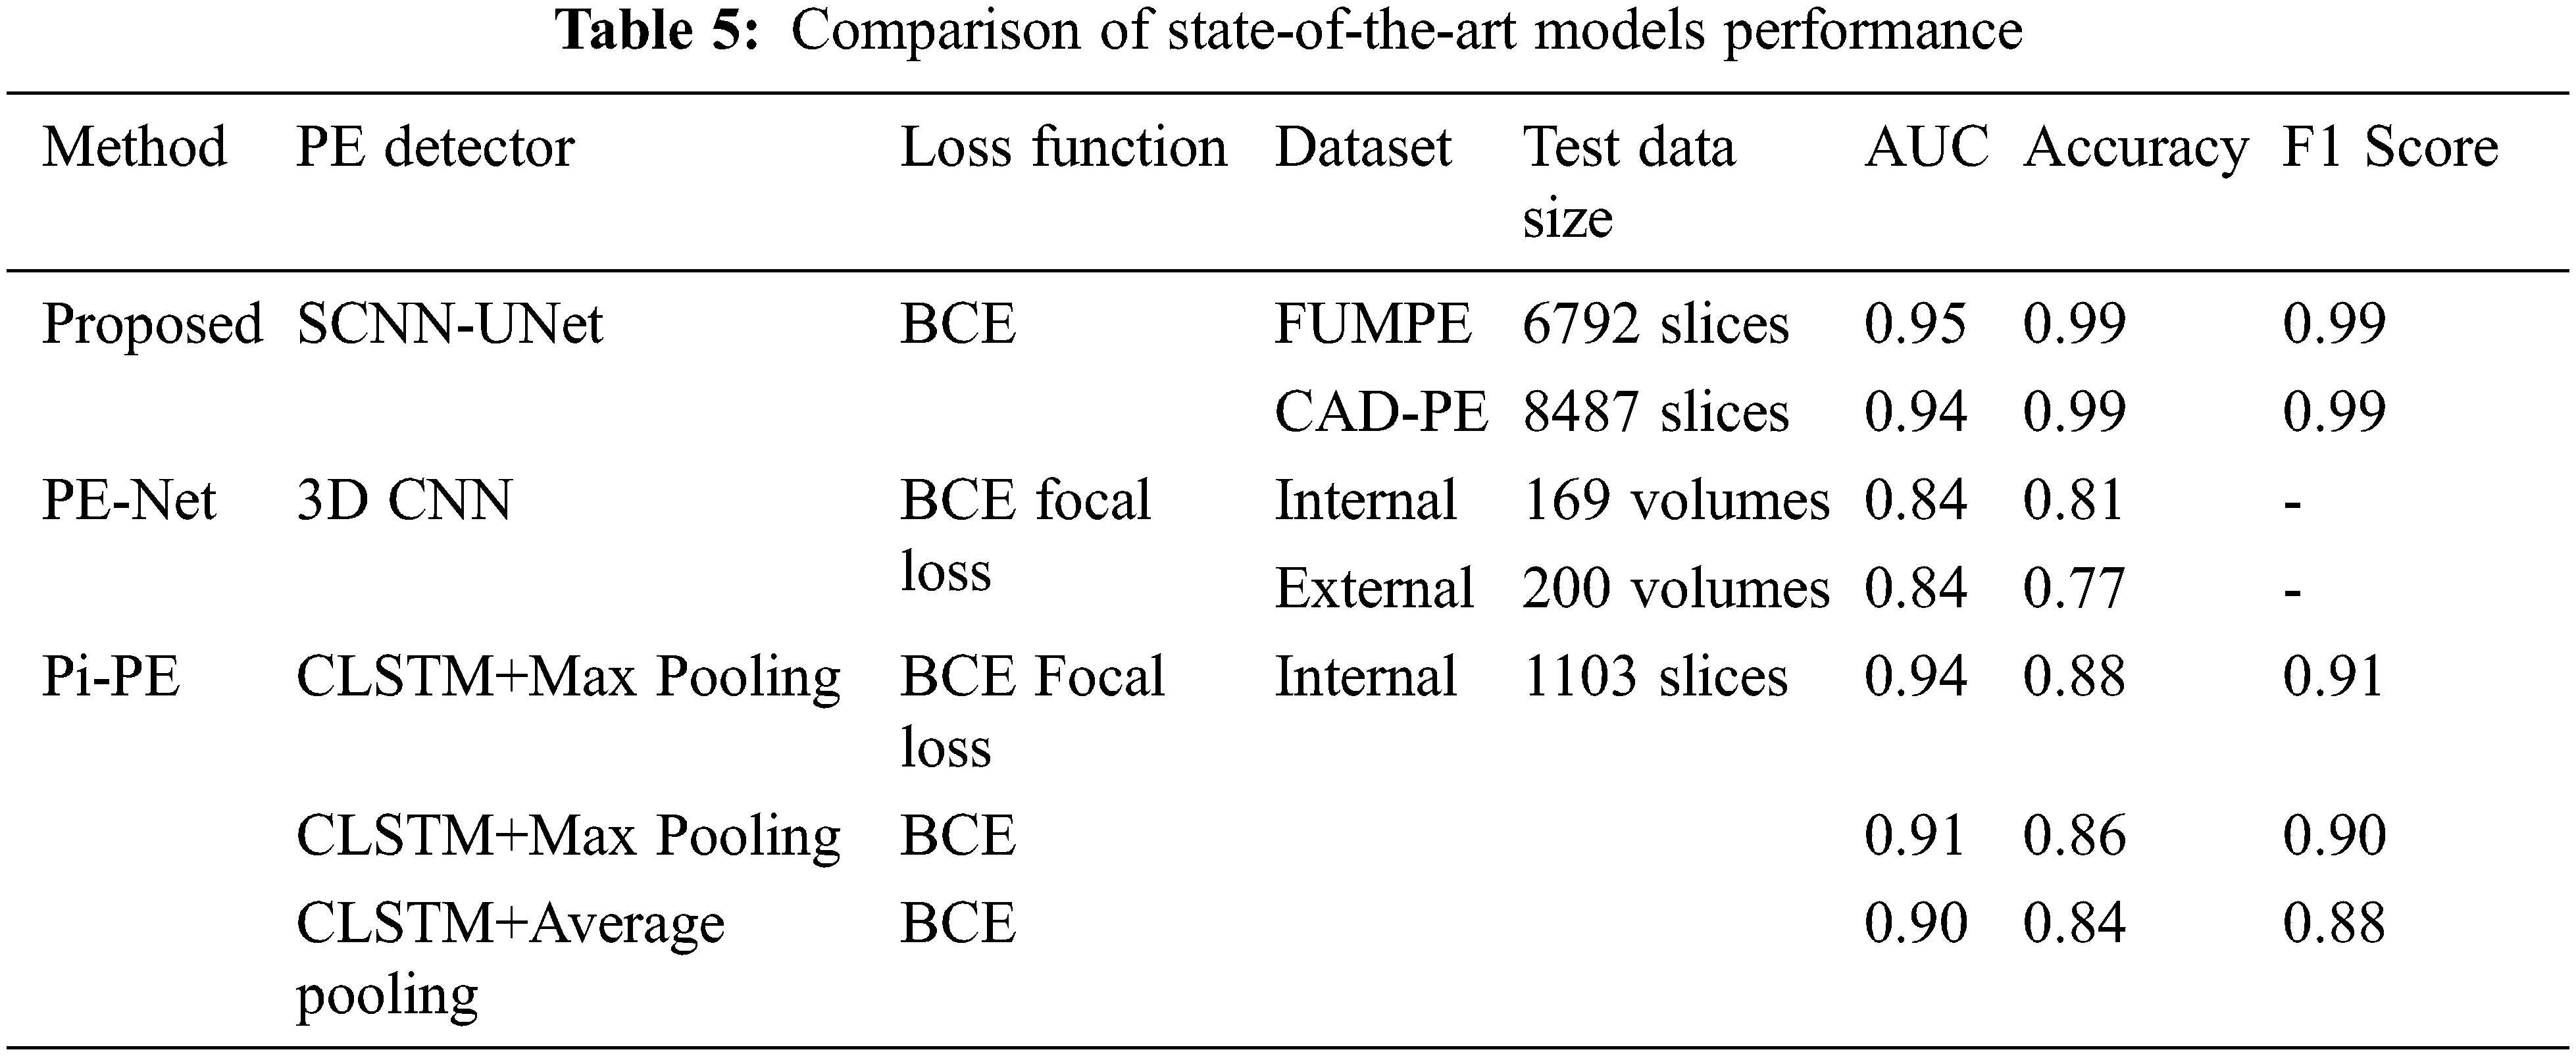
It is seen that the PE detection models differ from the underlying learning models and the loss functions employed in fine-tuning the models by updating the model weights to reduce the segmentation error in subsequent epochs. It has been established in [33] that the PE-Net which is a 77-layer 3D CNN is comparatively better than the ResNet-based 3D CNN models.
The Pi-PE model demonstrates improved performance than PE-Net as it is based on MIL which processes each CTPA slice independently. It is observed that the Pi-PE model achieves the best performances for the CLSTM with a max-pooling approach, fine-tuned with the BCE focal loss function.
Similar to the Pi-PE model, the proposed SCNN-UNet model is also a two-stage model trained on the CTPA slices, nevertheless demonstrating superior performance. Though the Pi-PE model also employs the 2D UNet similar to the proposed model, there are two distinctions between them. While the UNet is employed for PE candidate detection in the Pi-PE model, it is carried out with the SCNN in the proposed model, considerably reducing the computational overheads. Similarly, PE detection is performed by feature extraction and aggregation in the Pi-PE model while the proposed model employs L2 regularized UNet for semantic segmentation of the PEs from the PE candidates. Further, the FBCE loss function used in the Pi-PE model reduces the weights of the network for the correct classifications and increases the weights for misclassifications. The BCE loss function employed in the proposed SCNN-UNet model penalizes the misclassifications rather than rewarding the correct classifications which attribute to the superior results achieved via a proposed model.
The proposed framework accuracy is ascribed to the segmentation of the PE candidate regions with very few false positives with the superpixel CNN. As the PE targets are relatively very small to the size of the image slices, a sliding window is employed to select 24 image slices to relatively optimize the model. In the proposed model, the RoI is extracted from the image slices rather than considering an entire image volume. This operation localizes the PE candidates and trains the model with significant features which subsequently improves the performance parameters of the network.
As the FUMPE and CAD-PE datasets consist of both PE regions of arbitrary shape, size, and non-PE regions, it is ensured that the training and the testing datasets are considerably large with distinct samples. The cross-entropy loss function of the network neutralizes the effect of imbalances in training and testing datasets. Further, it is L2 regularized by a regularization factor 1.0000e-04, enhancing the UNet PE detection model to generalize. This is very well evidenced by the high sensitivities achieved with the CAD-PE dataset. Hence, the proposed model can be extended to other PE datasets by transfer learning.
Generally, PEs manifests filling defects within pulmonary CTPA images. As small PEs on the axial, sagittal, and coronal planes are not visible, the models mentioned in Tab. 4 perform vessel alignment along the longitudinal axis of the vessels to detect PE candidates. In the proposed model, this operation is simplified with superpixel CNN as it performs color-based segmentation. It is clear that the GMM superpixels precisely segment different regions of the CTPA slices, with which even the very small PE candidates regions are extracted. Hence, the proposed superpixel CNN is a potential model for the segmentation of organs, tissues, and markers in imaging examinations of various pathologies.
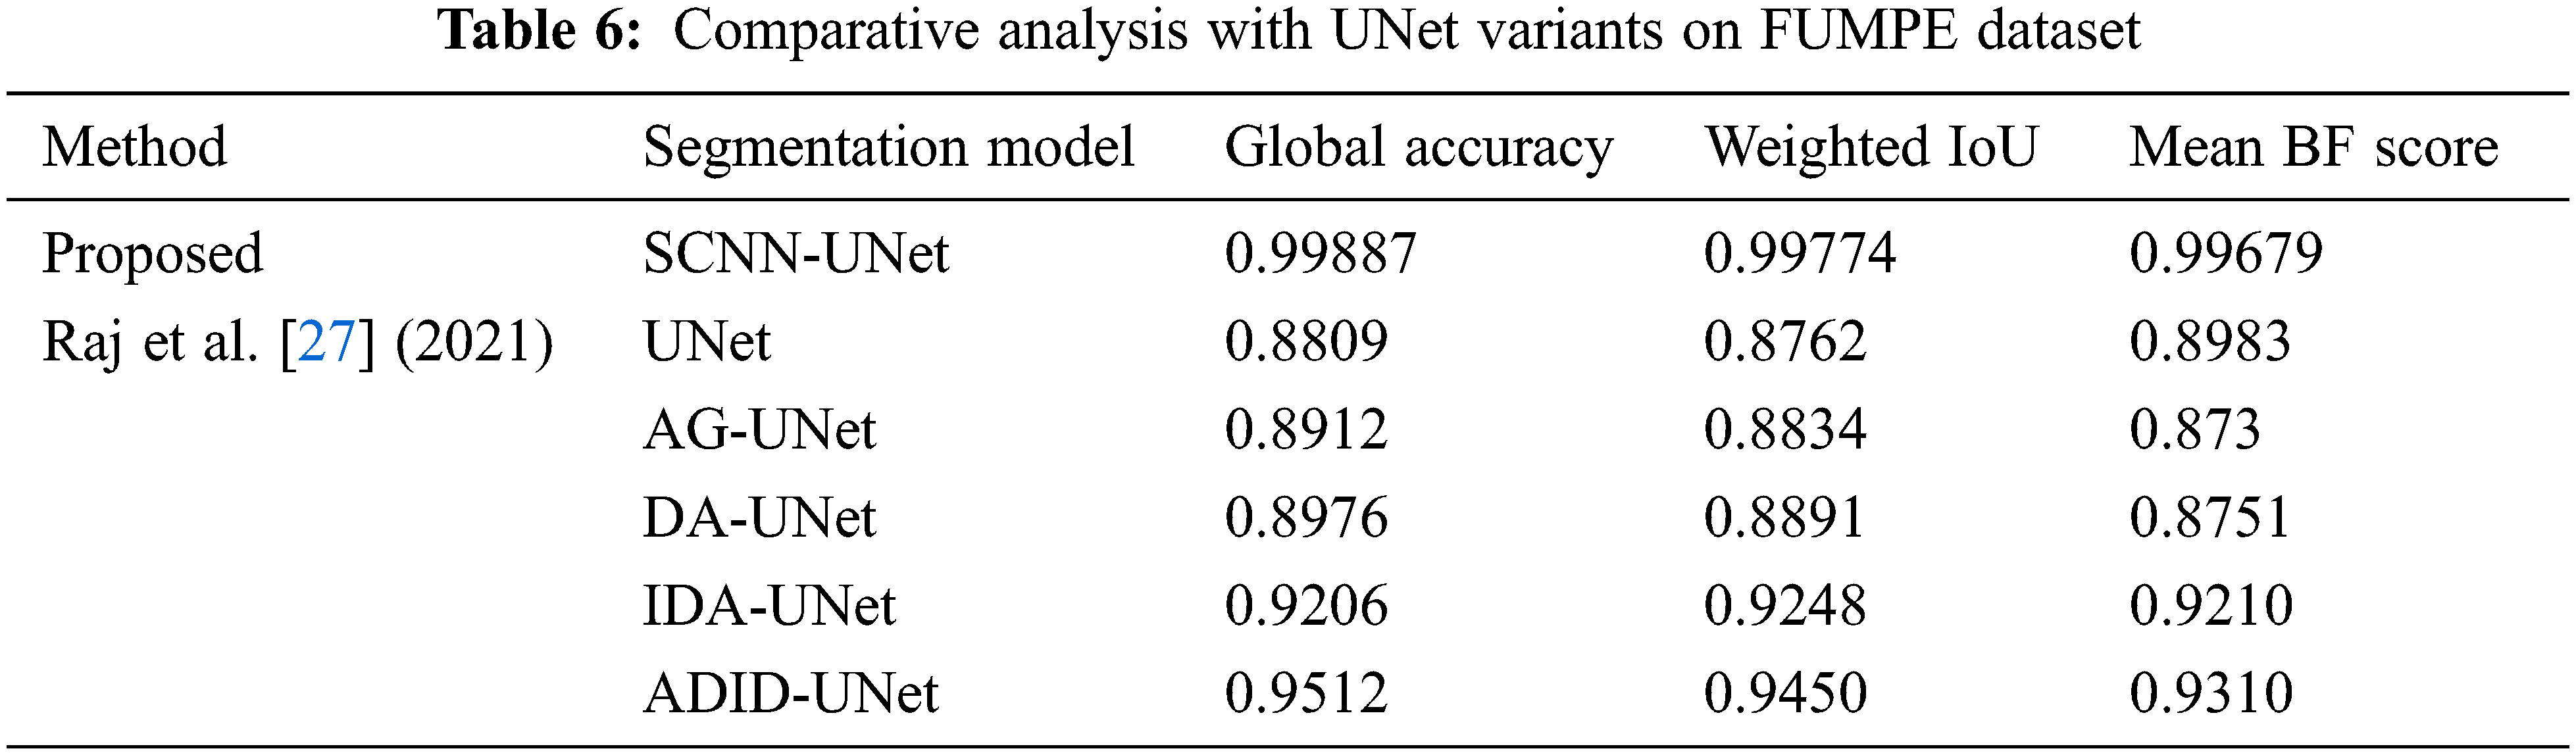
We present a comparative analysis of the segmentation metrics of the proposed framework and UNet variants for the FUMPE dataset in Tab. 6. The UNet variants are complex compared to the regularized UNet employed in this research. Performance analysis also reveals that best segmentation metrics are achieved by this UNet compared to the UNet variants despite their design considerations for better segmentations. This evaluation shows that segmentation of prospective PE candidates can increase the accuracy of segmentation of PEs with a conventional UNet.
Further, ablation studies are performed on the proposed SCNN-UNet model changing the values of dxand dy. The performance metrics in Tab. 3 are presented for an arbitrary value 16 assigned to these parameters. The parameters are assigned values smaller and larger than 16 to investigate the performance of the model under smaller and larger superpixels generated from the image slices. The performance metrics of the model are shown in Tab. 7 for two different values of dxand dy; the same values are assigned to dxand dyas the dimensions M and N are the same for a CTPA slice.
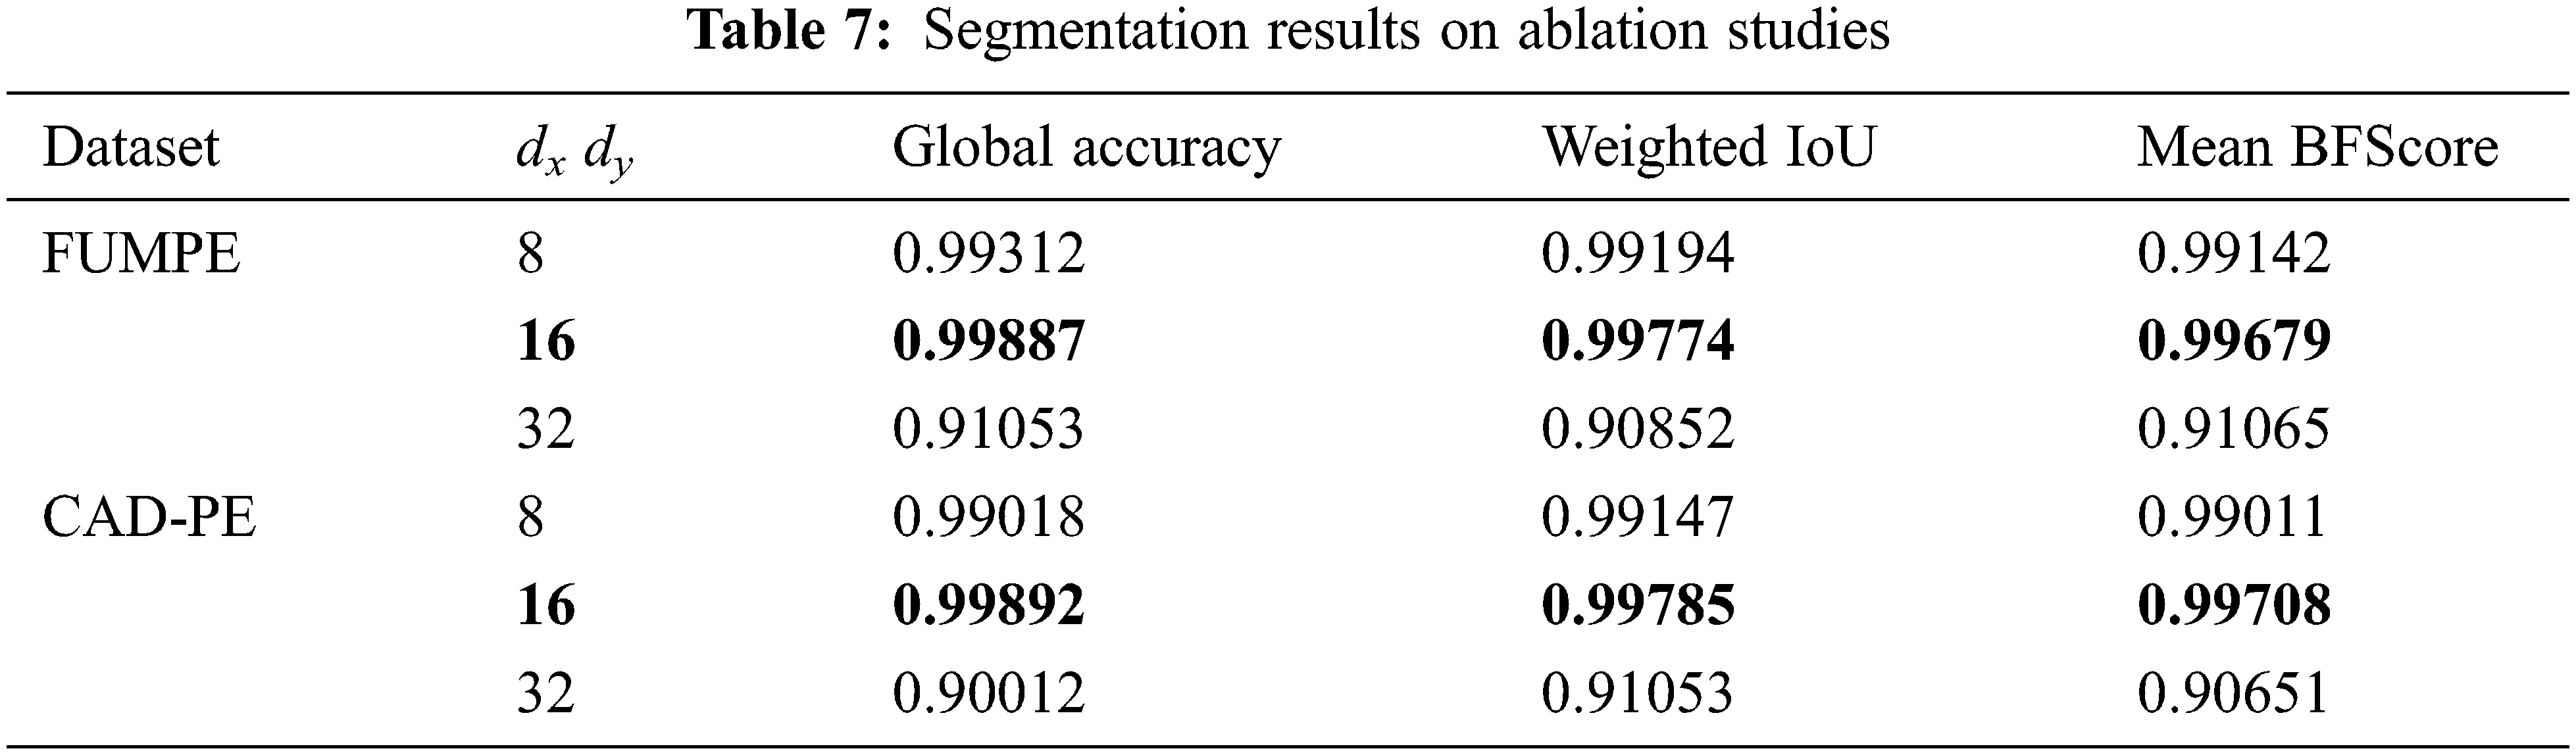
It is observed that when dxand dy are assigned to 32, resulting in a larger but smaller number of superpixels, the performance of the model degrades considerably. However, subtle degradations are observed when these parameters are assigned to 8, resulting in a large number of smaller superpixels. These results show that the size of the superpixels influences the segmentation accuracy. However, ideal values of the dxand dy parameters must be empirically evaluated. Despite the demonstrated potential of the proposed model, it suffers from two major limitations. The first limitation is concerned with the lack of empirical results on testing PE segmentation models with the FUMPE and CAD-PE data sets. The second limitation is the lack of benchmarks for PE segmentation and detection. These drawbacks lead to difficulties in the interpretation of results and evaluating the consistencies of the findings among relevant works.
Rising clinical evidence on the association of PE and COVID-19, and a dearth of automated PE detection models call for extensive studies in this context to develop deep learning models for PE and COVID-19 detection. The SCNN-UNet model proposed in this paper is an appropriate solution for PE screening which may subsequently increase the detection rate of COVID-19 cases, for rapid care regimens.
In this paper, a novel two-stage deep learning framework has been proposed for PE detection and segmentation called the SCNN-UNet. It is realized as a cascade of a superpixel CNN and regularized UNet networks. Trained and tested with two standard datasets, the proposed model exhibits high sensitivities of 88.43%, 88.36%, and 89.93% at 0, 2, and 5 mm localization errors for two false positives, respectively and they are superior compared to the state-of-the-art approaches. However, it is seen that the proposed model detects more false positives in the sub-segmental and segmental regions, as it is difficult to discriminate the image artifacts from the fine PEs. Further, vascular enlargements in the segmental or sub-segmental regions of the chest CT have been identified to be prospective signs of COVID-19 and they are attributed to pulmonary parenchymal damage, PE, and hemoptysis induced by PE. This operation can be accomplished by training the SCNN-UNet with location-specific information. With this refinement, the proposed model will be a prospective tool for PE and COVID-19 detections for timely clinical interventions.
Acknowledgement: The author with a deep sense of gratitude would thank the supervisor for his guidance and constant support rendered during this research.
Funding Statement: The authors received no specific funding for this study.
Conflicts of Interest: The authors declare that they have no conflicts of interest to report regarding the present study.
Reference
1. E. Ishaaya and V. F. Tapson, “Advances in the diagnosis of acute pulmonary embolism,” F1000Research, vol. 9, pp. 1–10, 2020. [Google Scholar]
2. Y. Xie, X. Wang, P. Yang and S. Zhang, “COVID-19 complicated by acute pulmonary embolism,” Radiology: Cardiothoracic Imaging, vol. 2, no. 2, pp. e200067, 2020. [Google Scholar]
3. F. Grillet, J. Behr, P. Calame, S. Aubry and E. Delabrousse, “Acute pulmonary embolism associated with COVID-19 pneumonia detected with pulmonary CT angiography,” Radiology, vol. 296, no. 3, pp. E186–E188, 2020. [Google Scholar]
4. S. Agstam, J. Vijay, A. Gupta and S. Bansal, “Acute pulmonary embolism: An unseen villain in COVID-19,” Indian Heart Journal, vol. 72, no. 3, pp. 218, 2020. [Google Scholar]
5. G. B. Danzi, M. Loffi, G. Galeazzi and E. Gherbesi, “Acute pulmonary embolism and COVID-19 pneumonia: A random association?,” European Heart Journal, vol. 41, no. 19, pp. 1858–1858, 2020. [Google Scholar]
6. K. Casey, A. Iteen, R. Nicolini and J. Auten, “COVID-19 pneumonia with hemoptysis: Acute segmental pulmonary emboli associated with novel coronavirus infection,” The American Journal of Emergency Medicine, vol. 38, no. 7, pp. 1544–e1, 2020. [Google Scholar]
7. A. J. Moore, J. Wachsmann, M. R. Chamarthy, L. Panjikaran, Y. Tanabe et al., “Imaging of acute pulmonary embolism: An update,” Cardiovascular Diagnosis and Therapy, vol. 8, no. 3, pp. 225, 2018. [Google Scholar]
8. R. M. Kwee, H. J. Adams and T. C. Kwee, “Pulmonary embolism in patients with COVID-19 and value of D-dimer assessment: A meta-analysis,” European Radiology, vol. 31, pp. 8168–8186, 2021. [Google Scholar]
9. A. García-Ortega, G. Oscullo, P. Calvillo, R. López-Reyes, R. Méndez et al., “Incidence, risk factors, and thrombotic load of pulmonary embolism in patients hospitalized for COVID-19 infection,” Journal of Infection, vol. 82, no. 2, pp. 261–269, 2021. [Google Scholar]
10. Y. Masutani, H. MacMahon and K. Doi, “Computerized detection of pulmonary embolism in spiral CT angiography based on volumetric image analysis,” IEEE Transactions on Medical Imaging, vol. 21, no. 12, pp. 1517–1523, 2002. [Google Scholar]
11. H. Bouma, J. J. Sonnemans, A. Vilanova and F. A. Gerritsen, “Automatic detection of pulmonary embolism in CTA images,” IEEE Transactions on Medical Imaging, vol. 28, no. 8, pp. 1223–1230, 2009. [Google Scholar]
12. N. Tajbakhsh, M. B. Gotway and J. Liang, “Computer-aided pulmonary embolism detection using a novel vessel-aligned multi-planar image representation and convolutional neural networks,” in Proc. Int. Conf. on Medical Image Computing and Computer-Assisted Intervention, Munich, Germany, pp. 62–69, 2015. [Google Scholar]
13. G. Litjens, T. Kooi, B. E. Bejnordi, A. A. A. Setio, F. Ciompi et al., “A survey on deep learning in medical image analysis,” Medical Image Analysis, vol. 42, pp. 60–88, 2017. [Google Scholar]
14. D. Rajan, D. Beymer, S. Abedin and E. Dehghan, “Pi-PE: A pipeline for pulmonary embolism detection using sparsely annotated 3D CT images,” in Proc. Machine Learning for Health Workshop, Vancouver, Canada, pp. 220–232, 2020. [Google Scholar]
15. O. Ronneberger, P. Fischer and T. Brox, “U-Net: Convolutional networks for biomedical image segmentation,” in Proc. Int. Conf. on Medical Image Computing and Computer-Assisted Intervention, Munich, Germany, pp. 234–241, 2015. [Google Scholar]
16. S. H. I. Xingjian, Z. Chen, H. Wang, D. Y. Yeung, W. K. Wong et al., “Convolutional LSTM network: A machine learning approach for precipitation nowcasting,” in Proc. Advances in Neural Information Processing Systems, Montreal Canada, pp. 802–810, 2015. [Google Scholar]
17. Y. Lin, J. Su, X. Wang, X. Li, J. Liu et al., “Automated pulmonary embolism detection from CTPA images using an end-to-end convolutional neural network,” in Proc. Int. Conf. on Medical Image Computing and Computer-Assisted Intervention, Shenzhen, China, pp. 280–288, 2019. [Google Scholar]
18. K. He, X. Zhang, S. Ren and J. Sun, “Deep residual learning for image recognition,” in Proc. IEEE Conf. on Computer Vision and Pattern Recognition, Las Vegas, Nevada, pp. 770–778, 2016. [Google Scholar]
19. G. G. Serrano, “CAD-PE challenge,” IEEE Dataport. https://dx.doi.org/10.21227/9bw7-6823, 2019. [Google Scholar]
20. J. Liang and J. Bi, “Computer-aided detection of pulmonary embolism with tobogganing and multiple instance classifications in CT pulmonary angiography,” in Proc. Biennial Int. Conf. on Information Processing in Medical Imaging, Kerkrade, Netherlands, pp. 630–641, 2007. [Google Scholar]
21. L. Weifang, M. Liu, G. Xiaojuan, Z. Peiyao, L. Zhang et al., “Evaluation of acute pulmonary embolism and clot burden on CTPA with deep learning,” European Radiology, vol. 30, no. 6, pp. 3567–3575, 2020. [Google Scholar]
22. A. N. J. Raj, H. Zhu, A. Khan, Z. Zhuang, Z. Yang et al., “ADID-UNET—A segmentation model for COVID-19 infection from lung CT scans,” Peer J Computer Science, vol. 7, pp. e349, 2021. [Google Scholar]
23. J. S. Giri, J. Horowitz, C. Kabrhel, R. Lookstein, G. Merli et al., “Diagnosis and treatment of pulmonary embolism during the coronavirus disease 2019 pandemic,” CHEST, vol. 158, no. 6, pp. 2590–2601, 2020. [Google Scholar]
24. M. Masoudi, H. R. Pourreza, M. Saadatmand-Tarzjan, N. Eftekhari, F. S. Zargar et al., “A new dataset of computed-tomography angiography images for computer-aided detection of pulmonary embolism,” Scientific Data, vol. 5, no. 1, pp. 1–9, 2018. [Google Scholar]
25. R. Achanta, A. Shaji, K. Smith, A. Lucchi, P. Fua et al., “SLIC superpixels compared to state-of-the-art superpixel methods,” IEEE Transactions on Pattern Analysis and Machine Intelligence, vol. 34, no. 11, pp. 2274–2282, 2012. [Google Scholar]
26. G. Blanco, A. J. Traina, C. Traina Jr, P. M. Azevedo-Marques, A. E. Jorge et al., “A Superpixel-driven deep learning approach for the analysis of dermatological wounds,” Computer Methods and Programs in Biomedicine, vol. 183, pp. 105079, 2020. [Google Scholar]
27. S. Mitra, S. Dey, N. Das, S. Chakrabarty, M. Nasipuri et al., “Identification of malignancy from cytological images based on superpixel and convolutional neural networks,” in Intelligent Computing Paradigm: Recent Trends 2020, vol. 784, Springer, Singapore, pp. 103–122, 2019. [Google Scholar]
28. Z. Ban, J. Liu and L. Cao, “Superpixel segmentation using Gaussian mixture model,” IEEE Transactions on Image Processing, vol. 27, no. 8, pp. 4105–4117, 2018. [Google Scholar]
29. O. Russakovsky, J. Deng, H. Su, J. Krause, S. Satheesh et al., “Imagenet large scale visual recognition challenge,” International Journal of Computer Vision, vol. 115, no. 3, pp. 211–252, 2015. [Google Scholar]
30. X. Yang, Y. Lin, J. Su, X. Wang, X. Li et al., “A Two-stage convolutional neural network for pulmonary embolism detection from CTPA images,” IEEE Access, vol. 7, pp. 84849–84857, 2019. [Google Scholar]
31. X. Li, D. Chang, T. Tian and J. Cao, “Large-margin regularized softmax cross-entropy loss,” IEEE Access, vol. 7, pp. 19572–19578, 2019. [Google Scholar]
32. C. Cano-Espinosa, M. Cazorla and G. González, “Computer aided detection of pulmonary embolism using multi-slice multi-axial segmentation,” Applied Sciences, vol. 10, no. 8, pp. 2945, 2020. [Google Scholar]
33. N. Tajbakhsh, J. Y. Shin, M. B. Gotway and J. Liang, “Computer-aided detection and visualization of pulmonary embolism using a novel, compact, and discriminative image representation,” Medical Image Analysis, vol. 58, pp. 101541, 2019. [Google Scholar]
34. S. C. Huang, T. Kothari, I. Banerjee, C. Chute and R. L. Ball, “PENet—A scalable deep-learning model for automated diagnosis of pulmonary embolism using volumetric CT imaging,” NPJ Digital Medicine, vol. 3, no. 1, pp. 1–9, 2020. [Google Scholar]
 | This work is licensed under a Creative Commons Attribution 4.0 International License, which permits unrestricted use, distribution, and reproduction in any medium, provided the original work is properly cited. |