DOI:10.32604/iasc.2022.025060
| Intelligent Automation & Soft Computing DOI:10.32604/iasc.2022.025060 | |
| Article |
Hybrid Optimized Learning for Lung Cancer Classification
1Agni College of Technology, Chennai, 600130, India
2SSN College of Engineering, Chennai, 600004, India
*Corresponding Author: R. Vidhya. Email: getvidhya@gmail.com
Received: 10 November 2021; Accepted: 14 January 2022
Abstract: Computer tomography (CT) scan images can provide more helpful diagnosis information regarding the lung cancers. Many machine learning and deep learning algorithms are formulated using CT input scan images for the improvisation in diagnosis and treatment process. But, designing an accurate and intelligent system still remains in darker side of the research side. This paper proposes the novel classification model which works on the principle of fused features and optimized learning network. The proposed framework incorporates the principle of saliency maps as a first tier segmentation, which is then fused with deep convolutional neural networks to improve the classification maps and eventually reduce the risk of overfitting problems. Furthermore, the proposed work has replaced the traditional neural network with Ant-Lion Optimized Feed Forward Layers (ALO_FFL) to obtain the best classification of cancers in Lung CT scan images. The proposed algorithm has been implemented using Tensorflow 1.8 and Keras API with Python 3.8 programming. The extensive experimentations are carried out using the LIDC-IDRI image datasets and various performance metrics such as accuracy, sensitivity, specificity, precision and f1-score are calculated and analyzed. Simulation results show the proposed framework shows 99.89% accuracy, 99.8% sensitivity, 99.76% specificity, 99.8% precision and even 99.88% F1-score respectively. At last, comparative analysis is done with other existing models to prove the excellence of the proposed framework.
Keywords: Computer tomography scan images; fused features; saliency maps; convolutional neural networks; ant-lion optimization
Recently, uneven climate changes and unbiased life styles are considered as important root causes for the rapid increase of diseases. Lung cancer is one of most dreadful diseases in the world [1–4]. Recent surveys by World Health Organization (WHO) says nearly 7.6 million worldwide deaths [5,6] are due to the impact of lung cancers on human life. Moreover, it has been predicted to reach nearly 17 Million worldwide deaths by 2030 [7]. Hence the risk of lung cancer is enormous in all major parts of world and it has been cultivating the more deaths per year.
To reduce the impact of lung cancer, early diagnosis system is badly required which is used to discover the cancer at early stage [8]. The different diagnosis methodologies such as Magnetic Resonance Imaging (MRI), X-rays, Isotopes and Computer Tomography (CT) scans are used as an effective tool for recognition of lung cancers [9,10]. CT images are used by physicians and radiologists to identify and recognize the presence of cancers, directly visualize the morphologic extents of cancers, describe the patterns and severity of diseases [11].
Classification of the lung cancers plays a critical aspect in designing the intelligent and accurate diagnosis system. With an advent of machine and deep learning algorithms, design of early diagnosis systems has reached its new heights. The machine learning algorithms such as artificial neural networks (ANN), Support Vector Machines (SVM), Naïve Bayes Classifiers (NB), Ensemble classifiers (EC) are primarily used for an early diagnosis of the lung cancers [12–16]. Also Deep learning is considered to be most promising field which can enhance the performance of various medical imaging and diagnosis systems [17,18].
However, handling the images with different imaging protocols remains to be real challenge to train the learning modes for greater performance. To compensate for the above drawback of learning models, this paper proposes the novel hybrid intelligent diagnosis framework DFF-RON (Deep Fused Features Based Reliable Optimized Networks), which fuses the saliency maps and convolutional layers for better segmentation and feature extraction, that are used to train the ant-lion optimized single feed forward networks. To the best of our knowledge, this is first work which has integrated the fused features and optimized learning networks to design an efficient and high performance CT based Lung Cancer Diagnosis System. The contribution of the research work is given as follows
• A Novel Hybrid deep learning based model is proposed for early detection of lung cancer using CT Scan Images. The prosed model architecture has been trained with LIDC-IDRI datasets and performance metrics has been calculated and compared with the other existing models.
• The proposed architecture introduces the saliency fused CNN layers for the better segmentation and feature extraction. Also the proposed fusion algorithm can increase the high diagnosis rate also.
• The ant-lion optimized feedforward layers (ALO-FFL) are proposed for training the features obtained from the hybrid fusion of saliency maps and CNN layers. The feed forward layers are designed based on the principle of Extreme Learning Machines (ELM).
Bharati et al. [19] proposed another crossover profound learning structure named as (visual geometry group based neural network) VDSNet is for distinguishing lung infections from X-beam pictures. VDSNet displays an approval exactness worth of 73% which is superior to the 70.8% precision esteem in the event of test dataset. The examination work faces a few difficulties at the hour of taking care of the huge scope dataset. Subsequently, the utilization of little datasets can give great exactness yet it won’t be compelling in genuine applications.
Jothi et al. [20] utilized USQR, URR and SSUSQR calculations are dissected utilizing crude CT lung pictures. The proposed strategy furnishes the best outcome contrasted and harsh set based unaided element determination. To utilize the delicate set methodology, it is fundamental to change the dataset into unmitigated ones which makes computational overhead.
Masood et al. [21] fostered an original computer-aided decision support network for lung knob recognition dependent on a 3D Deep Convolutional Neural Network (3DDCNN) for helping the radiologists. This structure applied middle power projection and multi-Region Proposal Network (mRPN) for programmed choice of expected locale of-interests. Framework beat the best in class frameworks and got an amazing 98.7% affectability at 1.97 FPs per scan.
Anthimopoulos et al. [22] proposed a profound CNN to order lung CT picture patches into 7 classes, including 6 distinctive ILD designs and solid tissue. The technique can be effectively prepared on extra textural lung designs while execution could be additionally improved by a broader examination of the elaborate boundaries. The outcomes show that the higher misclassification rate is chiefly brought about by the reticular examples, which require a precise depiction of surface separated from the primary request portrayal of power esteems.
Jakimovski et al. [23] pre-characterize the pictures into heaps of same cut pictures utilizing the K-implies calculation to, where the DNN can zero in on picture arrangement of same cut pictures. The subsequent curiosity is the extra convolution layer with edge honing channels, to completely look for malignant growth. The outcomes were examined with clinical staff from the oncology office and were set apart as palatable to decide malignancy. For the enormous informational collection this structure produces computational overhead.
Yu et al. [24] presented profound learning helped Adaptive Hierarchical Heuristic Mathematical Model (AHHMM) to foresee cellular breakdown in the lungs on figured tomography pictures. The proposed AHHMM framework predicts processed tomography checking pictures of cellular breakdown in the lungs effectively. The discoveries of the assessment showed that around 90% of the pictures has accurately identified. Such outcomes show that DNN is helpful in blister determination for grouping cellular breakdown in the lungs.
Asuntha et al. [25] proposed a novel FPSOCNN (Fuzzy Particle Swarm Optimization based Convolutional Neural Network) which decreases computational intricacy of CNN. From the trial results, it is shown that novel FPSOCNN performs better compared to different strategies. This structure expect improvement to identify threat of aspiratory knobs, which is of important importance for the determination and therapy of cellular breakdown in the lungs.
Chauhan et al. [26] proposed a model for the location of Lung malignancy infection grouping based a proficient methodology in which machine learning ideas are utilized. The created structure is easy to understand illness forecast model dependent on PCA and LDA, but this system requires expanded computational time because of continuous output pictures.
Shakeel et al. [27] dissects the cellular breakdown in the lungs utilizing improved profound neural organization and gathering classifier. The proficiency of the framework is assessed utilizing exploratory outcomes, and framework perceives the disease with greatest exactness. Improvement is required for the locale division and feature determination measure for the fruitful expectation influenced area decides the deviation in typical and malignant growth cell successfully.
Wong et al. [28] zeroed in on the technique for cellular breakdown in the lungs distinguishing proof by breath. This framework utilized KNN and SVM with leave-one-out cross approval to investigate. At last, we got great precision that was 84.4%. Further update is needed to deal with enormous dataset.
Xie et al. [29] introduced the MV-KBC model to isolate favorable from dangerous lung knobs on chest CT by considering the knob appearance on nine view planes and the knob heterogeneity and by applying a versatile weighting plan with the goal that our model can be prepared in a start to finish way. The outcomes show that our model is more precise than present status of-the-craftsmanship approaches on the LIDC-IDRI dataset.
Vikas et al. [30] proposed SVM and RF based technique to detect lung cancer. This technique utilized chi-square technique for the feature selection. The analysis is done with and without chi-square feature selection. Finally this framework validates the overall performance in terms of precision, accuracy and recall. The findings shows, this framework reduces execution time to prove better performance.
The Related work summary is given as follows,
The existing research works utilized DL and ML algorithms DNN, CNN, DDCNN, KNN, and SVM etc. to predict the lung cancer. But still lung cancer prediction with high accuracy and less complexity is in darker side of the research. To overcome the above mentioned issues, the proposed work has replaced the traditional neural network with Ant-Lion Optimized Feed Forward Layers (ALO-FFL) to obtain the best classification of cancers in Lung CT scan images.
Fig. 1 shows complete architecture for the proposed framework. The working mechanism of the proposed deep learning based diagnosis and classification system is sub-divided into three important phases. Image preprocessing and Augmentation process, Visual Saliency map extractions, accurate feature extraction using the customized convolutional layers and finally trained by the novel ant-lion optimized feed forward networks.
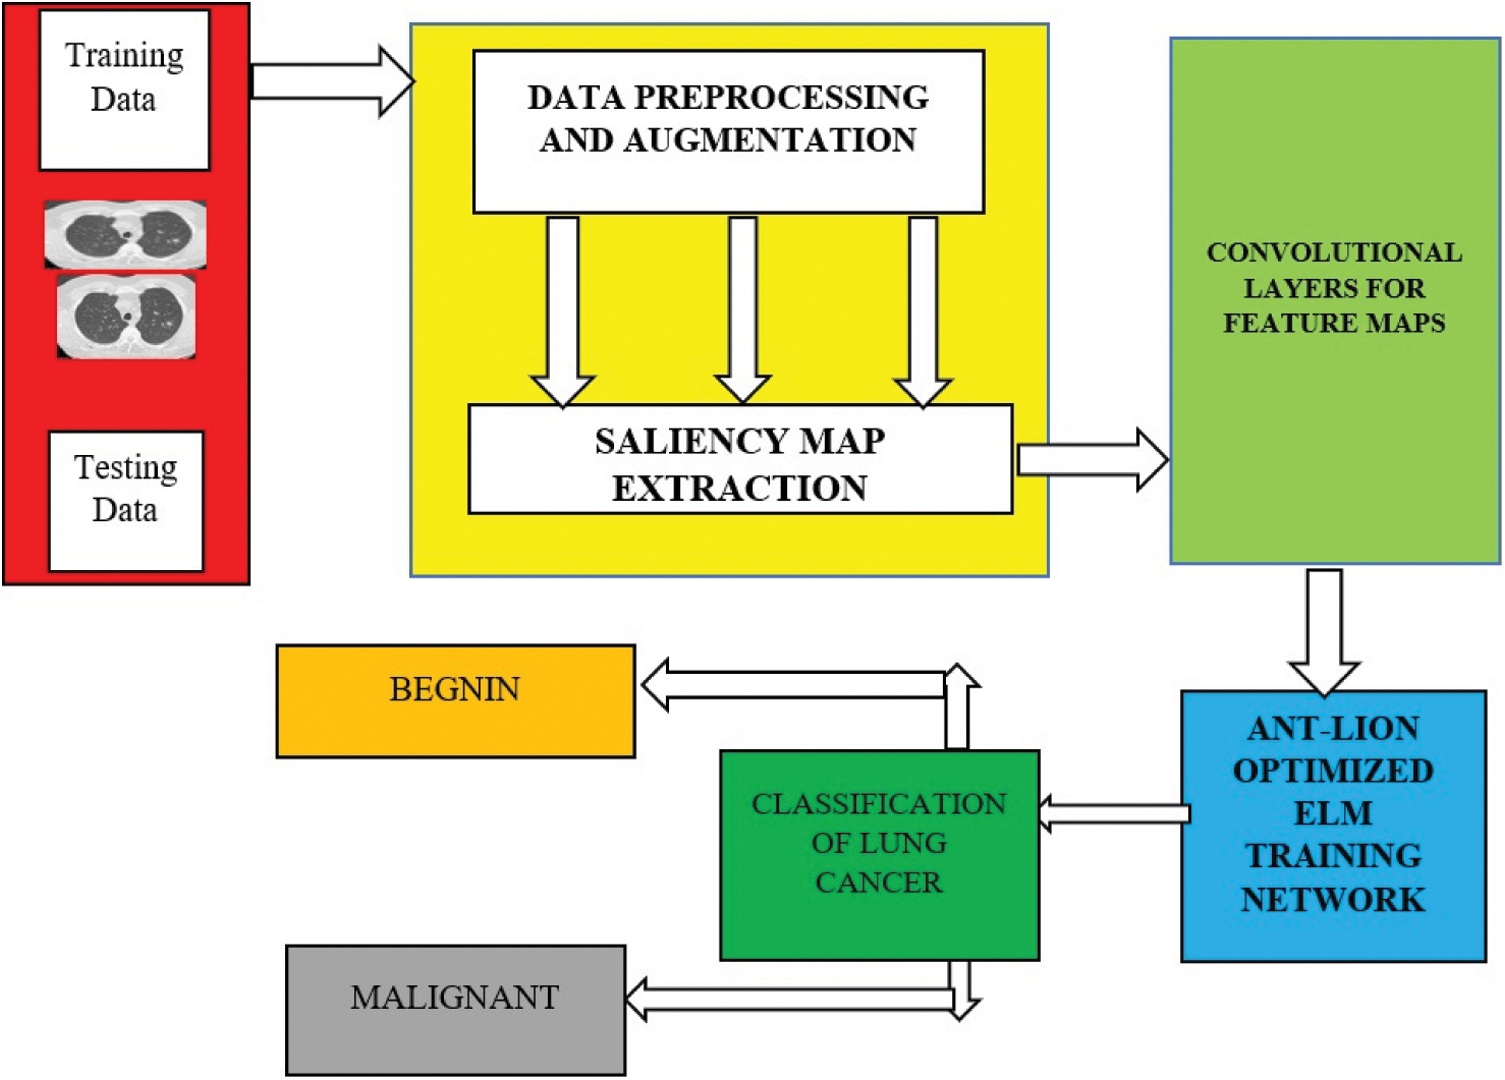
Figure 1: Overall working flow diagram for the proposed architectures
3.2 Data Preprocessing and Augmentation
The medical preprocessing technique is used to remove noise pixels, low-quality pixels which affects the detection of lung cancers. Pixel Intensive testing process has been utilized to remove the inconsistent pixel and the noise pixels from the Input CT scan images. Also, Image histogram methods are adopted for enhancing the image quality because it works better on different images. Fig. 2 shows the preprocessed CT scan images after applying pixel classification and image histogram methods.
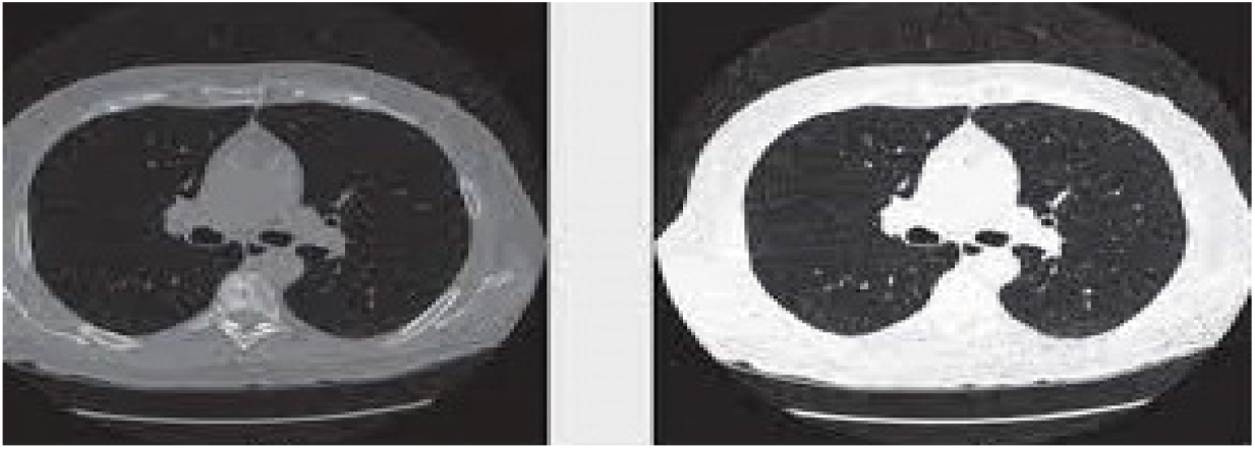
Figure 2: Sample preprocessed CT lung images
After preprocessing the input images, image augmentation process is used in the proposed architecture. Neural Networks leads to the overfitting problems where a limited quantity of labelled data is available. The most proficient and efficient method to tackle this problem is data augmentation. During the data augmentation phase, each image undergoes a series of transformation, producing the huge amount of newly corrected training image samples. As discussed in [31], affine transformation is employed for an efficient data augmentation. The affine transformation techniques such as translation, scaling and rotations are used. Mostly the training image samples obtained from the augmentation process have a correlation, this step is recommended to overcome the overfitting problems. Fig. 3 shows the different lung images obtained after applying the affine transformations.
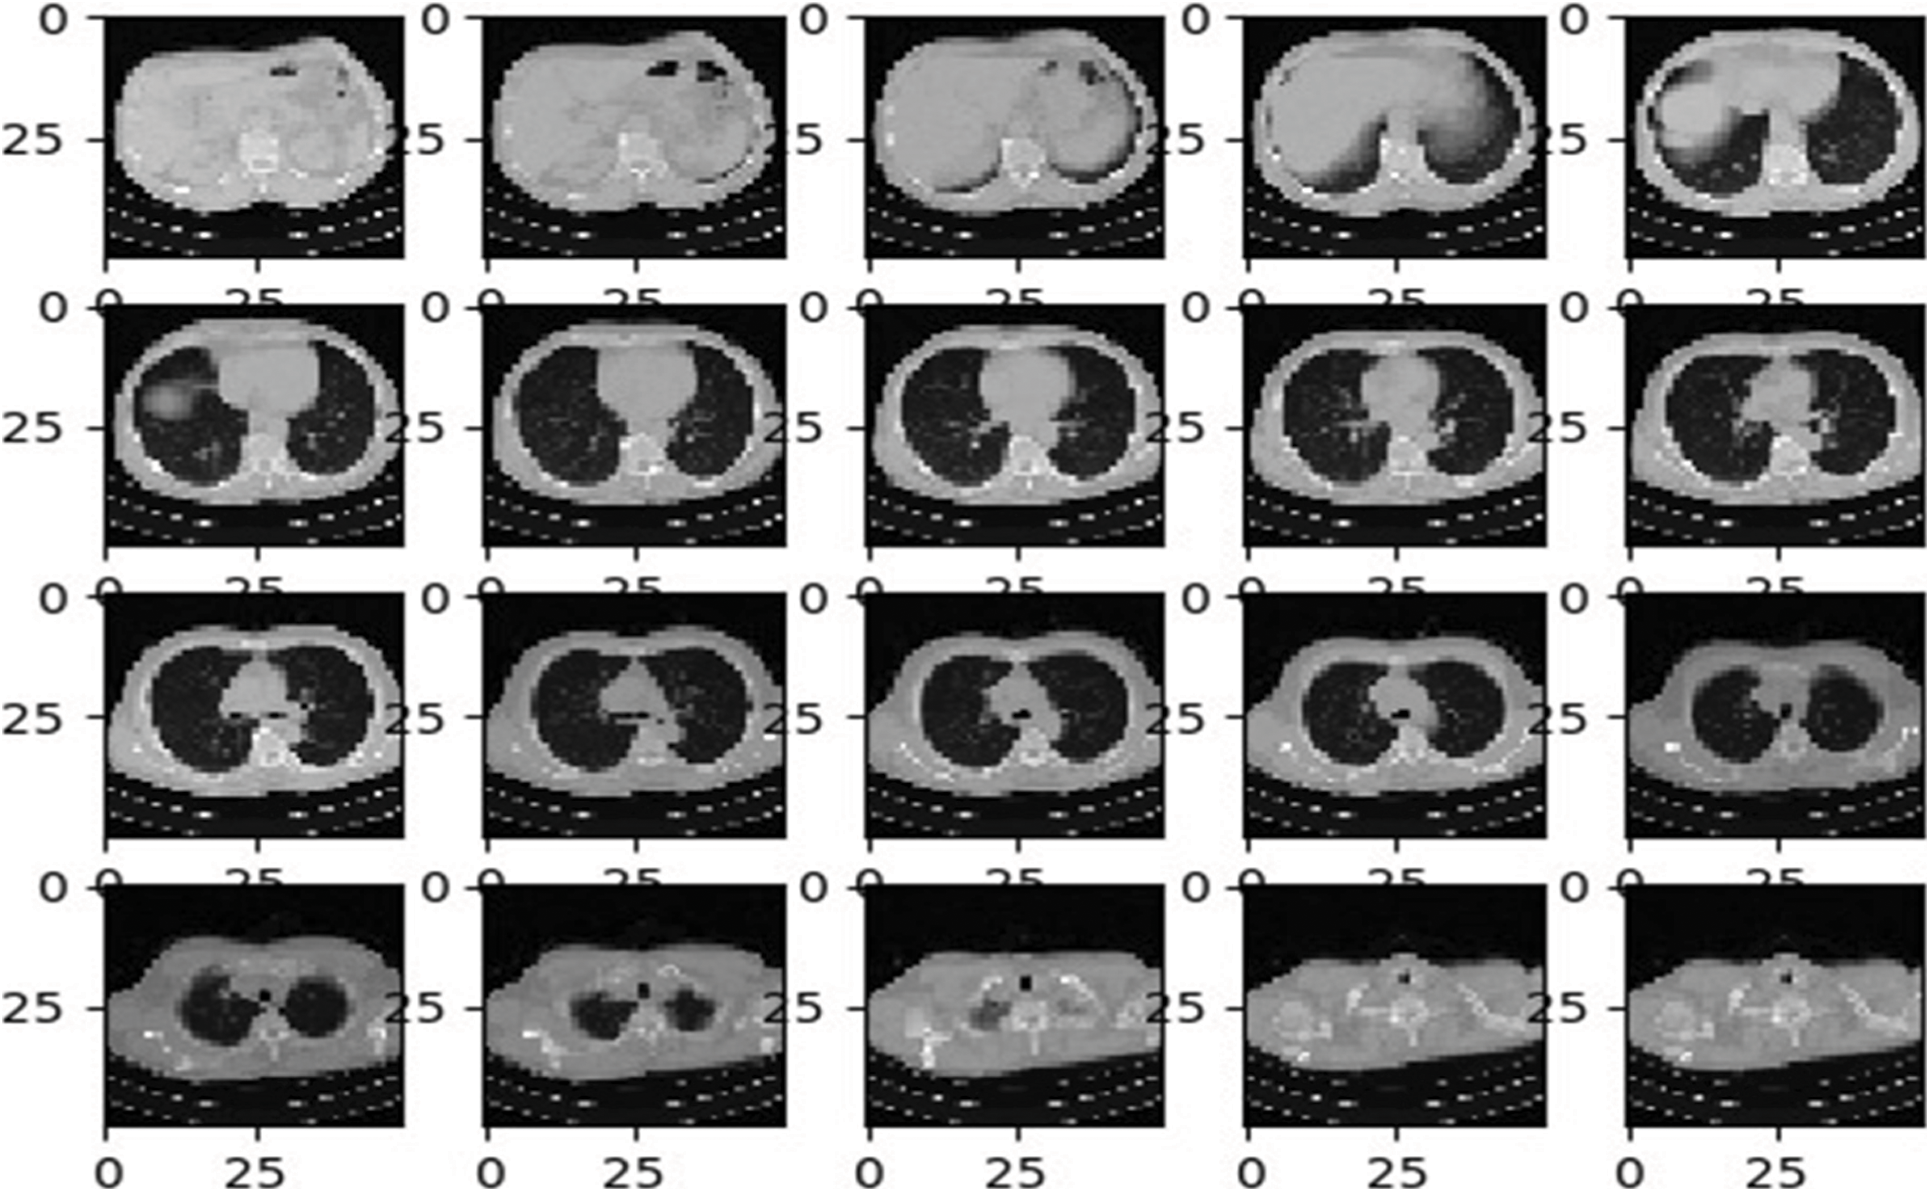
Figure 3: Sample CT lung images after augmentation process
3.3 Visual Saliency Map Extraction
Segmentation is the process of subdividing the images with different values of textures and pixels. Several methods have been produced for segmenting the images. Here new methodology has been introduced which is called as visual saliency maps descriptors. It completely decomposes the respective images into compact and heterogeneous elements. There will be a subtraction of unnecessary components in the images. To build the saliency models [32], color difference and spatial difference is applied in a pixel-based processing in which the each pixels are represented as the blocks. To achieve this, pixels ‘Y’, are rescaled into 256 × 256 and then decomposed into non-overlapping blocks with size n × n where n = 8 and 16 respectively. Hence the saliency maps S(m) are calculated by using the mathematical expressions given by Eq. (1)
Since the location, dimensions and shape of cancer cells are quite similar in neighboring slices, the final saliency maps are calculated as the weighted sum of the actual (S(m)), previous (S(m1)) and next blocks (S(m2)) color and spatial saliency as mentioned in [32]. The updated saliency maps S(m) is given by Eq. (2)
Fig. 4 shows the saliency maps of different stages of lung cancer CT scan images. After calculating the saliency maps, post processing techniques need to be adopted for refinement of segmentation images. Active contour methods [33] are used for the detection of cancer cells in the most consecutive image blocks. Also accurate separation of cancer cells from the other parts of CT scan images is badly needed, in order to give a precise output. Moreover, active contours are based on image intensity, which probably fails in differentiating the cancer cells. Additionally, these contour methods requires the higher computation time, which is considered to be serious problem in handling the larger datasets.
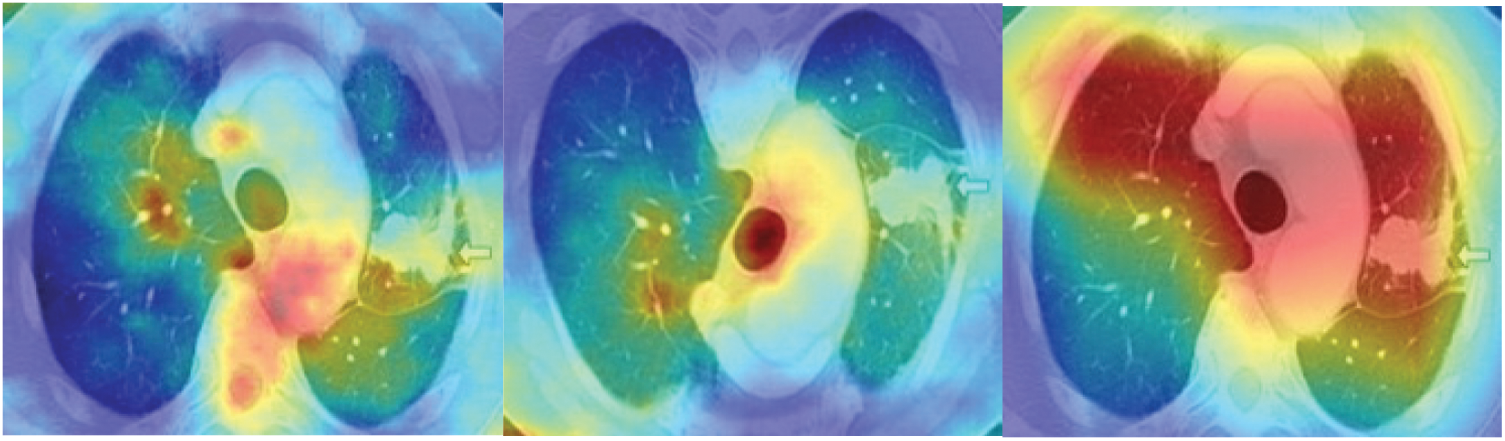
Figure 4: Sample CT images after applying the handcrafted saliency maps
Motivated by this drawback, this paper introduces the fusion of saliency maps with deep convolutional neural network with optimized feedforward layers to obtain high performance and accurate detection and classifications of CT Lung cancer images Their major drawback comes from the fact that to achieve such high quality results, these methods require extensive parameter tuning and optimization, which is simply not feasible in the case of large amounts of data and also affects the detection rate. But in this proposed system, training effort takes reduced time and also increases the efficiency and performance of the system.
3.4 Fusion of Saliency Maps in CNN-OFLS
This section details about the fusion of saliency maps in the CNN-OFLS architecture which are normally used for segmentation and classification mechanism.
3.4.1 Convolutional Neural Networks–An Overview
Convolutional neural network (CNN) is a biologically propelled advancement of Multi-Layer Perceptron MLP. CNN are broadly utilized for picture characterization, picture bunching and object identification in pictures. They are additionally utilized for optical character acknowledgment and regular language handling. Aside from pictures, when addressed outwardly as a spectrogram, CNNs can likewise be applied to sound. Additionally, CNNs has been applied straightforwardly to message examination just as in chart information with diagram convolutional networks. The condition of-workmanship craftsmanship proficiency of CNN contrasted with its gauge calculations makes it accomplishment in numerous fields.
As, demonstrated in Fig. 5 in CNN the highlights are recognized using channels which are otherwise called bits. A channel is only a network of qualities, considered loads that are prepared to distinguish explicit highlights. The reason for the channel is to do the convolution activity, which is a component insightful item and entirety between two networks. The preparation of the CNN is secured by lessening the measure of repetition present in the info highlight. Thus, the measure of memory devoured by the organization is likewise decreased. One basic strategy to accomplish this is max pooling, in which, a window disregards input information and the most extreme worth inside the window is pooled into a yield framework. The calculation is made proficient for include extraction by connecting various convolution layers and max pooling tasks. The information is handled through these profound layers to deliver the element maps which is at last changed over into an element vector by going through a MLP. This is alluded to as a Fully-Connected Layer that performs undeniable level thinking in the created model
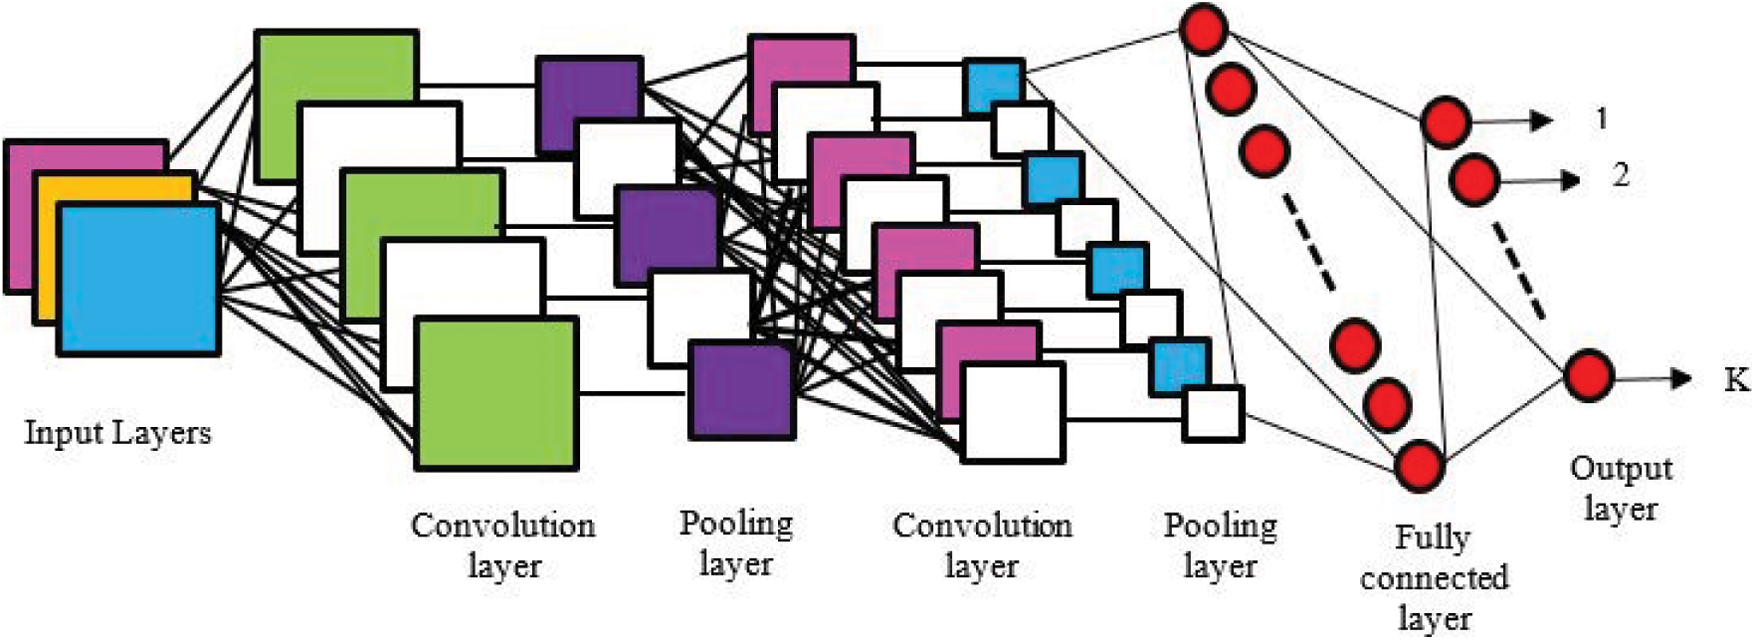
Figure 5: Schematic representation of convolutional neural networks
3.4.2 Fusion of Saliency Maps in CNN Layers for Segmentation
As discussed in Section 3.3, training the convolutional neural networks, requires high training time, making the design applications more challenging for better implementation. This motivates the idea of fusing the handcrafted saliency maps with convolutional neural network trained with the optimized forward layers. Several predefined CNN models such as U-NETS [34], WT-NETs [35] were used for fusion. But the proposed system uses the user-defined convolutional layers to obtain an accurate segmentation process. The six convolutional layers are used for an effective segmentation of cancer cells in CT lung Images with saliency maps training. Tab. 1 shows the specification of RELU activated convolutional layers which are fused with the saliency maps for better segmentation.

3.5 Feedforward Networks-An Extreme Learning Machine Approach
After the segmentation process, feature extracted which are then feed for training the networks. In the proposed architecture, traditional training networks are replaced with feedforward networks which works on the principle of Extreme Learning Machines (ELM). Extreme Learning Machines (ELM) are category of neural network proposed by Huang [36]. This kind of neural network utilizes the single hidden layers in which the hidden layers doesn’t require the tuning mandatorily. Compared with the other learning algorithms such as Support vector machines (SVM) and Random Forest (RF), ELM exhibits the better performance, high speed and less computational overhead [36].
ELM uses the kernel function to yield good accuracy for the better performance. The major advantages of the ELM are minimal training error and better approximation. Since ELM uses the auto-tuning of the weight biases and non-zero activation functions, ELM finds its applications in classification and classification values. The detailed working mechanism of the ELM is discussed in [36,37]. The output function of ELM given in Eq. (3)
3.6 Optimized Extreme Learning Models
Though Extreme Learning principle based feedforward networks produces the best performance, non-optimal tuning of hyper parameters such as input weights, hidden neurons, learning rate affects the accuracy of classification. Hence the optimization is required for the tuning the hyper parameters for achieving the best performance. The proposed algorithm used Antlion optimization [38] for optimizing the extreme learning based training networks
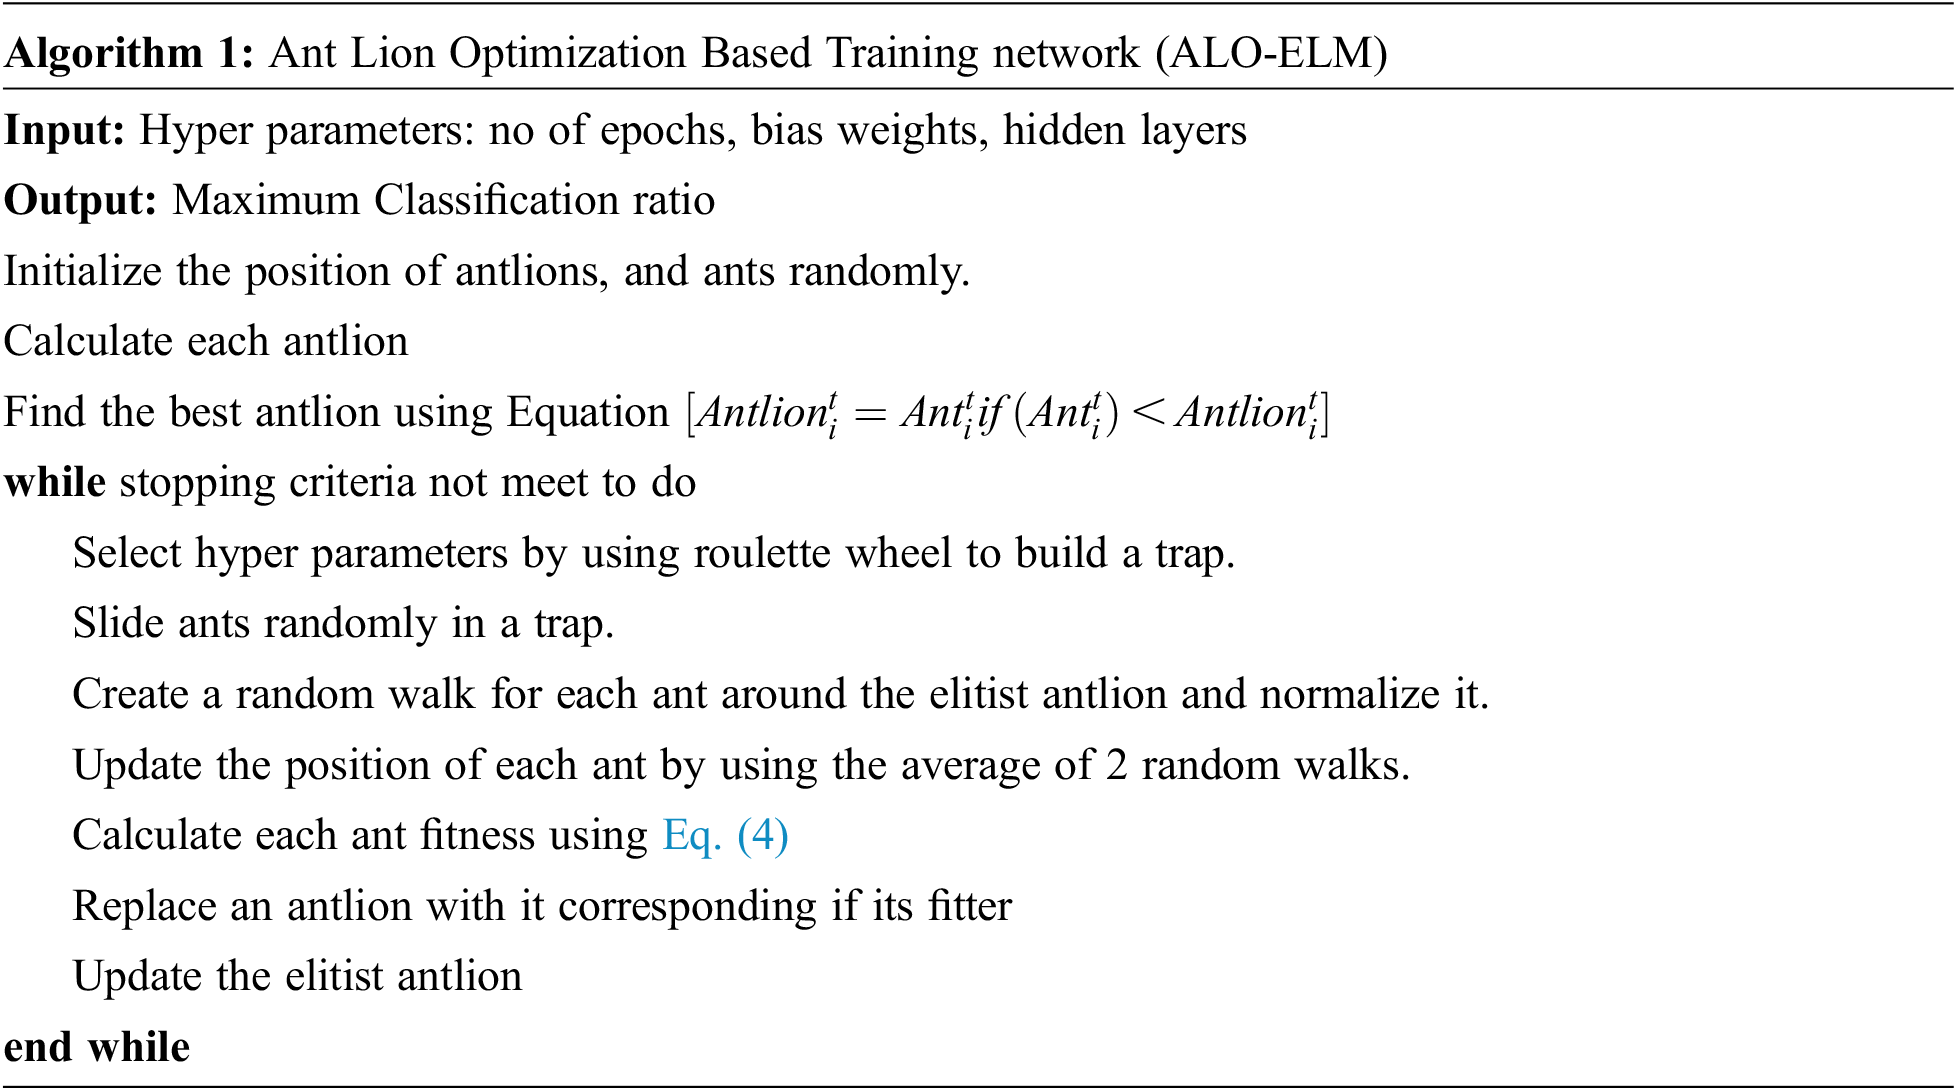
To optimize the hyper parameters such as no of epochs, bias weights, hidden layers, ant lion optimization algorithm is used for the proposed training network. The fitness function is calculated using the mathematical Eq. (4)
where A is the maximum accuracy. The fitness function is calculated at each and every iteration and checks it meets the threshold. The pseudo code for the optimization of network is presented in Algorithm 1 [38] the optimized parameters obtained for the proposed architecture to achieve the higher accuracy is shown in Tab. 2.

The experimentations are carried out using lung CT images which are obtained from the cancer imaging archives (https://wiki.cancerimagingarchive.net/display/Public/LIDC-IDRI). The database consists of 1018 subjects which are obtained from national cancer institute that correlated with proteomic and genomic clinical data. In this paper, all training images are classified into malignant and benign nodules. A malignancy nodule will have scored lower than 3 are called as a benign nodule and a malignancy nodule will have scored higher than 3 are called as a malignant nodule. The pulmonary nodules with a score of 3 in malignancy are removed to avoid the ambiguousness of nodule samples. Separate software NBIA retriever is used for the conversion of tcia format data to DICOM image data which can be used for further processing. The detailed description of the datasets used for testing is presented in [39].
The whole experimentation is carried out in the Intel I7CPU with 2 GB NVIDIA Geoforce K + 10 GPU, 16 GB RAM, 3.0 GHZ with 2TB HDD. The proposed architecture is implemented using Tensorflow 1.8 with Keras API. All the programs are implemented in the anaconda environment with python 3.8 programming.
5 Performance Metrics and Evaluation
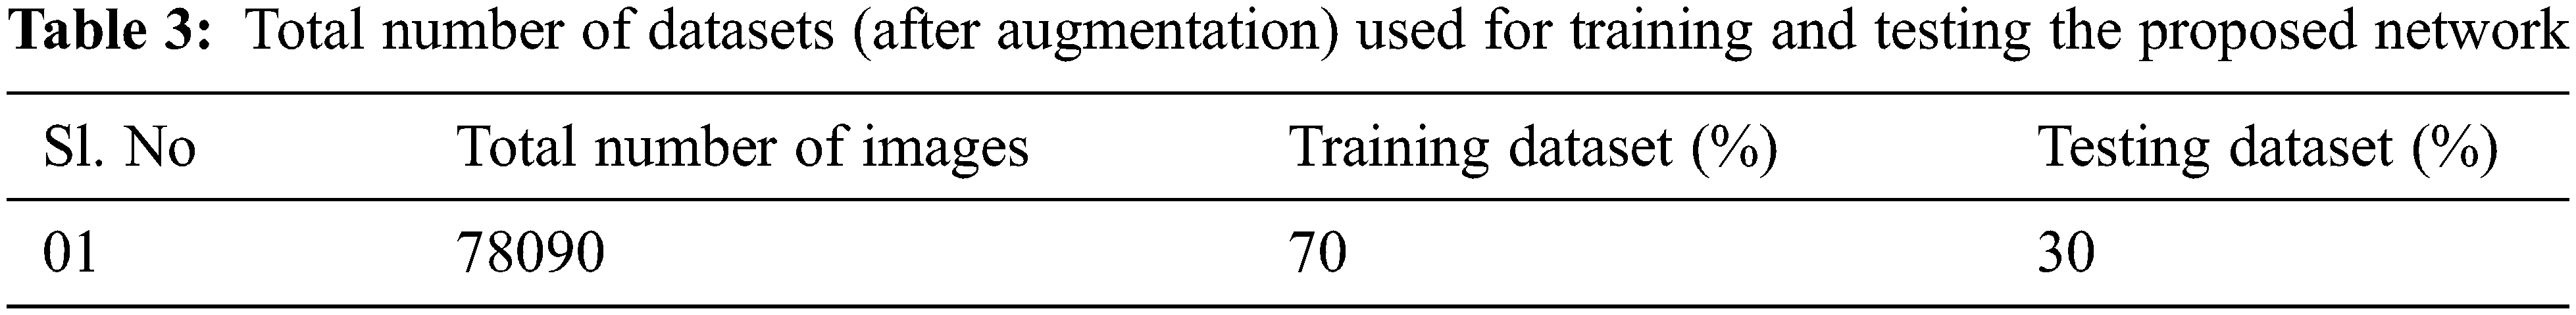
The proposed architecture implements the six CNN layers for the better classification of cancer cells in lung images. Tab. 3 depicts the partitioned datasets used for training and testing the network.
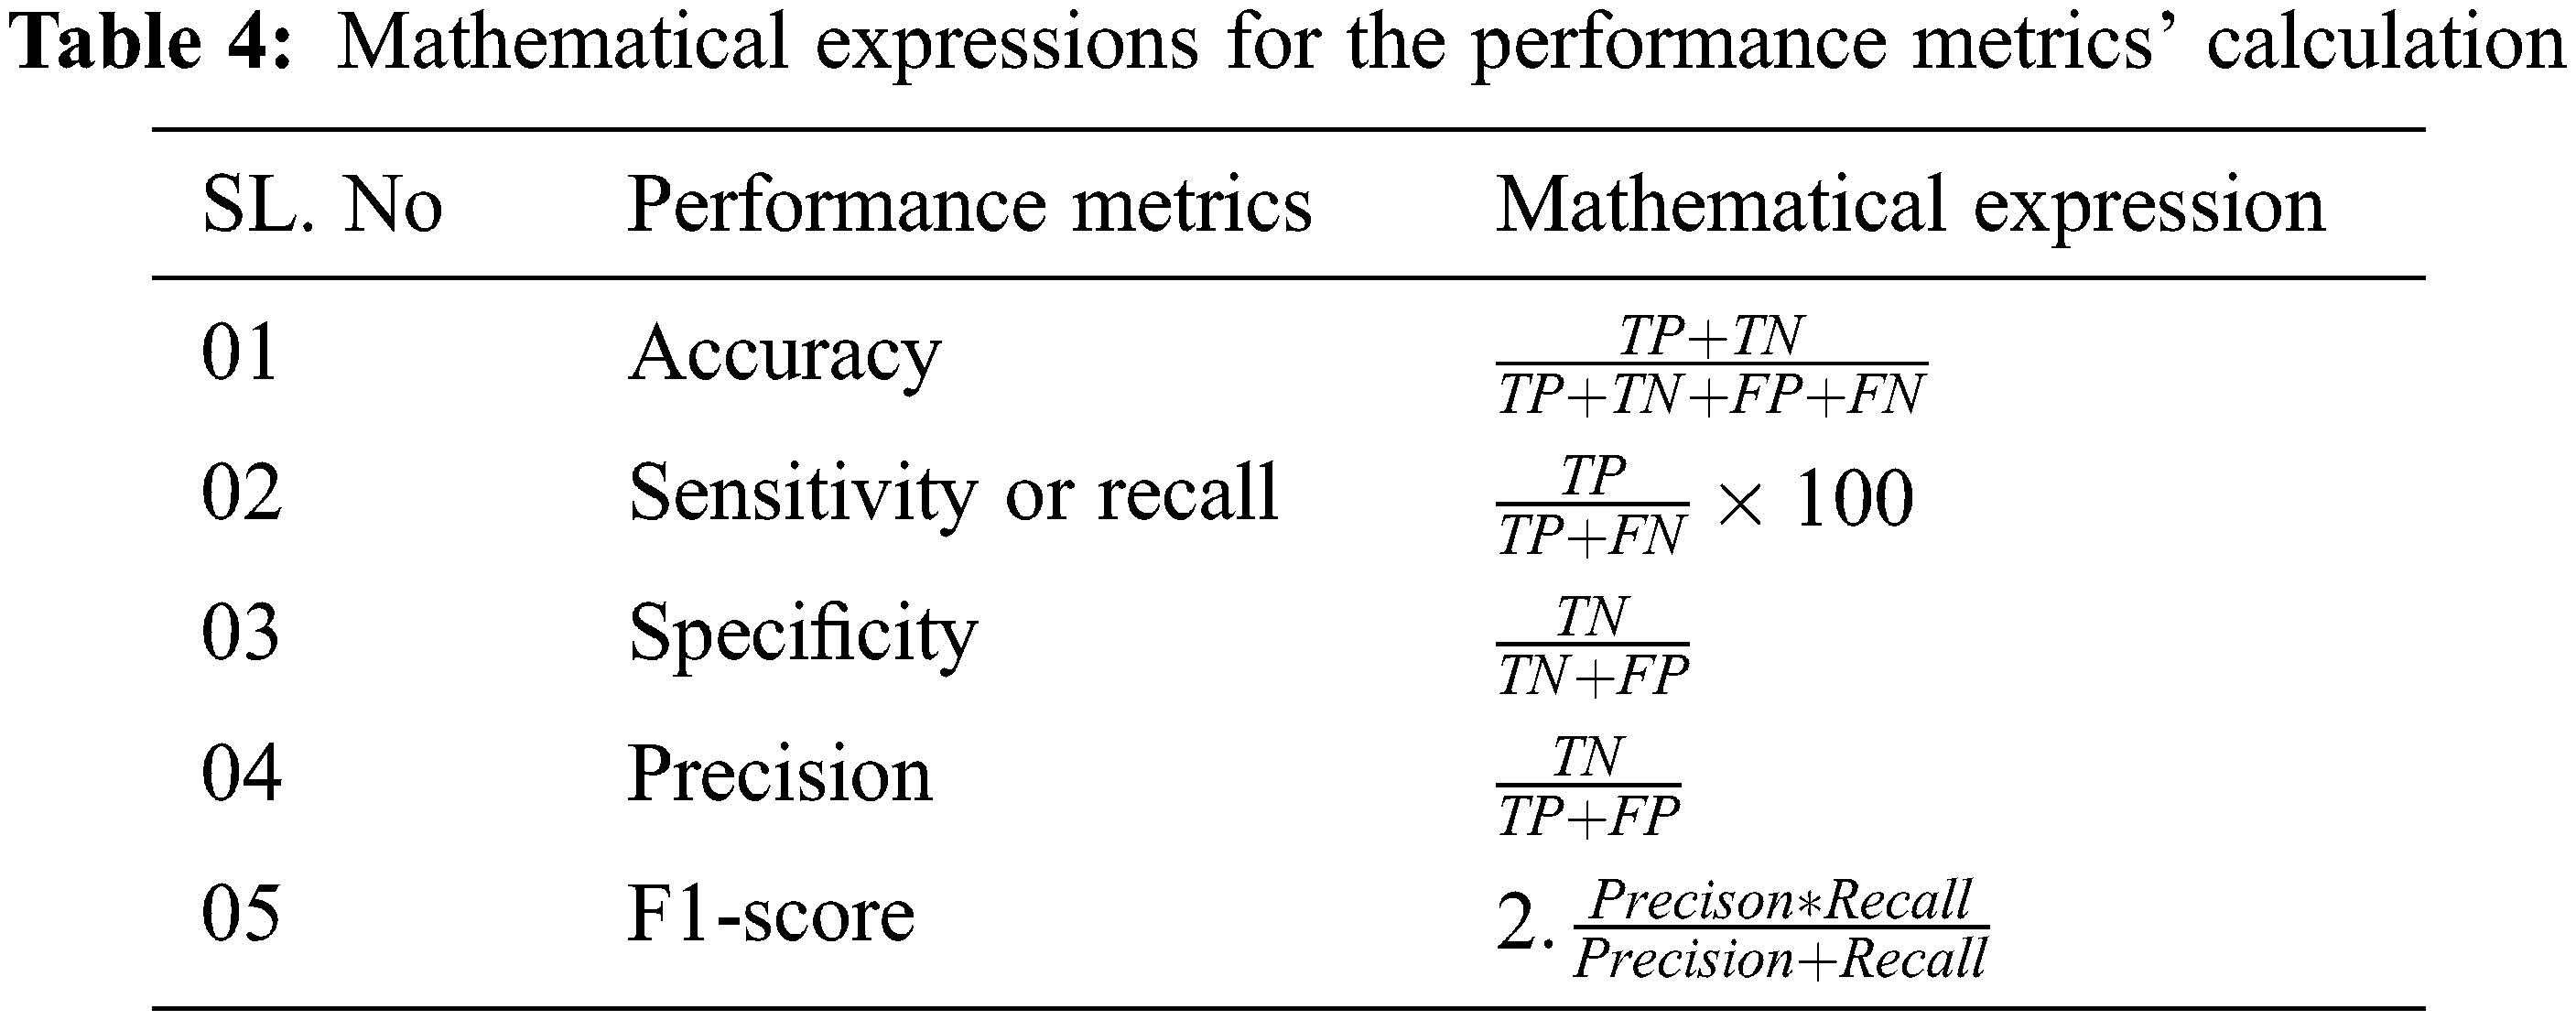
Six Convolutional layers are used in the proposed architecture whose hyper parameters of the are optimized by antlion optimization. The details about the tuned hyper parameter is discussed in Section 3.6. s the next step, the proposed architecture is tested with the images in which the convolutional layers extracts the image features and feeds to the optimized feed forward training networks that classifies the appropriate categories. To evaluate the performance of proposed architecture, metrics such as accuracy, sensitivity, specificity, recall and f1-score are calculated. Tab. 4 shows the mathematical expressions for calculating the metrics used for evaluating the proposed architecture. TP is True Positive Values, TN is True Negative Values, FP is False Positive and FN is false negative values.
The excellence of the proposed architecture and performance of other existing models are presented in this Section.
The performance of the proposed architecture is validated in four folds. In the first fold, confusion matrix given in Fig. 6 and it is used to verify the performance of the proposed architecture. Additionally Receiver operating characteristics (ROC) given in Fig. 7 and it is used for verifying the performance of the proposed architecture. In the next fold, the performance of the proposed architecture is compared with the other existing models such as Convolutional Neural Networks without Hyper parameter Optimization (CNN-WHO) [40], Optimized Convolutional Features with Support vector machines (CNN-SVM) [41], 3DCNN [42], MTANNs [43], FCN [44], MTCNNN [45] and RFCN [46] by measuring the different performance metrics as mentioned in Tab. 5. Furthermore, the computational complexity is calculated for different optimization algorithm used for tuning the hyper parameters in the proposed architecture. Finally, the performance of the proposed architecture is compared with the state-of art architecture proposed by different authors. The proposed algorithm is tested with the random 1000 Lung CT (50% Benign and 50% Malignant) scan images in order to overcome the imbalance problems.
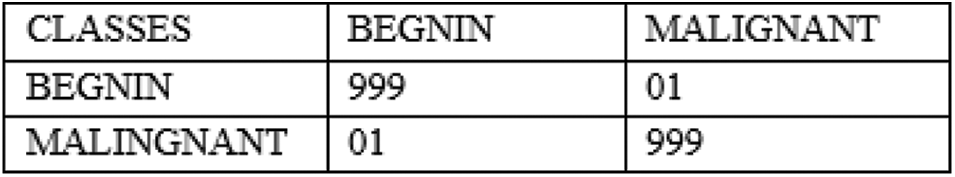
Figure 6: Confusion matrix for the proposed architecture using 1000 random tested images
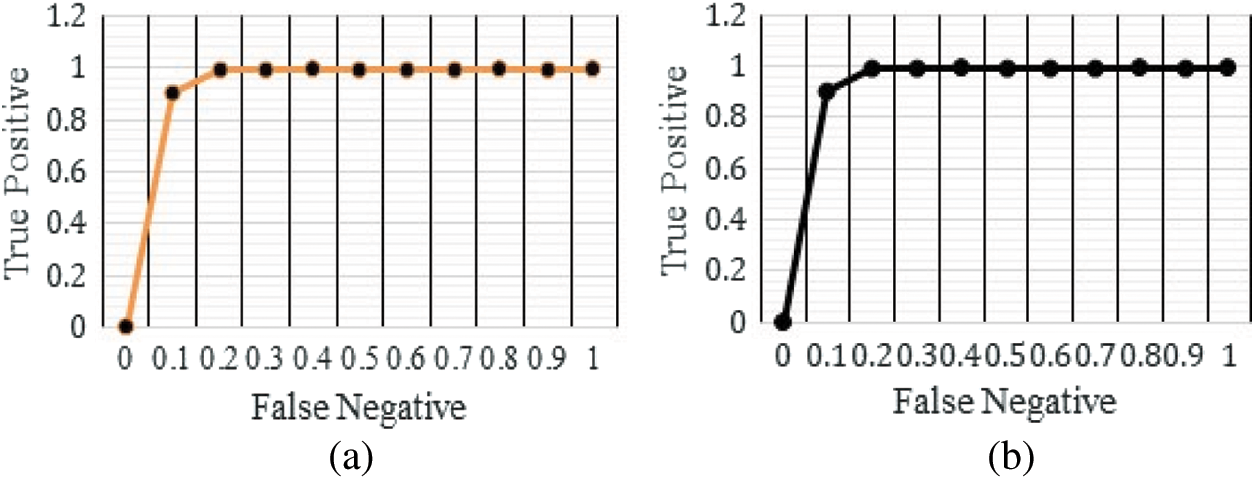
Figure 7: ROC curves for the proposed architecture (a) detection of benign images (b) detection of malignant images
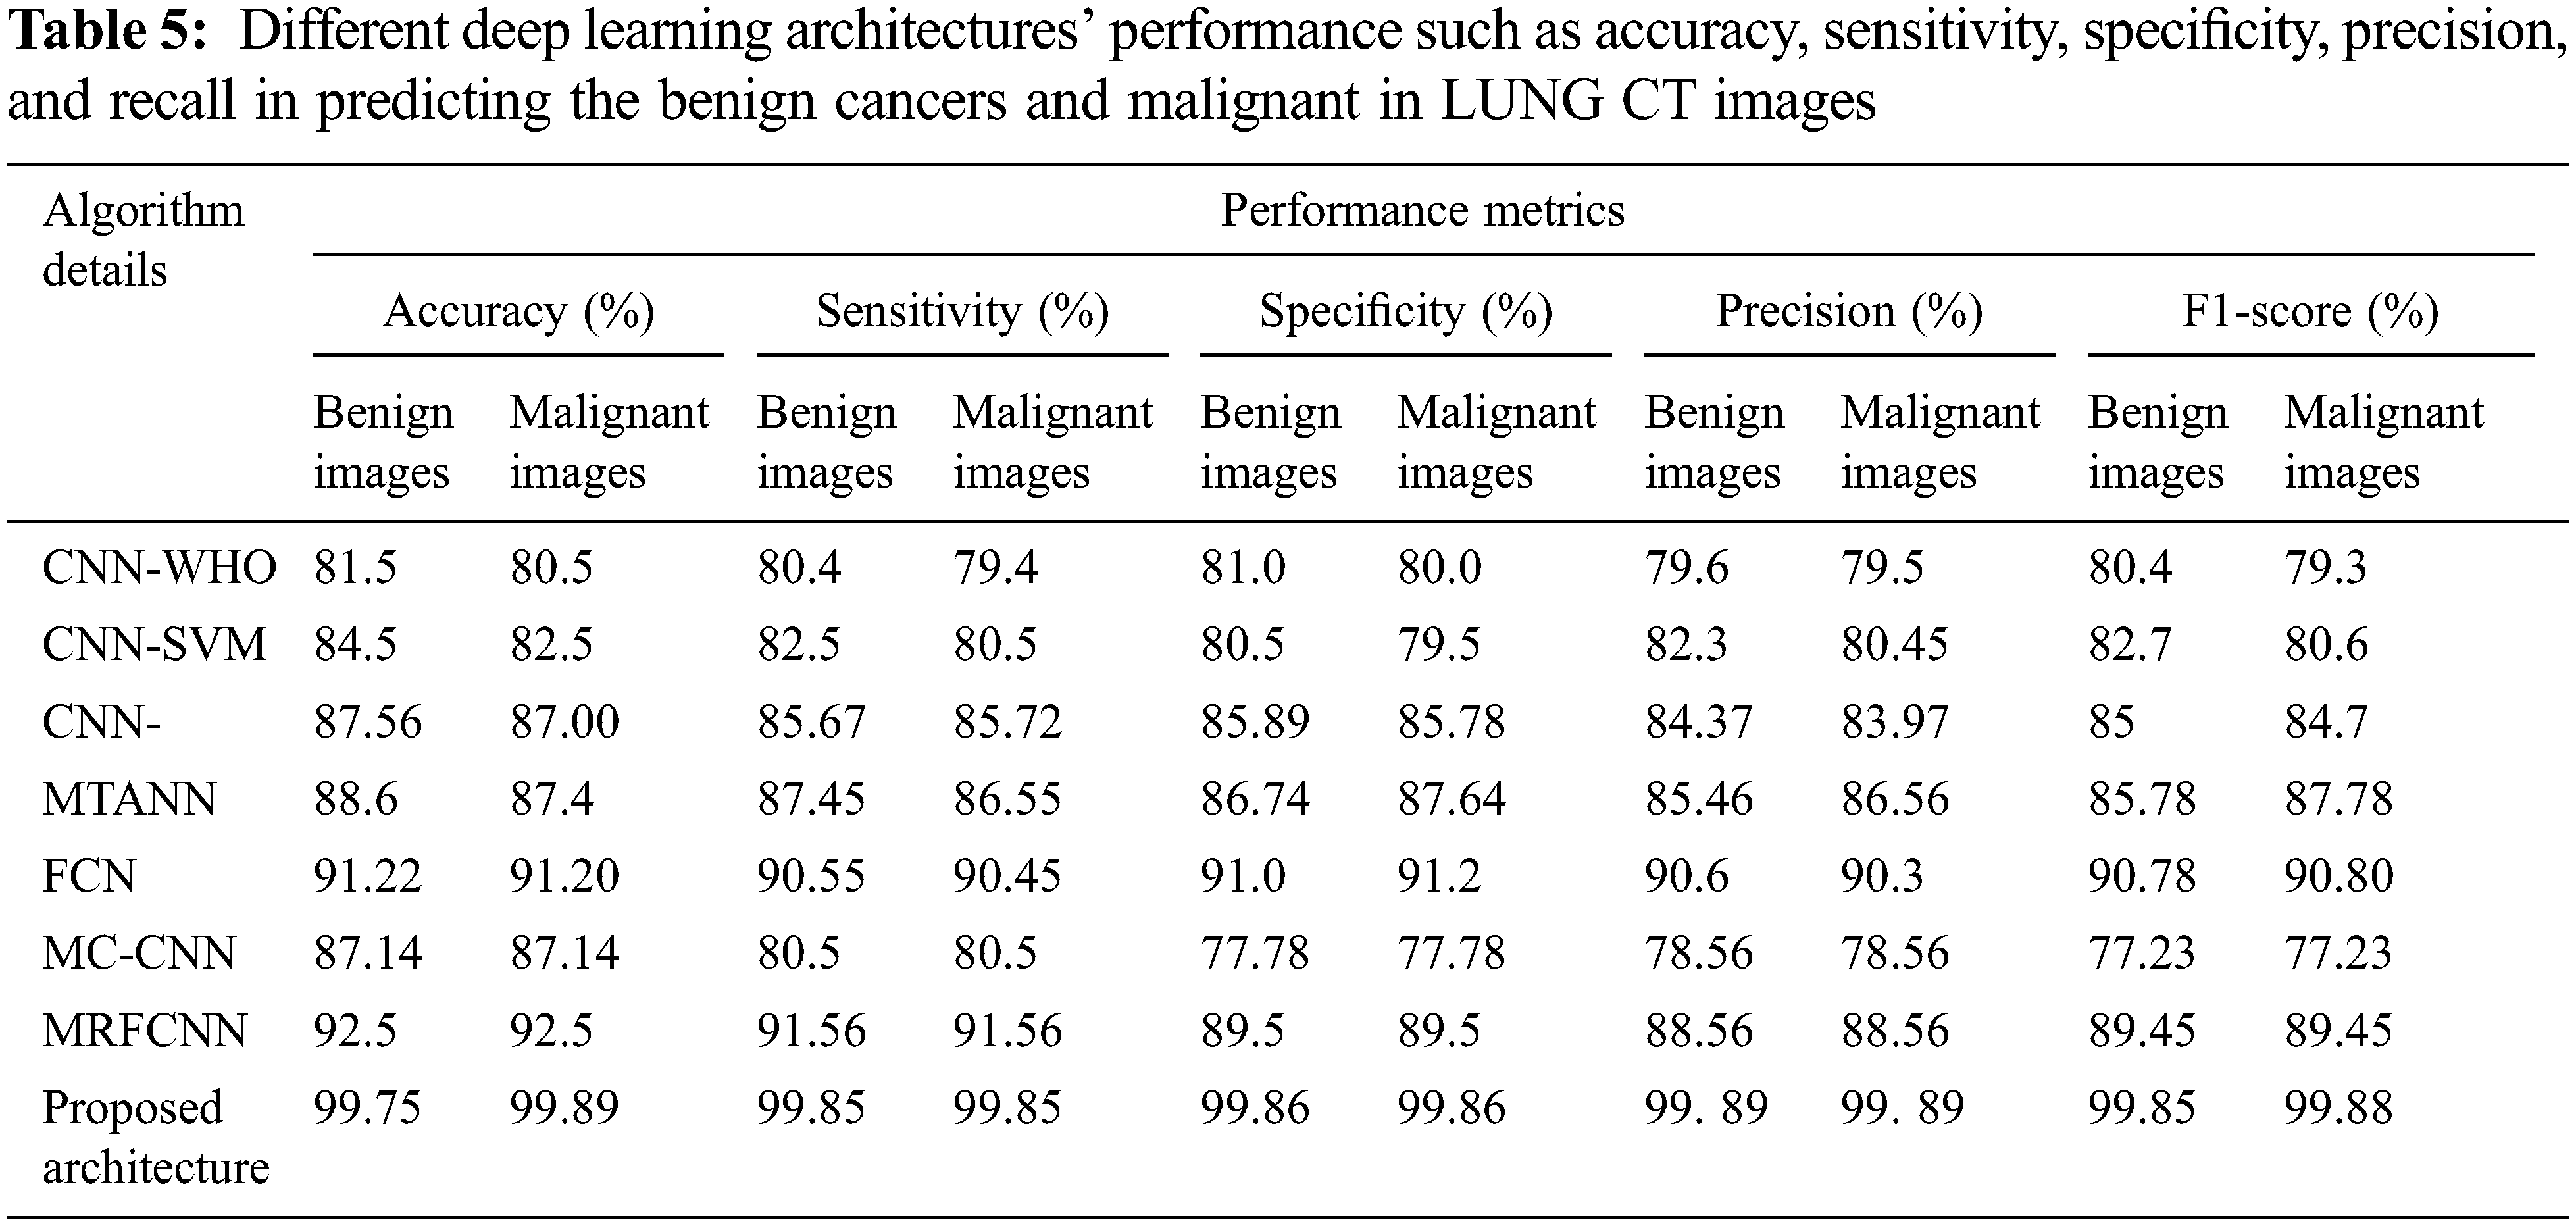
The ROC curve (Fig. 7) of the proposed framework in detecting the categories of CT scan Lung Images. Tab. 5 presents the comparative analysis between the performances of proposed and existing algorithms. From the Tab. 5, it is found that proposed algorithm has shown the accuracy of 99.8% with 99.85% sensitivity, 99.86% specificity and high f1 score of 99.88% in detecting the benign CT images. Also, it is clear that fusion of saliency with optimized deep learning architecture has shown the better detection ratio in which the proposed algorithm performs better than the other existing algorithm. Fig. 8 shows the comparative analysis of average performance between the proposed and existing algorithm. From the Fig. 8, it is also clear that proposed algorithm has outperformed the other existing algorithms.
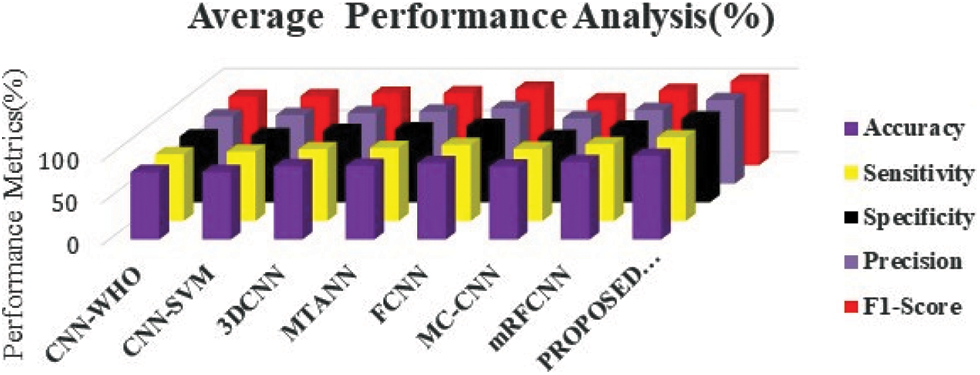
Figure 8: Comparative analysis of average performance metrics of different deep learning framework in predicting the lung cancer in CT images
The computational complexity of the proposed CNN Fusion technique is represented by big-o-notations. The different CNN algorithms are used for evaluation and complexity analysis is presented in Tab. 6. The mathematical expressions for calculating the computational complexity using Big-O-Notation is given by
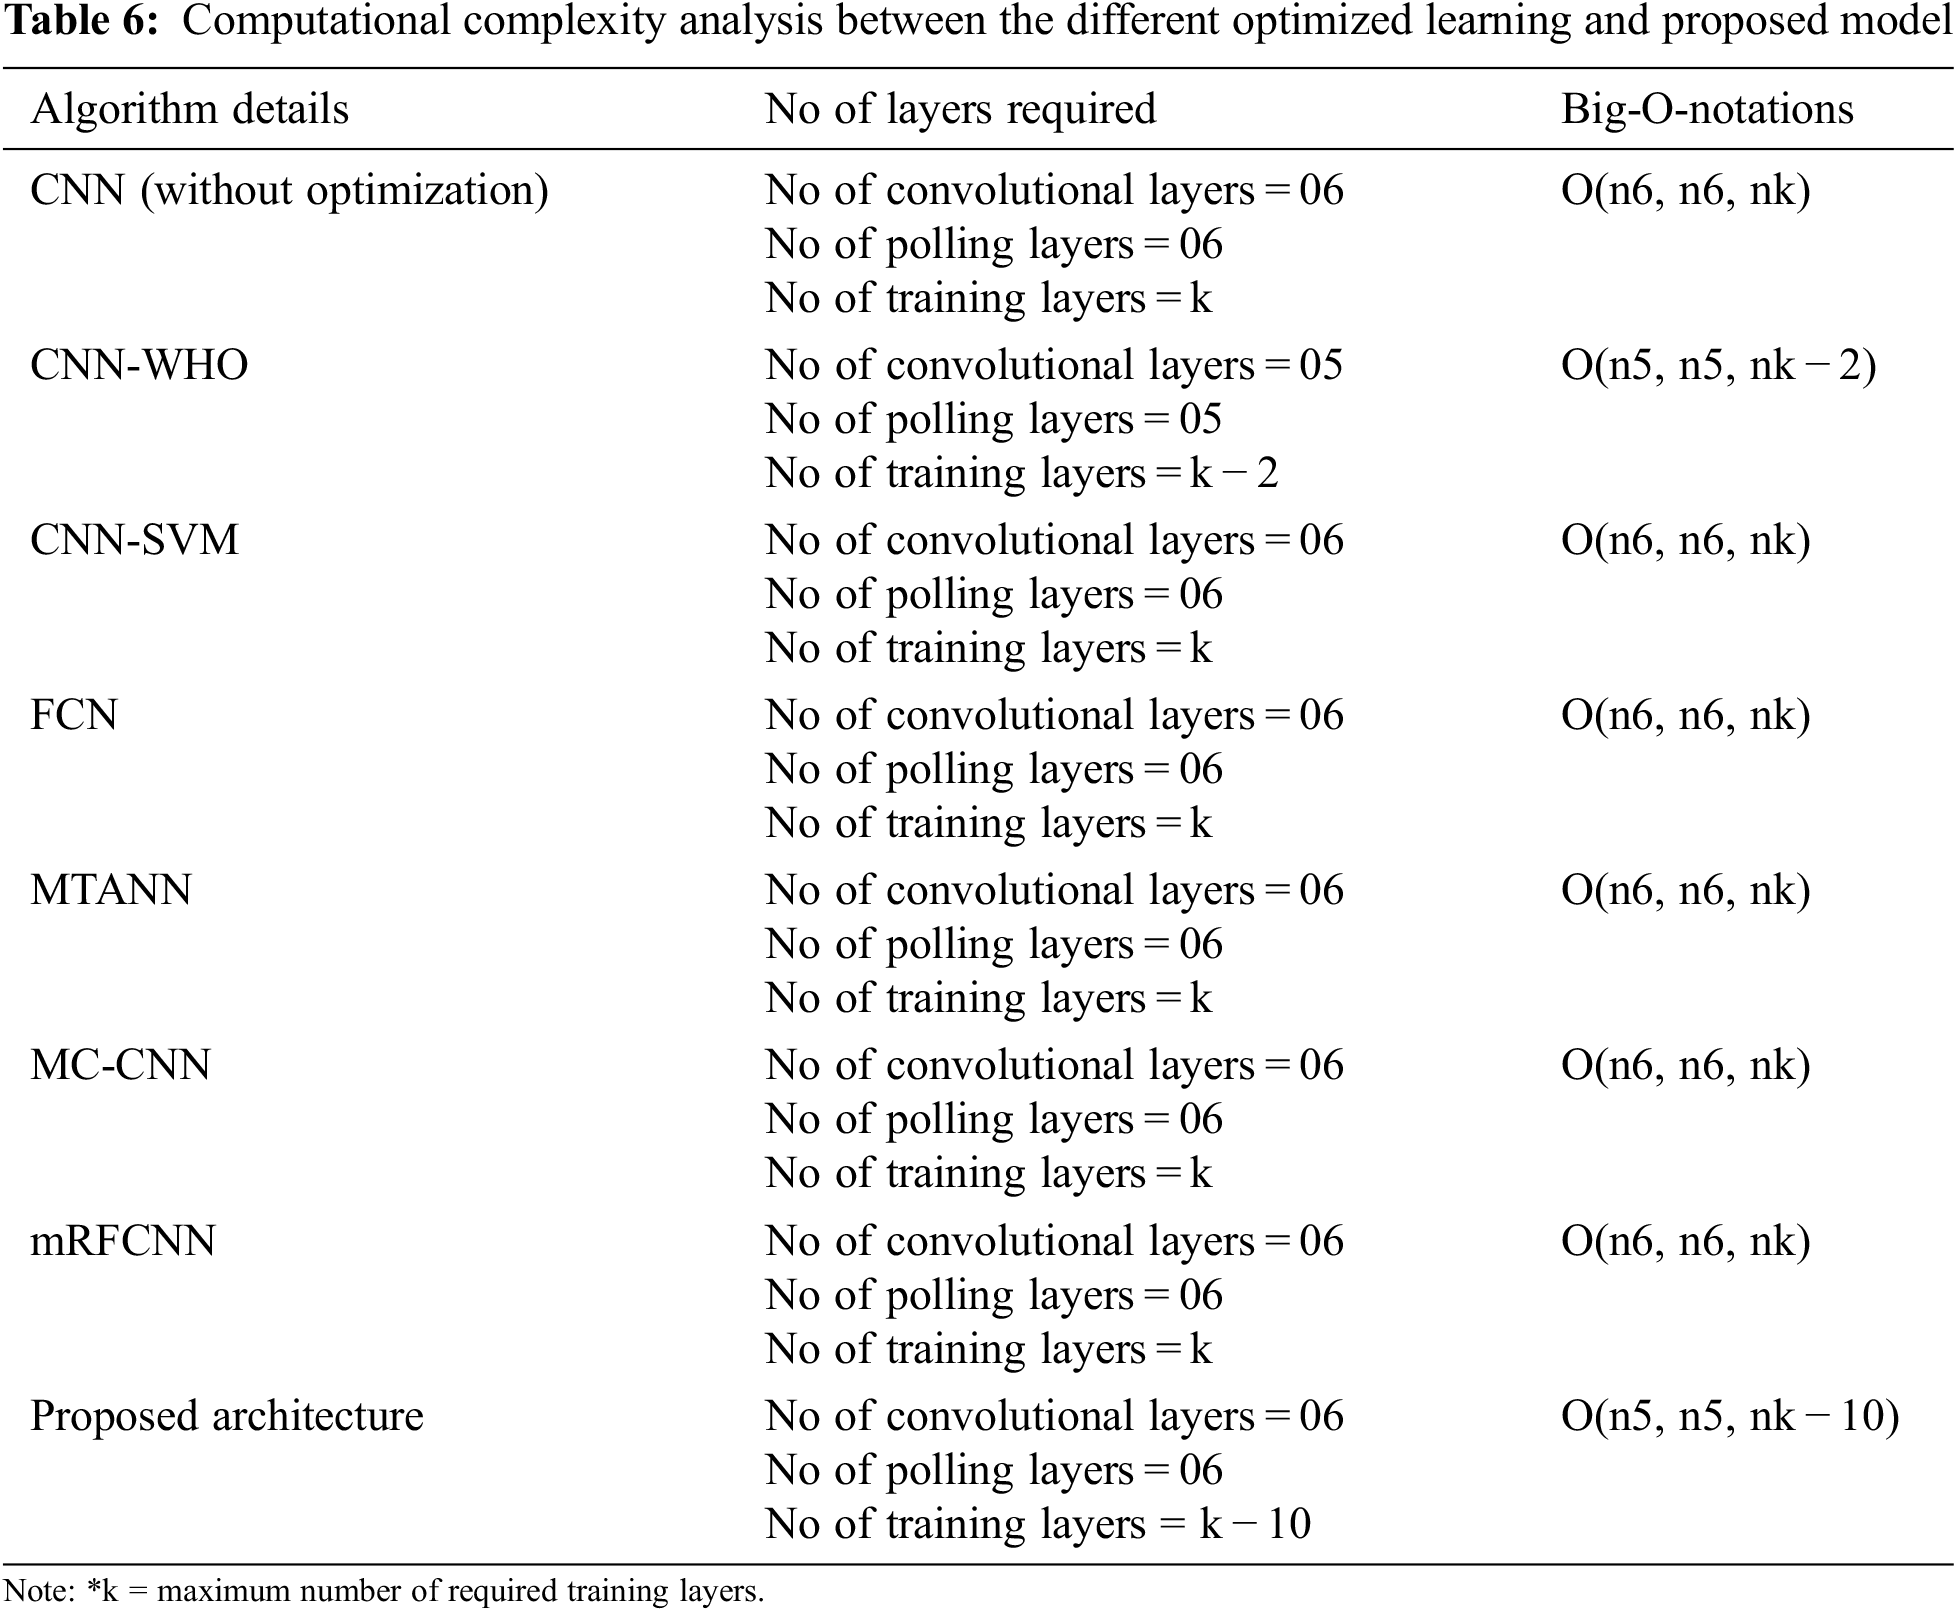
From the Tab. 6, it is found that optimized learning model along with saliency fusion process has produced the less computational complexity which even 10% lesser than the other existing algorithms.
This main objective of the research is to detect and classify the malignant and benign cancer cells using CT Scan Lung Images. To detect the location of cancer cells, this work uses the fusion of saliency maps with deep convolutional layers for an effective segmentation and feature extraction that are used to train the network for the better classification. Additionally, the proposed architecture uses the Ant-Lion optimized Feed Forward Layers for classification of images with the high accuracy and less computational complexity. The proposed algorithm was developed using Tensorflow 1.8 with Keras API and compared with other existing state-of-art architectures. The results shows that the proposed architecture has outperformed the other state-of art architectures and obtained maximum results such as 99.89% accuracy, 99.8% sensitivity and specificity, 99.86% precision and 99.89% F1-score. In future, more vigorous testing is required using the larger real time clinical datasets. Additionally, proposed algorithm needs it improvisation in terms of grading the images based on the malignant characteristics of lung cancers, which will play significant role for the diagnosis and accurate treatment of lung cancer in clinical applications.
Funding Statement: The authors received no specific funding for this study.
Conflicts of Interest: The authors declare that they have no conflicts of interest to report regarding the present study.
1. S. Bharati, P. Podder, R. Mondal, A. Mahmood and M. Raihan-Al-Masud, “Comparative performance analysis of different classification algorithm for the purpose of classification of lung cancer,” in Proc. of 18th Int. Conf. on ISDA 2018, Vellore, India, pp. 447–457, 2018. [Google Scholar]
2. N. Coudray, P. S. Ocampo, T. Sakellaropoulos, N. Narula, M. Snuderl et al., “Classification and mutation classification from non–small cell lung cancer histopathology images using deep learning,” Nature Medicine, vol. 24, pp. 1559–1567, 2018. [Google Scholar]
3. L. Nie, M. Wang, L. Zhang, S. Yan, B. Zhang et al., “Disease inference from health-related questions via sparse deep learning,” IEEE Transactions on Knowledge and Data Engineering, vol. 27, no. 8, pp. 2107–2119, 2015. [Google Scholar]
4. L. Nie, L. Zhang, Y. Yang, M. Wang, R. Hong et al., “Beyond doctors: Future health classification from multimedia and multimodal observations,” in MM’15: Proc. of the 23rd ACM Int. Conf. on Multimedia, Brisbane, Australia, pp. 591–600, 2015. [Google Scholar]
5. W. Sun, B. Zheng and W. Qian, “Computer aided lung cancer diagnosis with deep learning algorithms,” in Proc. of SPIE 9785, Medical Imaging 2016: Computer-Aided Diagnosis, 97850Z, San Diego, California, USA, pp. 1–8, 2016. [Google Scholar]
6. Z. H. Zhou, Y. Jiang, Y. B. Yang and S. F. Chen, “Lung cancer cell identification based on artificial neural network ensembles,” Artificial Intelligence in Medicine, vol. 24, pp. 25–36, 2002. [Google Scholar]
7. B. U. Dhaware and A. C. Pise, “Lung cancer detection using Bayesian classifier and FCM segmentation,” in Proc. Int. Conf. on Automatic Control and Dynamic Optimization Techniques, Pune, India, pp. 170–174, 2016. [Google Scholar]
8. G. L. F. da Silva, A. O. de Carvalho Filho, A. C. Silva, A. C. de Paiva and M. Gattass, “Taxonomic indexes for differentiating malignancy of lung nodules on CT images,” Research on Biomedical Engineering, vol. 32, no. 3, pp. 263–272, 2016. [Google Scholar]
9. S. C. Park, J. Tan, X. Wang, D. Lederman, J. K. Leader et al., “Computer-aided detection of early interstitial lung diseases using low-dose CT images,” Physics in Medicine and Biology, vol. 56, no. 4, pp. 1139–1153, 2011. [Google Scholar]
10. Q. Z. Song, L. Zhao, X. K. Luo and X. C. Dou, “Using deep learning for classification of lung nodules on computed tomography images,” Journal of Healthcare Engineering, vol. 2017, pp. 1–7, 2017. [Google Scholar]
11. S. Ignatious and R. Joseph, “Computer aided lung cancer detection system,” in Proc. of IEEE GCCT, Thuckalay, India, pp. 555–558, 2015. [Google Scholar]
12. M. de Bruijne, “Machine learning approaches in medical image analysis: From detection to diagnosis,” Medical Image Analysis, vol. 33, pp. 94–97, 2016. [Google Scholar]
13. A. Jindal, G. S. Aujla, N. Kumar, R. Chaudhary, M. S. Obaidat et al., “Sedative: SDN-enabled deep learning architecture for network traffic control in vehicular cyber-physical systems,” IEEE Network, vol. 32, no. 6, pp. 66–73, 2018. [Google Scholar]
14. J. Nalepa and M. Kawulok, “Selecting training sets for support vector machines: A review,” Artificial Intelligence Review, vol. 52, no. 2, pp. 857–900, 2019. [Google Scholar]
15. N. Ganesan, K. Venkatesh, M. A. Rama and A. M. Palani, “Application of neural networks in diagnosing cancer disease using demographic data,” International Journal of Computer Applications, vol. 1, no. 26, pp. 76–85, 2010. [Google Scholar]
16. A. Singh, G. S. Aujla, S. Garg, G. Kaddoum and G. Singh, “Deep learning-based SDN model for internet of things: An incremental tensor train approach,” IEEE Internet of Things Journal, vol. 7, no. 7, pp. 6302–6311, 2020. [Google Scholar]
17. D. Shen, G. Wu and H. I. Suk, “Deep learning in medical image analysis,” Annual Review of Biomedical Engineering, vol. 19, pp. 221–248, 2017. [Google Scholar]
18. K. Suzuki, “Overview of deep learning in medical imaging,” Radiological Physics and Technology, vol. 10, no. 3, pp. 257–273, 2017. [Google Scholar]
19. S. Bharati, P. Podder and M. R. H. Mondal, “Hybrid deep learning for detecting lung diseases from x-ray images,” Informatics in Medicine Unlocked, vol. 20, pp. 100391, 2020. [Google Scholar]
20. G. Jothi and H. H. Inbarani, “Soft set based feature selection approach for lung cancer images,” Computing Research Repository, vol. abs/1212.5391, pp. 1–7, 2012. [Google Scholar]
21. A. Masood, P. Yang, B. Sheng, H. Li, P. Li et al., “Cloud-based automated clinical decision support system for detection and diagnosis of lung cancer in chest CT,” IEEE Journal of Translational Engineering in Health and Medicine, vol. 8, pp. 1–13, 2020. [Google Scholar]
22. M. Anthimopoulos, S. Christodoulidis, L. Ebner, A. Christe and S. Mougiakakou, “Lung pattern classification for interstitial lung diseases using a deep convolutional neural network,” IEEE Transactions on Medical Imaging, vol. 35, no. 5, pp. 1207–1216, 2016. [Google Scholar]
23. G. Jakimovski and D. Davcev, “Using double convolution neural network for lung cancer stage detection,” Applied Sciences, vol. 9, no. 3, pp. 427, 2019. [Google Scholar]
24. H. Yu, Z. Zhou and Q. Wang, “Deep learning assisted predict of lung cancer on computed tomography images using the adaptive hierarchical heuristic mathematical model,” IEEE Access, vol. 8, pp. 86400–86410, 2020. [Google Scholar]
25. A. Asuntha and A. Srinivasan, “Deep learning for lung cancer detection and classification,” Multimedia Tools and Applications, vol. 79, pp. 7731–7762, 2020. [Google Scholar]
26. D. Chauhan and V. Jaiswal, “An efficient data mining classification approach for detecting lung cancer disease,” in Proc. Int. Conf. on Communication and Electronics Systems, Coimbatore, India, pp. 1–8, 2016. [Google Scholar]
27. P. M. Shakeel, M. A. Burhanuddin and M. I. Desa, “Automatic lung cancer detection from CT image using improved deep neural network and ensemble classifier,” Neural Computing and Applications, 2020. https://doi.org/10.1007/s00521-020-04842-6. [Google Scholar]
28. D. M. Wong, C. Y. Fang, L. Y. Chen, C. I. Chiu, T. I. Chou et al., “Development of a breath detection method based e-nose system for lung cancer identification,” in Proc. IEEE Int. Conf. on Applied System Invention, Chiba, Japan, pp. 1119–1120, 2018. [Google Scholar]
29. Y. Xie, Y. Xia, J. Zhang, Y. Song, D. Feng et al., “Knowledge-based collaborative deep learning for benign-malignant lung nodule classification on chest CT,” IEEE Transactions on Medical Imaging, vol. 38, no. 4, pp. 991–1004, 2019. [Google Scholar]
30. Vikas and P. Kaur, “Lung cancer detection using chi-square feature selection and support vector machine algorithm,” International Journal of Advanced Trends in Computer Science and Engineering, vol. 10, no. 3, pp. 2050–2060, 2021. https://doi.org/10.30534/ijatcse/2021/801032021. [Google Scholar]
31. S. C. Pei and Y. Z. Hsiao, “Spatial affine transformations of images by using fractional shift Fourier transform,” in Proc. IEEE Int. Symp. on Circuits and Systems, Lisbon, Portugal, pp. 1586–1589, 2015. [Google Scholar]
32. S. Banerjee, S. Mitra, B. U. Shankar and Y. Hayashi, “A novel GBM saliency detection model using multi-channel MRI,” Plos One, vol. 11, no. 1, pp. e0146388, 2016. [Google Scholar]
33. P. Takácsand and A. Manno-Kovacs, “MRI brain tumor segmentation combining saliency and convolutional network features,” in Proc. Int. Conf. on CBMI, La Rochelle, France, pp. 1–6, 2018. [Google Scholar]
34. O. Ronneberger, P. Fischer and T. Brox, “U-Net: Convolutional networks for biomedical image segmentation,” in Proc. Int. Conf. on Medical Image Computing and Computer-Assisted Intervention, Munich, Germany, pp. 234–241, 2015. [Google Scholar]
35. G. Wang, W. Li, S. Ourselin and T. Vercauteren, “Automatic brain tumor segmentation using cascaded anisotropic convolutional neural networks,” in Proc. BrainLes, Quebec City, QC, Canada, pp. 178–190, 2017. [Google Scholar]
36. G. B. Huang, Q. Y. Zhu and C. K. Siew, “Extreme learning machine: Theory and applications,” Neurocomputing, vol. 70, no. 1–3, pp. 489–501, 2006. [Google Scholar]
37. B. Wang, S. Huang, J. Qiu, Y. Liu and G. Wang, “Parallel online sequential extreme learning machine based on map reduce,” Neurocomputing, vol. 149, no. A, pp. 224–232, 2015. [Google Scholar]
38. A. S. Assiri, A. G. Hussien and M. Amin, “Ant lion optimization: Variants, hybrids, and applications,” IEEE Access, vol. 8, pp. 77746–77764, 2020. [Google Scholar]
39. S. G. Armato III, G. McLennan, L. Bidaut, M. F. McNitt-Gray, C. R. Meyer et al., “Data from LIDC-IDRI [data set],” The Cancer Imaging Archive, 2015. https://doi.org/10.7937/K9/TCIA.2015.LO9QL9SX. [Google Scholar]
40. M. Tan, R. Deklerck, B. Jansen, M. Bister and J. Cornelis, “A novel computer-aided lung nodule detection system for CT images,” Medical Physics, vol. 38, no. 10, pp. 5630–5645, 2011. [Google Scholar]
41. B. K. Hatuwal and H. C. Thapa, “Lung cancer detection using convolutional neural network on histopathological images,” International Journal of Computer Trends and Technology, vol. 68, no. 10, pp. 21–24, 2020. [Google Scholar]
42. S. Ren, K. He, R. Girshick and J. Sun, “Faster R-CNN: Towards real-time object detection with region proposal networks,” IEEE Transactions on Pattern Analysis and Machine Intelligence, vol. 39, no. 6, pp. 1137–1149, 2017. [Google Scholar]
43. B. Ginneken, A. A. A. Setio, C. Jacobs and F. Ciompi, “Off-the-shelf convolutional neural network features for pulmonary nodule detection in computed tomography scans,” in Proc. IEEE Int. Symp. on Biomedical Imaging, Brooklyn, NY, USA, pp. 286–289, 2015. [Google Scholar]
44. D. Kumar, A. Wong and D. A. Clausi, “Lung nodule classification using deep features in CT images,” in Proc. of 12th Conf. on Computer and Robot Vision, Halifax, NS, Canada, pp. 133–138, 2015. [Google Scholar]
45. W. Shen, M. Zhou, F. Yang, D. Yu, D. Dong et al., “Multi-crop convolutional neural networks for lung nodule malignancy suspiciousness classification,” Pattern Recognition, vol. 61, pp. 663–673, 2017. [Google Scholar]
46. A. Masood, B. Sheng, P. Yang, P. Li, H. Li et al., “Automated decision support system for lung cancer detection and classification via enhanced RFCN with multilayer fusion RPN,” IEEE Transactions on Industrial Informatics, vol. 16, no. 12, pp. 7791–7801, 2020. [Google Scholar]
 | This work is licensed under a Creative Commons Attribution 4.0 International License, which permits unrestricted use, distribution, and reproduction in any medium, provided the original work is properly cited. |