DOI:10.32604/iasc.2022.025073
| Intelligent Automation & Soft Computing DOI:10.32604/iasc.2022.025073 | |
| Article |
Practical Machine Learning Techniques for COVID-19 Detection Using Chest X-Ray Images
Department of Computer Engineering, King Mongkut’s University of Technology Thonburi, Bangkok, 10140, Thailand
*Corresponding Author: Naruemon Wattanapongsakorn. Email: naruemon.wat@kmutt.ac.th
Received: 10 November 2021; Accepted: 07 January 2022
Abstract: This paper presents effective techniques for automatic detection/classification of COVID-19 and other lung diseases using machine learning, including deep learning with convolutional neural networks (CNN) and classical machine learning techniques. We had access to a large number of chest X-ray images to use as input data. The data contains various categories including COVID-19, Pneumonia, Pneumothorax, Atelectasis, and Normal (without disease). In addition, chest X-ray images with many findings (abnormalities and diseases) from the National Institutes of Health (NIH) was also considered. Our deep learning approach used a CNN architecture with VGG16 and VGG19 models which were pre-trained with ImageNet. We compared this approach with the classical machine learning approaches, namely Support Vector Machine (SVM) and Random Forest. In addition to independently extracting image features, pre-trained features obtained from a VGG19 model were utilized with these classical machine learning techniques. Both binary and categorical (multi-class) classification tasks were considered on classical machine learning and deep learning. Several X-ray images ranging from 7000 images up to 11500 images were used in each of our experiments. Five experimental cases were considered for each classification model. Results obtained from all techniques were evaluated with confusion matrices, accuracy, precision, recall and F1-score. In summary, most of the results are very impressive. Our deep learning approach produced up to 97.5% accuracy and 98% F1-score on COVID-19 vs. non-COVID-19 (normal or diseases excluding COVID-19) class, while in classical machine learning approaches, the SVM with pre-trained features produced 98.9% accuracy, and at least 98.2% precision, recall and F1-score on COVID-19 vs. non-COVID-19 class. These disease detection models can be deployed for practical usage in the near future.
Keywords: COVID-19; deep learning; image classification; lung disease; machine learning; pneumonia; pretrained features
In late 2019, China experiences an outbreak of a new disease called SARS-CoV-2 or COVID-19. Among other symptoms, the disease can cause serious damage to the lungs of infected patients. The number of patients has been increasing rapidly. As of October 2021, over 240 million cases have been detected [1]. Of all the cases, there are 4.9 million death cases. The World Health Organization (WHO) has declared this disease a pandemic. So, there is an urgent need for an easy and simple way to detect the suspected COVID-19 symptoms as soon as possible. Chest X-ray image analysis is one of the main methods to detect lung disease including COVID-19. The image detection requires a radiologist together with a medical doctor to perform a diagnosis.
Artificial intelligence (AI) has shown great promise in image identification and classification tasks. Machine learning is one AI area that includes many methods for image detection and classification. One of the popular methods is called deep learning. It is built with a multi-layer network that can be trained using input data. A convolutional neural network (CNN) is one of the deep learning methods. It has great success in classifying spatial data is and usually used for recognizing images. CNN combines feature extraction and classification in one workflow. Other machine learning techniques require feature extraction as an additional step before performing detection/classification. However, the classical machine learning methods can also be successful in image classification.
Given the critical importance of COVID-19 diagnosis, there has been a wealth of recent research applying artificial intelligence for chest X-ray image diagnosis. Arias-Londoño et al. [2] used CNN for chest X-ray classification. The experimental corpus held many chest X-ray images in 3 classes which are COVID-19, pneumonia, and others as shown in Tab. 1. Normal data (without disease) was not included. The best accuracy was obtained with 91.67% accuracy. Khan et al. [3] proposed the classification using Xception CNN architecture with 71 layers deep. The dataset contained 290 COVID-19 images, 1203 normal images and 1653 pneumonia images. The best experiment used a binary classification model which obtained 99% accuracy. Another CNN model was used with a decision tree classifier proposed by Vinod et al. [4]. The model produced 87% of accuracy and 93% of recall. Later, Abbas et al. [5] proposed a framework combining Decomposition, Transfer learning, and Composition (DeTraC). The dataset contained a total of 196 X-ray images having 3 classes which were normal, COVID-19, and SARS. The final classification was done with VGG19 architecture. The model produced 97.35% accuracy. Sedik et al. [6] proposed CNN and other deep learning techniques. The methods were tested on a dataset of 56 COVID-19 and 56 non-COVID-19 images. The dataset was augmented by 10-fold before using in the model. This research produced up to 99% accuracy. Multiple architectures of CNN were tested by Kamil [7]. All architectures used transfer learning techniques so that they could be learned quickly. The dataset combined 23 CT images and 977 Chest X-ray images (with 195 COVID-19 images) in 2 classes, normal and COVID-19. The VGG19 model gave the highest accuracy of 99%. Rangarajan et al. [8] proposed a classification model using 2 data augmentation methods. The first method used flipping and rotation of the image, while the second method used a generative adversarial network [9] to create synthetic images. The researchers compared 5 classification models, where the best model is VGG16 with accuracy of 98.6%. Morís et al. [10] improved the COVID-19 screening with portable chest X-ray images using cycle-generative adversarial networks to generate synthetic images. The classification task was to classify the COVID-19 class and non-COVID-19 class where the ResNet-9 model gave the highest accuracy of 98.61%.
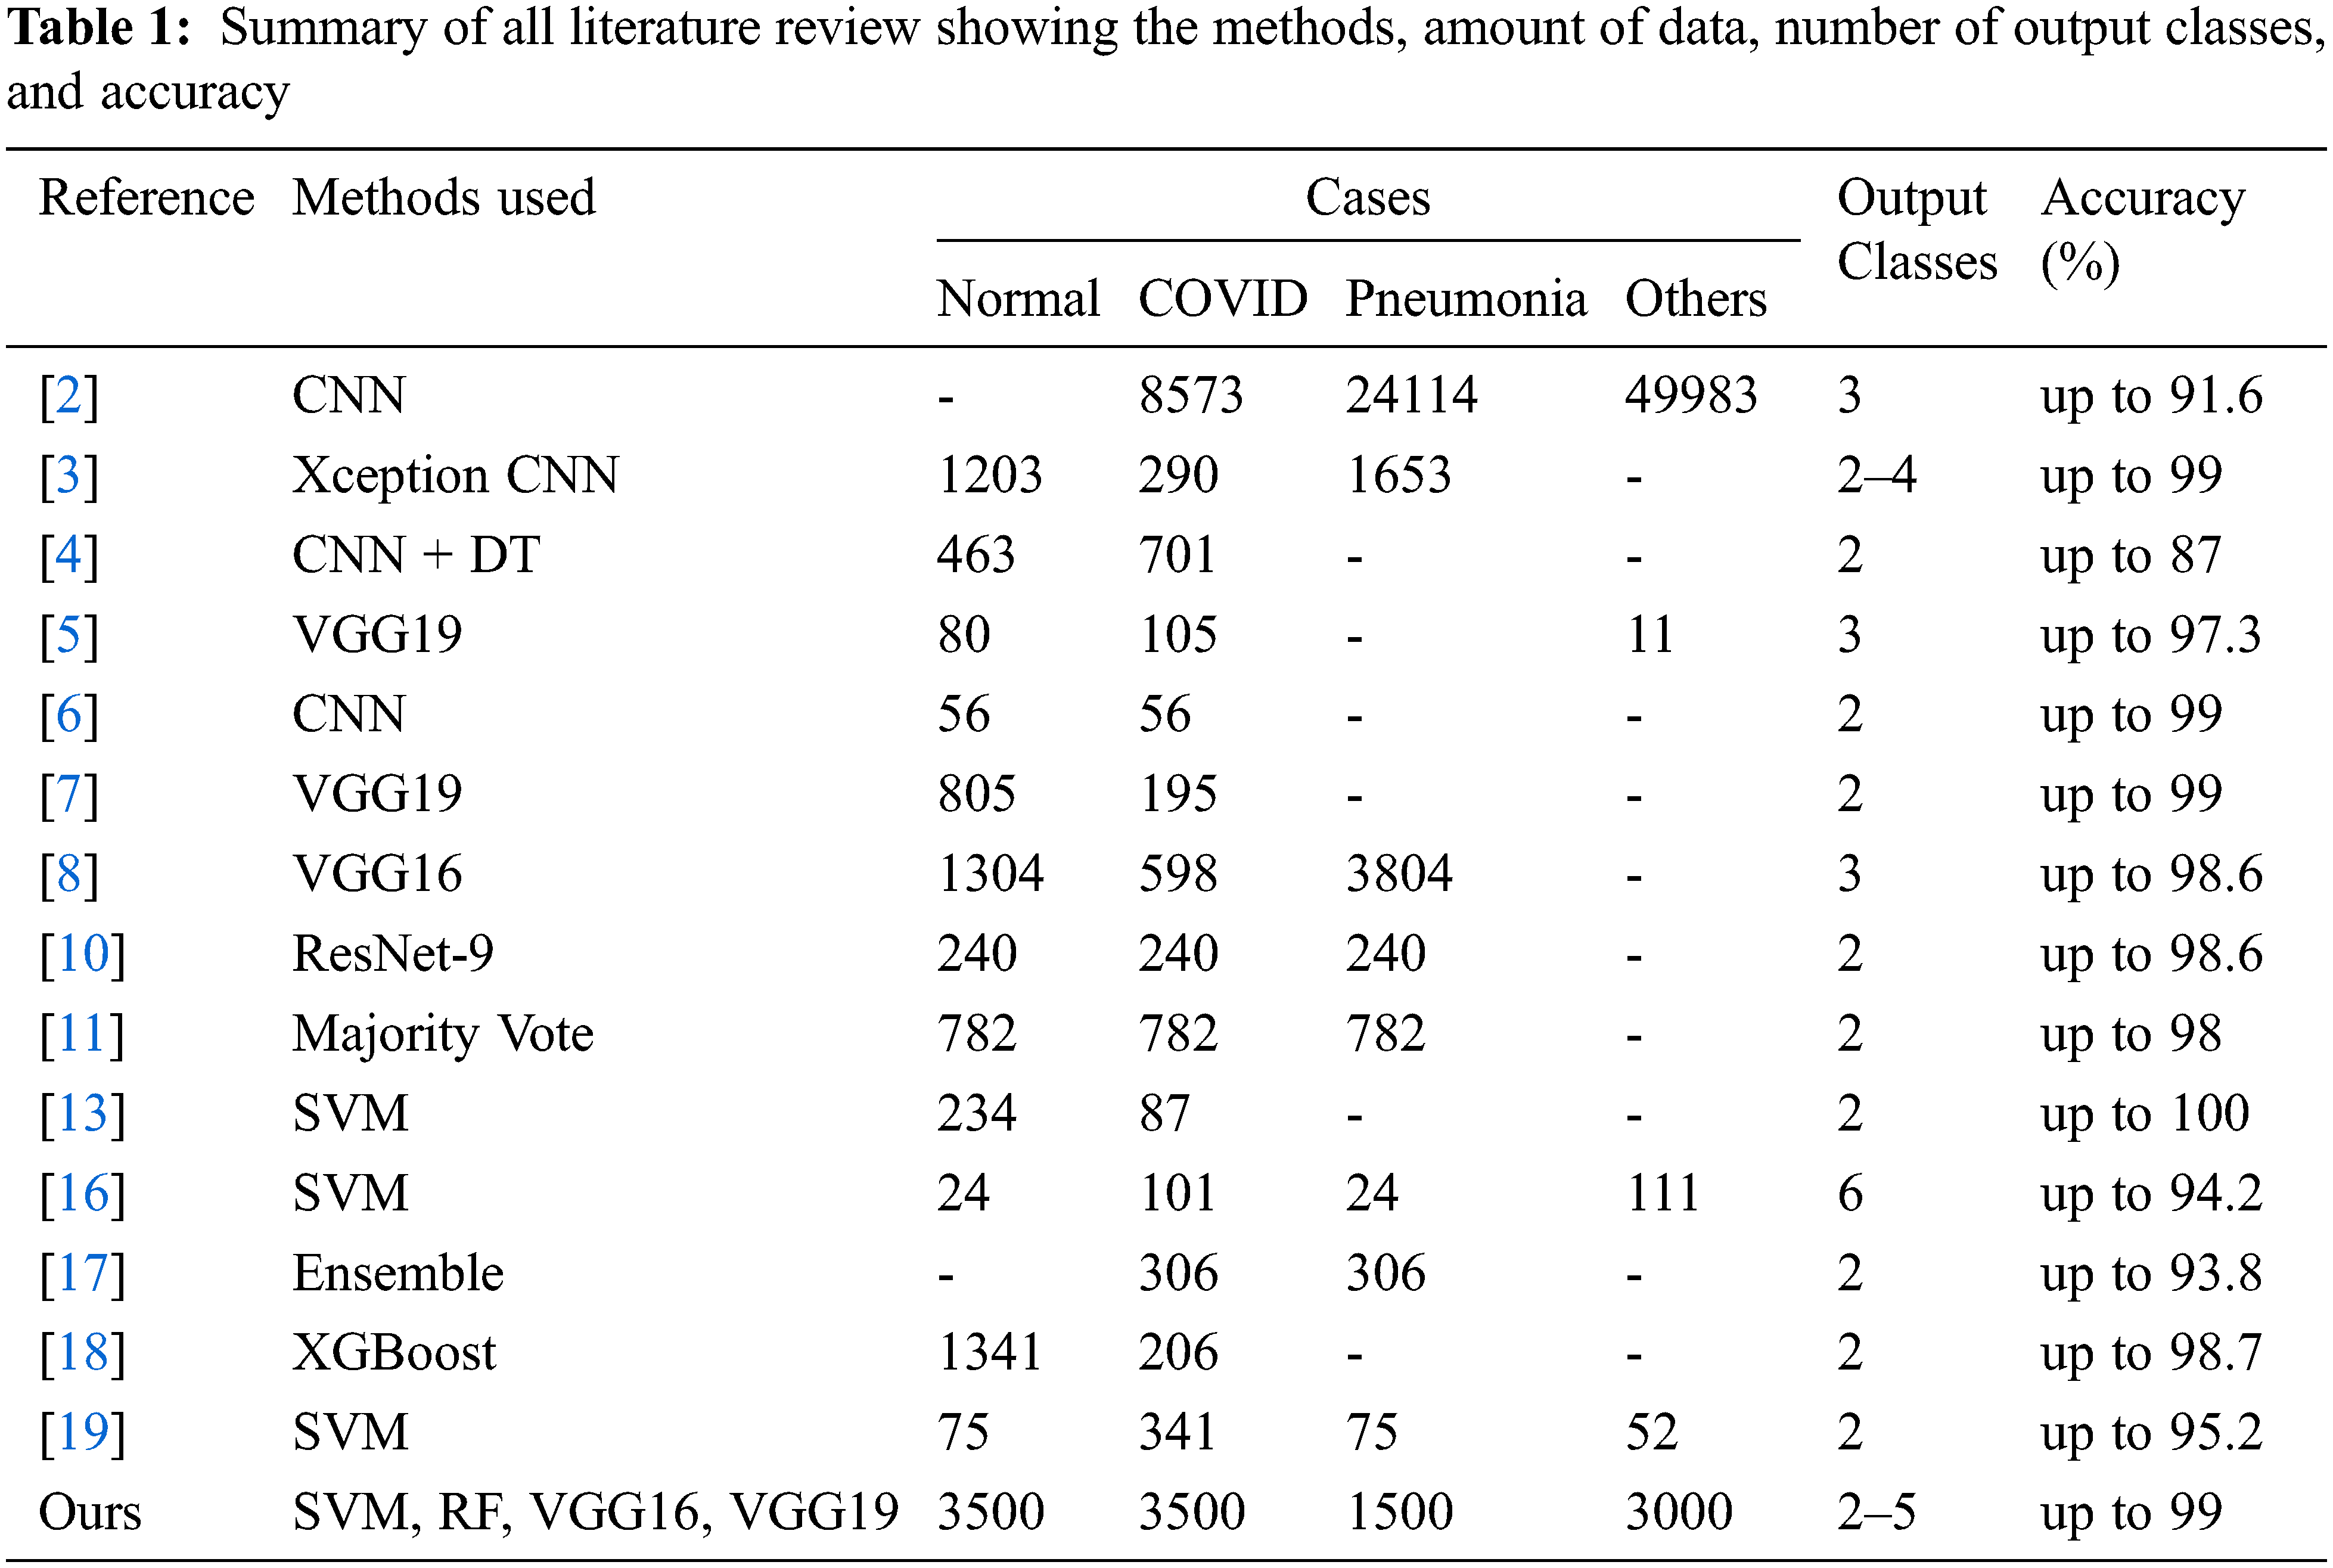
Many recent research publications have presented classical machine learning techniques for COVID-19 chest X-ray image detection/classification as well. Majority voting-based techniques were deployed to predict the result by Chandra et al. [11], where classical machine learning models were used to predict the disease classes of chest X-ray images. This research used 3 feature extraction methods to select the significant features [12]. The research obtained 98% accuracy on normal vs. abnormal, and 91% accuracy on pneumonia vs. COVID-19. Tuncer et al. [13] used Local Binary Pattern feature extraction [14] and ReliefF feature selection [15]. A Support Vector Machine (SVM) classifier obtained 100% accuracy. Öztürk [16] also presented an SVM classifier considering both CT X-ray and chest X-ray images using shrunken features. The best accuracy obtained was 94.23%. Lastly, CT X-ray image classification was performed by Ardakani et al. [17] using different techniques, where the dataset used only COVID-19 and pneumonia images with a total of 612 images. The research presented 5 classification models, where the best model was an ensemble model using 4 of the models to predict the result with accuracy of 93.85%. Júnior et al. [18] used deep features from 3 architectures, VGG19, Inception-v3, and ResNet50 as input of XGBoost classifier. The performance of classifying normal and COVID-19 classes gave 98.71% accuracy. Tamal et al. [19] used radiomic features as input in SVM classifier. The radiomic features are special features extracted from radiographic medical images [20]. The classification output classes are COVID-19 and non-COVID-19 with 95.2% accuracy. Tab. 1 summarizes these previous research works.
In summary, both classical machine learning techniques and deep learning techniques were considered for COVID-19 detection/classification. However, most of this previous research used a small number of COVID-19 chest X-ray images together with a few hundreds of normal images. Mainly, they considered binary class classification. A few papers considered 3-class classification using input data containing a few disease types; COVID-19 and pneumonia.
In our work, we want to be able to identify multiple lung diseases, particularly COVID-19 against others. We use a large amount of data (at least 1500 images per disease) compared to the previous research to improve the detection/classification results and make them more reliable and robust. Multiple reliable datasets with various lung diseases are applied. We also want to directly compare the detection/classification performance of deep learning and classical machine learning techniques. Since some research papers have reported only overall detection accuracy, we want to perform a more extensive evaluation that considers the full confusion matrix as well as other measures. Finally, we want to compare results from binary class classification with multi-class classification. The framework of this work is shown in Fig. 1.
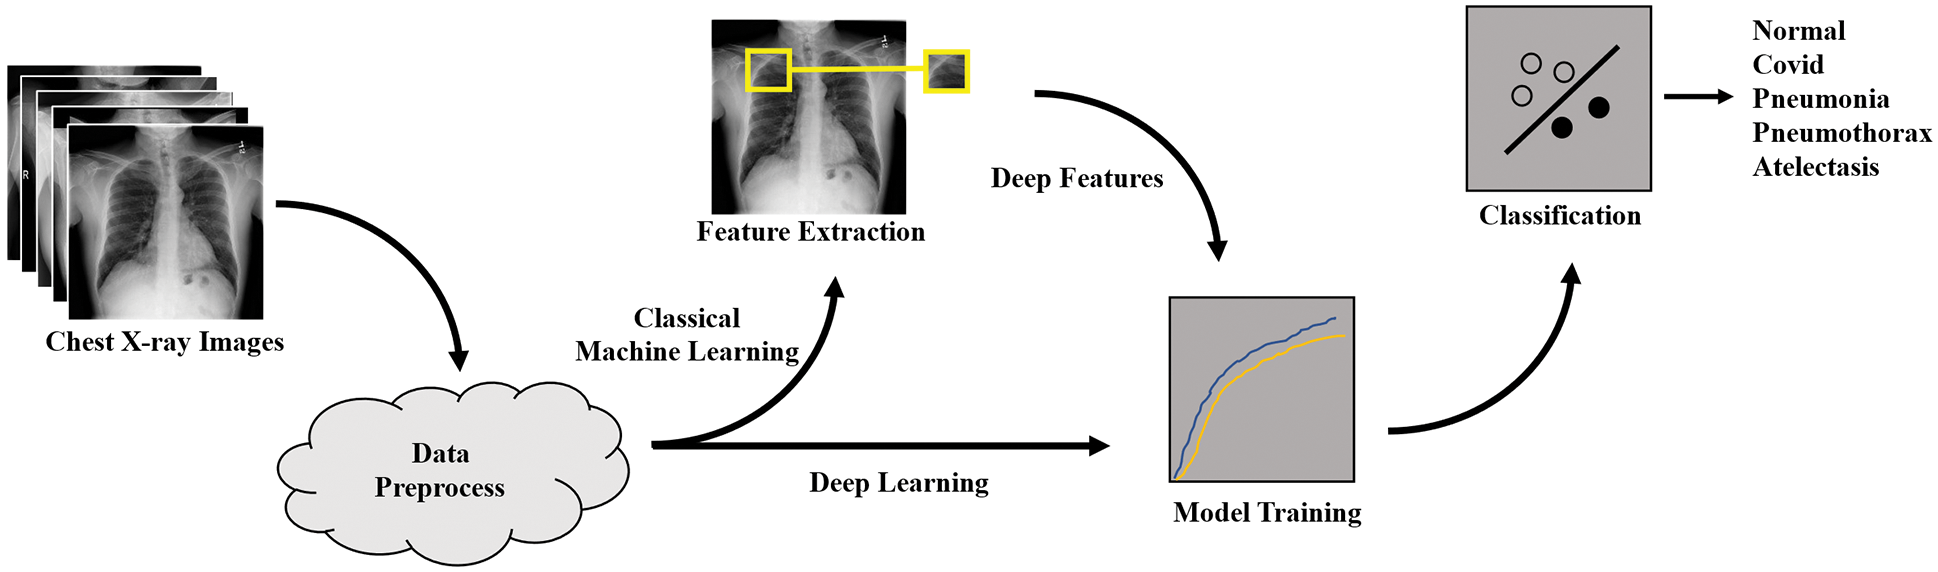
Figure 1: Proposed method framework
The main contributions of this paper are as follows.
■ Consider and evaluate both deep learning techniques and classical machine learning (ML) techniques for binary-class and multi-class classification. Many experimental cases are presented.
■ Apply pre-trained CNN models to speed up the training process and produce high detection/classification accuracy.
■ Apply pre-trained features from deep learning models to classical ML techniques to produce higher detection/classification accuracy than when using previously proposed feature extraction and selection techniques.
■ Provide up to 97.5% accuracy and 98% F1-score of COVID-19 detection against various lung diseases and normal using the proposed deep learning models.
■ Provide up to 98.9% accuracy and 99% F1-score of COVID-19 detection using the proposed Support Vector Machine with pre-trained features from a selected deep learning model.
This paper is organized as follows. Section 2 presents the proposed methods including dataset preview, data preprocessing, and detection/classification techniques. Section 3 describes our experimental design, parameter settings, evaluation methods, and performance parameters. Section 4 presents the obtained results and Section 5 provides the conclusions.
In this section, we describe our datasets, how we process them, and all methods used in experiments. We also discuss the deep learning and classical machine learning (ML) techniques used in this paper.
Our dataset consists of chest X-ray images with Posterior Anterior (PA) view as shown in Fig. 2 (more detailed information is provided in Section 3.). We obtained the datasets from reliable online sources such as Kaggle and NIH databases [21–23]. The datasets contain 5 classes which are Atelectasis, COVID-19, Normal, Pneumonia, and Pneumothorax.
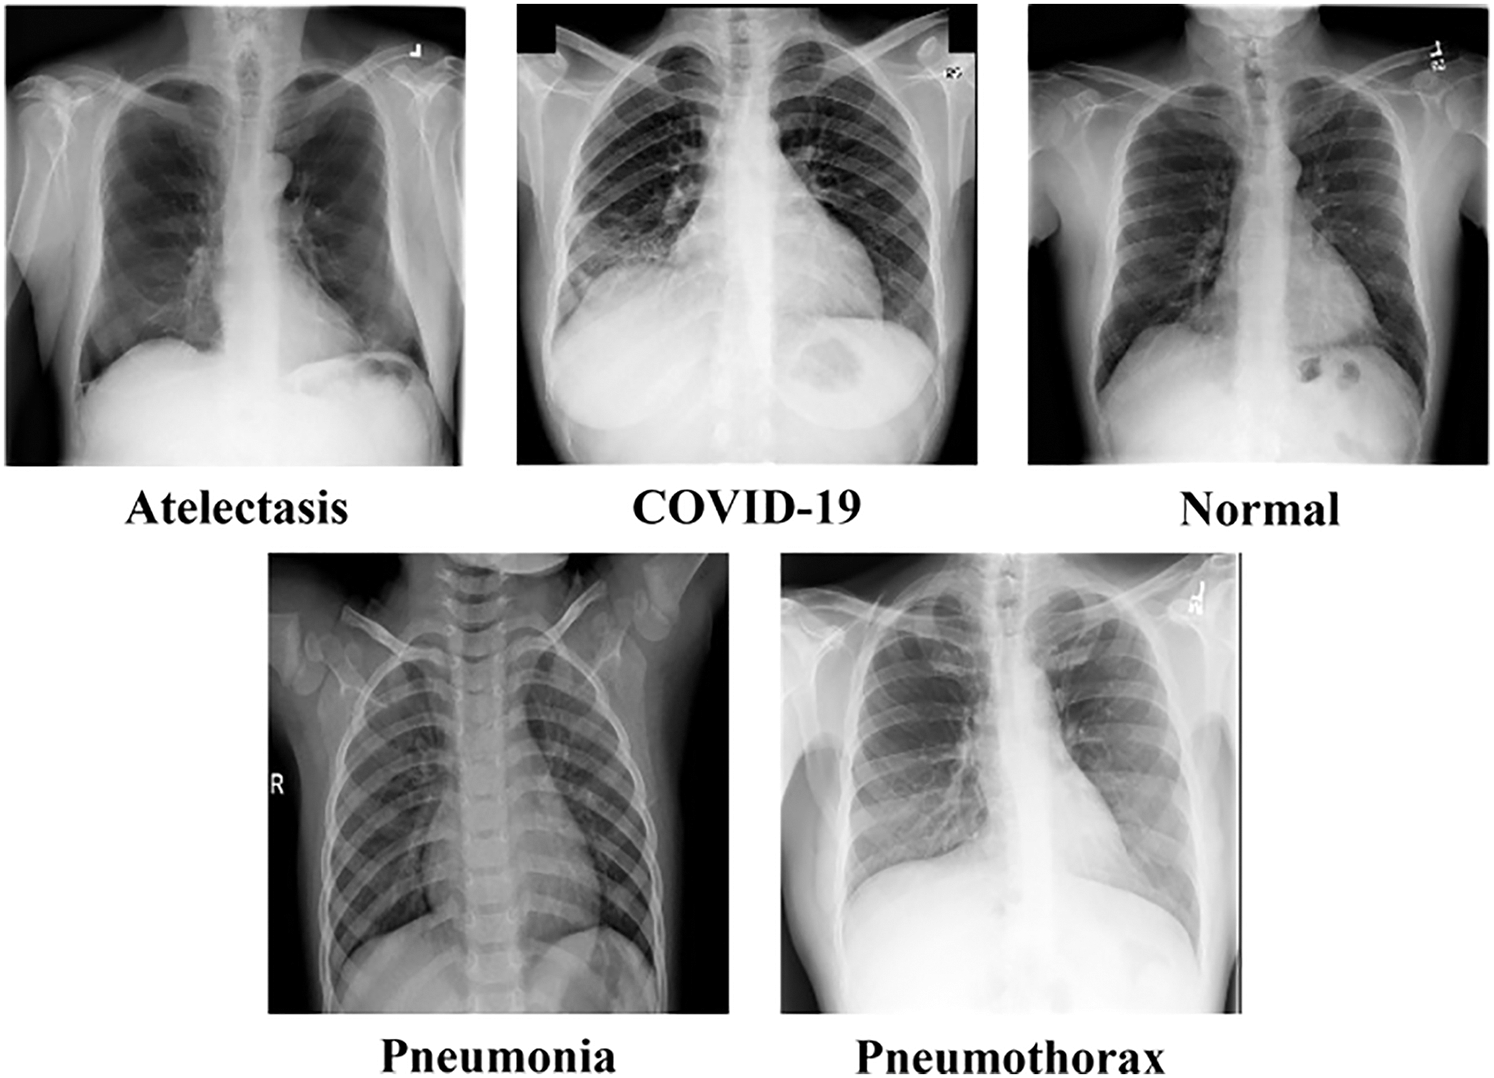
Figure 2: Sample images from the dataset containing atelectasis, COVID-19, normal, pneumonia, and pneumothorax classes
Chest X-ray images were first in grayscale format and then converted into red-green-blue (RGB) format for processing with a deep learning model and feature extraction method. The images were 224 × 224 with 3 color channels in RGB format. For each class, we mapped the images to their labels. For binary-class classifications, 0 and 1 are used as our output. For categorical or multi-class classification, one-hot encoding is used to transform the numeric label into values that represent each class. Normal means having no lung disease.
Deep learning is one of machine learning techniques that uses artificial neural network as its core. Convolutional Neural Network (CNN) is a well-known technique that is used to classify images. Deep learning usually consists of many layers. The network uses a back-propagation learning algorithm to adapt the weights linking neurons in the network to one another. The weights determine the final output of the network when given an input to classify. Deep learning already contains feature extraction, unlike classical machine learning that requires an additional feature extraction process before classification as shown in Fig. 3.
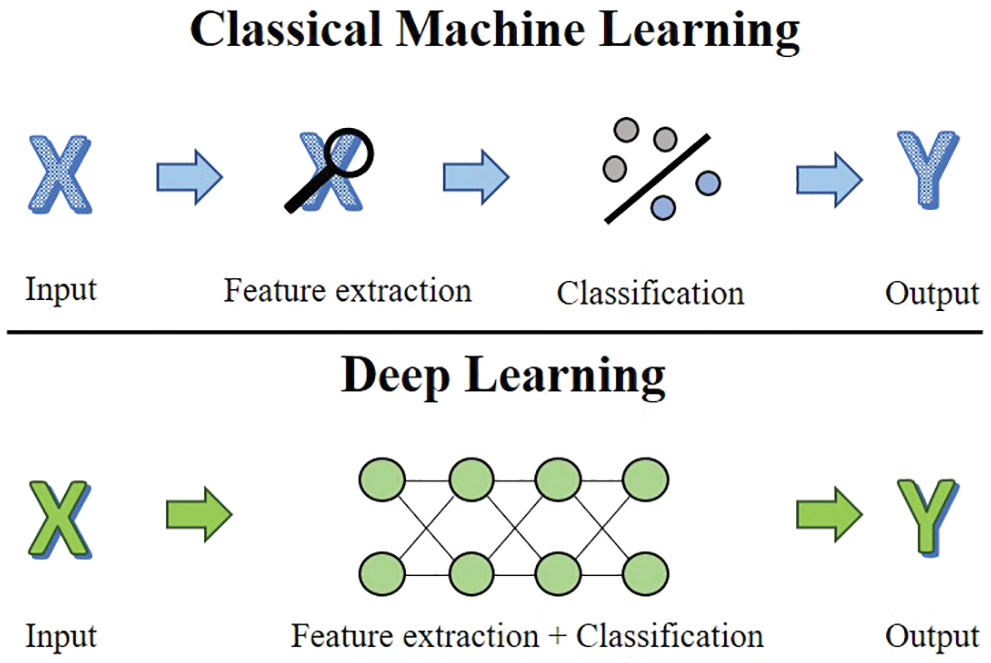
Figure 3: Comparison between classical machine learning and deep learning process
Convolutional neural networks (CNN) [24] are specialized for handling spatially distributed data such as images. They contain convolutional layers in which the output from a particular neuron or unit depends not only on its activation value but also on its position in an array, with respect to other units. The convolutional layers of a CNN are primarily responsible for learning spatial patterns, that is, features. To work well, CNNs also include other types of layers, including pooling layers, drop-out layers, and fully connected layers.
The convolutional layer is used to collect information from image inputs and recombine them into new images or features that will be fed into the deeper layer. The convolution layers are the core of the convolutional neural network. The convolution operation is mathematically defined in Eq. (1), where G is feature mapping, h is a kernel, and f is an input image. Pooling layers are used to reduce the dimensionality of the network and summarize the output from convolutional layers. Dropout layers randomly discard some of the output weights from the layer. Dropout layers slow the rate of learning but help make the network generalize better by reducing overfitting. The fully interconnected layer (FC) is the last part of the network. It is used to classify the input and gives predicted output. The input will be converted from two-dimensional arrays to a one-dimensional vector (called “flattened”) before entering this layer.
A popular method used in training a deep learning model is called “transfer learning” [25]. The method adapts the knowledge of an already trained model for a new training goal. For classification, the transfer learning freezes the trained capability of a previously trained model and removes the classification layers which are fully connected layers. Then, we replace them with new fully connected layers and train the model further to reach our goal. The transfer learning uses the lower-level features learned by the original model, allowing them to be refined and applied in a new model to solve a new problem. Many successful architectures have used the ImageNet training dataset [26] and gained high detection performance. VGG is one of them. It has 2 main variation models which are VGG16 and VGG19 [27]. The VGG16 model has 16 layers while the VGG19 model has 19 layers as shown in Fig. 4. The layer counting does not include max pooling layers and fully connected layers.
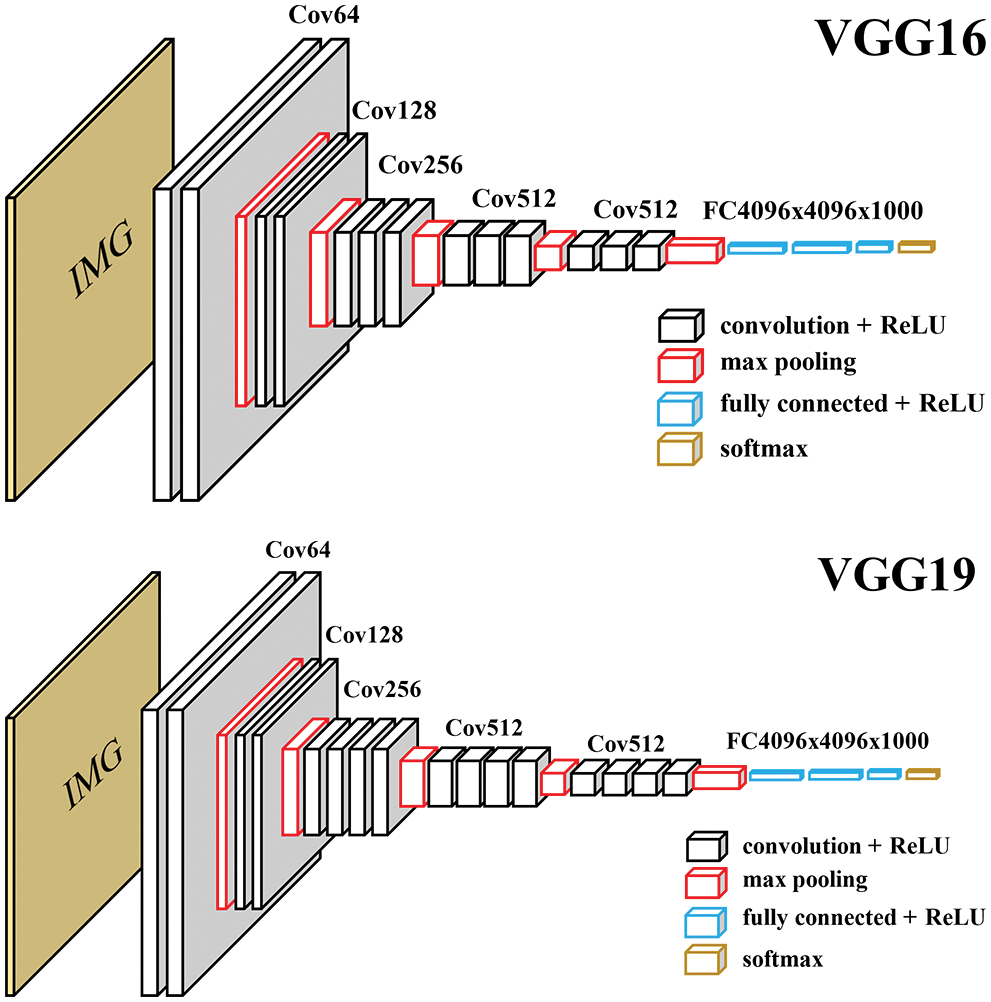
Figure 4: Original architecture of VGG16 and VGG19
Unlike CNN, classical machine learning techniques require the researcher to define and extract features (dimensions or attributes) from the input before training the model. Feature extraction calculates values from the input that represent the important characteristics of the data. In this work, we use pre-trained features to extract the feature from our data.
The pre-trained feature approach borrows the idea from the transfer learning model with trained weights. Usually, transfer learning is applied to a new CNN model, but in our case, the deep-learning-trained features are used with classical ML approaches. We start with the VGG19 model trained with the ImageNet dataset. The fully connected layers in the model are removed, so that the last layer is the max-pooling layer, as shown in Fig. 5. The model receives input size 224 × 224 × 3 and gives an output size of 7 × 7 × 512. Them, the output features are flattened to produce 25,088 features and will be later used as the input to the classical machine learning techniques.
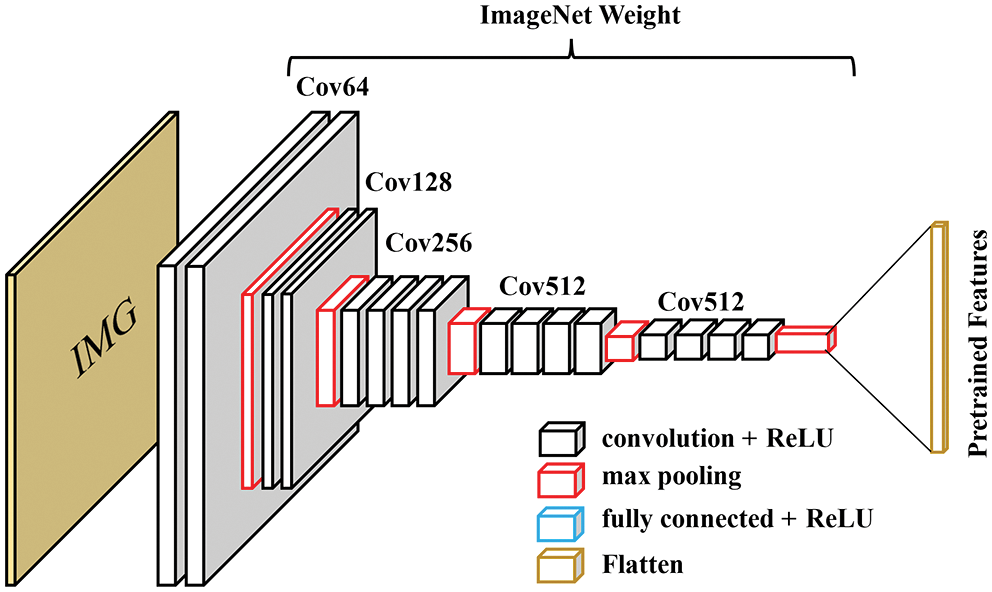
Figure 5: Cut-off VGG19 architecture to output only features
3.5 Classical Machine Learning
Like deep learning models, supervised classical machine learning techniques must be trained with labeled samples of the input data. However, unlike deep learning, these techniques do not learn the best features in the input dataset by themselves. Instead, the input data must be transformed into a set of selected features, for each training and testing data item. In this work, we present two effective machine learning techniques which are Support Vector Machine (SVM) and Random Forest (RF).
SVM [28] is a machine learning technique that separates data items (input data items, represented as vectors of feature values) into classes in high dimensional space by using a hyperplane. The data items in the space can be handled with a selected kernel function that maps the data into a different form. There are 3 common kernel functions which are linear, polynomial, and Gaussian functions.
RF [29] is an ensemble technique that consists of multiple decision trees [30]. The RF method uses a randomly selected subset of data features to create a tree and creates many trees instead of one. The data is classified based on the result of many trees, using some aggregation algorithm.
In this section, the input data used in each experiment is described together with the experimental setup, evaluation method, performance evaluation metrics, and hardware and software environment for the experiments.
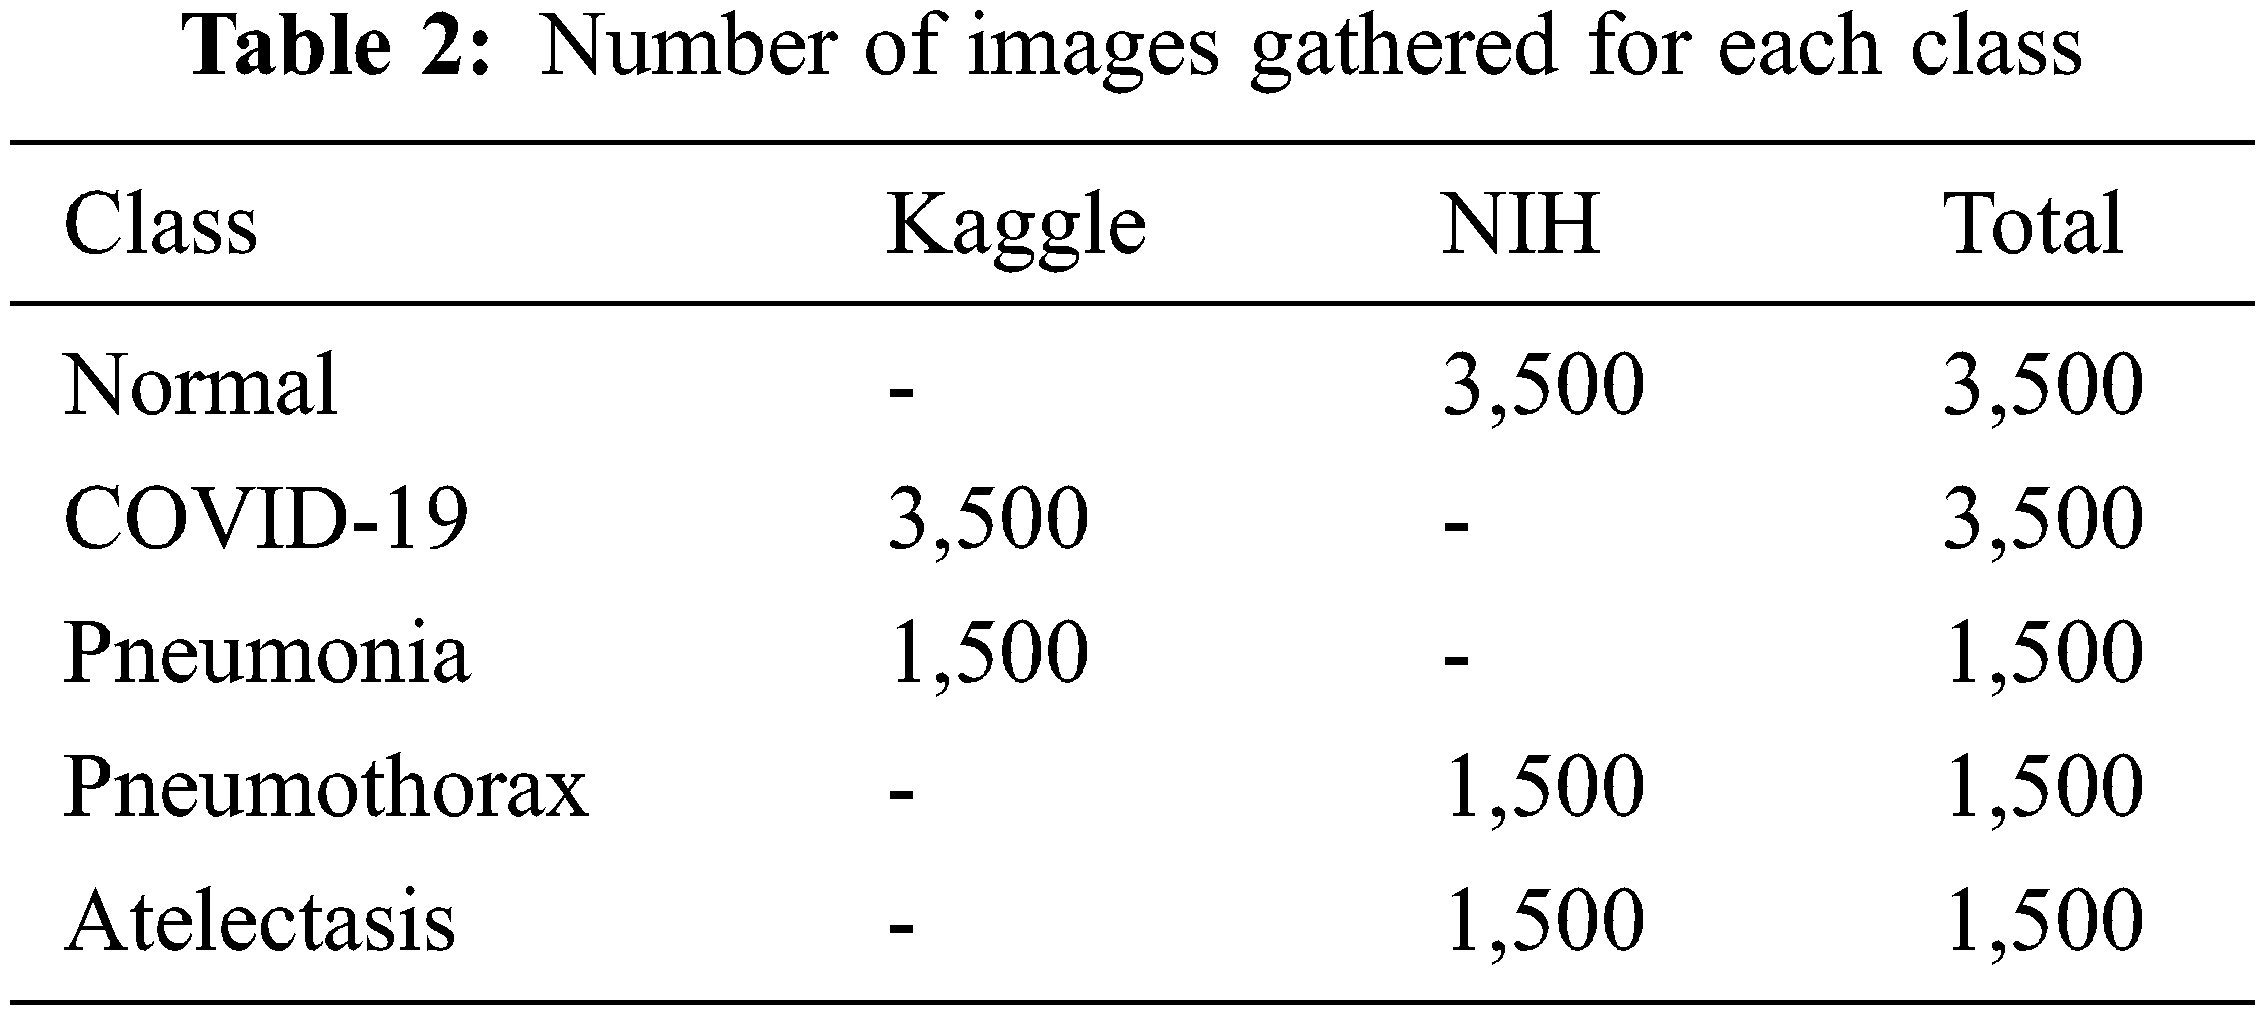
The chest X-ray dataset used in our experiments consists of 5 classes which are normal, COVID-19, pneumonia, pneumothorax, and atelectasis. These diseases are well-known and commonly found all around the world. The input images were obtained from online databases at Kaggle (kaggle.com) and the National Institutes of Health (nihcc.app.box.com). Details of the datasets are shown in Tab. 2.
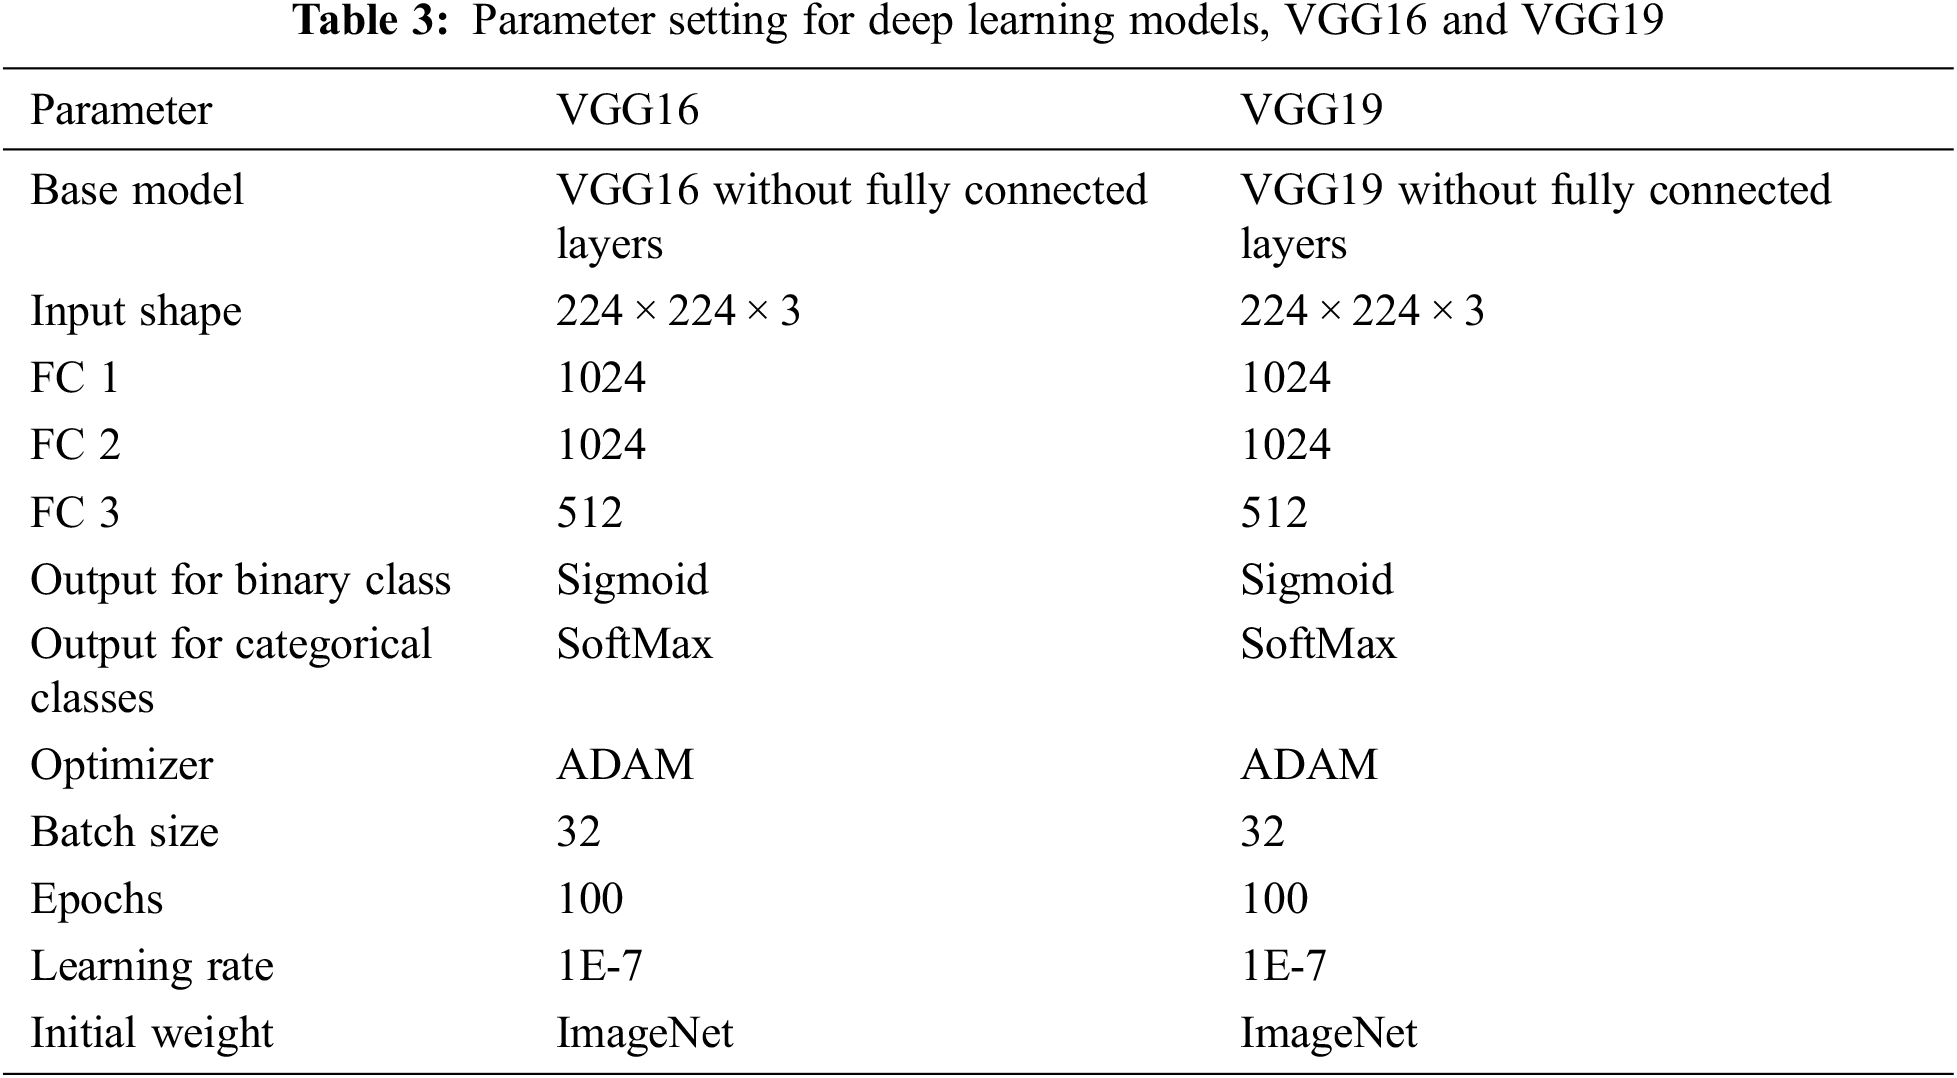
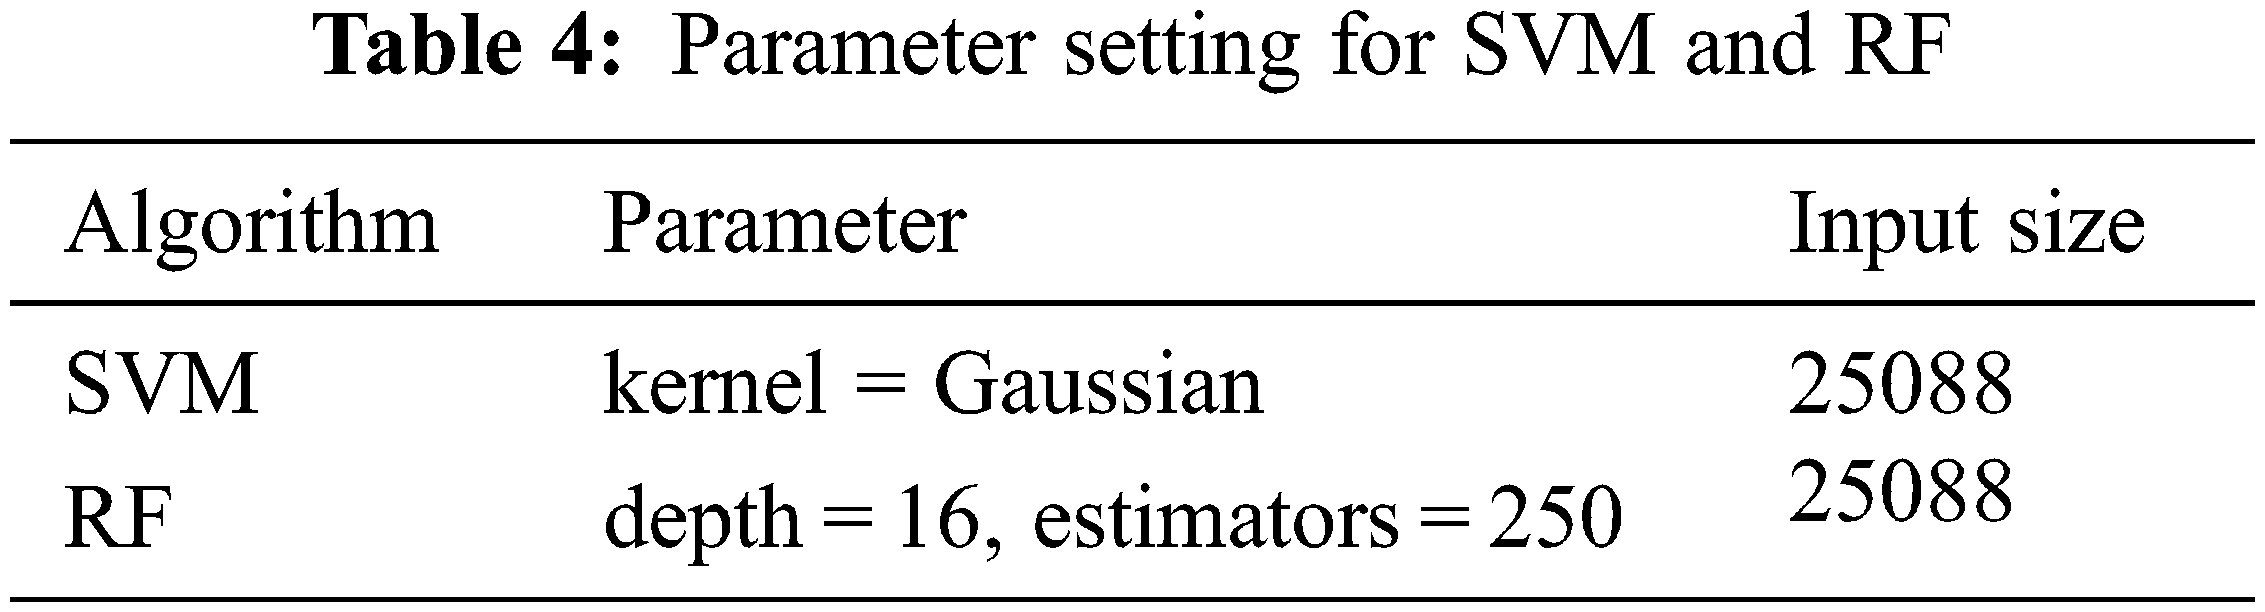
The parameter setting for deep learning and classical machine learning are presented in Tabs. 3 and 4, respectively. The deep learning models that we consider are VGG 16 and VGG19, while the machine learning models are SVM and RF.
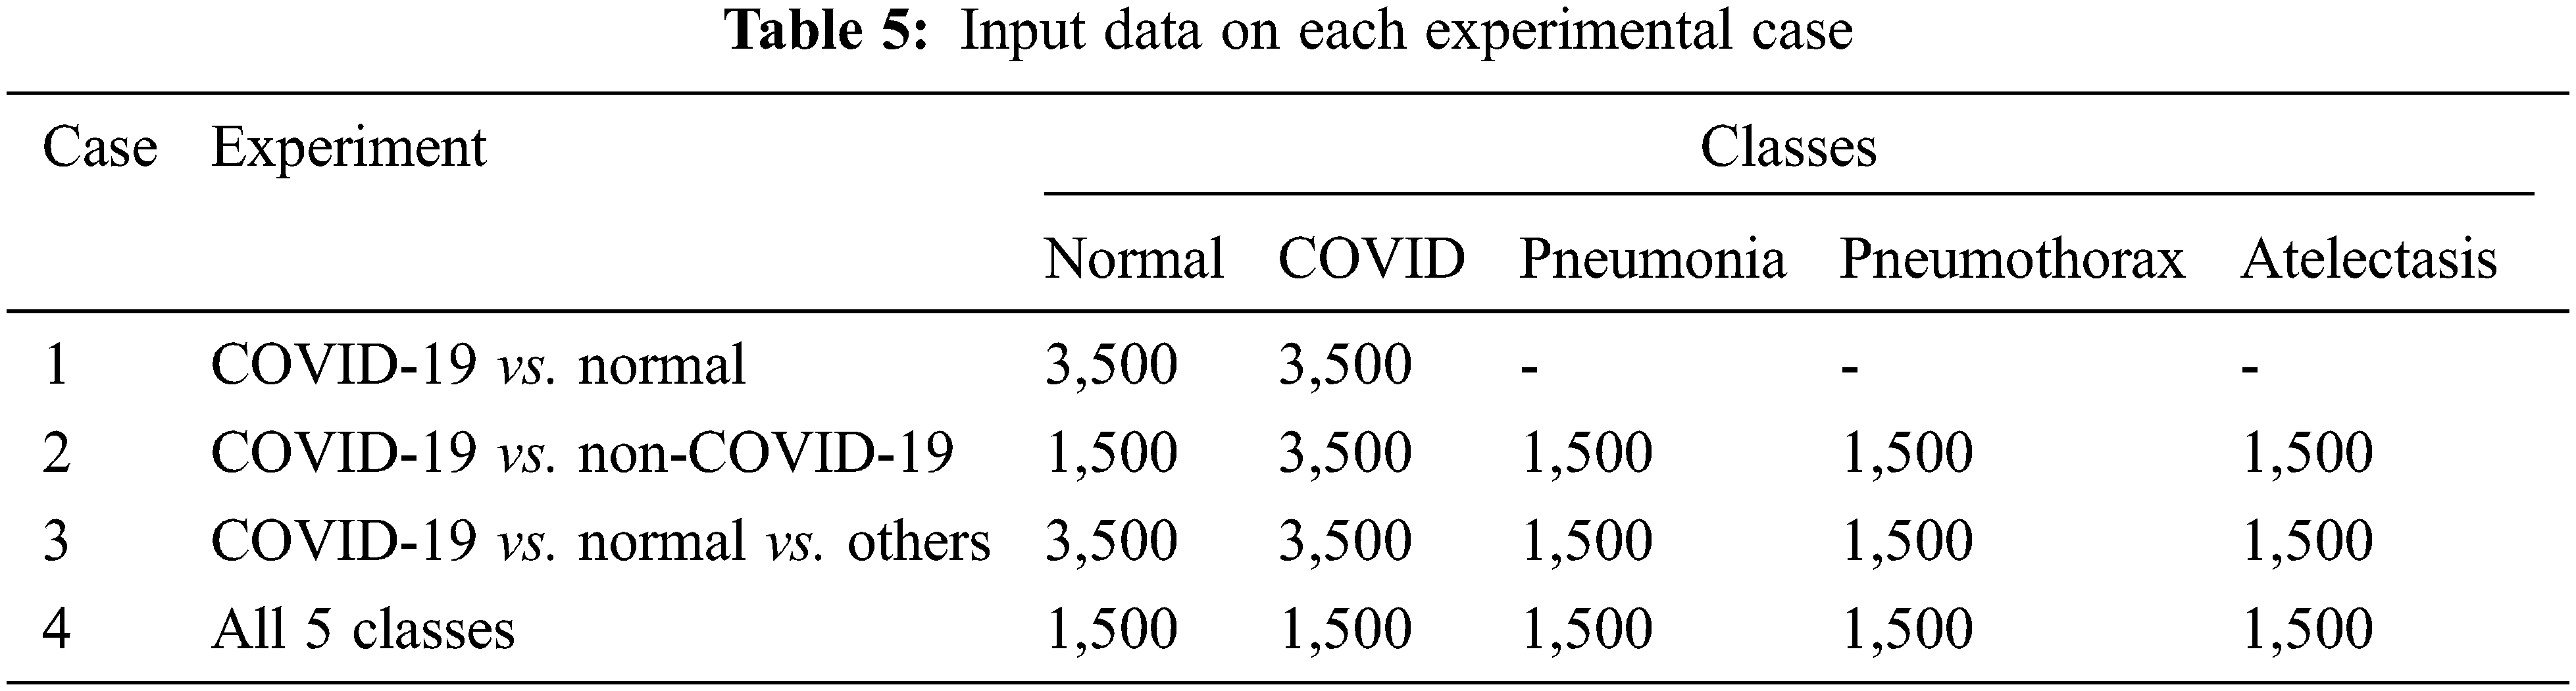
We considered both binary (2 classes) and categorical (3–5 classes) classification tasks. For the binary classification, two pairwise discriminations: normal vs. COVID-19 (case 1) and COVID-19 vs. non-COVID-19 (case 2) were examined. For the categorical classification, 3 classes (normal, COVID-19 and others) and 5 classes (normal, COVID-19, pneumonia, pneumothorax, and atelectasis) were considered. Tab. 5 shows the detailed experimental design and input dataset for each experimental case.
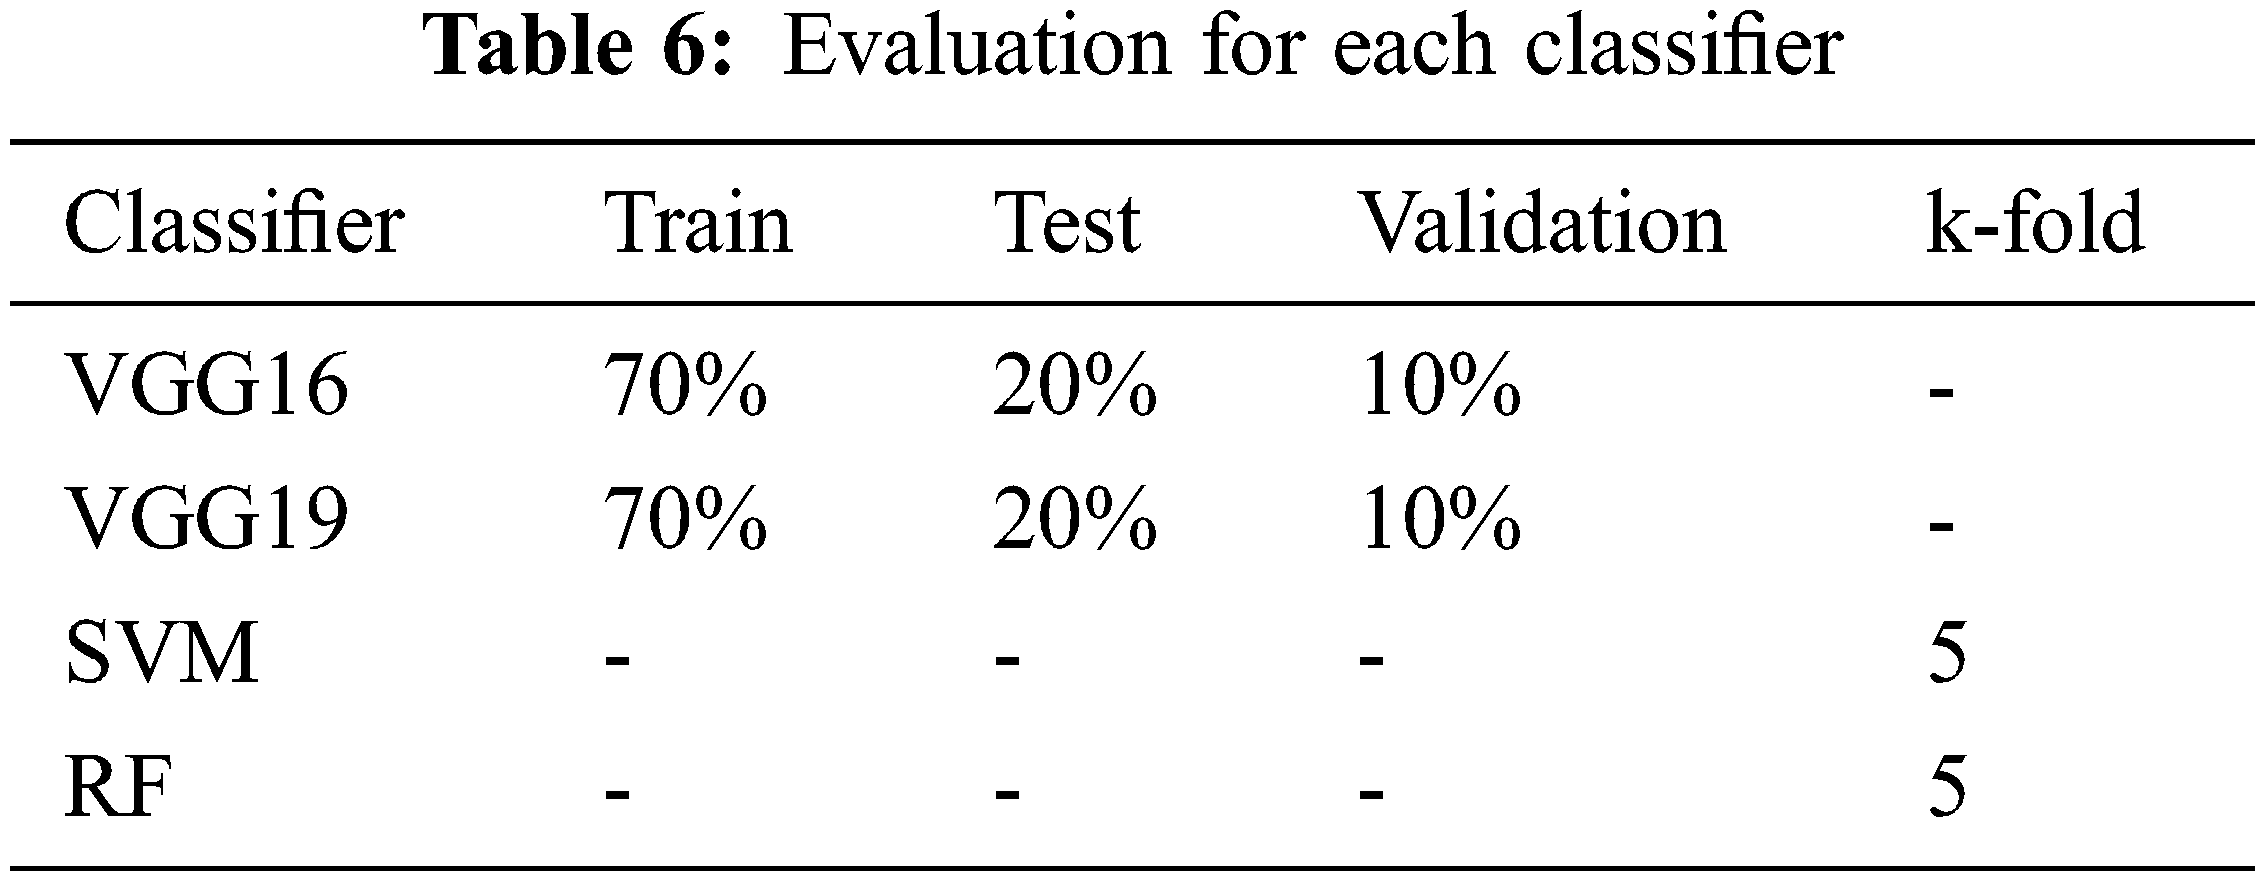
For evaluating our detection/classification models, we use two methods to separate the training and testing data which are a hold-out method and a k-fold cross-validation method. In the deep learning experiments, we used only the hold-out method. The method splits the training, testing, and validation data into three non-overlapping sets. Validation data is only used to observe the result from model training to find the best time to stop training to avoid over-trained or overfitting. K-fold cross-validation splits the data into k subsets. Then it tests each subset while using the model trained from the remaining subsets. In our experiment, the k-fold method is only used in classical machine learning. The detailed information of our evaluation is shown in Tab. 6.
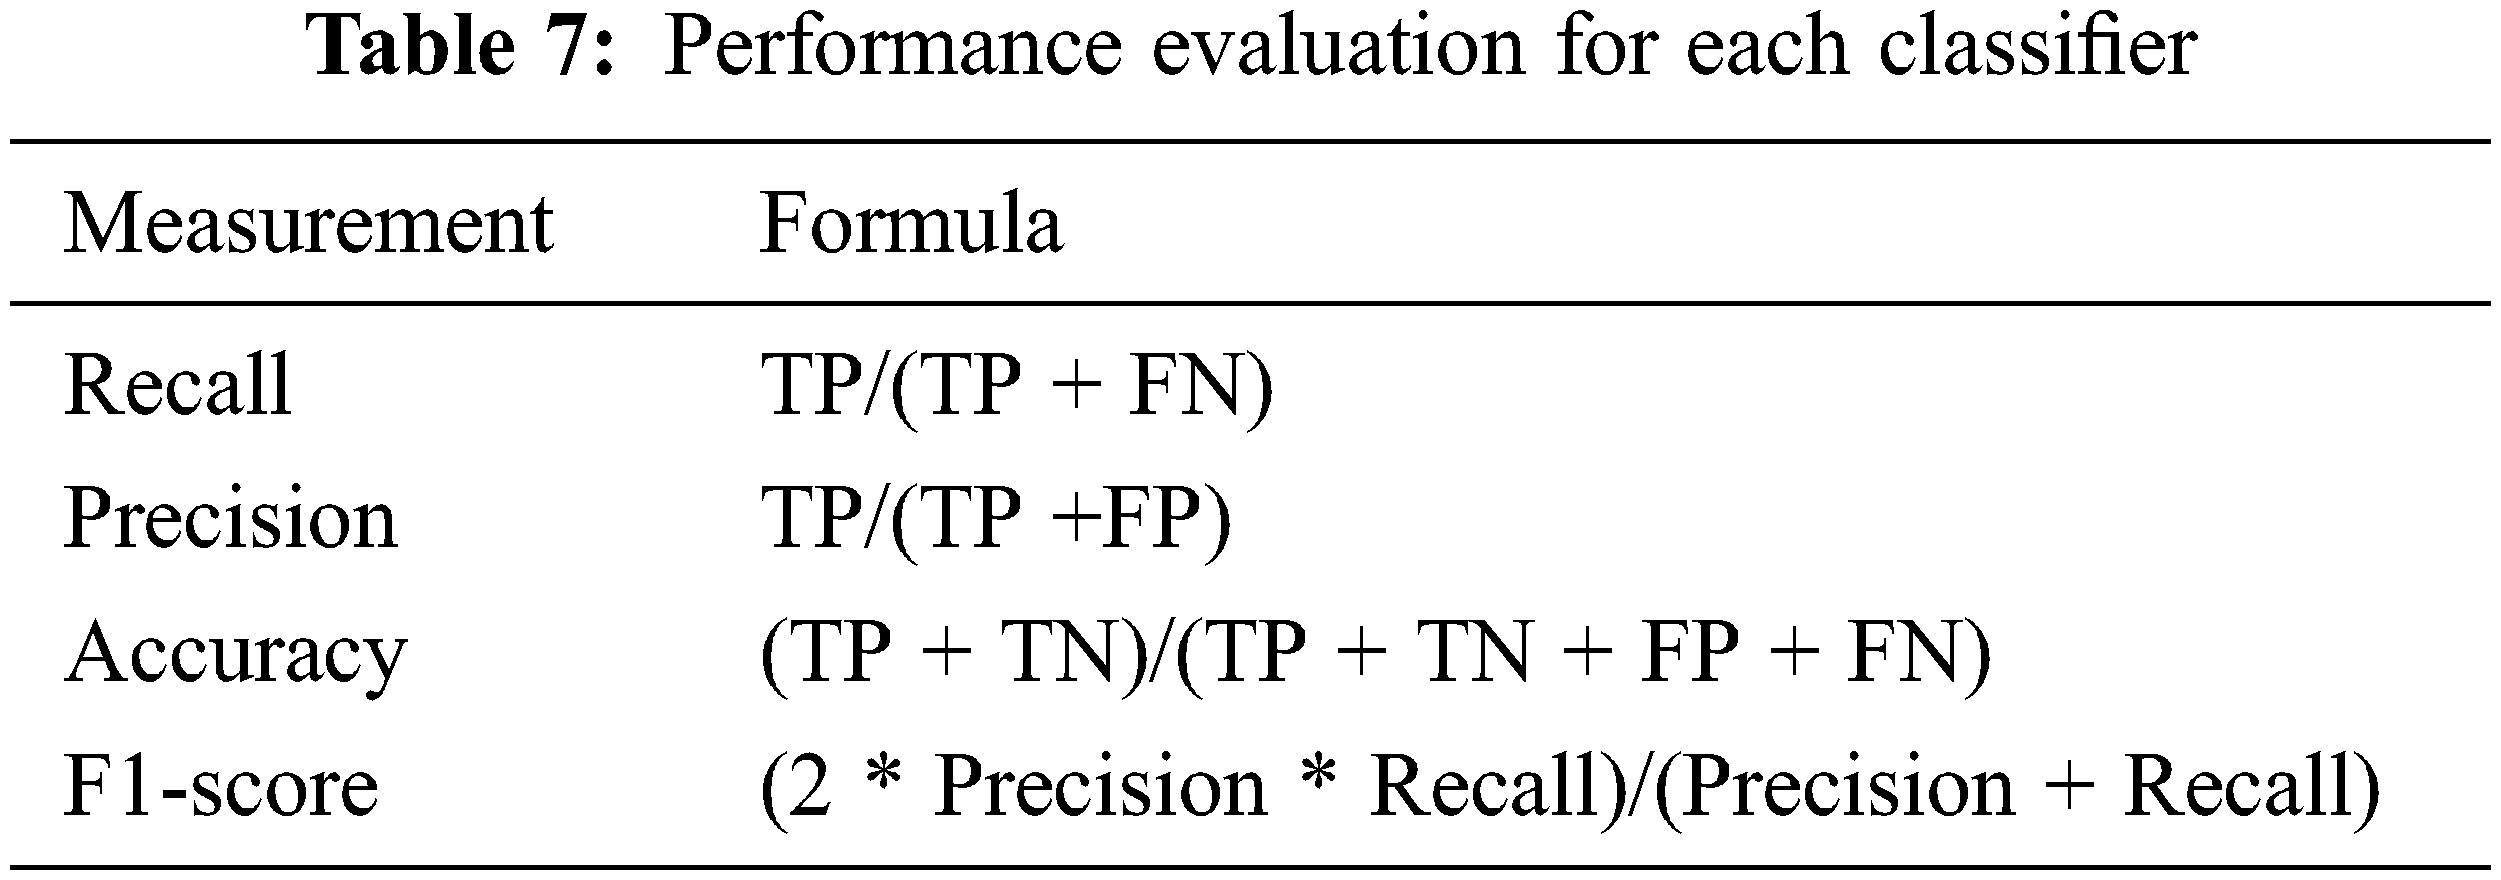
Performance evaluation metrics are calculated from the confusion matrix including accuracy, precision, recall, and F1-score. The definitions of the confusion matrix and performance evaluation metrics are shown in Fig. 6 and Tab. 7, respectively, where TP is true positive, FP is false positive, FN is false negative, and TN is True negative.
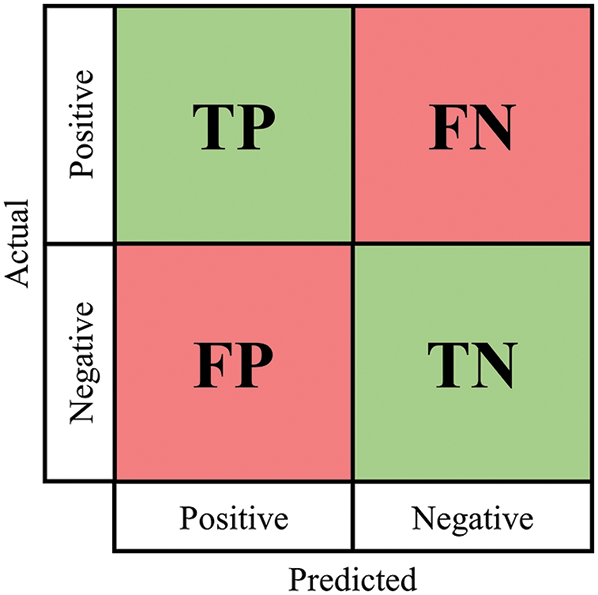
Figure 6: Confusion matrix of 2 classes
In this paper, all detection/classification models were developed/trained using a personal computer with i5-9500F 3.00 GHz Processor, 16 GB RAM, and GTX 1060 Graphics card running on the operating system Windows 10, 64-bit Pro. We conducted the experiments using Python 3 with Keras deep learning library and Scikit learn classical machine learning library.
In this section, all experimental results of our proposed methods are presented. The results were separated into two parts: deep learning experiments, and classical ML experiments with pre-trained features. Each part contained 4 experimental cases (binary and categorical) as previously discussed.
Our first part of the experiments focused on pure deep learning methods using transfer learning with ImageNet weight. The experiment contained 4 cases which are Normal vs. COVID-19, COVID-19 vs. non-COVID-19, Normal vs. COVID-19 vs. Others, and all 5 classes. As discussed in Section 3.4, the experimental cases split the train-test-validation in the ratio of 70:20:10 using the hold-out method. The training/validation accuracy and training/validation loss results of VGG19 are graphically displayed in Fig. 7.
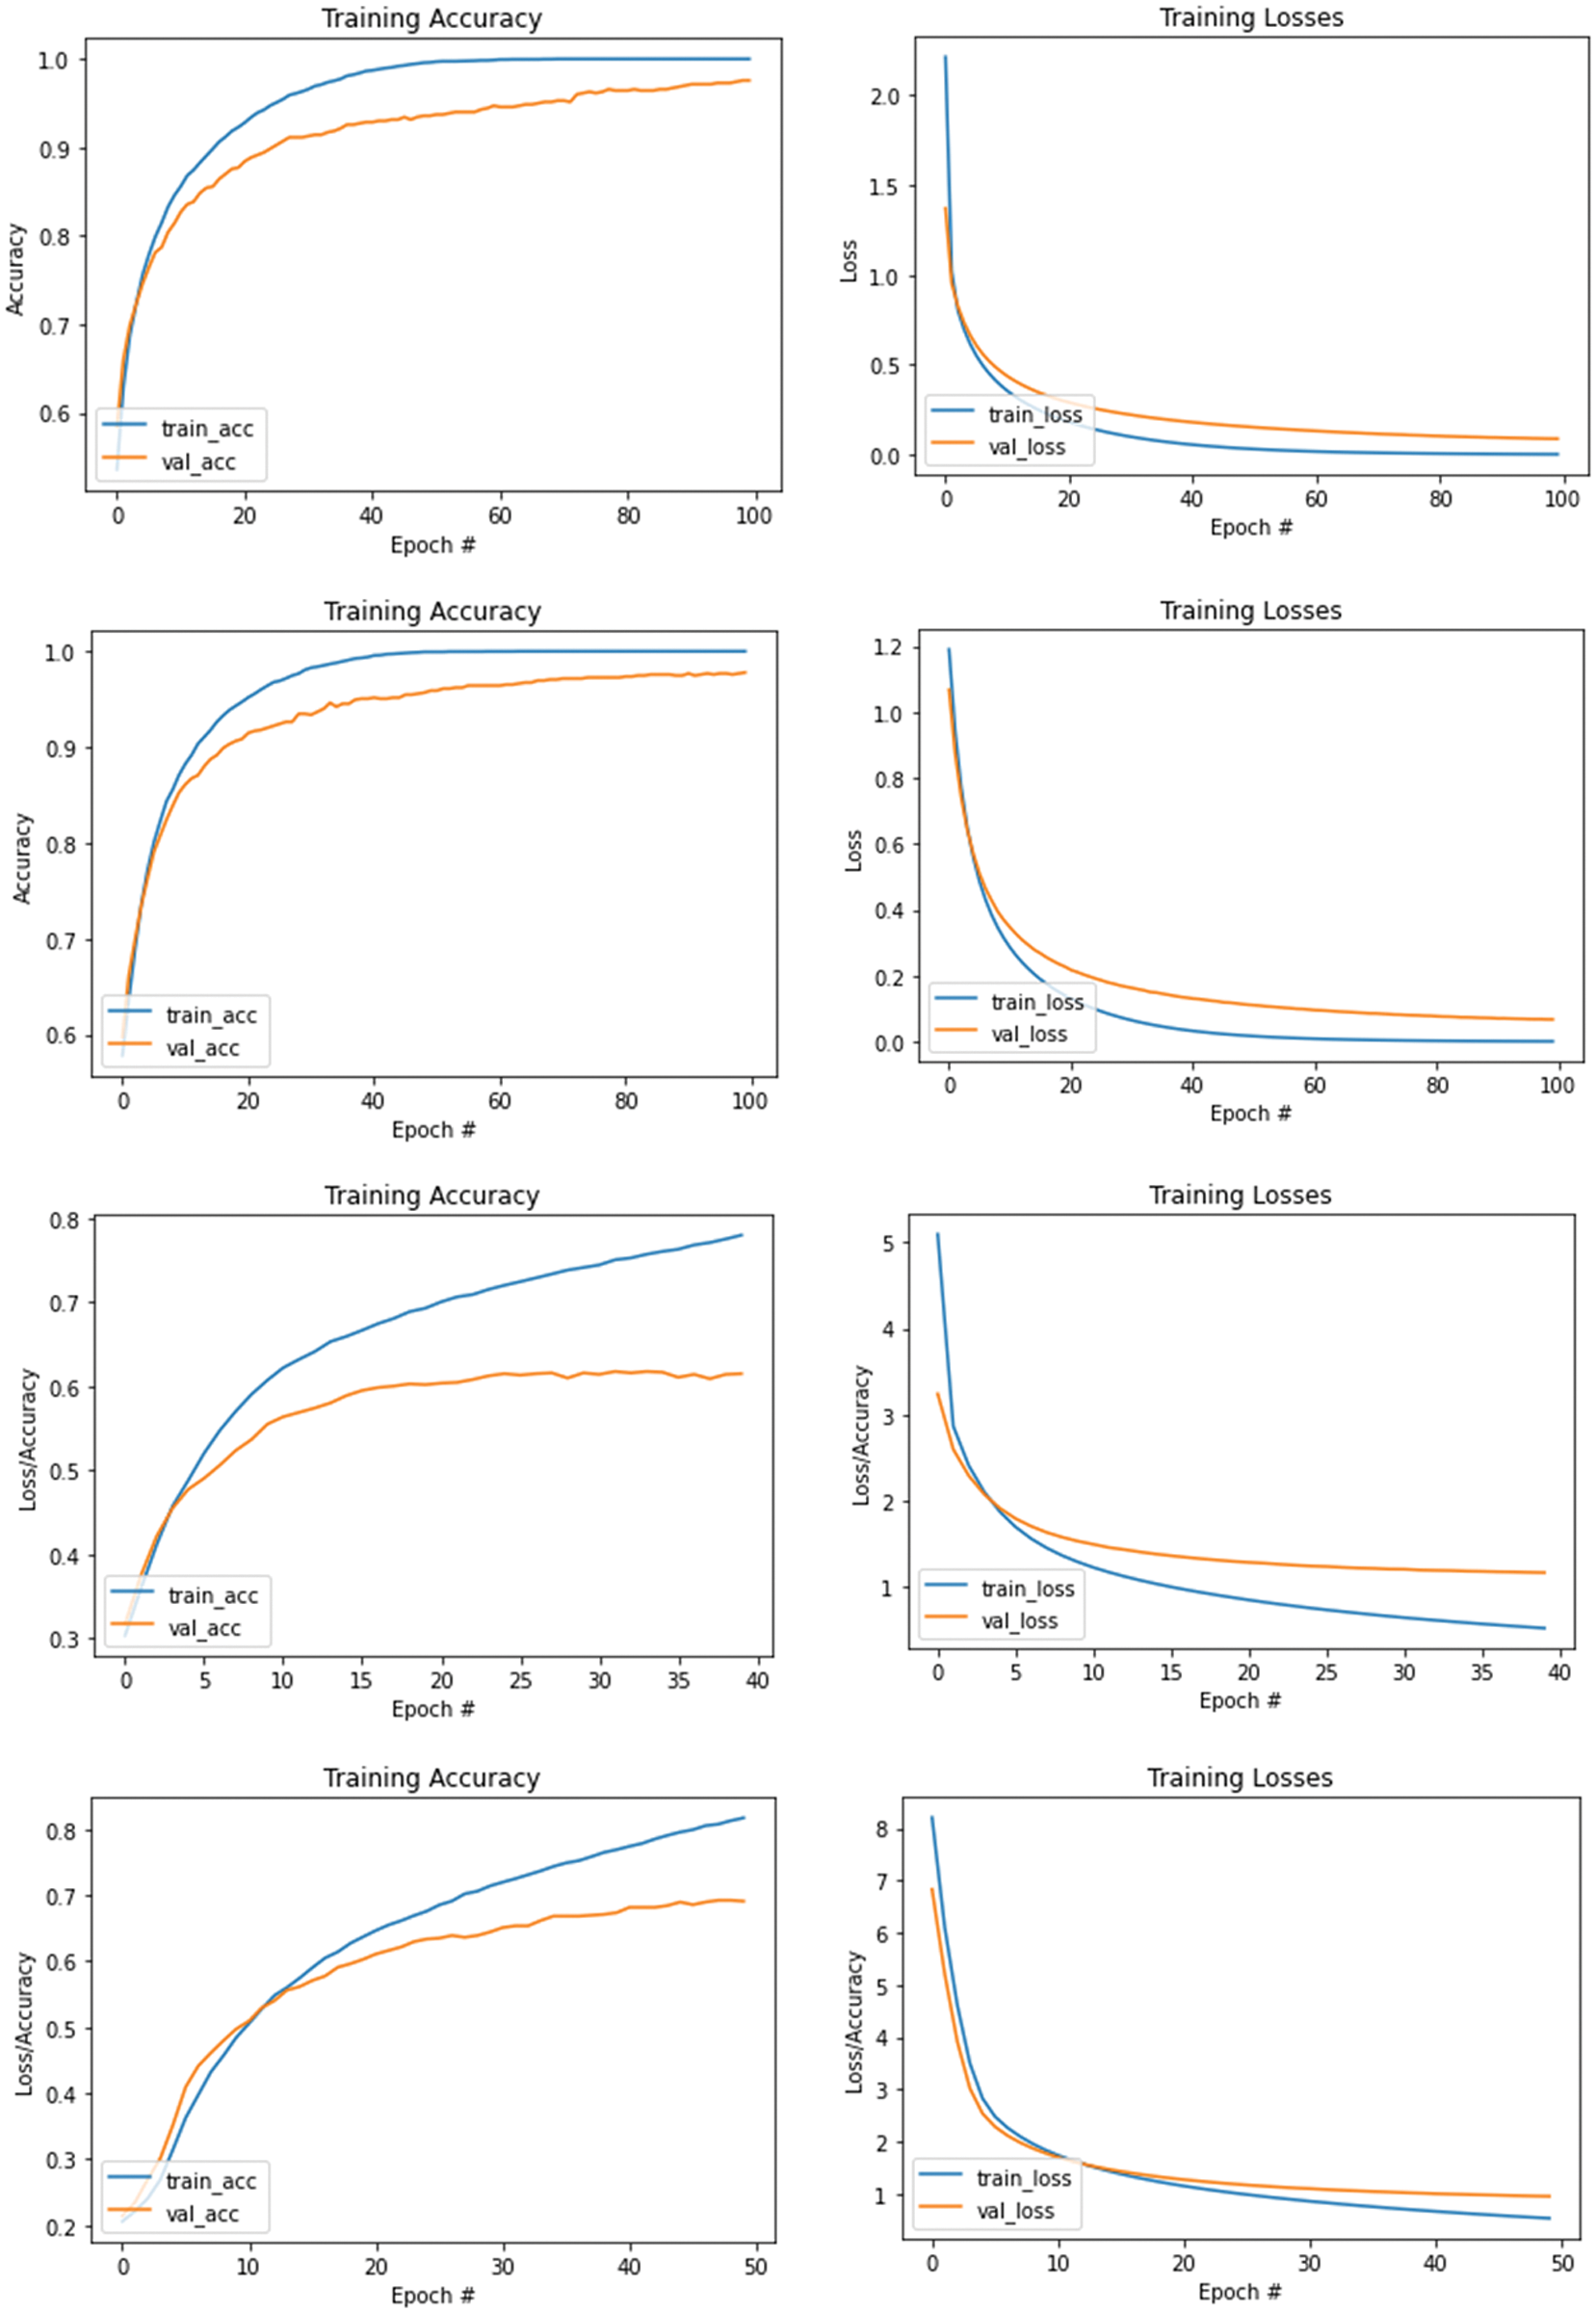
Figure 7: Accuracy and loss values of VGG19 from cases 1 to 4 starting from top to bottom rows
From Fig. 7, we see that the accuracy of both training and validation for all models increase rapidly during the first 10 iterations/epochs and then gradually increase. The first row presents result obtained from the first experimental case, while the 2nd-4th rows present results obtained from the 2nd-4th cases, respectively. During this training time, each classification model learns to adjust itself so that the difference between the two detection/accuracy rates (training and validation) is small and becomes stable. Then, the models are ready for testing with separate testing datasets, where results are presented with confusion matrices as shown in Fig. 8, and the corresponding performance evaluation metrics are shown in Tabs. 8 and 9.
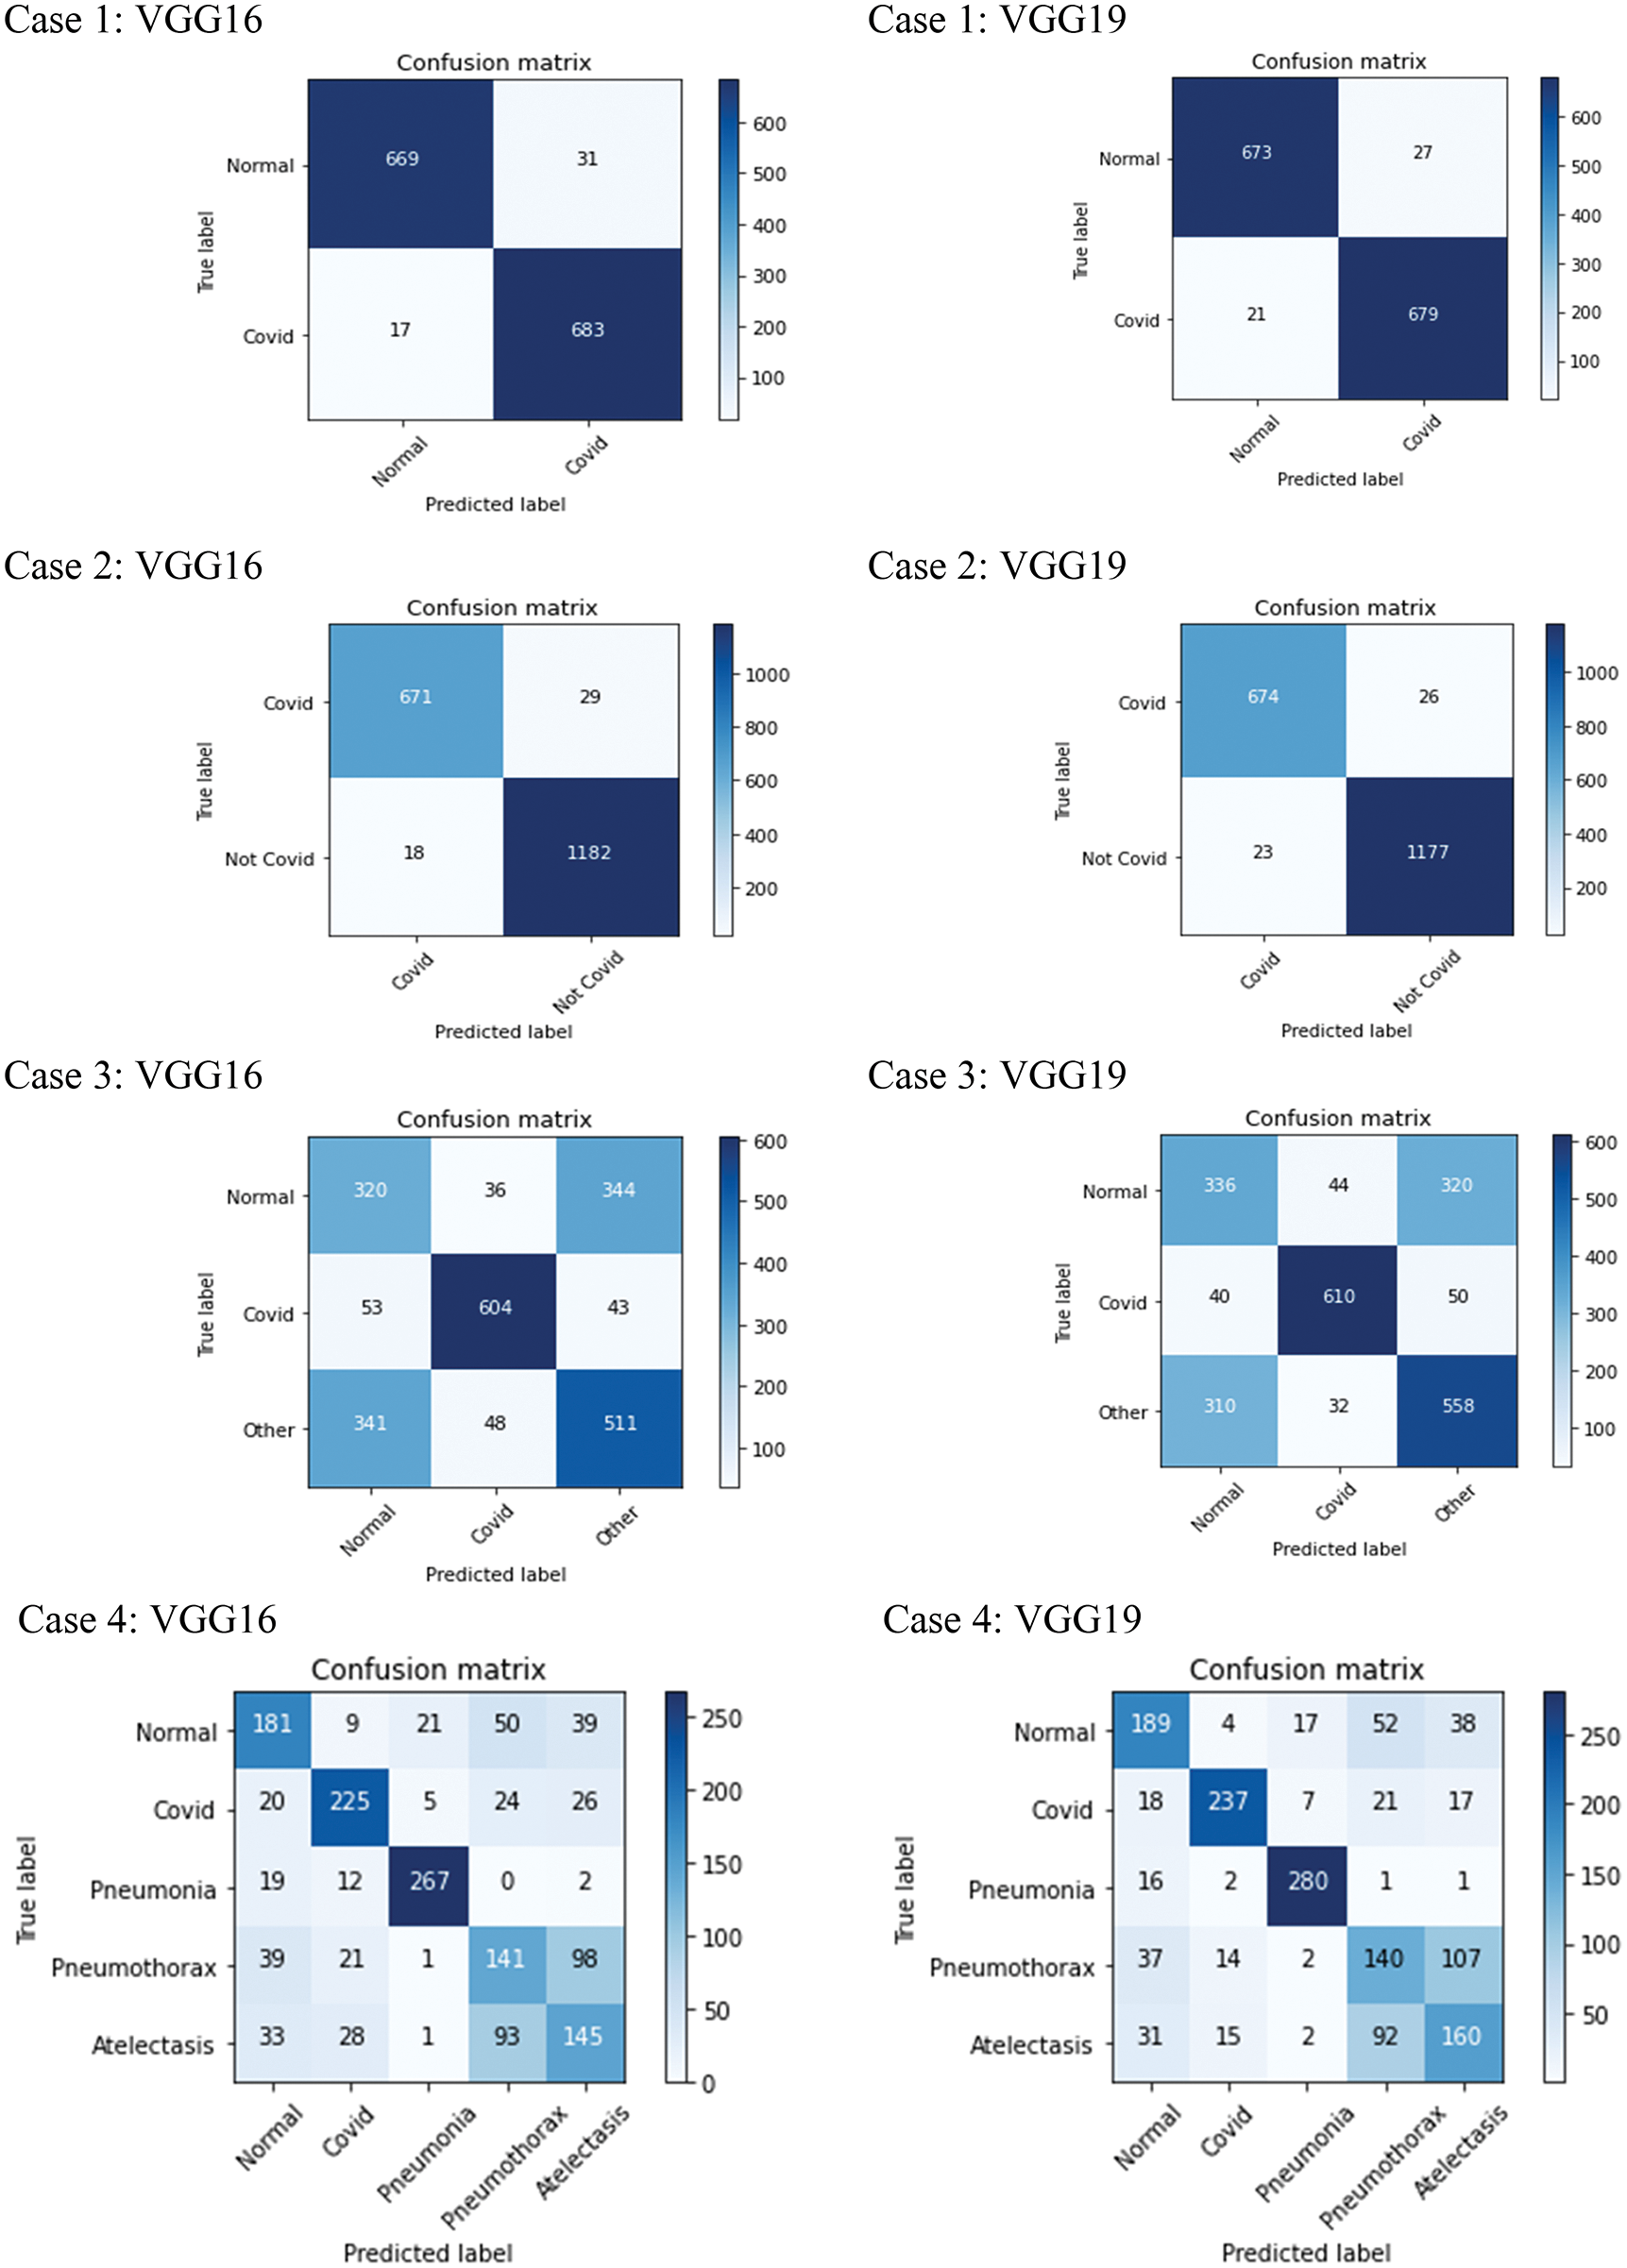
Figure 8: Results of 4 experimental cases: confusion matrices of VGG16 and VGG19 classification models started from the top row
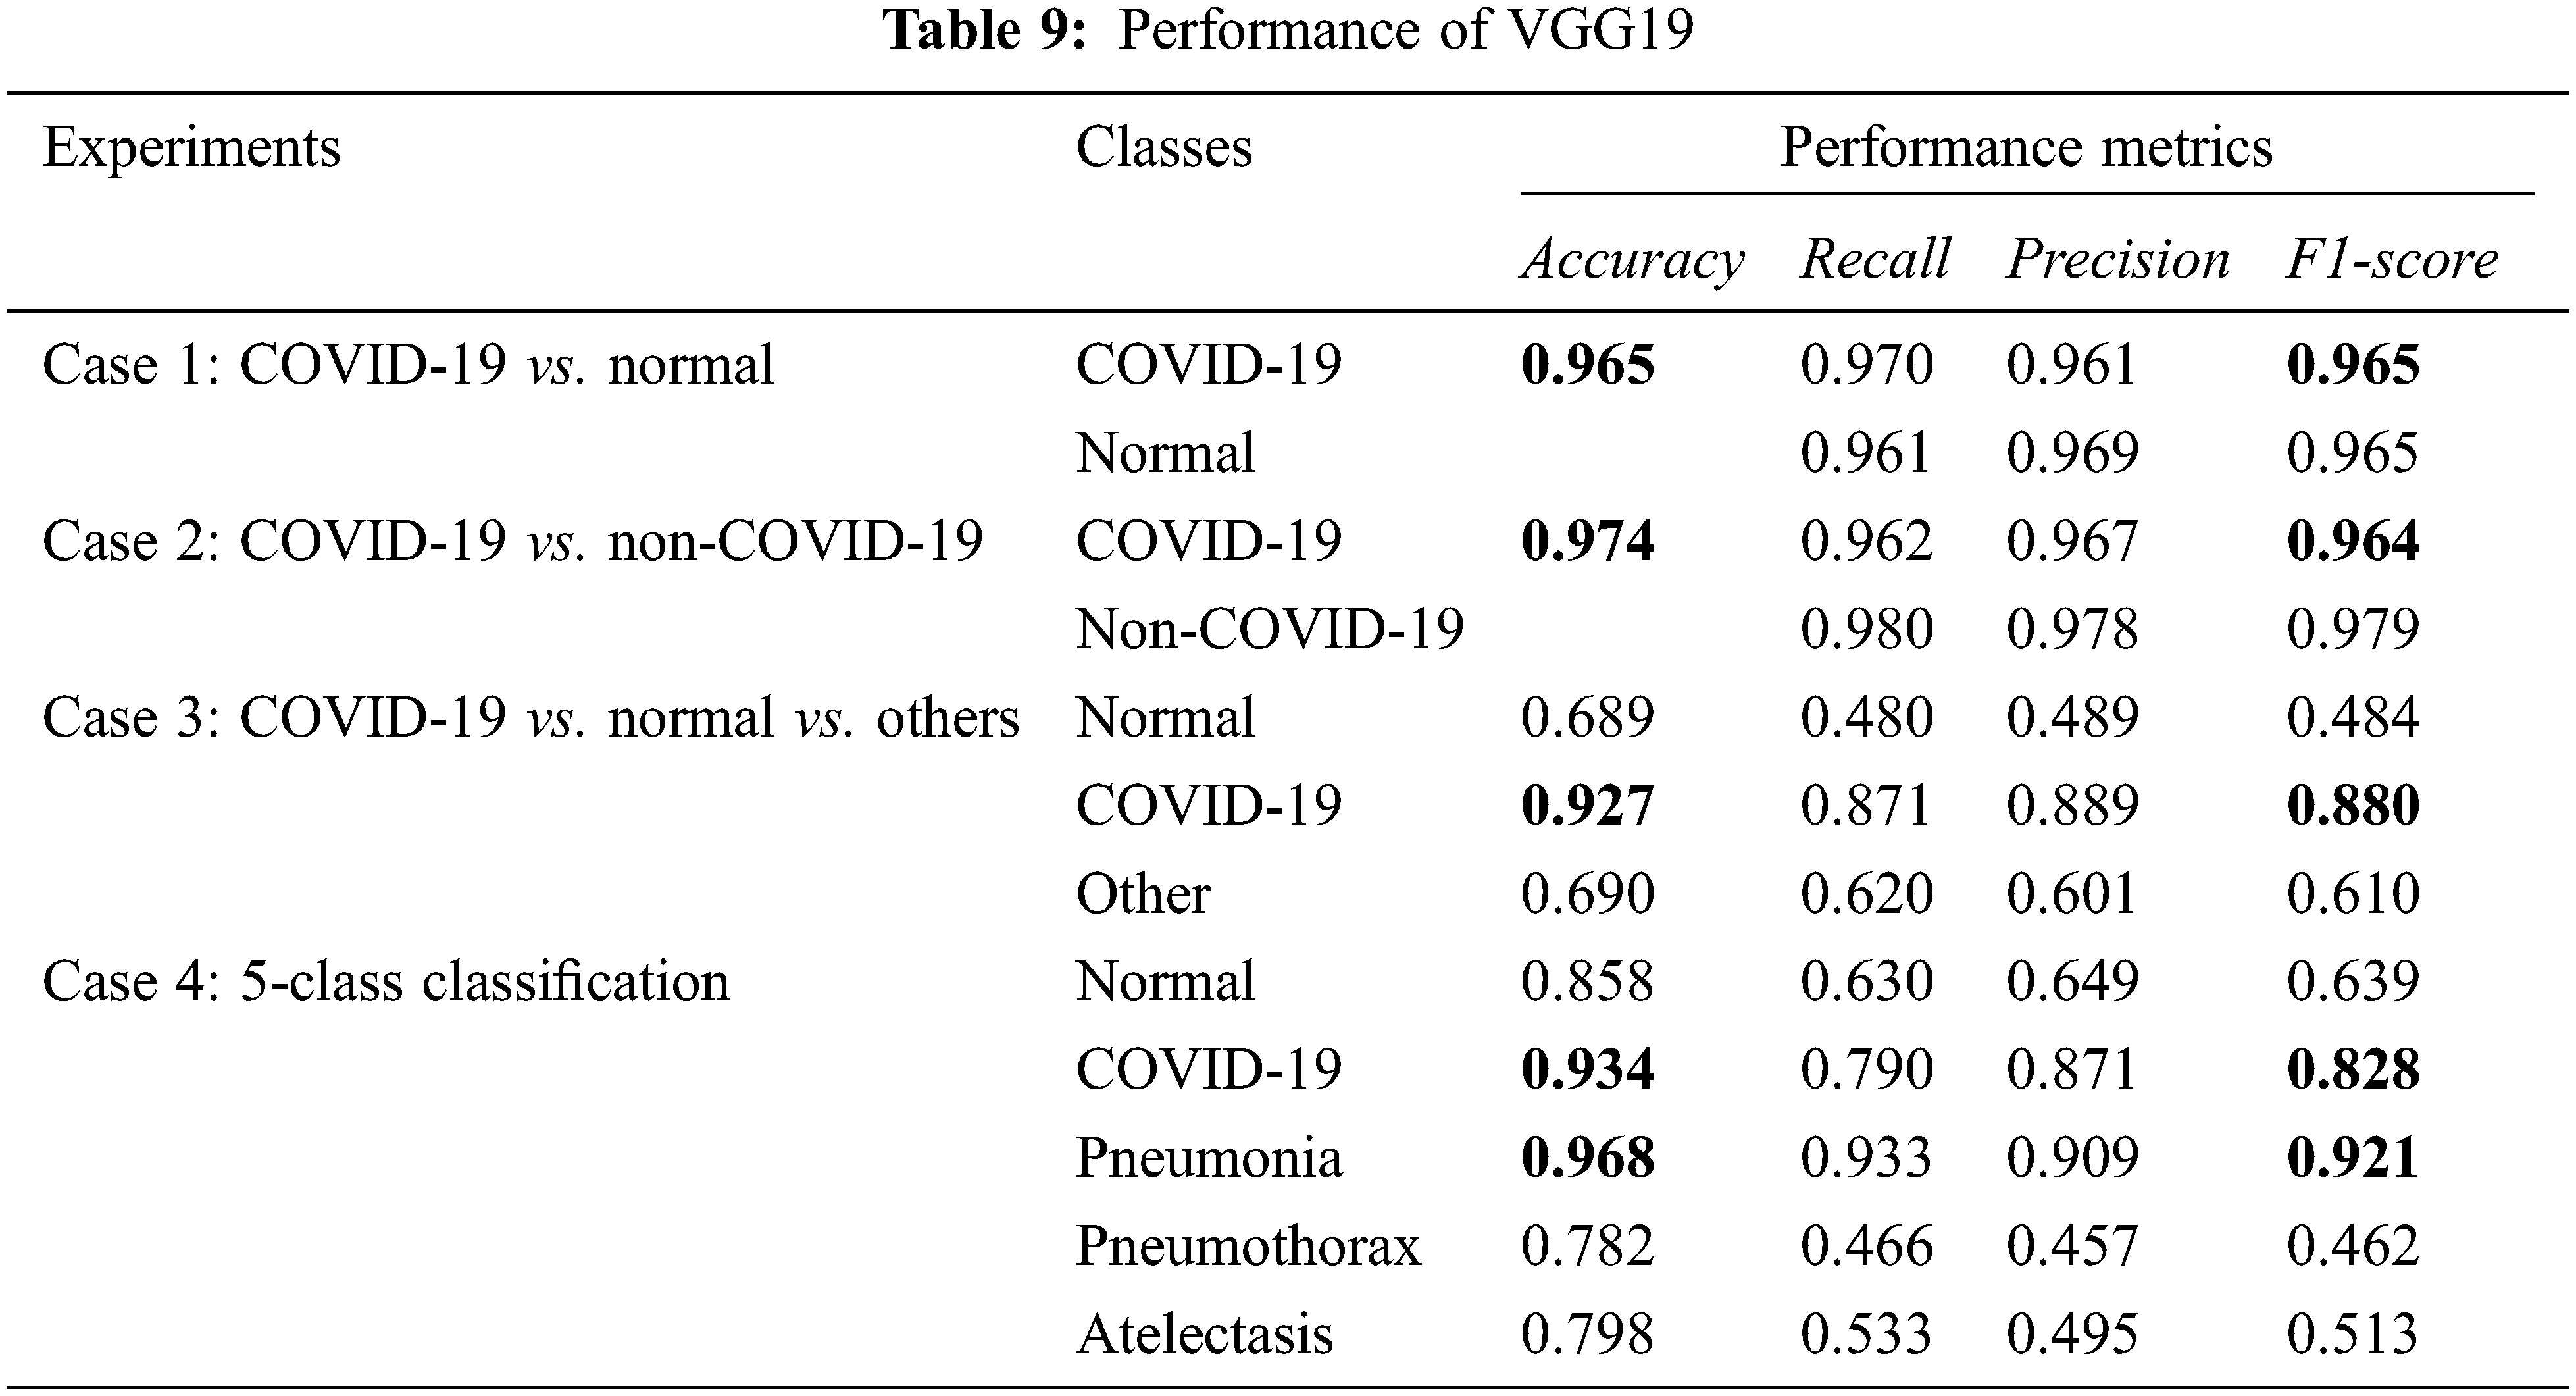
From Fig. 8, we can see that the classification results obtained from the VGG16 and VGG19 in each experimental case are similar. COVID-19 images can be mostly detected/classified. In particular, in cases 1–2 with binary-class classification, less than 50 X-ray images out of 1400 images (700 COVID-19 images and 700 non-COVID-19 images) were misclassified. Normal images, shown in case 1, can be identified mostly as well. Considering multi-class classification, cases 3–4, more misclassified images were obtained. However, we were still able to identify COVID-19 correctly mostly, apart from normal and other diseases, as shown in case 3. Then, with more output classes to classify, in case 4, we had most of the misclassified images belong to Pneumothorax and Atelectasis classes. The performance of the VGG16 and VGG19 can be considered in detail as presented in the following tables.
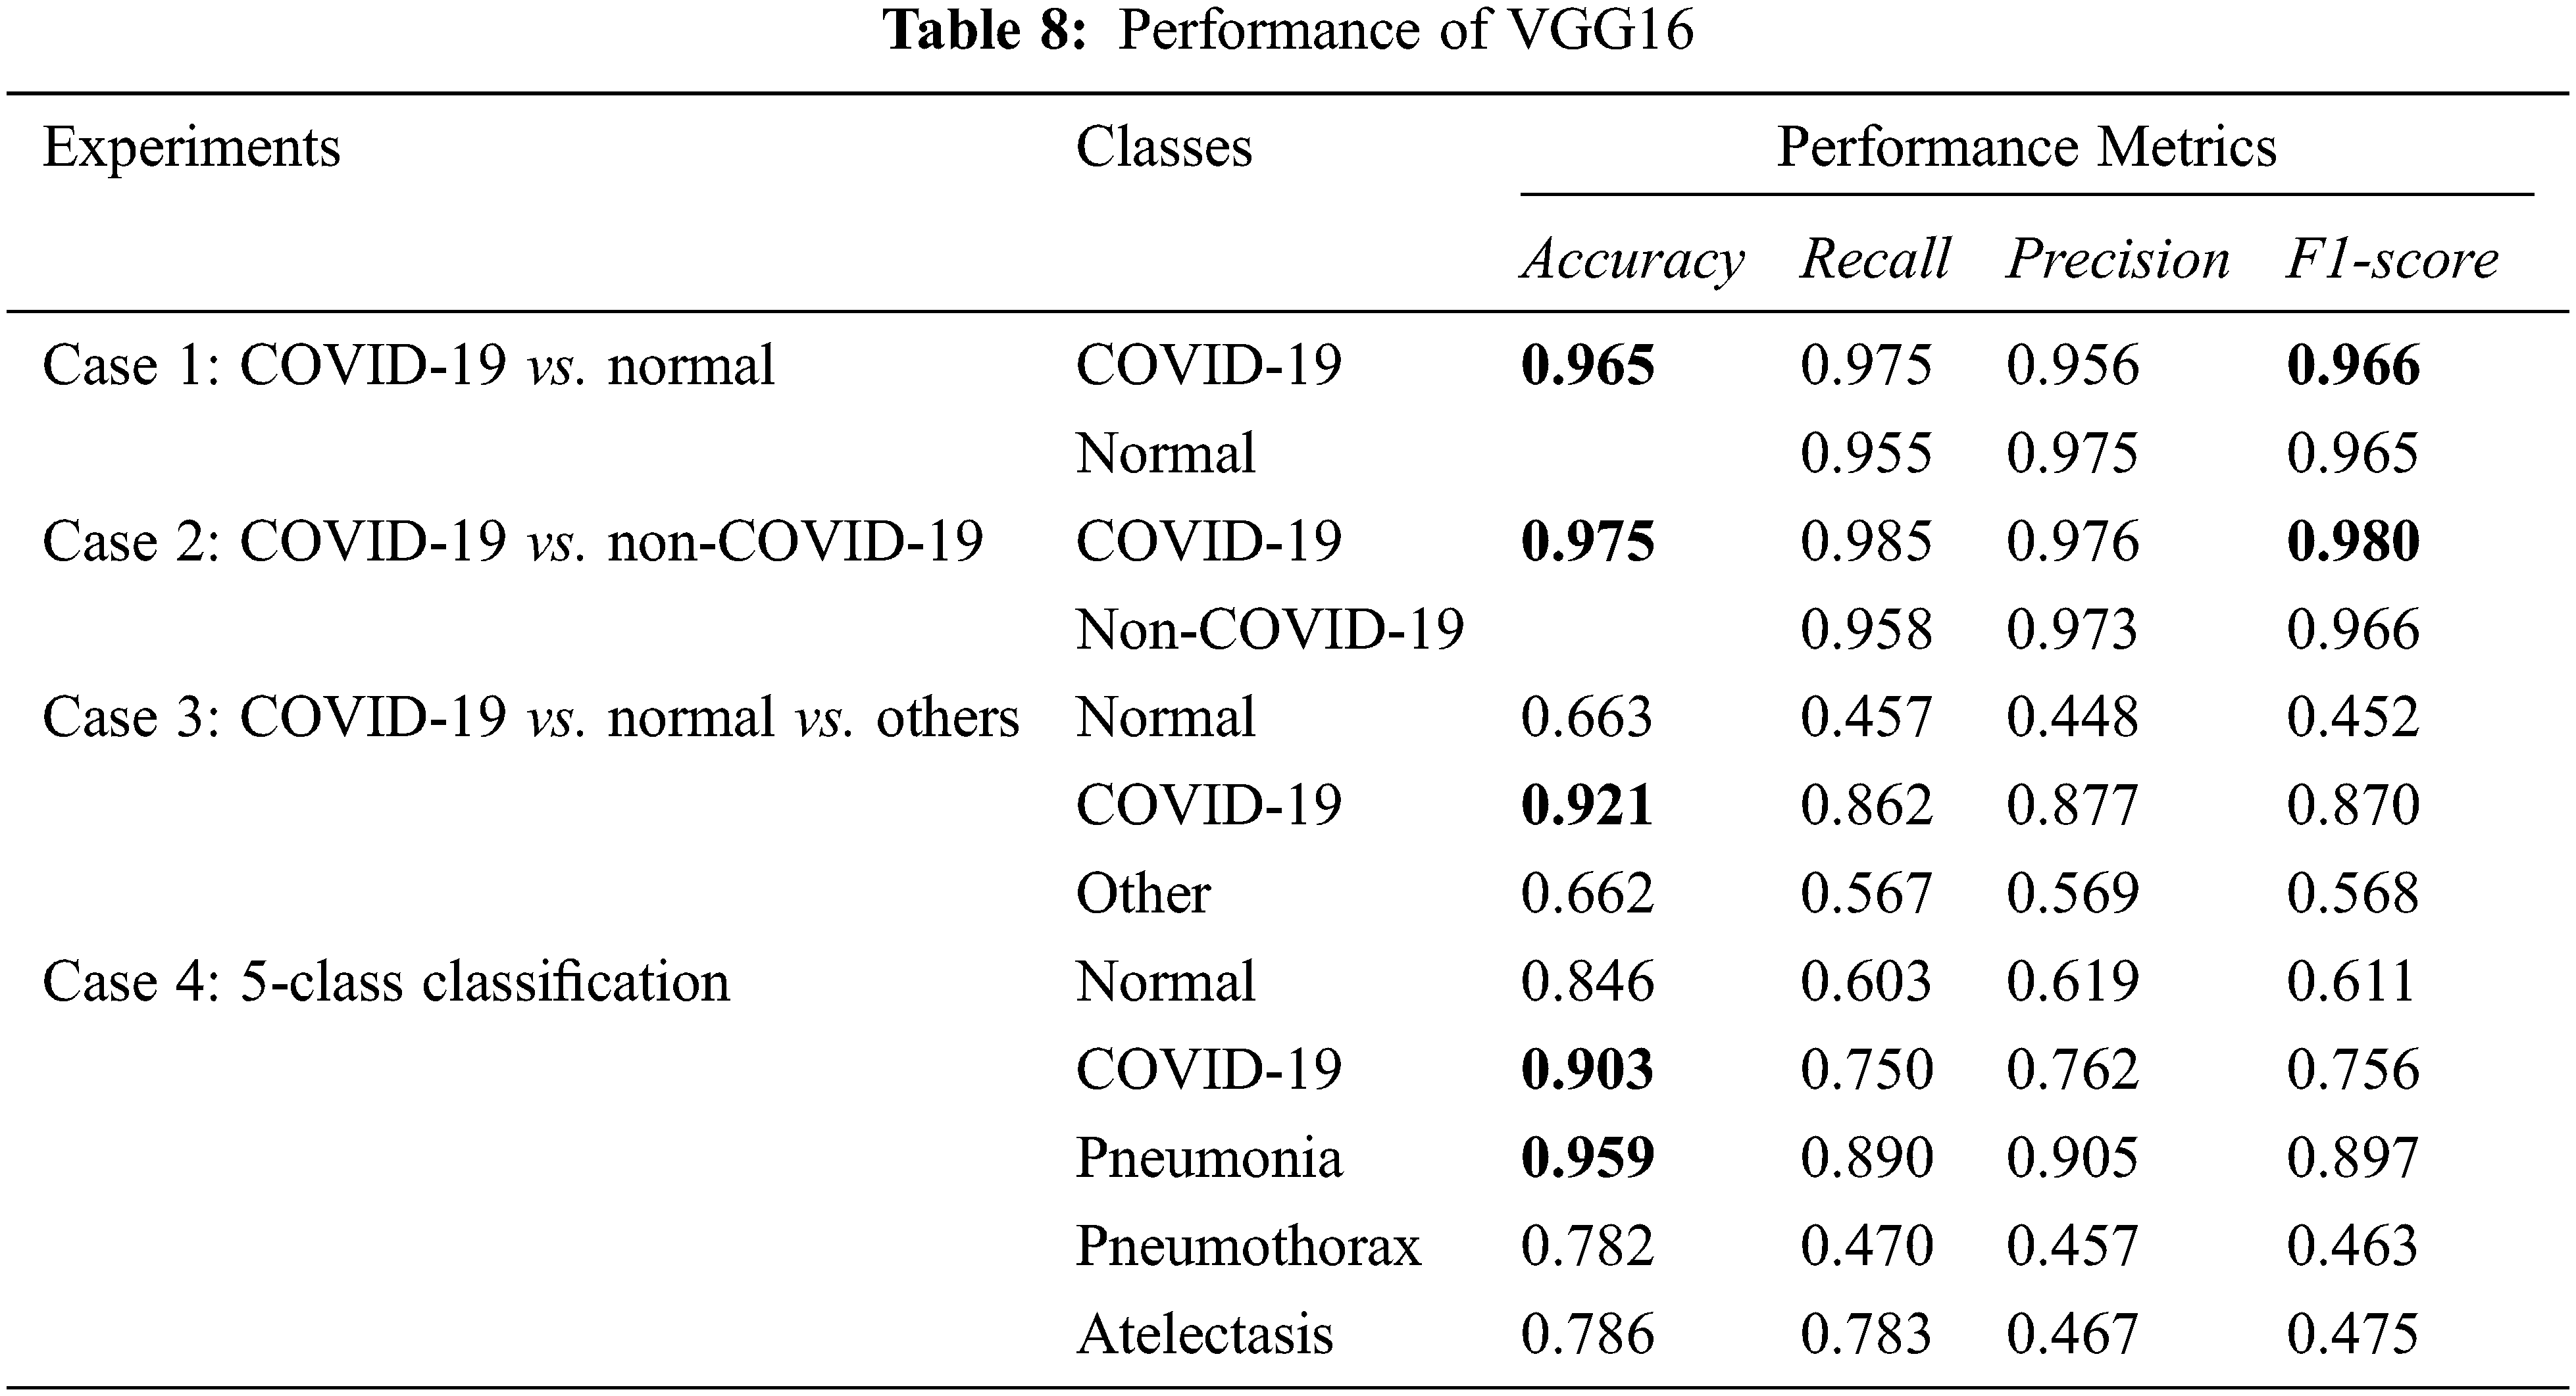
From Tabs. 8 and 9, experimental cases 1 and 2 which are binary class classification gave the most promising results with over 0.95 on the accuracy, recall, precision, and F1-score. For experimental cases 3 and 4, we consider more lung diseases for classification with 3 and 5 classes, respectively. Both of the experiments give good results on COVID-19 detection/classification. In experimental case 4 with 5-class classification, the performance in COVID-19 classification is 0.934 accuracy, while pneumonia classification is the best, with 0.968 accuracy.
In summary, both VGG16 and VGG19 models give a similar performance at binary-class classification. However, VGG19 performs slightly better than VGG16 at multi-class classification.
5.2 Classical Machine Learning Experiments
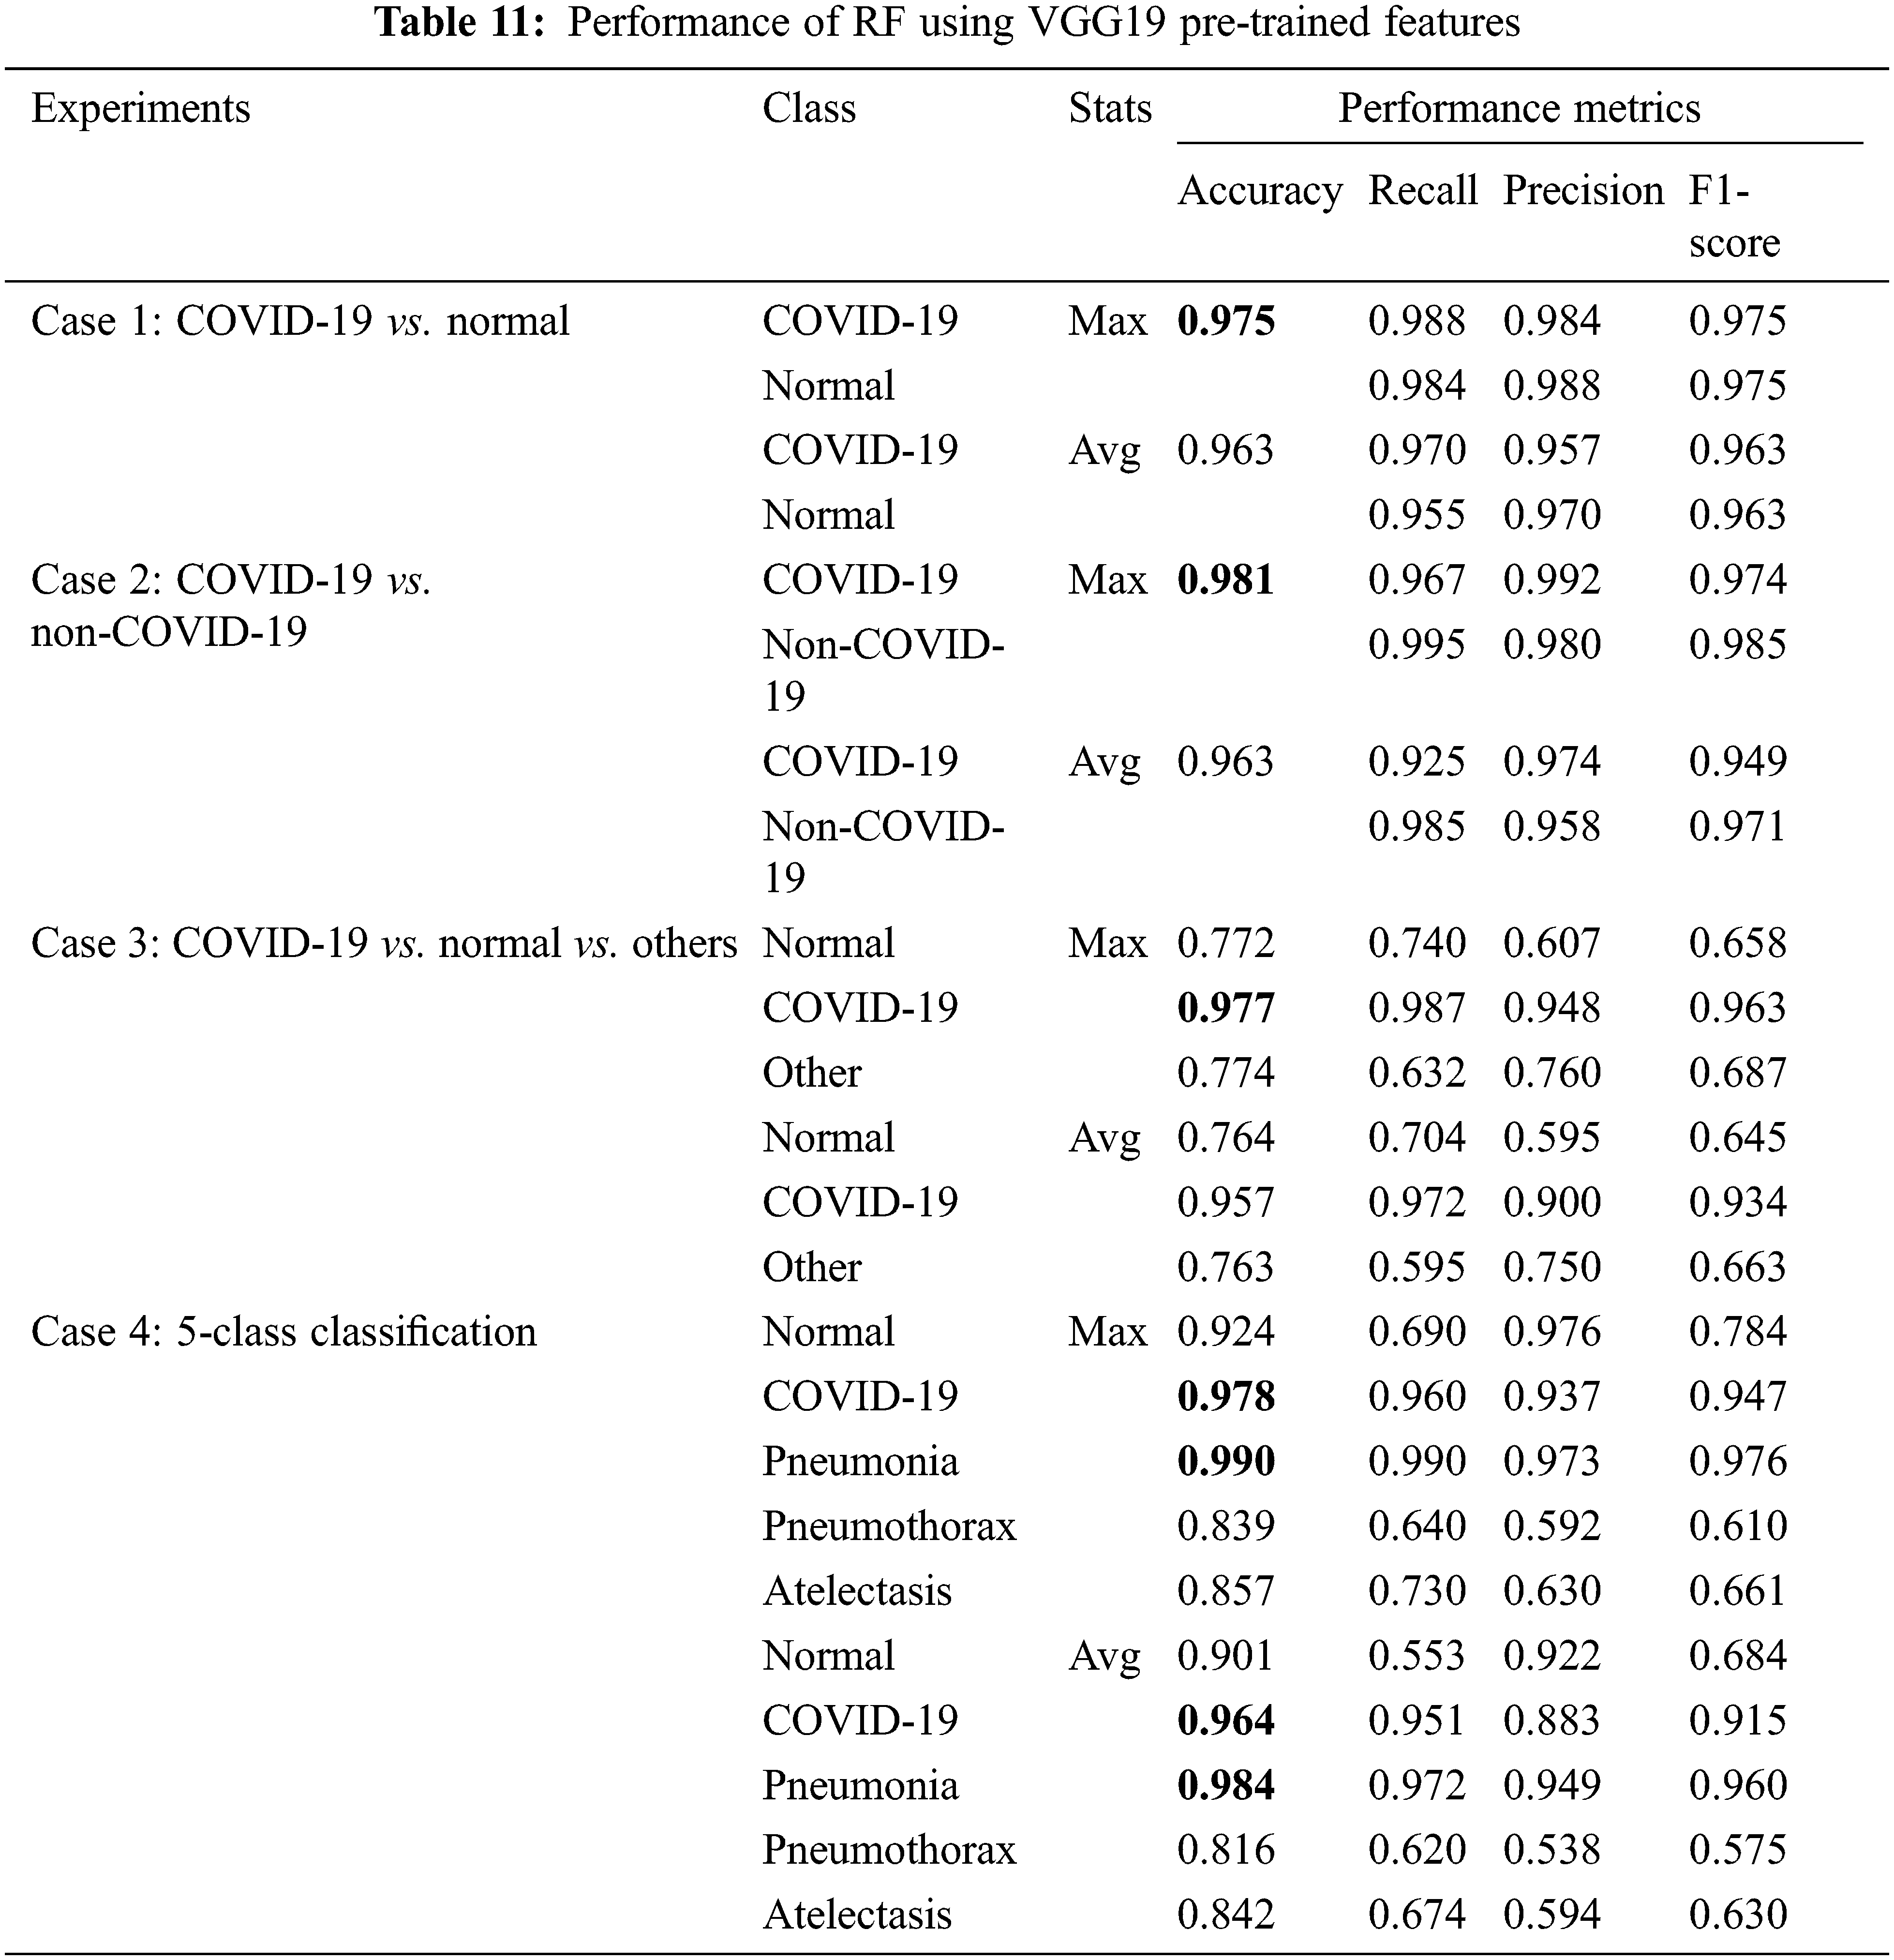
Next, we considered classical ML techniques with pre-trained features of VGG19 as input data. All experimental cases use 5-fold cross-validation method. The input images are in red-green-blue format. The performance evaluation metrics for SVM and RF are presented in Tabs. 10 and 11, respectively, where SVM was found to have superior performance among all classification techniques that we considered in all experiments.
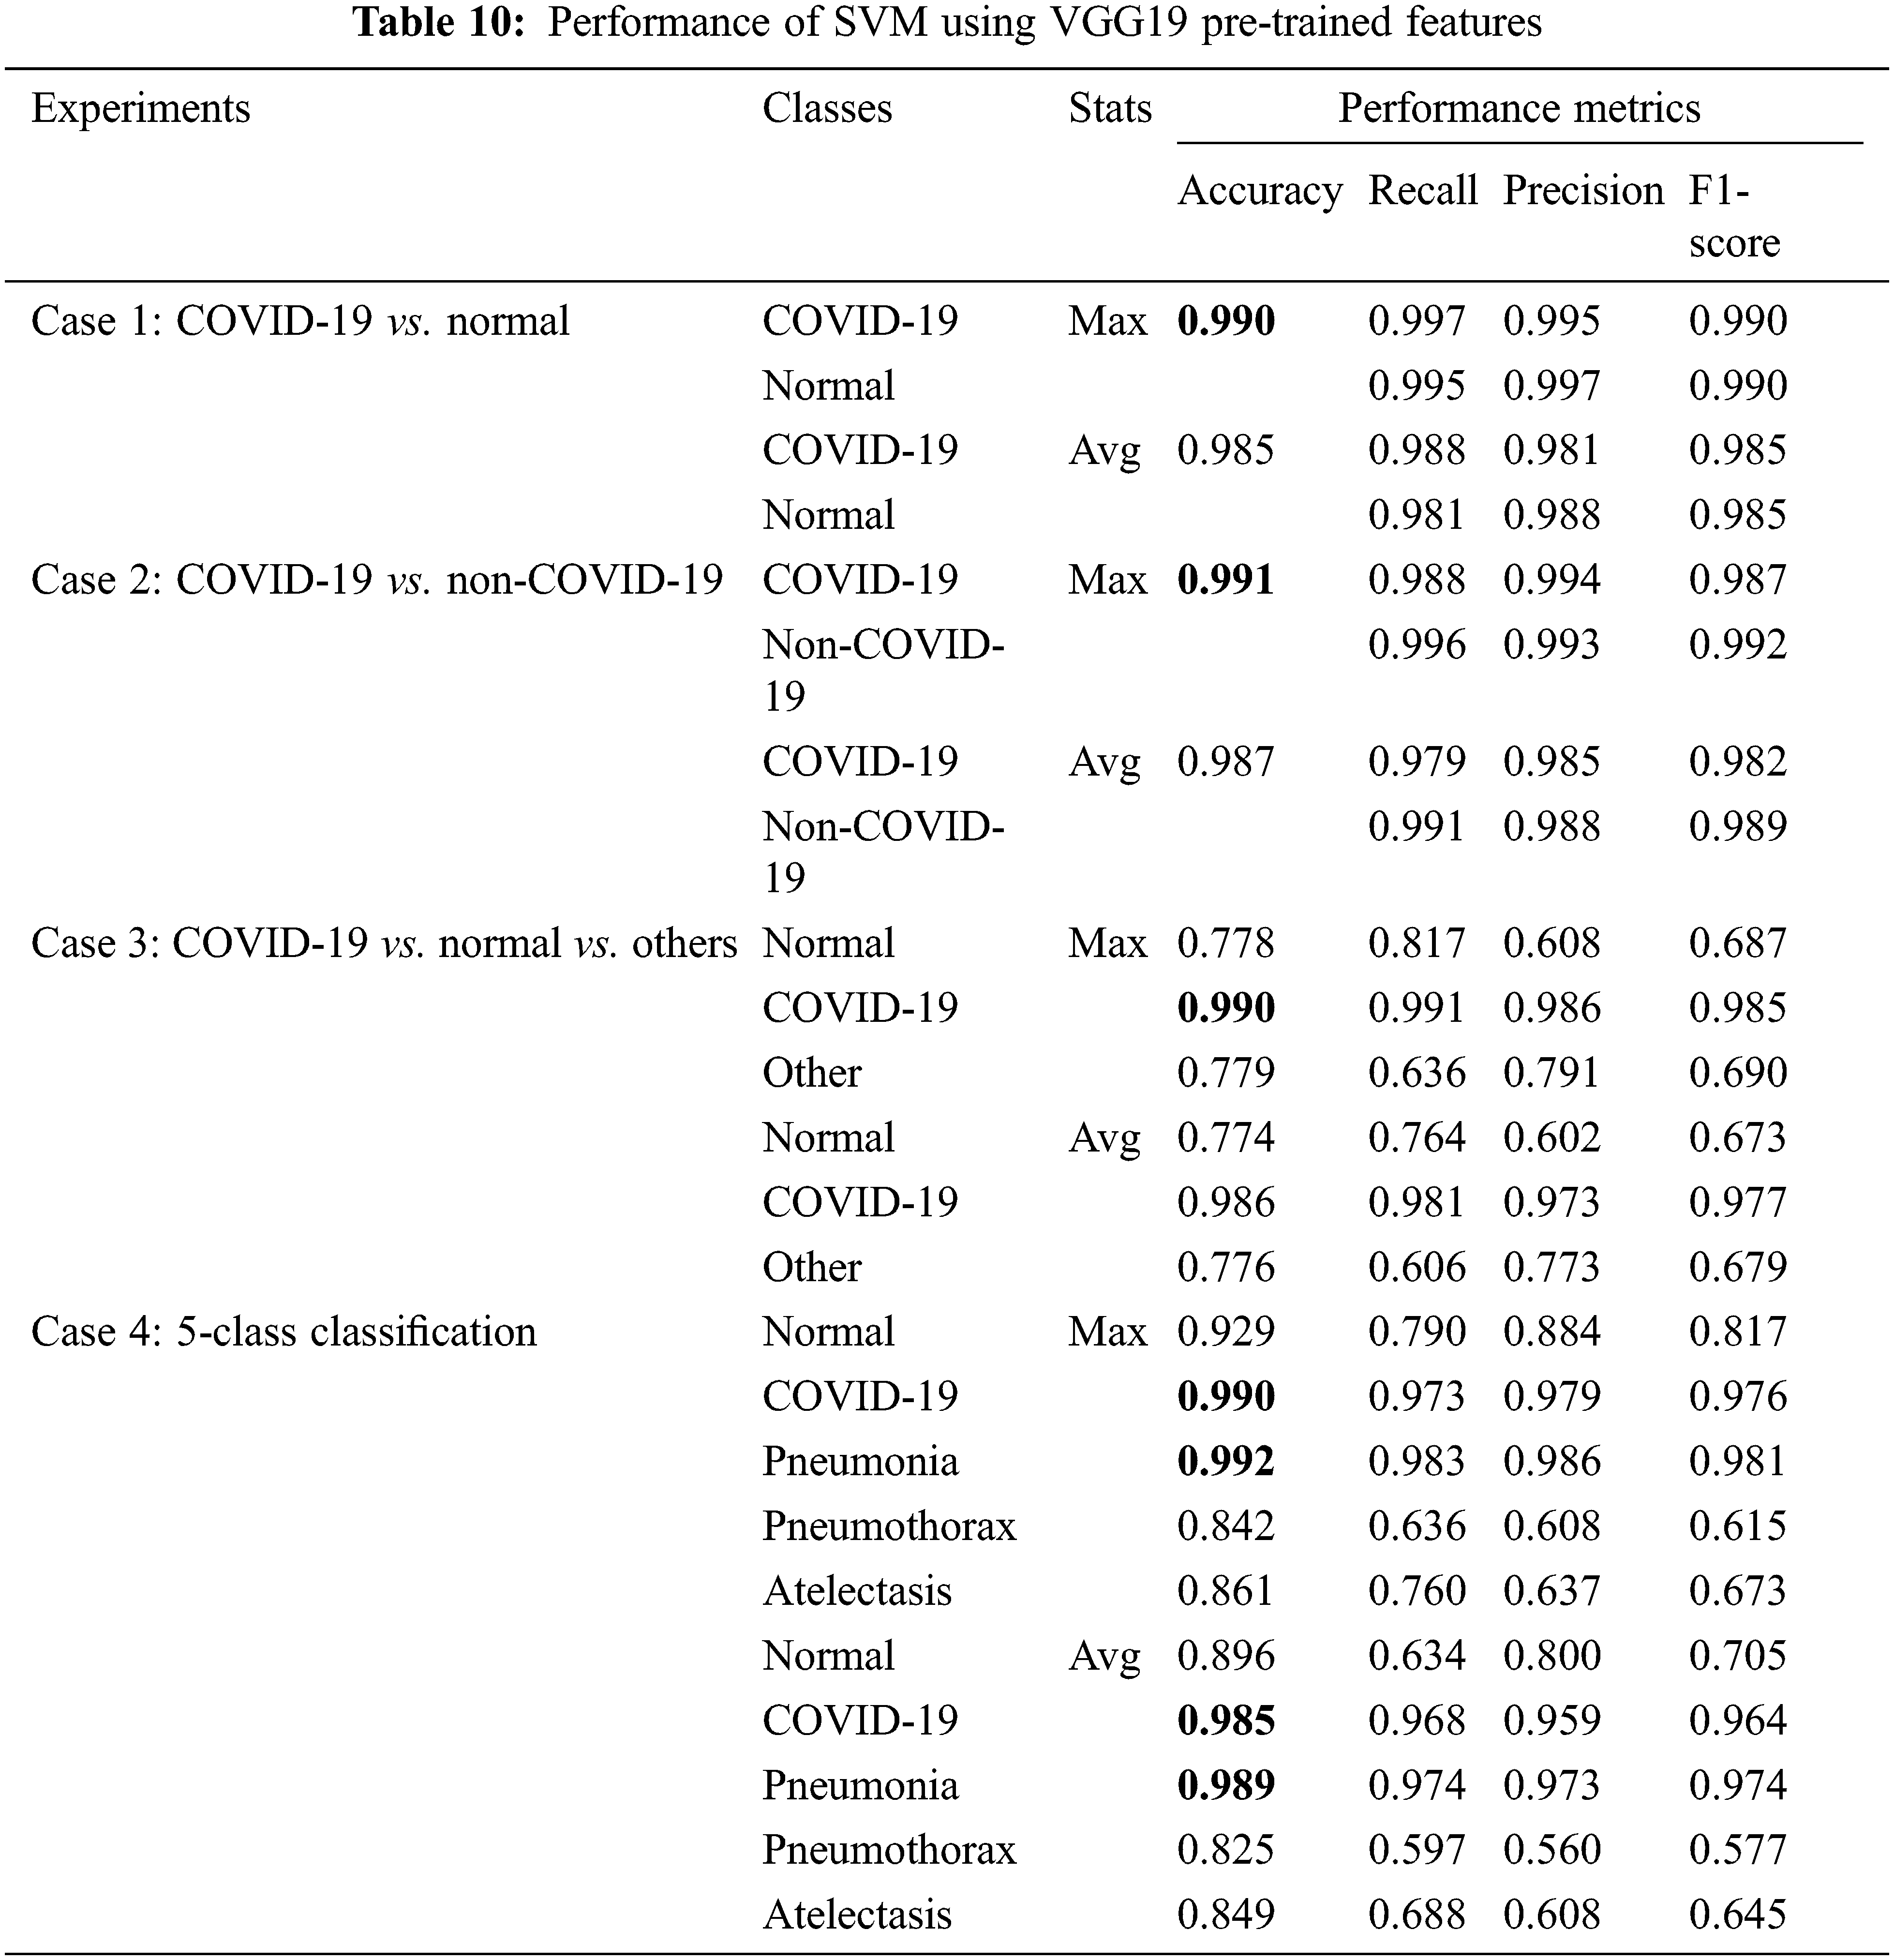
From Tab. 10, the SVM model gave very high accuracy and overall performance in all experimental cases, with 0.99 accuracy for COVID-19 classification, while less accuracy was obtained for normal or other disease classification. Other measures which are recall, precision and F1-score were obtained with similar results as the accuracy as shown in the table.
Tab. 11 presented the results obtained with the RF model, where COVID-19 detection was obtained with 0.96–0.98 accuracy and similar values for recall, precision, and F1-score. The RF is not as good as the SVM in solving these classification problems.
In our experiments, deep learning and classical machine learning models were trained to classify the X-ray images. We wanted to compare our computation time between using deep learning (VGG19) and classical machine learning (SVM and RF). The computation time is separated into two parts which are image pre-processing time and training time. The pre-processing time includes the time when images are resized, reformatted, encoded, and feature extracted. This is shown in Tab. 12. The computation time used for model training is shown in Tab. 13.
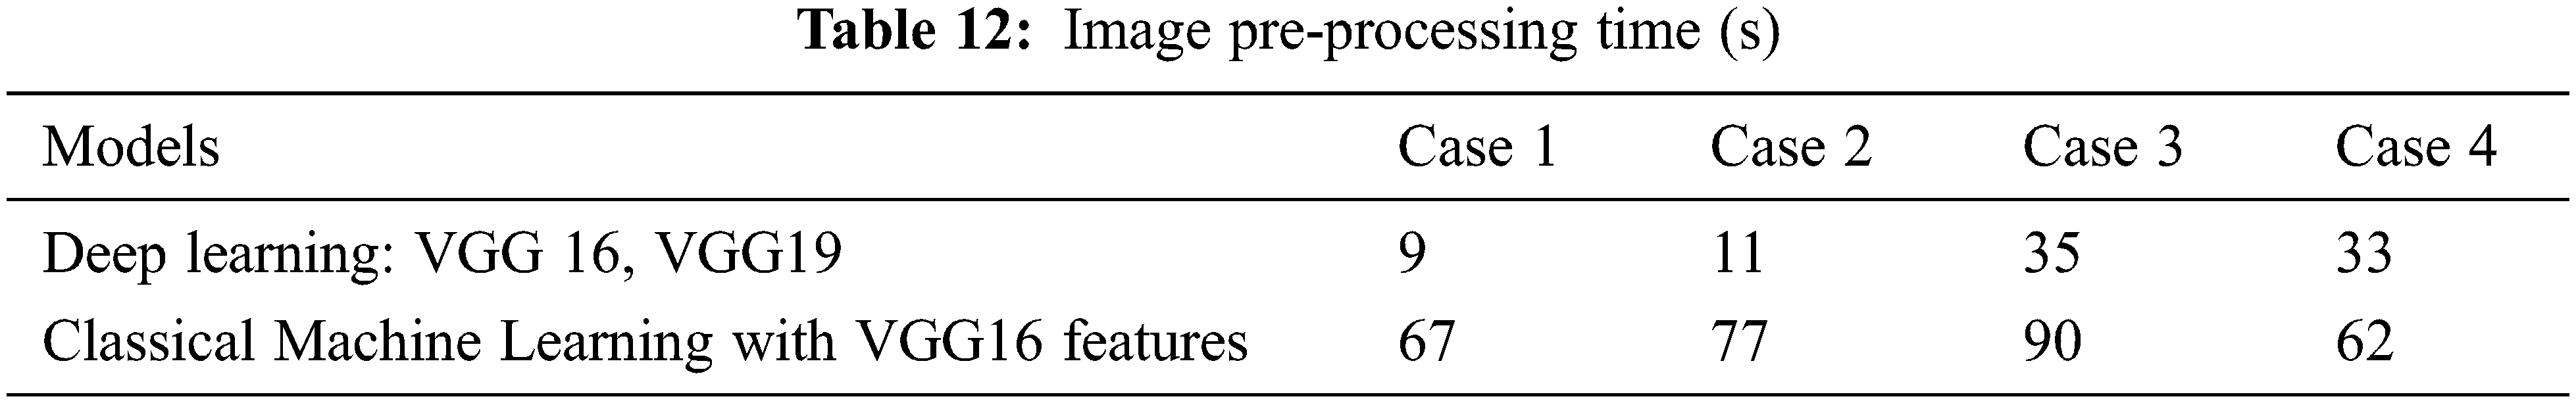
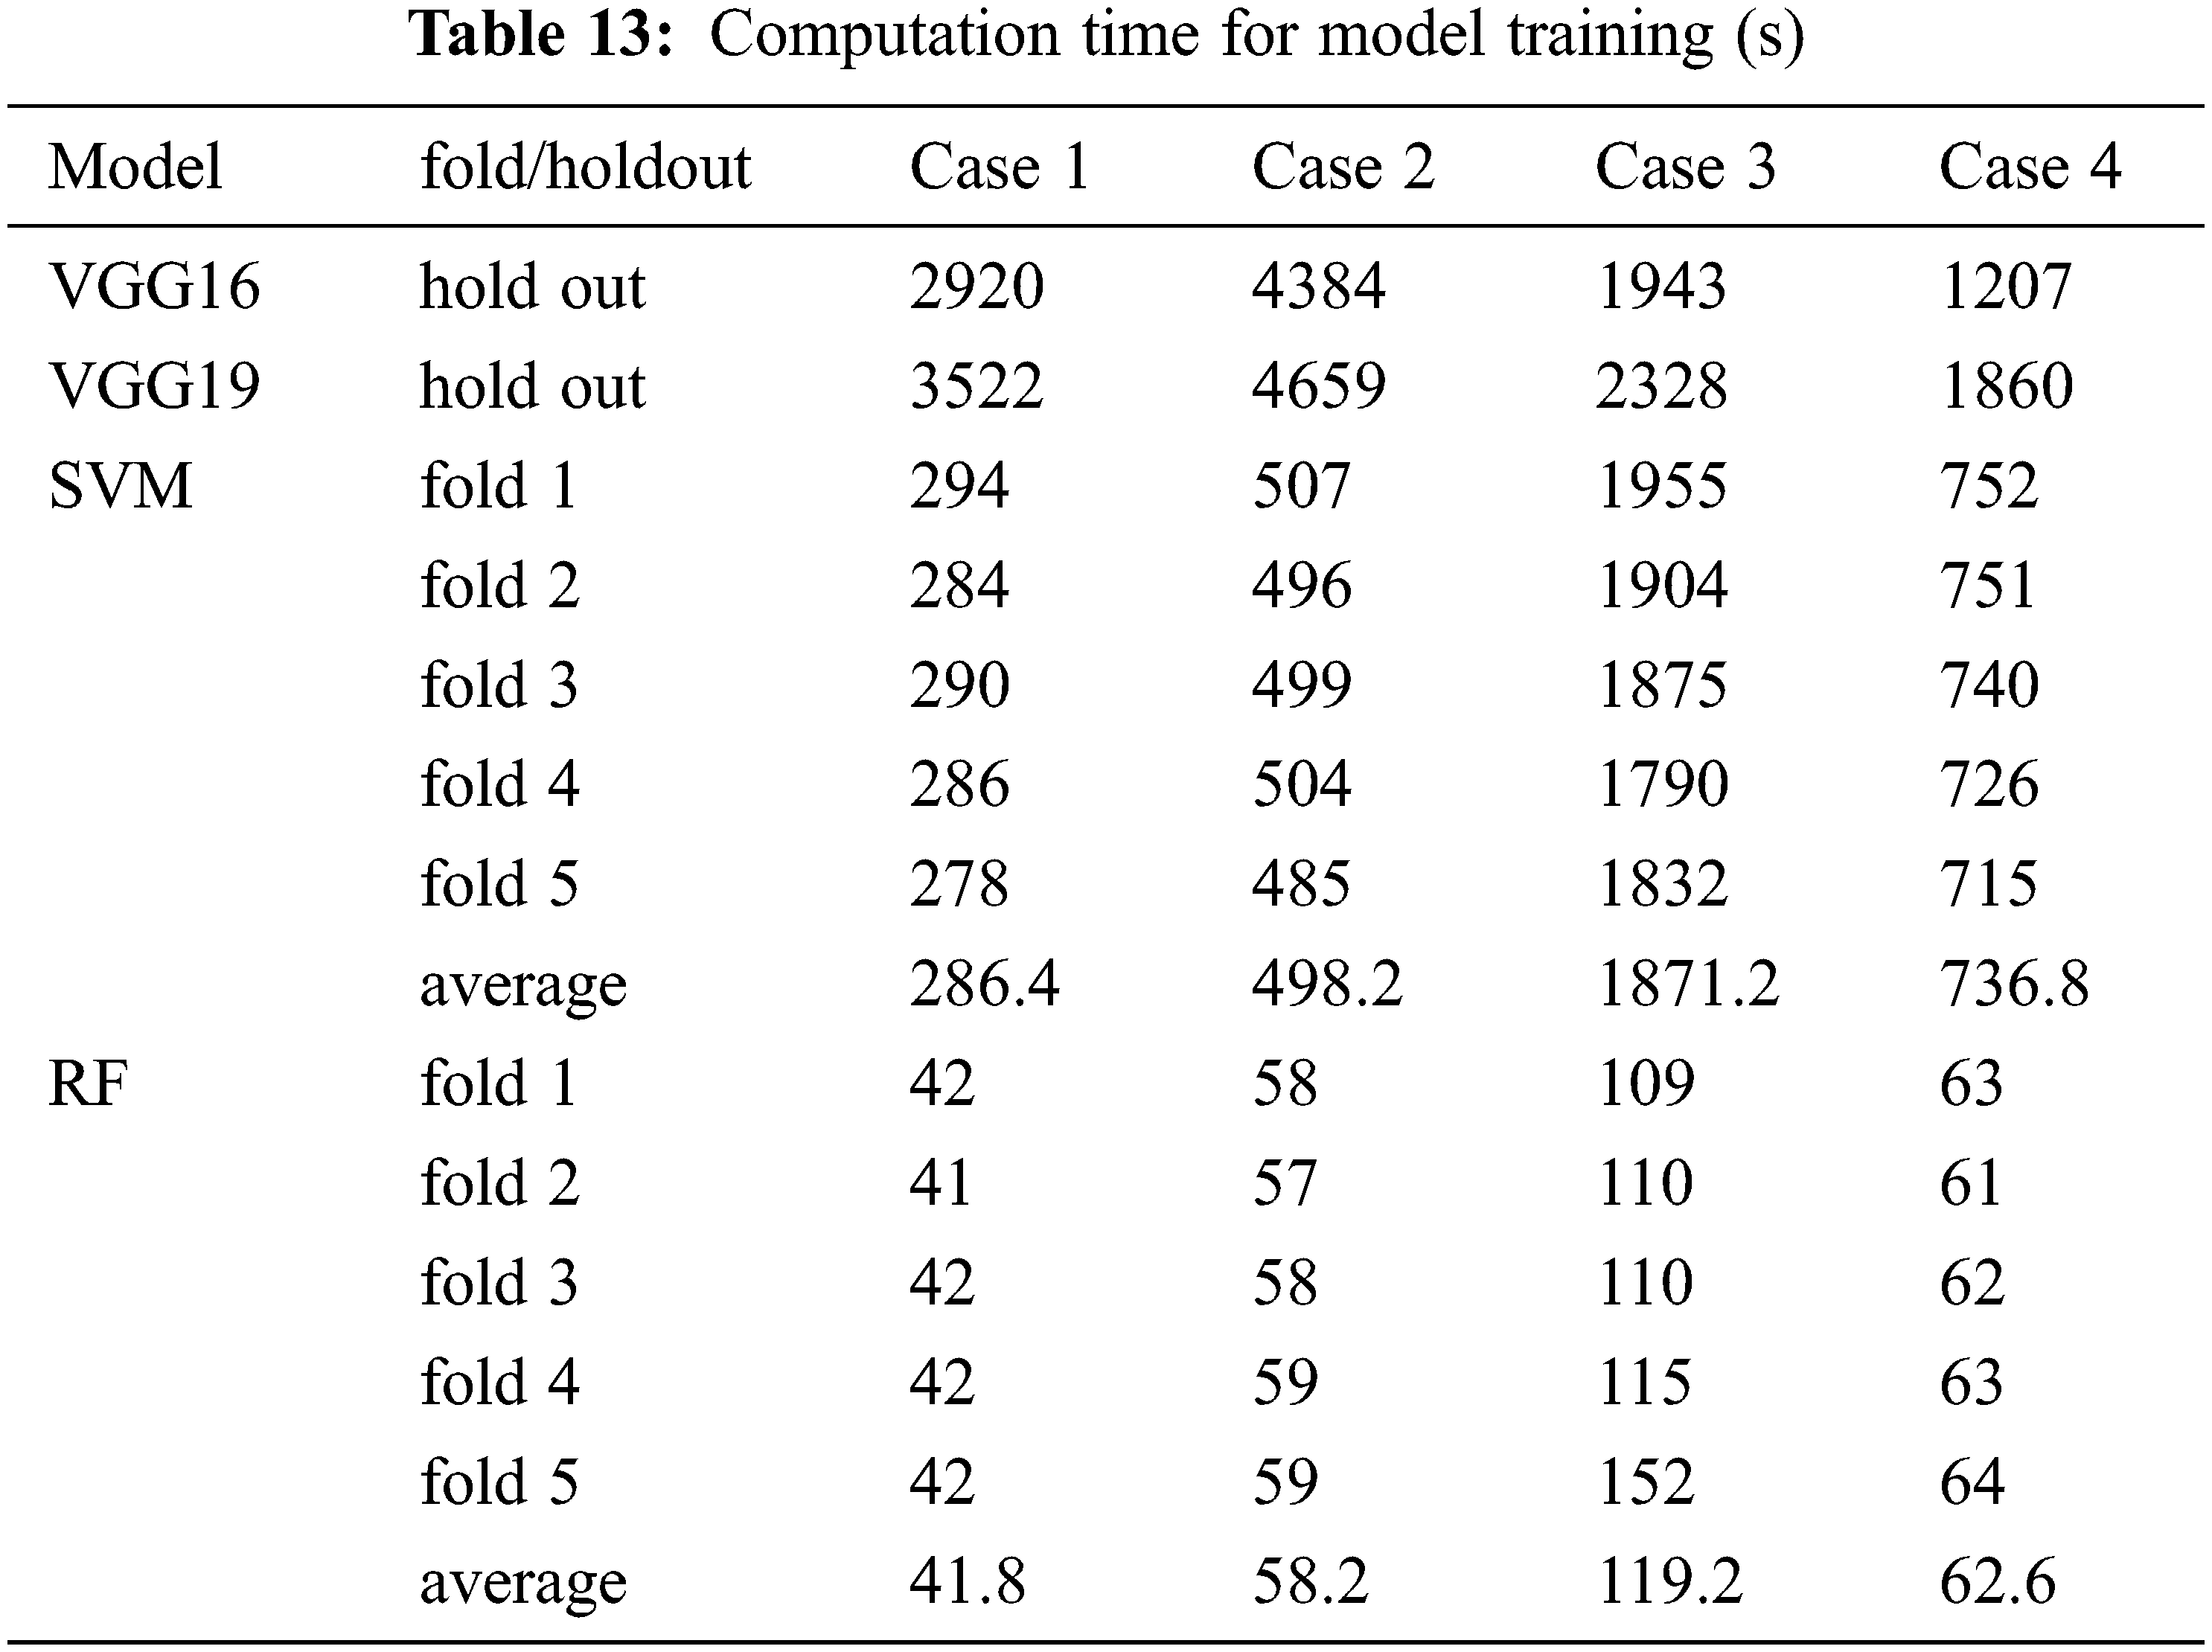
The image pre-processing time for the deep learning model is less than the time required for image pre-processing for classical machine learning because the deep learning model does not require feature extraction. However, training each deep learning model takes a significantly longer time than training a classical machine learning model, as shown in Tab. 13. In addition, for experimental case 3, the amount of data used in training each model is a lot more than in other cases. Thus, the SVM used more time with an average of 1871.2 s which is close to the deep learning training time. However, RF is the model that requires the lowest training time in all experimental cases.
5.4 Exploring NIH Dataset for COVID-19 Detection
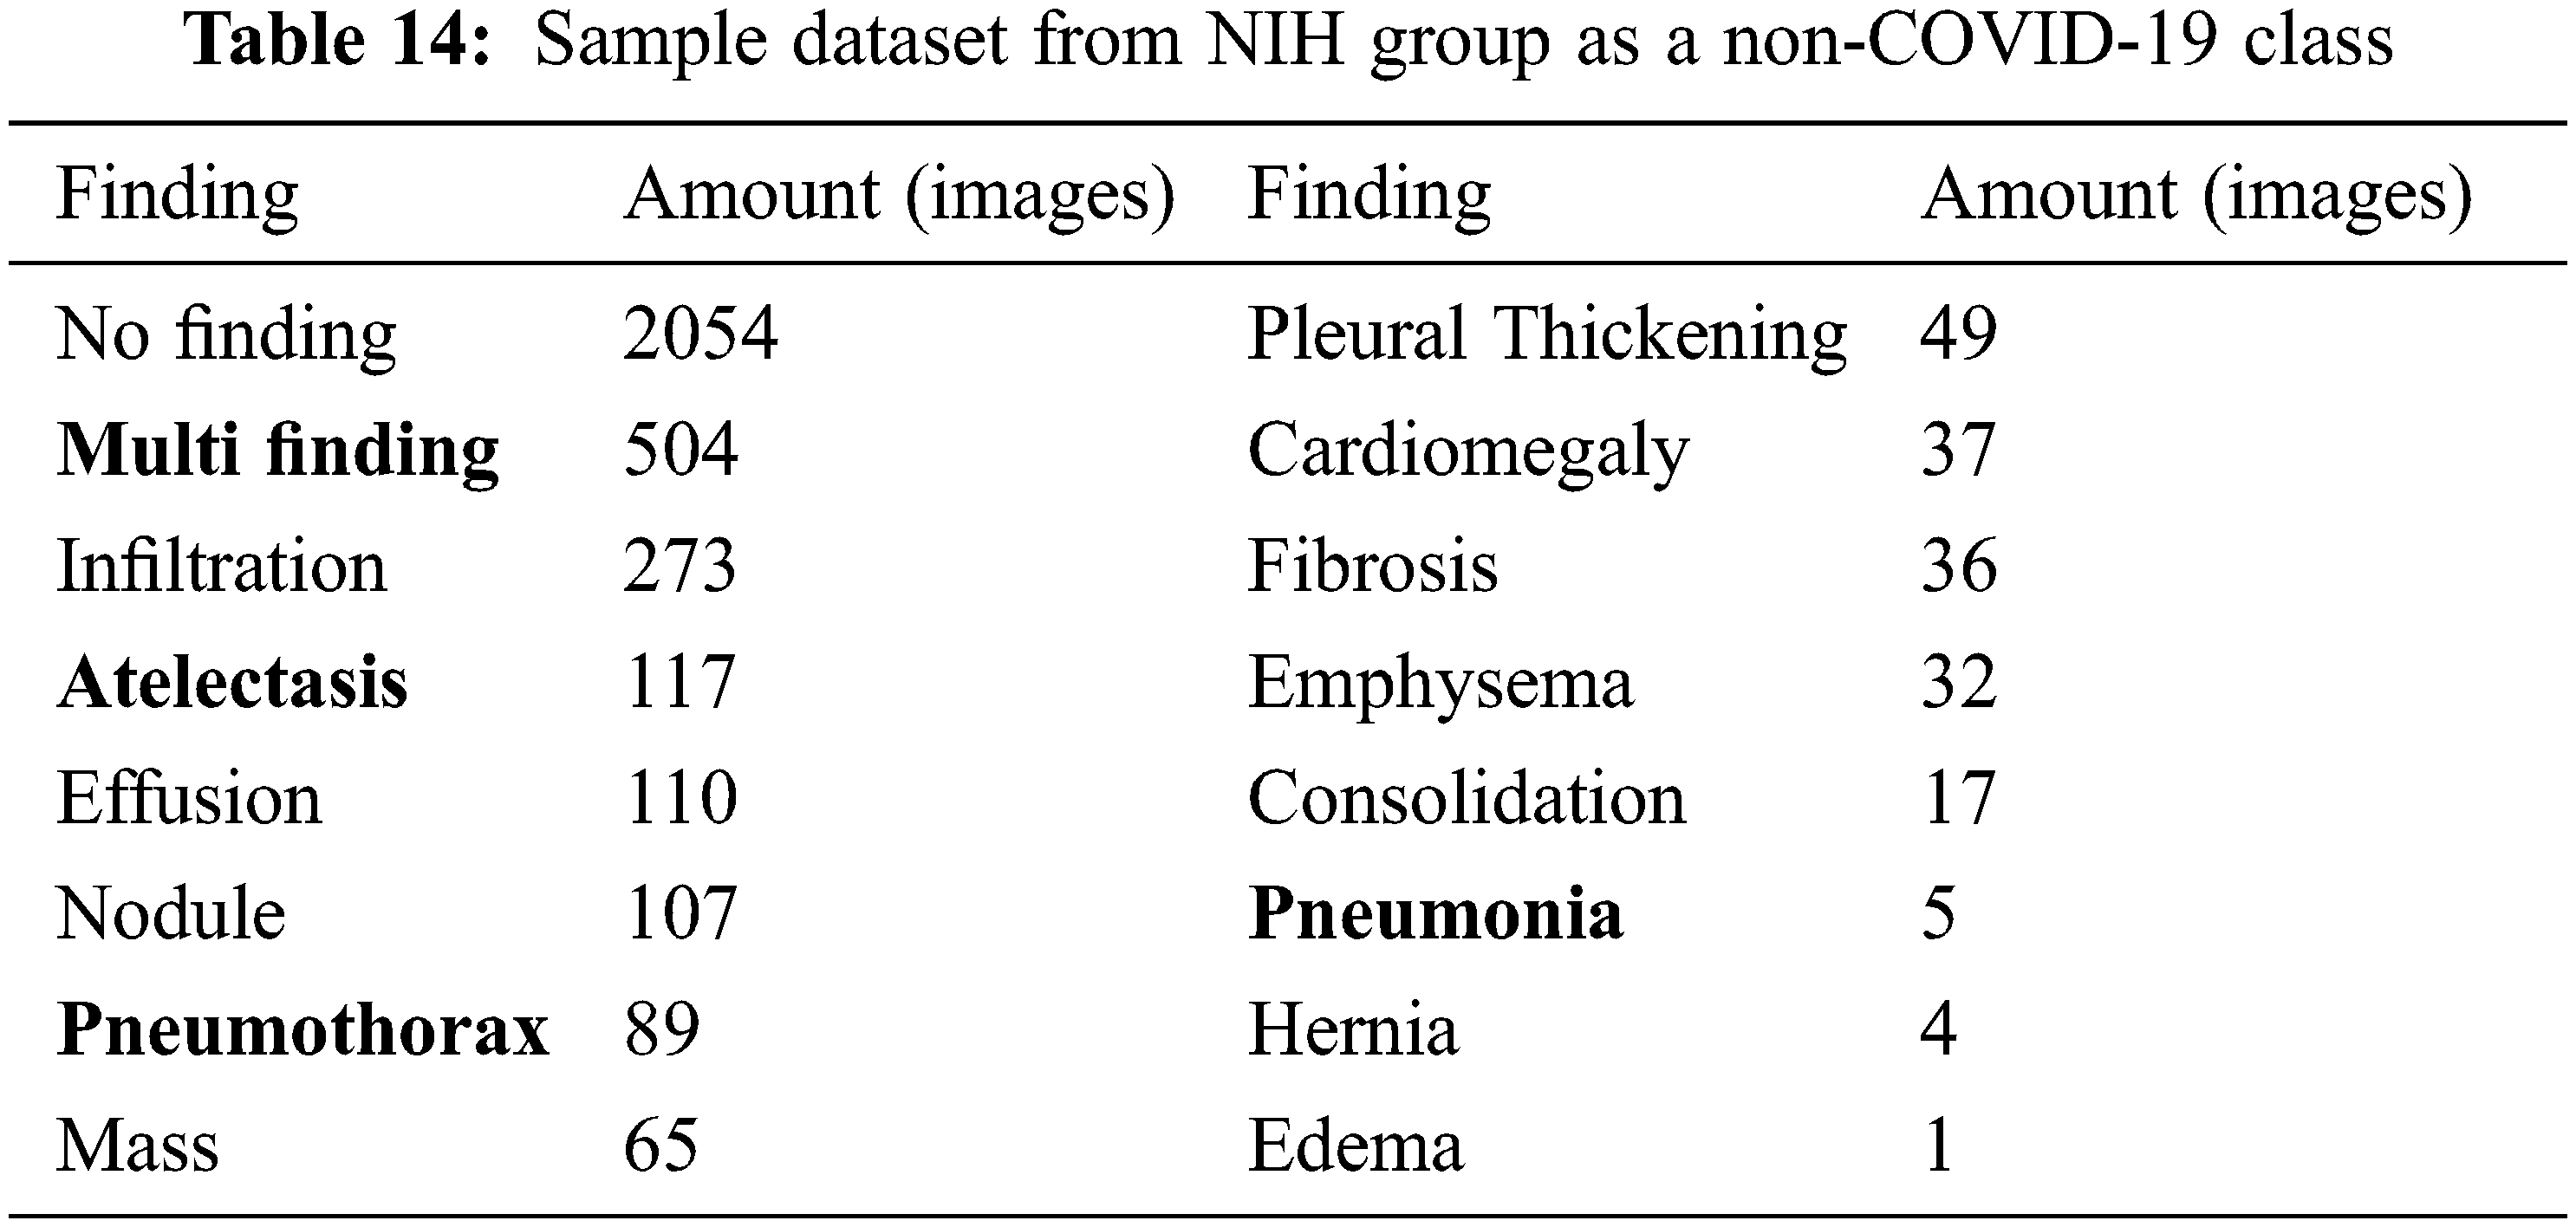
To further demonstrate the effectiveness of our SVM model to identify COVID-19 infected images apart from many other lung-infected/abnormal and normal images, we consider a well-known NIH dataset that consists of X-ray images of many lung diseases and abnormalities. The dataset does not have COVID-19 X-ray images, so we include in this last experiment the set of COVID-19 images that were used in our previous experimental cases. So, this last experiment consists of 3500 COVID-19 images and 3500 non-COVID-19 images from the NIH database.
We sampled 3500 images from the dataset consisting of normal (no finding), multi-finding, and many lung diseases and abnormalities as shown in Tab. 14. We want to perform COVID-19 detection against other diseases as well as normal. This is a binary class classification with 5-fold cross-validation. In this case, the VGG19 pre-trained features are used as input and the classification result is shown in Tab. 15.
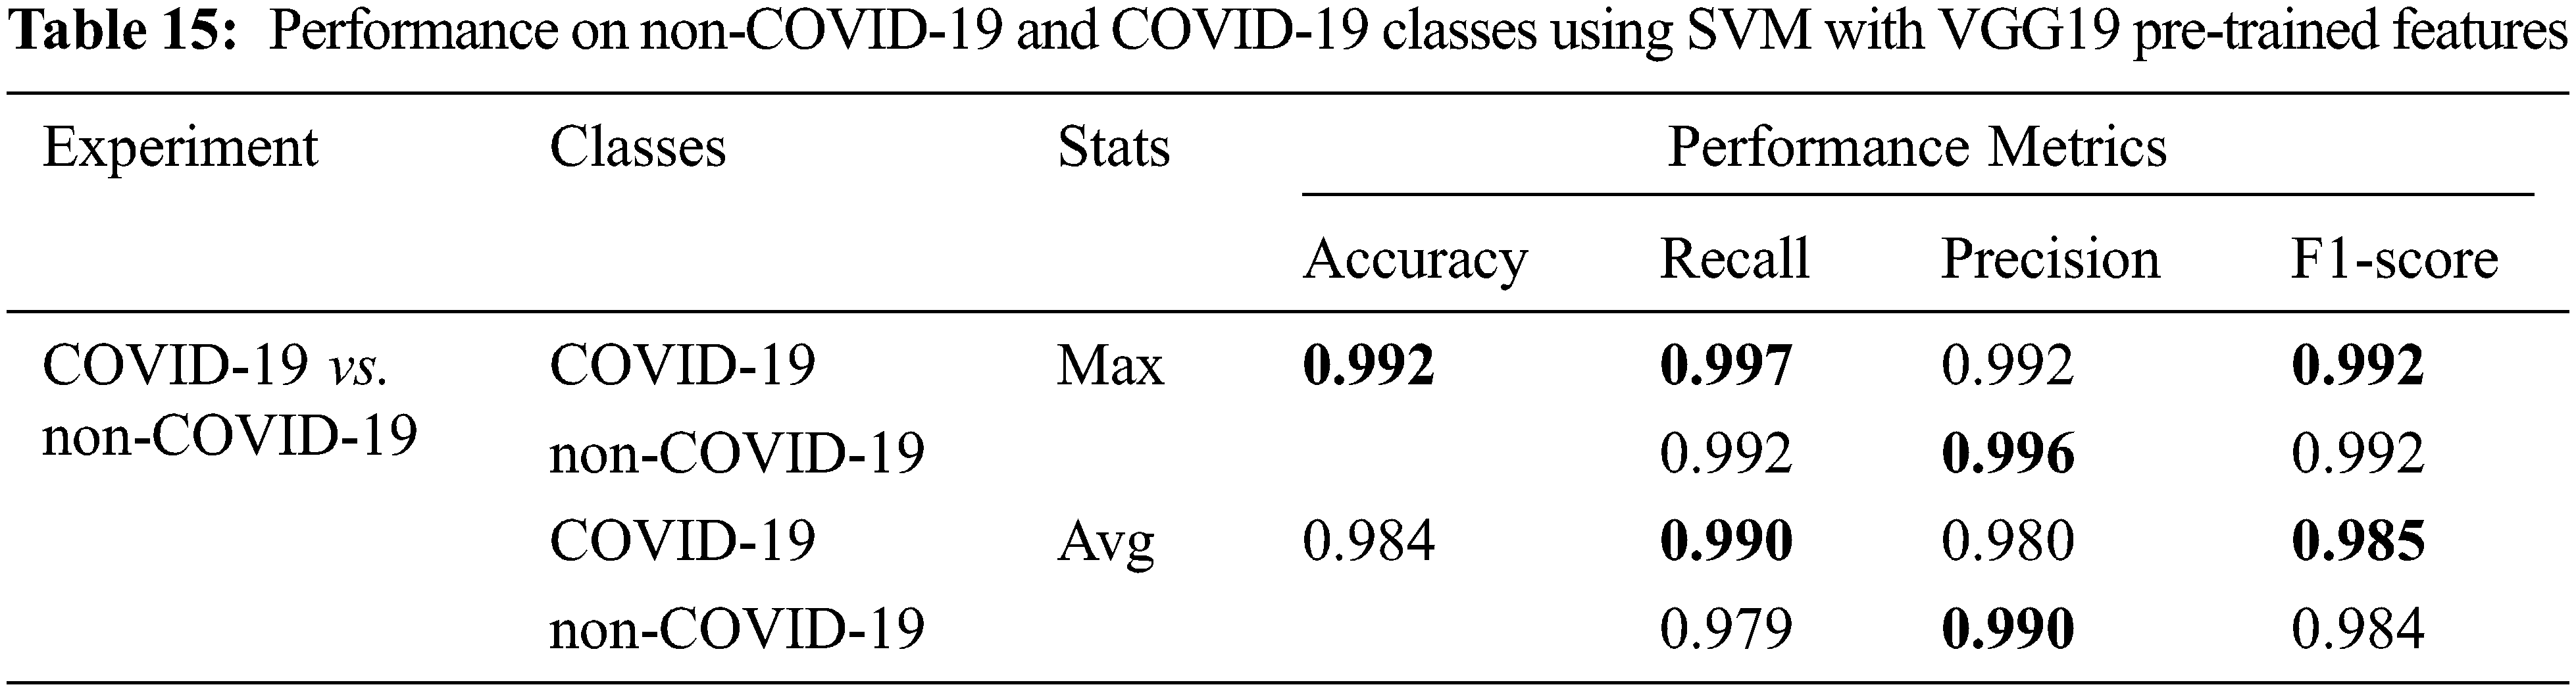
In this experiment with our SVM model, COVID-19 images can be detected with 0.984 accuracy on average of 5 folds, and sometimes as high as 0.992 accuracy in a fold which is quite impressive. The other performance metrics which are recall, precision and F1-score also have very high values ranging between 0.98–0.99 on average, and sometimes as high as 0.997, as shown in Tab. 15. This means the SVM model can detect COVID-19 accurately against many other findings in the chest X-ray images.
In summary, our classification models have very good performance on binary-class classification with both classical machine learning approach and deep learning approach. Overall, the classical machine learning technique SVM with VGG-19 pre-trained features gives the best classification performance. In this work, we also consider the computation time of all classification models including image pre-processing time. Datasets with many lung diseases and abnormalities from well-known database and NIH were also considered in our classification models.
The SVM model requires more computation time (image pre-processing time and training time) than the RF model, but less than the deep learning’s computation time. In other words, the proposed SVM with VGG19 pre-trained features has superior performance than the deep learning models both in terms of classification performance (i.e., accuracy, recall, precision, and F1-score) and computation time.
In conclusion, we can apply deep learning and classical machine learning approaches to automatically detect/classify lung diseases with chest X-ray images. Our future work is to deploy the detection/classification models for practical usage.
Funding Statement: The authors received no specific funding for this study.
Conflicts of Interest: The authors declare that they have no conflicts of interest to report regarding the present study.
1. WHO Coronavirus (Covid-19). [Online]. Available: https://covid19.who.int/ (20 October 2021). [Google Scholar]
2. J. D. Arias-Londoño, J. A. Gómez-García, L. Moro-Velázquez and J. I. Godino-Lorente, “Artificial intelligence applied to chest X-ray images for the automatic detection of COVID-19. a thoughtful evaluation approach,” IEEE Access, vol. 8, pp. 226811–226827, 2020. [Google Scholar]
3. A. I. Khan, J. L. Shah and M. M. Bhat, “CoroNet: A deep neural network for detection and diagnosis of COVID-19 from chest x-ray images,” Computer Methods and Programs in Biomedicine, vol. 196, pp. 1–9, 2020. [Google Scholar]
4. D. N. Vinod and S. R. S. Prabaharan, “Data science and the role of artificial intelligence in achieving the fast diagnosis of COVID-19,” Chaos, Solitons & Fractals, vol. 140, pp. 1–7, 2020. [Google Scholar]
5. A. Abbas, M. M. Abdelsamea and M. M. Gaber, “Classification of COVID-19 in chest X-ray images using deTraC deep convolutional neural network,” Applied Intelligence, vol. 51, pp. 854–864, 2021. [Google Scholar]
6. A. Sedik, A. M. Iliyasu, B. Abd El-Rahiem, M. E. Abdel Samea, A. Abdel-Raheem et al., “Deploying machine and deep learning models for efficient data-augmented detection of COVID-19 infections,” Viruses, vol. 12, no. 7, pp. 1–29, 2020. [Google Scholar]
7. M. Y. Kamil, “A deep learning framework to detect covid-19 disease via chest X-ray and CT scan images,” International Journal of Electrical and Computer Engineering, vol. 11, pp. 844–850, 2021. [Google Scholar]
8. A. K. Rangarajan and H. K. Ramachandran, “A preliminary analysis of AI based smartphone application for diagnosis of COVID-19 using chest X-ray images,” Expert Systems with Applications, vol. 183, pp. 1–11, 2021. [Google Scholar]
9. I. J. Goodfellow, J. Pouget-Abadie, M. Mirza, B. Xu, D. Warde-Farley et al., “Generative adversarial networks,” in Int. Conf. on Neural Information Processing Systems, Montreal, Canada, pp. 2672–2680, 2014. [Google Scholar]
10. D. I. Morís, J. J. de Moura Ramos, J. N. Buján and M. O. Hortas, “Data augmentation approaches using cycle-consistent adversarial networks for improving COVID-19 screening in portable chest X-ray images,” Expert Systems with Applications, vol. 185, pp. 1–12, 2021. [Google Scholar]
11. T. B. Chandra, K. Verma, B. K. Singh, D. Jain and S. S. Netam, “Coronavirus disease (COVID-19) detection in chest X-ray images using majority voting based classifier ensemble,” Expert Systems with Applications, vol. 165, pp. 1–13, 2021. [Google Scholar]
12. E. Emary, H. M. Zawbaa and A. E. Hassanien, “Binary grey wolf optimization approaches for feature selection,” Neurocomputing, vol. 172, pp. 371–381, 2016. [Google Scholar]
13. T. Tuncer, S. Dogan and F. Ozyurt, “An automated residual exemplar local binary pattern and iterative ReliefF based COVID-19 detection method using chest X-ray image,” Chemometrics and Intelligent Laboratory Systems, vol. 203, pp. 1–11, 2020. [Google Scholar]
14. M. Pietikäinen, “Image analysis with local binary patterns,” in Image Analysis, Joensuu, Finland, pp. 115–118, 2005. [Google Scholar]
15. R. J. Urbanowicz, M. Meeker, W. LaCava, R. S. Olson and J. H. Moore, “Relief-based feature selection: Introduction and review,” Journal of Biomedical Informatics, vol. 85, pp. 189–203, 2018. [Google Scholar]
16. Ş Öztürk, U. Özkaya and M. Barstuğan, “Classification of coronavirus (COVID-19) from X-ray and CT images using shrunken features,” International Journal of Imaging Systems and Technology, vol. 31, pp. 5–15, 2021. [Google Scholar]
17. A. A. Ardakani, U. R. Acharya, S. Habibollahi and A. Mohammadi, “COVIDiag: A clinical CAD system to diagnose COVID-19 pneumonia based on CT findings,” European Radiology, vol. 31, pp. 121–130, 2021. [Google Scholar]
18. D. A. D. Júnior, L. B. da Cruz, J. O. B. Diniz, G. L. F. da Silva, G. B. Junior et al., “Automatic method for classifying COVID-19 patients based on chest X-ray images, using deep features and PSO-optimized XGBoost,” Expert Systems with Applications, vol. 183, pp. 1–13, 2021. [Google Scholar]
19. M. Tamal, M. Alshammari, M. Alabdullah, R. Hourani, H. A. Alola et al., “An integrated framework with machine learning and radiomics for accurate and rapid early diagnosis of COVID-19 from chest X-ray,” Expert Systems with Applications, vol. 180, pp. 1–8, 2021. [Google Scholar]
20. P. Lambin, E. Rios-Velazquez, R. Leijenaar, S. Carvalho, R. G. P. M. Van Stiphout et al., “Radiomics: Extracting more information from medical images using advanced feature analysis,” European Journal of Cancer, vol. 48, pp. 441–446, 2012. [Google Scholar]
21. M. E. H. Chowdhury, T. Rahman, A. Khandakar, R. Mazhar, M. A. Kadir et al., “Can AI help in screening viral and COVID-19 pneumonia?,” IEEE Access, vol. 8, pp. 132665–132676, 2020. [Google Scholar]
22. T. Rahman, A. Khandakar, Y. Qiblawey, A. Tahir, S. Kiranyaz et al., “Exploring the effect of image enhancement techniques on COVID-19 detection using chest X-ray images,” Computers in Biology and Medicine, vol. 132, pp. 1–16, 2021. [Google Scholar]
23. X. Wang, Y. Peng, L. Lu, Z. Lu, M. Bagheri et al., “ChestX-Ray8: Hospital-scale chest X-ray database and benchmarks on weakly-supervised classification and localization of common thorax diseases,” in IEEE Conf. on Computer Vision and Pattern Recognition, Hawaii, Honolulu USA, pp. 3462–3471, 2017. [Google Scholar]
24. A. Krizhevsky, I. Sutskever and G. E. Hinton, “ImageNet classification with deep convolutional neural networks,” Communications of the ACM, vol. 60, pp. 84–90, 2017. [Google Scholar]
25. S. J. Pan and Q. Yang, “A survey on transfer learning,” IEEE Transactions on Knowledge and Data Engineering, vol. 22, pp. 1345–1359, 2010. [Google Scholar]
26. J. Deng, W. Dong, R. Socher, L. -J. Li, K. Li et al., “ImageNet: A large-scale hierarchical image database,” in IEEE Conf. on Computer Vision and Pattern Recognition, Florida, Miami, USA, pp. 248–255, 2009. [Google Scholar]
27. K. Simonyan and A. Zisserman, “Very deep convolutional networks for large-scale image recognition,” in Int. Conf. on Learning Representations, California, San Diego, USA, pp. 1–14, 2015. [Google Scholar]
28. M. A. Hearst, S. T. Dumais, E. Osuna, J. Platt and B. Scholkopf, “Support vector machines,” IEEE Intelligent Systems and Their Applications, vol. 13, no. 4, pp. 18–28, 1998. [Google Scholar]
29. L. Breiman, “Random forests,” Machine Learning, vol. 45, pp. 5–32, 2001. [Google Scholar]
30. J. R. Quinlan, “Induction of decision trees,” Machine Learning, vol. 1, pp. 81–106, 1986. [Google Scholar]
 | This work is licensed under a Creative Commons Attribution 4.0 International License, which permits unrestricted use, distribution, and reproduction in any medium, provided the original work is properly cited. |