DOI:10.32604/iasc.2022.025113
| Intelligent Automation & Soft Computing DOI:10.32604/iasc.2022.025113 | |
| Article |
Mango Leaf Stress Identification Using Deep Neural Network
1DIT University, Dehradun, 248003, India
2Chandigah University, Mohali, 175001, India
*Corresponding Author: Vinay Gautam. Email: vinaykkr@gmail.com
Received: 12 November 2021; Accepted: 17 January 2022
Abstract: Mango is a widely growing and consumable fruit crop. The quantity and quality of production are most important to satisfy the needs of the huge population. Numerous research has been conducted to increase the yield of the crop. But a good number of crop harvests were destroyed due to various factors and leaf stress is one of them. The various types of stresses include biotic and abiotic that impact the mangoes productivity. But here the focus is on biotic stress factors such as fungus and bacteria. The effect of the stress can be reduced in the preliminary stage by taking some affirmative steps such as earlier detection and resolutions for the same. So many advanced techniques and methods have been used extensively to identify and classify certain stresses. This research supports farmers in identifying early-stage stresses in the plant leaf, that enhances the mango quality and quantity. This approach’s main objective is to ensure that farmers are accurately informed and driven by accurate results of the diagnosis based on affirmative knowledge. The complete approach is laid down in two folds. Firstly, the region of interest is segmented from input images. The region of interest is used to extract symmetrical features of images and these features are used to create symmetry in the classification and identification. Secondly, the segmented image is processed through Convolutional Neural Network (CNN). CNN model is a multilayer model that automatically extracts features from the inputted image. The proposed technique is compared with various models such as VGG16, VGG19, and RestNet, etc. The proposed technique in this paper outperforms other models. The whole experiment was performed using Google Co-Lab using dataset from a known standard or open-source repository. The data collection is composed of different diseases characteristics compared to a healthy leaf. The different stress approach was chosen for different types of mango leaves like powdery mildew, anthracnose, dieback, phoma blight, bacterial canker, and red rust. The result outcomes proved that the proposed approach was 98.12% accurate to identify stress and can be beneficial in actual application by farmers.
Keywords: Convolutional neural network (CNN); artificial intelligence (AI); biotic disease; segmentation; image processing
The Plants are essential for the ecosystem and they encounter various barriers due to different types of stresses. They can be the reason for the huge loss of plant production. The preliminary and precise identification of stresses during growth stages would helps to reduce the possibility of ecological harm.
The Mango trees are important for maintaining biodiversity and are a major source of fruits. The king fruit “Mango” is gaining a lot of traction in the agricultural industry. As a result, there is an increasing global understanding of mango plant cultivation as a means of promoting fruit production through sustainable agricultural practices. Stress is an important factor that affects crop production. The symptoms of stress can be found on the leaves, stems, and fruits in general. The signs of stress on the leaf are easy to monitor since they are noticeable on the leaf. Different types of stresses can impact plant leaf such as biotic, abiotic, and combinatorial as discussed in [1,2]. This paper addresses the issue of biotic stress due to bacteria, fungus, etc., and deals with one stress at a time on a plant leaf. The leaf images with stresses have asymmetric features and classification is the way to create symmetry in the stress classes [3]. The Mango trees are susceptible to a variety of stresses, including mango malformation stress, anthracnose, etc.
That’s why farmers use unnecessary pesticides to treat plant stresses in absence of knowledge which affect the yield of plant. As a result, careful treatment is essential for the initial recognition of leaf stresses. However, the manual detection of insects and stress is ineffective and expensive. If the field is broad, the manual identification process takes a long time. Therefore, plant leaf images are one of the best and reliable ways to detect stress in computer vision applications. The images are processed using competent image identification technology which contains filtering, scaling, and other operation. These operation generates a symmetric image with efficiencies in image identification, reduce the expenses, and enhance the identification accuracy [4,5]. As a result, sample images can be taken and fed into the algorithm, which will detect plant stresses. The term “plant stresses” refers to patterns of disease on a plant leaf. For good yields, the earlier detection of stress is required.
Mango leaf stress is difficult to diagnose by manual observation that’s why technology is needed for accurate stress detection at the appropriate stage. Formerly, experts had analyzed and judged plant stresses manually, relying solely on visualization. However, this is extremely difficult in a wide area. This requires a significant amount of time and effort. Several techniques and algorithms are employed to identify leaf stresses but the deep learning techniques are best. A deep neural network has been used to resolve various issues in different fields as given in [6–12].
In this article, a deep neural network is used to tackle mango plant stress issues. Here, the convolutional neural network (CNN) with segmentation is applied to identify leaf stresses using leaf images. CNN inevitably extracts features from an input image. Other classical models never extract features automatically. But, leaf images are taken in different conditions that’s why there is an asymmetry in the leaf image. The image symmetry is achieved by using segmentation and extracting features from the same segmented images.
The major contributions of the paper or objectives:
a) To use the region of interest or stress part of the leaf image to process.
b) The challenges such as (1) changes in the radiance and spectral coefficient of reflection (2) Poor quality of images (3) Image sizes and forms are tackled. These are the reasons for asymmetry in the images [13].
c) The model is evaluated on other parameters that was not used in other work
The complete paper is described in various folds. Section 2 deals with the state of the art. Section 3, describes the material and method. The result analysis and discussion are given in Section 4. Section 5 is the concluding and future work.
The agriculture sector is completely dependent upon the productivity of plants or crops. The good amount of crop yield is important for economy of a country’s. The stress in the plants or trees is a worldwide issue and affects 25% productivity of plants every year. Several factors affect the productivity of plants such as plant stresses and the other environment factors.
Therefore, plant leaf stress detection at an early stage is the most prominent area of research in the past few years. Therefore, an effective stress detection system is required to identify stress. Therefore, huge amount of research has been carried out in agriculture and horticulture.
The support vector machine (SVM) is used in [14] to detect the leaf stress of the mango plant. The system can assist in stress detection without the intervention of experts, saving time by identifying stress using a computer rather than a manual system. The accuracy achieved using this updated model is 80%. Mango plant leaf stresses can be detected scientifically by combining pattern recognition, image detection, and mango fruit extraction methodologies [15,16]. A wavelet transformation segmentation approach with wavelet neural network approach for classification of mango leaf stress. In this work, they have used data of around 1150 images for the segmentation and classification of leaves [17]. The accuracy achieved using the wavelet model is 98.93% that shows its usage [18]. Presented a method for determining the magnitude of mango stress based on leaf photographs and used segmentation, Sobel, and Laplacian filters. Leaf stresses are a major problem in crop production and a threat to worldwide food productivity and quality. It is a tedious task to recognize the leaf stresses with naked eyes. There have been many proposals for using deep learning techniques to detect leaf stresses. Convolutional neural networks were used by the majority of them to create models based on low-resolution images [19]. The author compared the results of the Artificial Neural Network (ANN) model with pre-defined CNN models.
The ANN model results are much better than CNN (AlexNet, VGG16, ResNet model). ANN-based techniques are used in [20,21] to select features and identify stresses in mango leaves; they only consider the stable leaves with Anthracnose stress leaf. CNN has shown superior success (to that of humans) in identifying and classifying problems [22]. The author proposed a Le-Net architecture for the detection of soybean leaf stress with 91.25% accuracy [23]. On a limited dataset, for the detection of plant stresses, the Generative adversarial network (GAN) algorithm is used. Then for the recognition of this dataset, the baseline convolution neural network works with the resulting synthetic sample [24]. Proposed the classification accuracy of 98.75% from the AlexNet model and 96.25% from GoogleNet. The result shows that the performance of deep learning models is better than machine learning. A tea leaf disease detection method using the Non-dominated Sorting Genetic Algorithm (NSGA-II) is proposed in [25]. The proposed method also used Principal Component Analysis (PCA) and SVM-Multi class features algorithm to extract and classify various leaf stresses [26].
The description of stress detection techniques and their accuracy is given in Tab. 1.

Various methods and techniques have been developed by the researcher to tackle the same issue but no one provided exact and correct information to farmers. This paper was also focused to provide a solution for the same issue with some other parameters which are not considered in the previous approach. In the literature, the authors concentrated on a few mango leaf stresses and they have considered the complete leaf area to process it. This may be the reason for an increase in the error rate. But here in this paper, the proposed approach considers the infected area only.
The section covers the dataset description and proposed algorithm.
A dataset consists of mango leaf pictures. The model is trained with 80% of data from the dataset and 20% of data is kept for testing/validation and reference images are shown in Fig. 1. The dataset comprises distinct classes of stress and is taken from a popular standardized repository with multiple classes. The dataset has different classes belonging to different stresses and one for the healthy leaf.
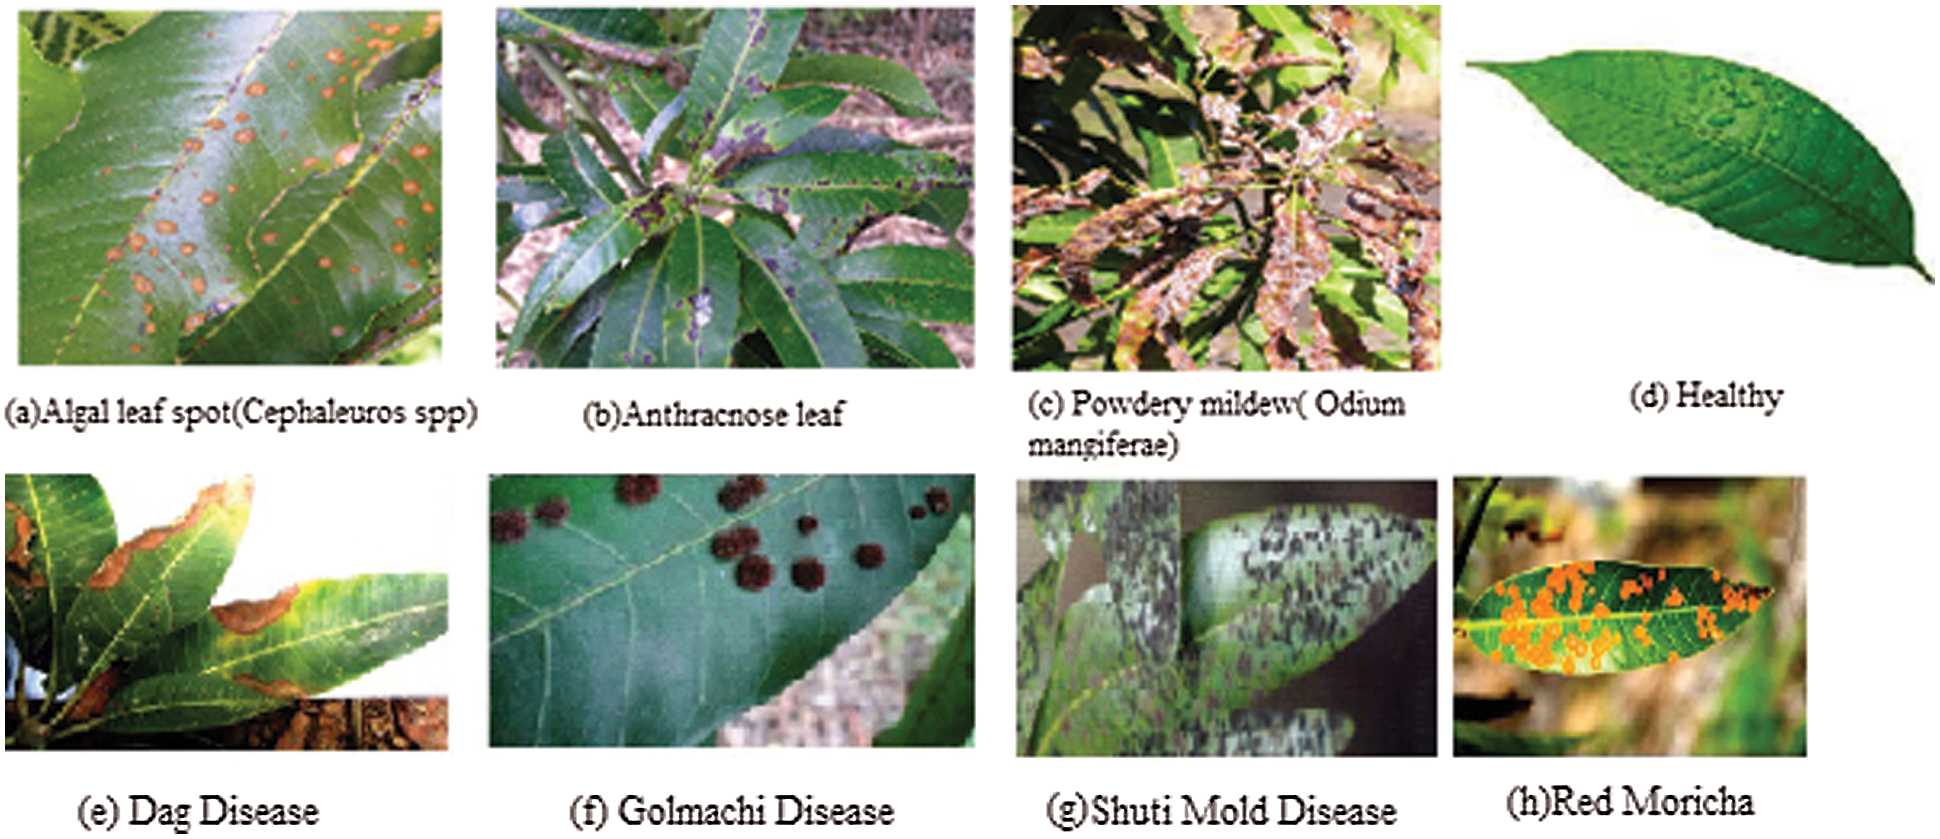
Figure 1: Sample mango stresses and healthy leaf
3.2 Mango Leaf Stress Detection
The stress detection methodology starts with the first phase of data pre-proceeding and labeling. Secondly, pre-processed data is classified using a Convolutional Neural network. The complete process of stress diagnoses is laid down in Fig. 2.
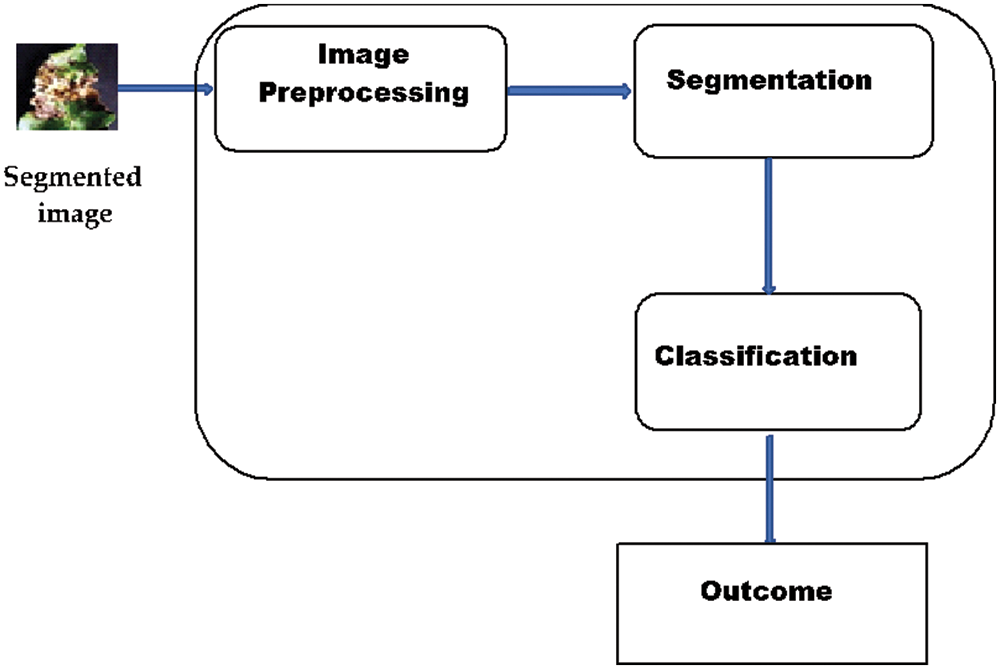
Figure 2: Classifier model
i. Image Pre-processing and Labelling
This is an initial phase, where the raw image dataset was pre-processed to remove noise before inputting it to the CNN classifier. It must be for a model to analyze the structure of the network and dataset to generate better outcomes. Therefore, the dataset is preprocessed initially to collect appropriate features of images which can be used by the model to accurately diagnose or predict the actual outcomes. Here in pre-processing, firstly, the size of each image is normalized as per requirement which is 256*256 pixels. The python libraries are utilized to perform the same task with maximum accuracy. Secondly, all images are converted into grey images.
The pre-processing stage is considered a phase that extracts image features to train the model. These training features are the reason for accurate prediction. After pre-processing, the data is labeled and segregated into different classes.
ii. Classification with Mathematical Model
Here, the CNN is used for classification, one of the most prominent technologies used at present. Here, the model is trained with the feature extracted in the previous phase. In the CNN, the image dataset is processed in different layers and each layer has the following sub-layers. The complete CNN structure is laid down in Fig. 3.
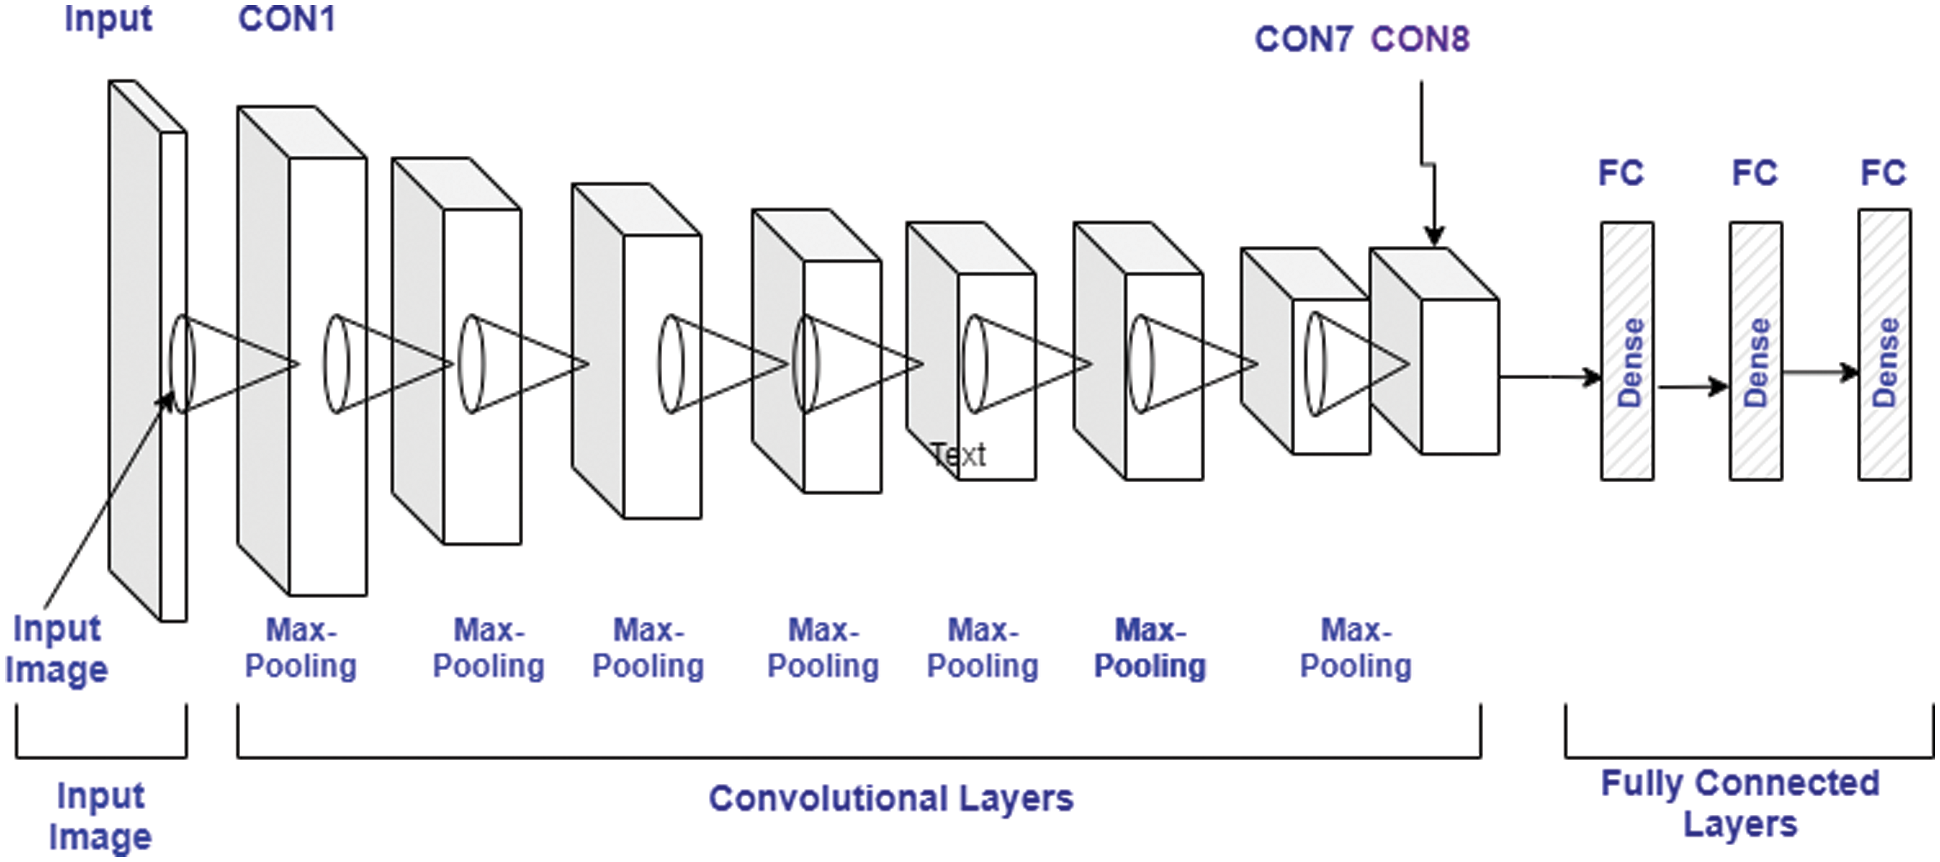
Figure 3: CNN model architecture
a) Input Layer
This represents a set image which passes as input to the CNN. The input image is represented by [height*width*nos of Color channel]. The color images represent the type of image that has 3 channels representing an RGB. The same input is passed through a segmentation and data argumentation before finally inputted to the CNN. The argumentation is performed through different operations such as rotation, cropping, etc. These operations are used to increase the dataset because CNN needs a large amount of data to give an appropriate outcome.
The hyperparameter used to configure Deep neural network are depicted in Tab. 2.

b) Convolutional Layer
The main operation in the convolutional layer is convolution in which the input image was mapped with a filter of m*m and generates outcome feature maps. The outcome of the convolutional layer was expressed by Eq. (1)
where,
An: Outcome feature maps,
Ln: Input maps,
Mkn: Kernel of convolution,
Cn: Bias term.
The degree of the final feature map is expressed by,
where,
N: output height/length
X: input height/length
M: filter size,
Y: padding,
T: Stride.
Here, padding can be used to store the output. The padding is expressed by Eq. (3):
where, M: filter size.
• ReLU Layer: This also plays an important in CNN and is also known as the Activation layer. This layer is next to the convolution layer and the output of the same will be input to the ReLU. This layer creates linearity in the convolutional process. So, each convolutional layer found associated with a ReLU layer. The important task of this layer is to update all negative activation to zero and thresholding which is given by f(p) = max (0, p). This layer helps the system to learn quickly and remove gradient problems. ReLU activation function is well designed for multiclass classification.
• Max-Pooling Layer: This layer generates the reduce sized output after maximizing the elements of each block. This layer also controls the overfitting problem without the learning process.
• Dropout Layer: This layer is used to drop out the input elements having a probability less than a certain value and this process is a part of the training phase.
• Batch Normalization Layer: This layer plays an important role in between the convolutional and ReLU layer. This layer is used to enhance the training speed and reduce sensitivity. This layer performs different operations (subtractor, division, shifting, and scaling). On the activation layer to normalize its value. Firstly, the activation is subtracted with mean, and divided by the standard deviation which is followed by fluctuating by α and then scaled by Ɵ. The batch normalized outcome, Bk is expressed by the Eqs. (4)–(7),
where
where,
ε: constant
UD: Mini-batch mean
σD2: Mini-batch variance given by,
c) Fully Connected Layer
Here, the neurons of the next layer are connected with neurons of the previous layer and produced a vector and the vector dimensions represent the number of classes.
d) Output Layer
This layer is a combination of softmax and classification. In this layer, firstly, the softmax is used to distribute the probability and the classification is carried out by the network. The softmax is defined by Eq. (8)
where,
0 ≤ P(vr|A
written as follows, where
3.3 Stress Detection Algorithm
The identification process was initiated with color images (IRGB). After the input, the segmented image (SRGB) is extracted from the original image (IRGB). The segmented image was further processed with CNN to generate a mask image (Mmask). The mask image (Mmask) was further divided into different regions Ktiles. Afterward, Ktiles was used to select the Region of Interest (RoI) and the same was used to identify stress. The proposed algorithm has been given below:
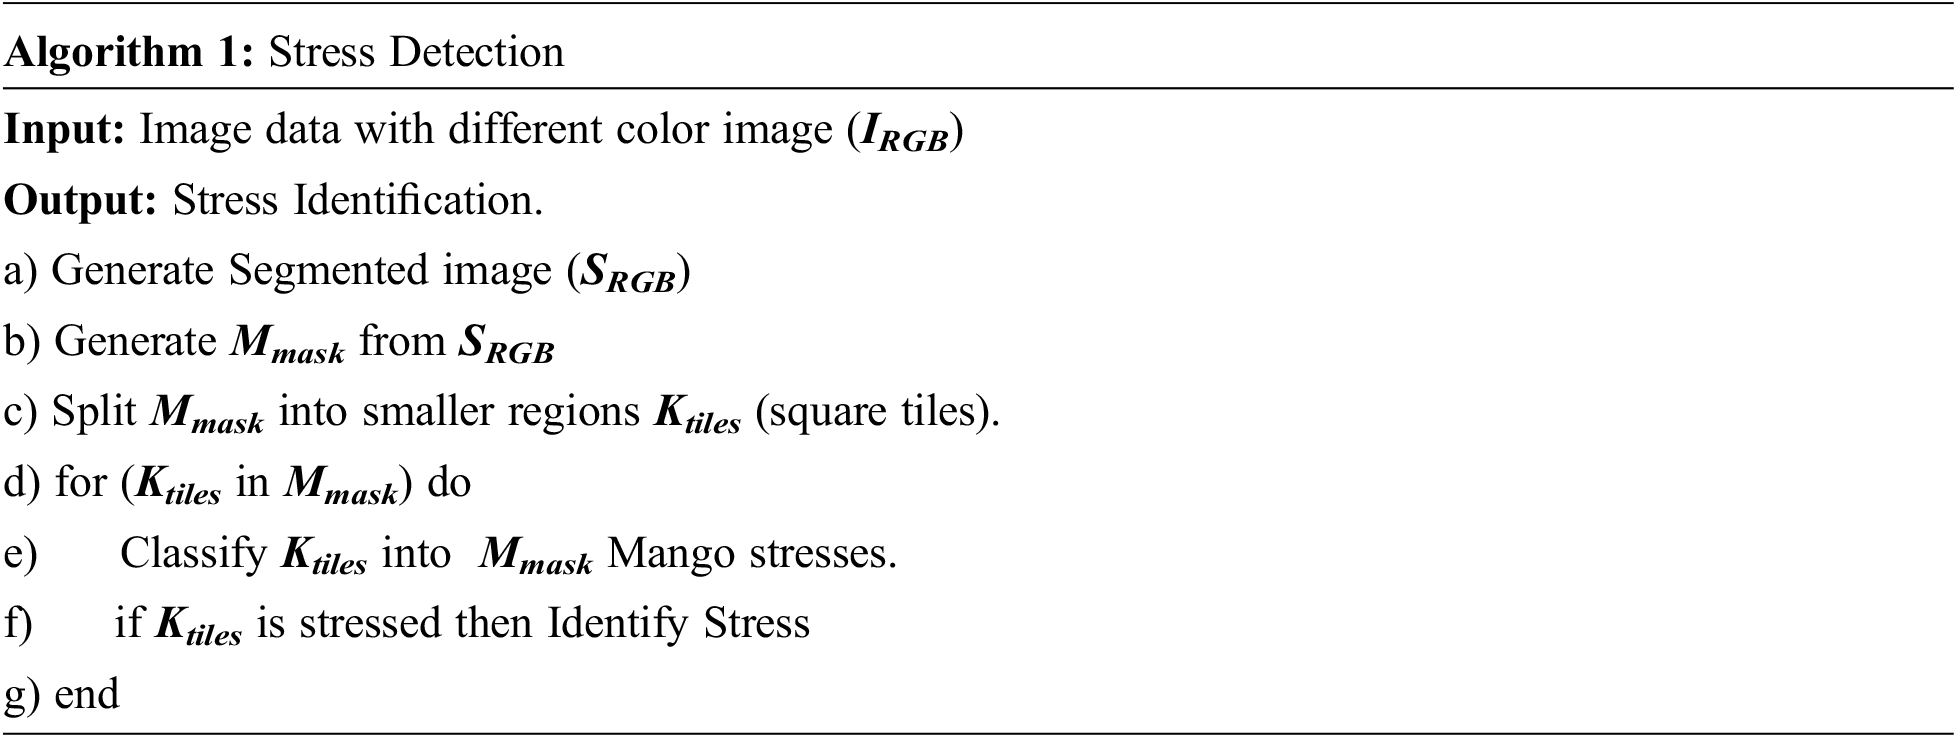
The next section provides a detail explanation of the experimental results, their interpretation, as well as the experimental conclusions that can be drawn.
4 Result Assessment and Discussion
The research has been carried out with the help of Google Co-Lab-based GPU and python-based Keras libraries. The experiment was performed with varying the batch size, epoch, and learning rate. The experiment was performed with two epoch sizes i.e., 50 and 100, and three learning rates i.e., 0.1, .001, and .0001 learning rates. The results are discussed below in the sub-section:
The experiment was performed with a sample image partitioned into training and testing ratio. The performance of the model was measured on different performance indicators as given:
Note that Tp, Tf, Fp, and Fn represent true positive, true negative, false positive, and false negative, respectively.
The objective here was to observe the effect of Epochs on device efficiency. An epoch was a complete introduction to a learning machine of the data set. In this research, the experiment is conducted with 50 and 100 epochs size. Fig. 4 shows the test with 50 epochs and Fig. 5 shows 100 epoch sizes with a learning rate of 0.0001. Both show an accuracy rate that was 98.02% and 98%.
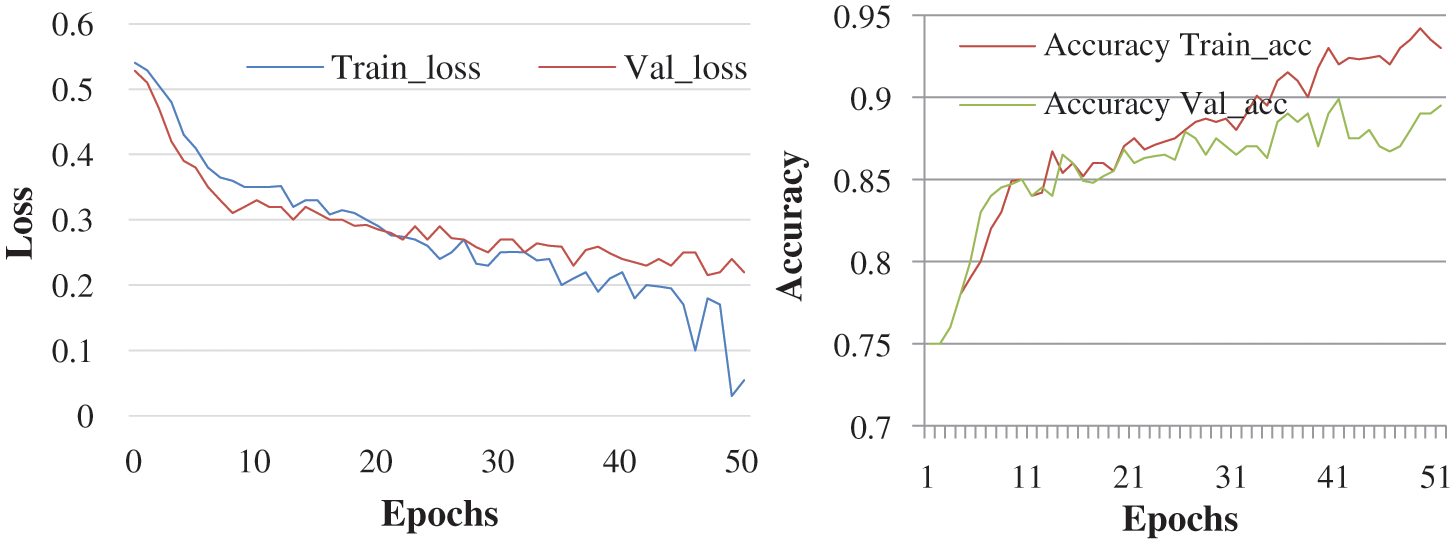
Figure 4: Accuracy and loss learning rate 0.0001
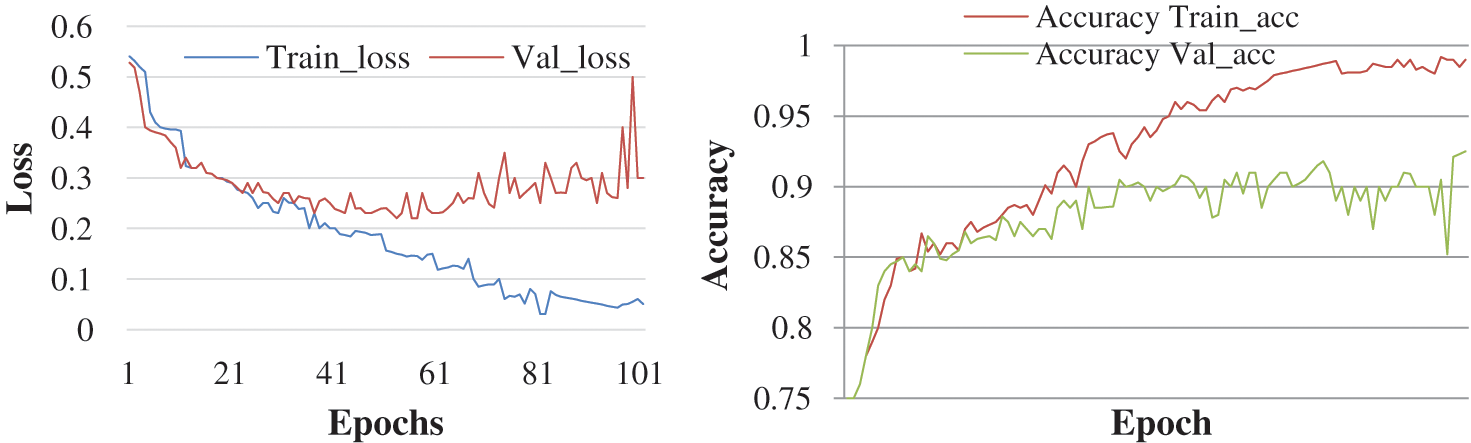
Figure 5: Accuracy and loss with learning rate 0.0001
It is possible to assume that more times will provide a higher percentage of data accuracy based on the research procedure. But the number of epochs is getting longer, the longer the training step involves.
Here, the experiment was conducted with 50 and 100 epochs size. Fig. 6 shows the test with 50 epochs and Fig. 7 shows 100 epoch sizes with a learning rate of 0.001. Both show an accuracy rate that is 98.07% and 98.25%.
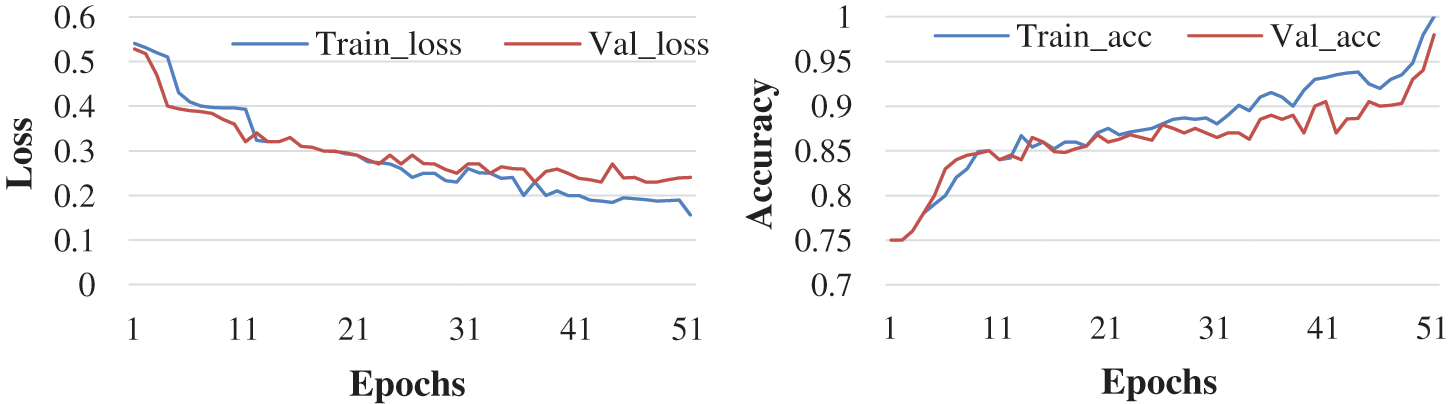
Figure 6: Accuracy and loss learning rate 0.001
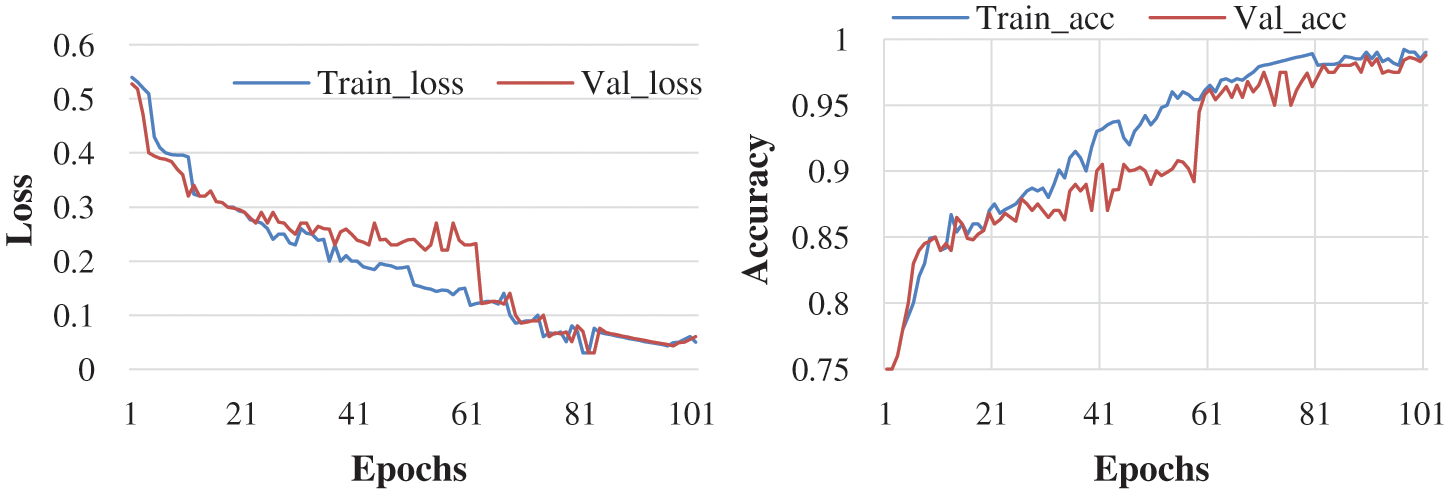
Figure 7: Accuracy and loss learning rate 0.001
Here, the experiment was conducted with 50 and 100 epochs size. Fig. 8 shows the test with 50 epochs and Fig. 9 shows 100 epoch sizes with a learning rate of 0.01. Both show an accuracy rate that is 98.12% and 98.12%.
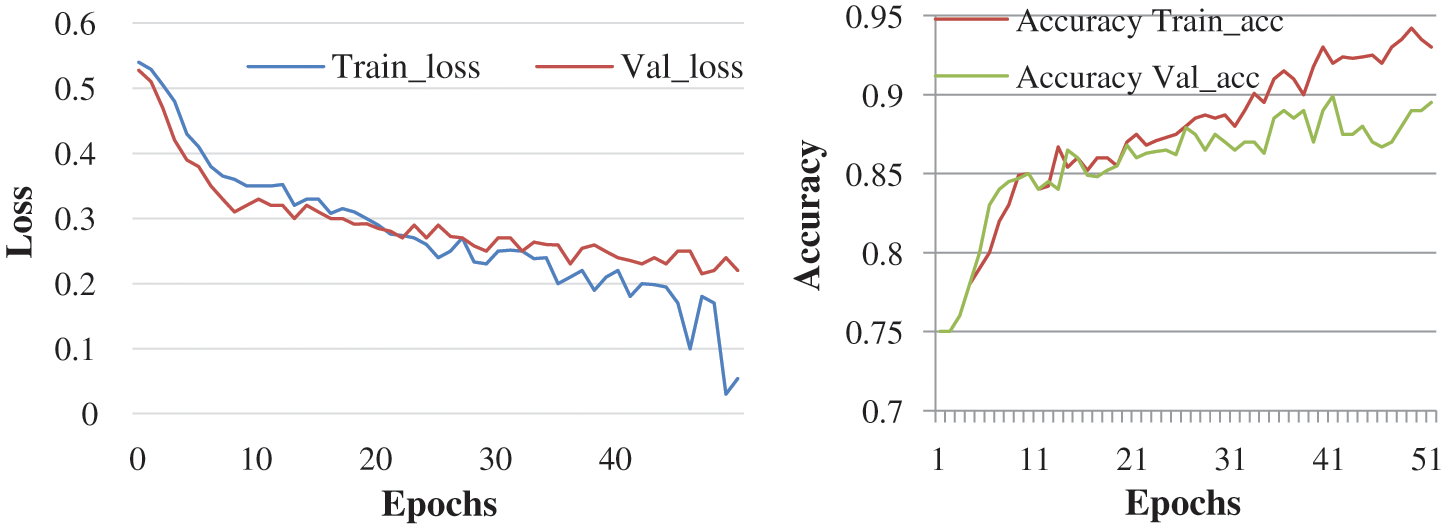
Figure 8: Accuracy and loss learning rate 0.01
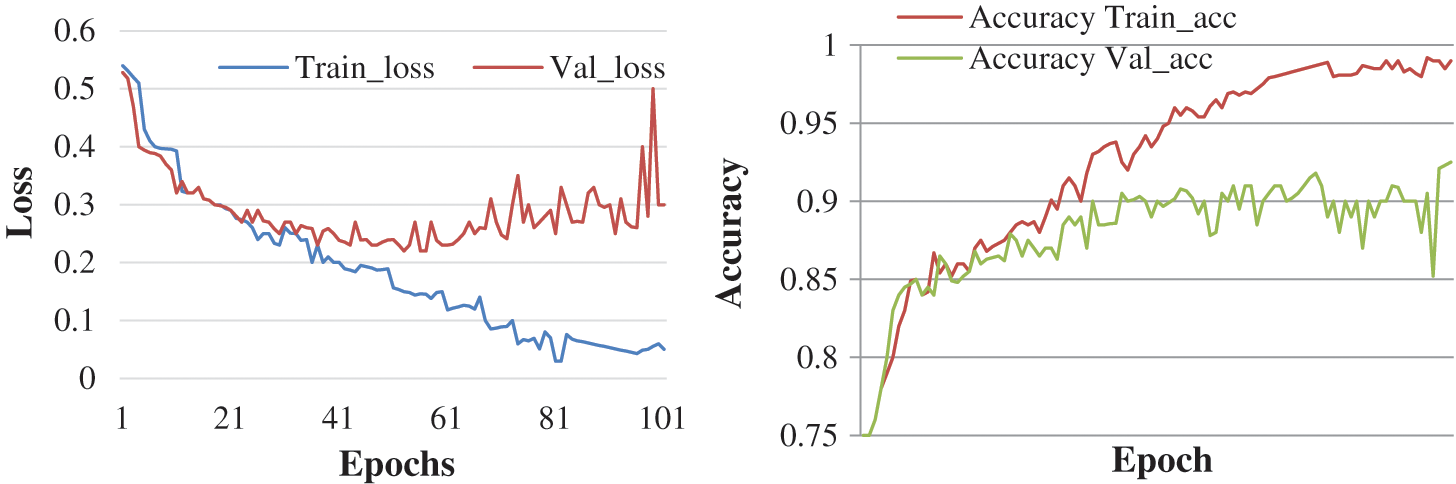
Figure 9: Accuracy and loss learning rate 0.01
The result analysis based on the experiment is laid down in Tab. 3 and the confusion matrix is depicted in Fig. 10:

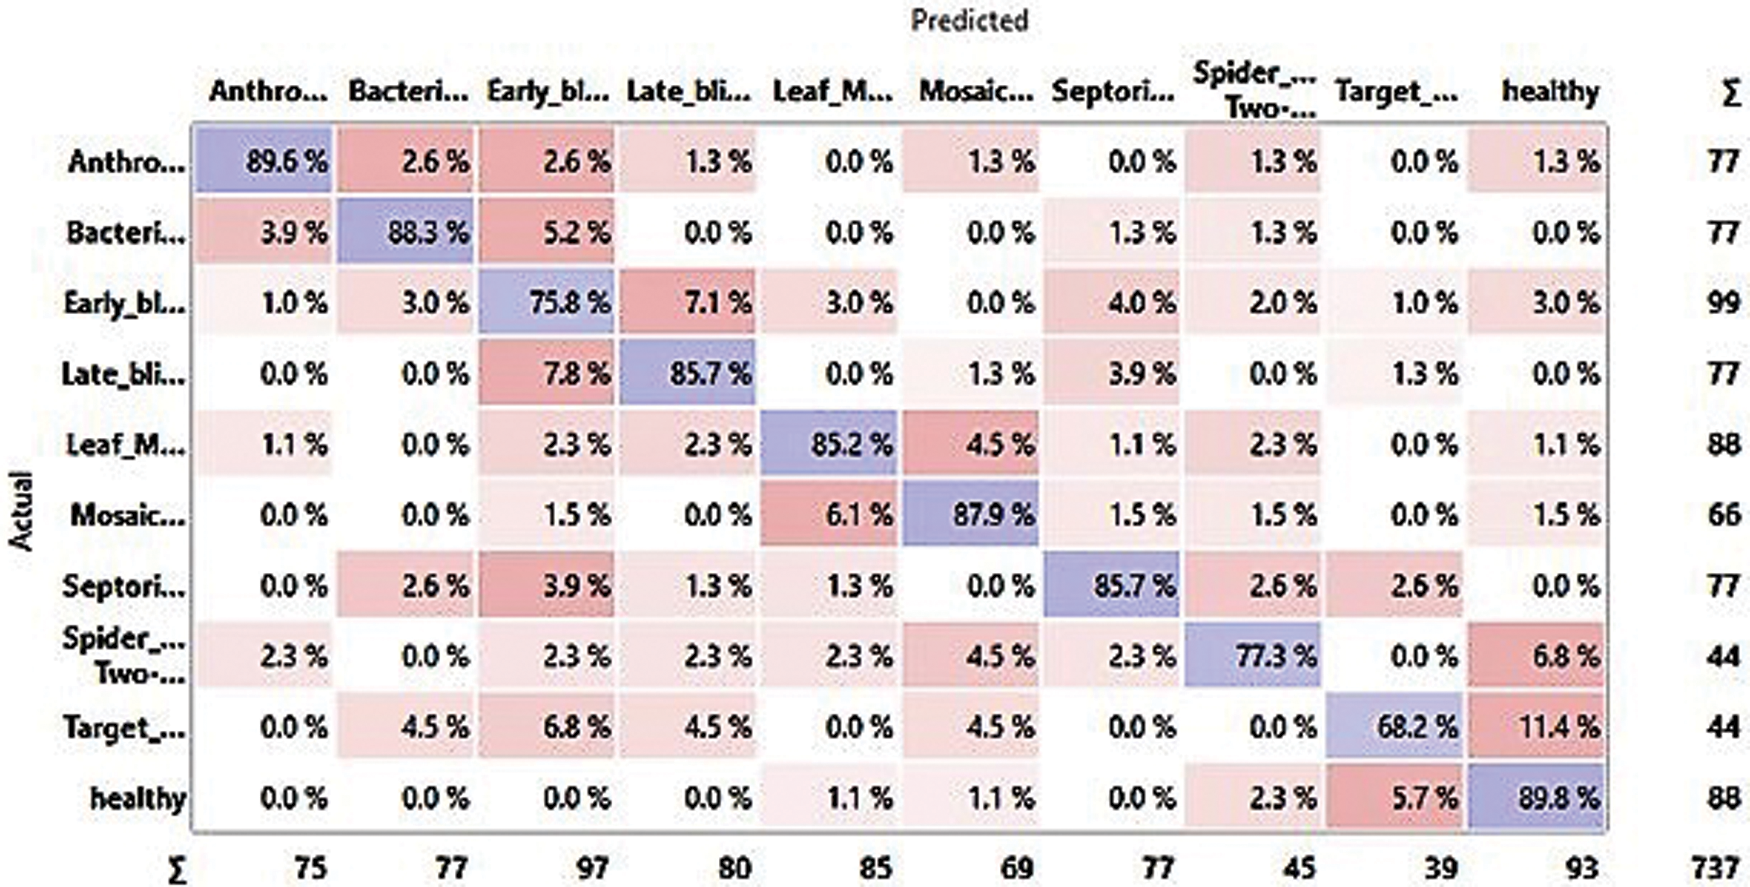
Figure 10: Confusion matrix
The precision, recall, and F1-Score of the model is described in Figs. 11a–11c.
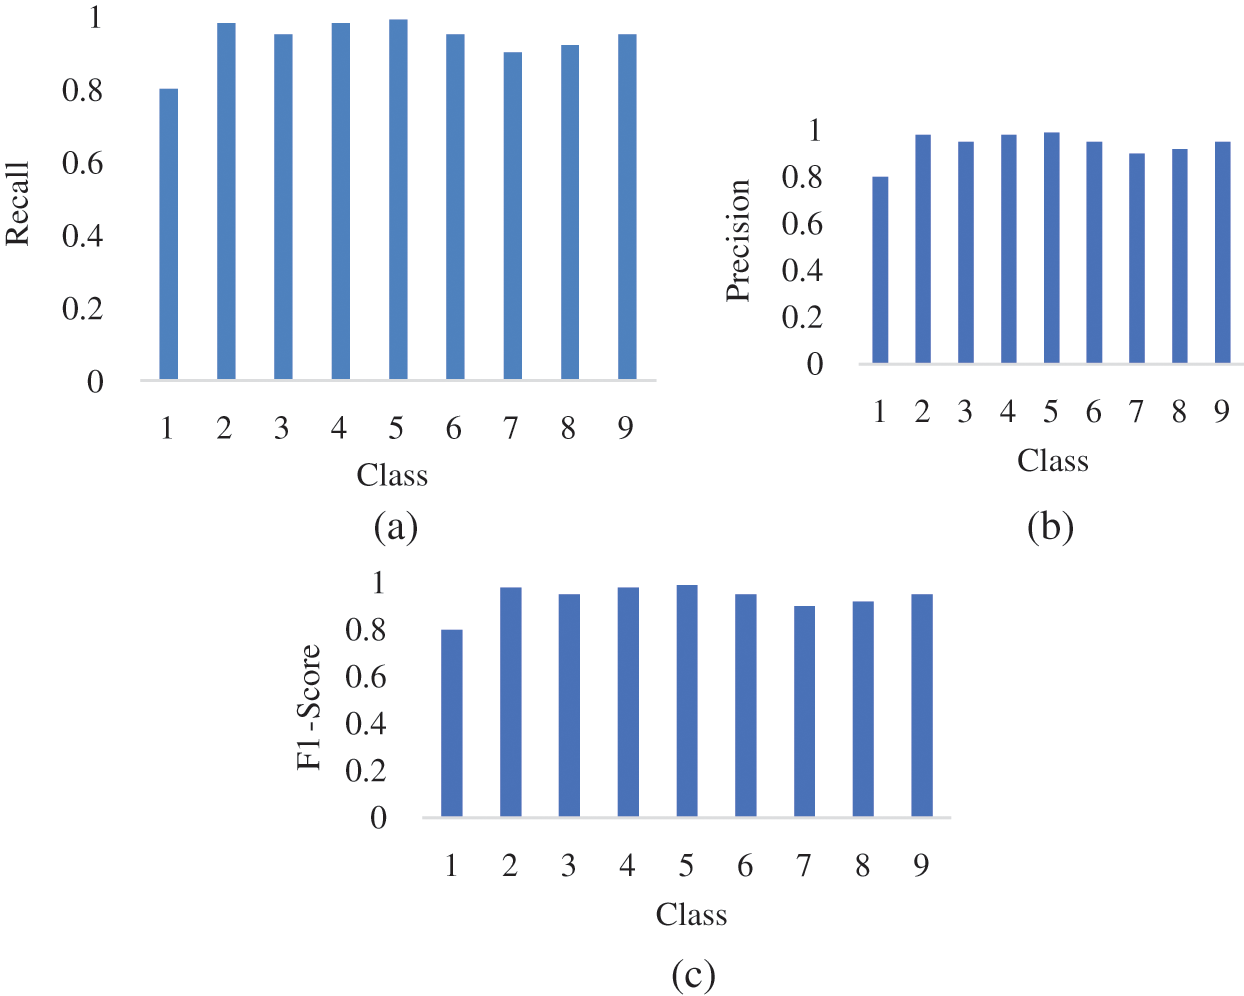
Figure 11: (a) Recall (b) Precision (c) F1-score
Based on the assessment procedure performed, a more accurate percentage of the data with a higher learning rate can be evaluated. The result analysis based on the experiment is laid down in Tab. 4:

The article proposes a high-performance deep neural network for identifying and categorizing plant leaf stress. The classification considers morphological attributes such as color, intensity, and leaf dimension of the plant. This article proposes an approach that takes two major steps to identify and classify mango leaf disease. Firstly, the leaf image is segmented, and the targeted area or disease part of an image is extracted. Further, they are processed to extract features to create symmetry in classification [57,58]. Secondly, the segmented image is inputted into the Deep Neural Network model. This article discusses different biotic stresses caused by fungal and bacterial pathogens, specifically Blight, Blast, and Browns, etc. of mango leaves. The result shows that the proposed model outperforms other models such as Mobinet, VGG and ResNet versions and the detection accuracy of the proposed model is 98.12 percent. The plant leaf is impacted by combinatorial stress or multiple stresses of biotic and abiotic stress as discussed in [59,60]. In the future will expand the model to address the issues related to the combination of biotic and abiotic stress variables.
Acknowledgement: Thanks to the anonymous reviewers for their constructive suggestions to help improving this paper.
Funding Statement: The authors received no specific funding for this research.
Conflicts of Interest: The authors declare that they have no conflicts of interest to report regarding the present research.
1. P. Kaur and V. Gautam, “Plant biotic disease identification and classification based on leaf image: A review,” in Proc. of 3rd Int. Conf. on Computing Informatics and Networks: ICCIN 2020, Singapore, Springer, 2021. [Google Scholar]
2. P. Kaur and V. Gautam, “Research patterns and trends in classification of biotic and abiotic stress in plant leaf, Materials Today: Proceedings, vol. 45, pp. 4377–4382, 2021. [Google Scholar]
3. M. V. Kozlov and L. Z. Elena, “Confirmation bias in studies of fluctuating asymmetry,” Ecological Indicators, vol. 57, pp. 293–297, 2015. [Google Scholar]
4. G. Suryanarayana, K. Chandran, O. I. Khalaf, Y. Alotaibi, A. Alsufyani et al., “Accurate magnetic resonance image super-resolution using deep networks and Gaussian filtering in the stationary wavelet domain,” IEEE Access, vol. 9, no. 2021, pp. 71406–71417, 2021. [Google Scholar]
5. K. Kanwal, K. T. Ahmad, R. Khan, A. T. Abbasi and J. Li, “Deep learning using symmetry, fast scores, shape-based filtering and spatial mapping integrated with CNN for large scale image retrieval,” Symmetry, vol. 12, no. 4, pp. 612, 2020. [Google Scholar]
6. K. O. Ibrahim, “Preface: Smart solutions in mathematical engineering and sciences theory,” Journal of Mathematics in Engineering Science and Aerospace (MESA), vol. 12, no. 1, pp. 1–4, 2021. [Google Scholar]
7. N. K. Trivedi, V. Gautam, A. Anand, H. M. Aljahdali, S. G. Villar et al., “Early detection and classification of tomato leaf disease using high-performance deep neural network,” Sensors, vol. 2021, no. 23, pp. 7987, 2021. [Google Scholar]
8. S. Dalal and O. I. Khalaf, “Prediction of occupation stress by implementing convolutional neural network techniques,” Journal of Cases on Information Technology (JCIT), vol. 23, no. 3, pp. 27–42, 2021. [Google Scholar]
9. S. Sengan, P. V. Sagar, R. Ramesh, O. I. Khalaf and R. Dhanapal, “The optimization of reconfigured real-time datasets for improving classification performance of machine learning algorithms,” Mathematics in Engineering, Science & Aerospace (MESA), vol. 12, no. 1, pp. 43–54, 2021. [Google Scholar]
10. T. R. Gadekallu, M. Alazab, R. Kaluri, P. K. R. Maddikunta, S. Bhattacharya et al., “Hand gesture classification using a novel CNN-crow search algorithm,” Complex and Intelligent Systems, vol. 7, pp. 1855–1868, 2021. [Google Scholar]
11. C. Dhanamjayulu, U. N. Nizhal, P. K. R. Maddikunta, T. R. Gadekallu, C. Iwendi et al., “Identification of malnutrition and prediction of BMI from facial images using real-time image processing and machine learning,” IET Image Processing, USA, 2021. [Google Scholar]
12. P. N. Srinivasu, A. K. Bhoi, R. H. Jhaveri, G. T. Reddy and M. Bilal, “Probabilistic deep Q network for real-time path planning in censorious robotic procedures using force sensors,” Journal of Real-Time Image Processing, vol. 18, no. 5, pp. 1773–1785, 2021. [Google Scholar]
13. S. M. M. Hossain, K. Deb, P. K. Dhar and T. Koshiba, “Plant leaf disease recognition using depth-wise separable convolution-based models,” Symmetry, vol. 13, no. 3, pp. 511, 2021. [Google Scholar]
14. M. R. Mia, S. Roy, S. K. Das and M. A. Rahman, “Mango leaf stress recognition using neural network and support vector machine,” Iran Journal of Computer Science, vol. 3, no. 3, pp. 185–193, 2020. [Google Scholar]
15. K. Maheshwari and A. Shrivastava, “A review on mango leaf diseases identification using convolution neural network,” International Journal of Scientific Research and Engineering Trends, vol. 6, no. 3, pp. 1399–1403, 2020. [Google Scholar]
16. P. R. K. Rao and K. Swathi, “Mango plant disease detection using modified multi support vector machine algorithm,” PalArch’s Journal of Archaeology of Egypt/Egyptology, vol. 17, no. 7, pp. 10567–10577, 2020. [Google Scholar]
17. S. Mishra, V. Ellappan, S. Satapathy, G. Dengia, B. T. Mulatu et al., “Identification and classification of mango leaf disease using wavelet transform based segmentation and wavelet neural network model,” Annals of the Romanian Society for Cell Biology, vol. 2021, pp. 1982–1989, 2021. [Google Scholar]
18. N. Ravindra and M. Sadavarte, “Application of image processing technique in mango leaves disease severity measurement,” International Journal of Advance Engineering and Research Development (IJAERD), vol. 2, pp. 1–7, 2015. [Google Scholar]
19. T. N. Pham, L. V. Tran, S. Vu and T. Dao, “Early disease classification of mango leaves using feed-forward neural network and hybrid metaheuristic feature selection,” IEEE Access, vol. 8, no. 2020, pp. 189960–189973, 2020. [Google Scholar]
20. U. P. Singh, S. S. Chouhan, S. Jain and S. Jain, “Multilayer convolution neural network for the classification of mango leaves infected by anthracnose disease,” IEEE Access, vol. 7, no. 2019, pp. 43721–43729, 2019. [Google Scholar]
21. S. S. Chouhan, U. P. Singh, A. Kaul and S. Jain, “A data repository of leaf images: Practice towards plant conservation with plant pathology,” in Proc. Int. Conf. on Information Systems and Computer Networks (ISCON), India, pp. 700–707, 2019. [Google Scholar]
22. K. Maheshwari, P. K. Choure and V. Birchha, “Performance analysis of mango leaf stress using machine learning technique,” International Journal for Research in Applied Science and Engineering Technology (IJRASET), vol. 9, no. 1, pp. 856–862, 2021. [Google Scholar]
23. H. Nazkia, S. Yoonb, A. Fuentesa and D. S. Park, “Unsupervised image translation using adversarial networks for improved plant disease recognition,” Computers and Electronics in Agriculture, vol. 168, pp. 105117, 2020. [Google Scholar]
24. S. B. Jadhav, V. R. Udupi and S. B. Patil, “Identification of plant stresses using convolutional neural networks,” International Journal Information Technology, vol. 13, pp. 2461–2470, 2020. [Google Scholar]
25. S. Mukhopadhyay, M. Paul, R. Pal and D. De, “Tea leaf disease detection using multi-objective image segmentation,” Multimedia Tools and Applications, vol. 80, no. 1, pp. 753–771, 2021. [Google Scholar]
26. S. Arivazhagan and S. V. Ligi, “Mango leaf stresses identification using convolutional neural network,” International Journal of Pure Applied Mathematics, vol. 120, no. 6, pp. 11067–11079, 2018. [Google Scholar]
27. S. Kaur, S. Pandey and S. Goel, “Plants disease identification and classification through leaf images: A survey,” Archives of Computational Methods in Engineering, vol. 26, no. 2, pp. 507–530, 2019. [Google Scholar]
28. M. Krishnan and M. G. Sumithra, “A novel algorithm for detecting bacterial leaf scorch (BLS) of shade trees using image processing,” in Proc. of 11th Malaysia Int. Conf. on Communications (MICC), Kuala Lumpur, Malaysia, 2013. [Google Scholar]
29. B. J. Samajpati and S. D. Degadwala, “Hybrid approach for apple fruit diseases detection and classification using random forest classifier,” in Proc. of Int. Conf. on Communication and Signal Processing (ICCSP), India, pp. 1015–1019, 2016. [Google Scholar]
30. S. B. Ullagaddi and S. V. Raju, “Disease recognition in mango crop using modified rotational kernel transform features,” in Proc. of Int. Conf. on Advanced Computing and Communication Systems (ICACCS), India, 2017. [Google Scholar]
31. T. Rumpf, A. K. Mahlein, U. Steiner, E. C. Oerke, H. W. Dehne et al., “Early detection and classification of plant diseases with support vector machines based on hyperspectral reflectance,” Computers and Electronics in Agriculture, vol. 74, no. 1, pp. 91–99, 2010. [Google Scholar]
32. B. Tlhobogang and M. Wannous, “Design of plant disease detection system: A transfer learning approach work in progress,” in Proc. of IEEE Int. Conf. on Applied System Invention (ICASI), Japan, pp. 158–161, 2018. [Google Scholar]
33. D. A. Bashish, B. Malik and B. S. Ahmad, “Detection and classification of leaf diseases using K-means-based segmentation,” Information Technology Journal, vol. 10, no. 2, pp. 267–275, 2011. [Google Scholar]
34. D. Shergill, A. Rana and H. Singh, “Extraction of rice stress using image processing,” International Journal Engineering Science and Research Technology (IJESRT), vol. 4, no. 6, pp. 135–143, 2015. [Google Scholar]
35. R. R. Kajale, “Detection & reorganization of plant leaf stresses using image processing and android OS,” International Journal of Engineering Research and General Science, vol. 3, no. 2, pp. 6–9, 2015. [Google Scholar]
36. S. Arivazhagan, R. N. Shebiah, S. Ananthi and S. V. Varthini, “Detection of unhealthy region of plant leaves and classification of plant leaf diseases using texture features,” Agricultural Engineering International: CIGR Journal, vol. 15, no. 1, pp. 211–217, 2013. [Google Scholar]
37. M. Bhange and H. A. Hingoliwala, “Smart farming: Pomegranate disease detection using image processing,” Procedia Computer Science, vol. 58, pp. 280–288, 2015. [Google Scholar]
38. S. Sundari, “Leaf stress classification using artificial neural networks and decision tree classifier,” Journal of Image Processing and Pattern Recognition, vol. 5, no. 1, pp. 26–32, 2018. [Google Scholar]
39. M. Ranjan, M. R. Weginwar, N. Joshi and A. B. Ingole, “Detection and classification of leaf disease using artificial neural network,” International Journal of Technical Research and Applications, vol. 3, no. 3, pp. 331–333, 2015. [Google Scholar]
40. P. P. Warne and S. R. Ganorkar, “Detection of diseases on cotton leaves using K-mean clustering method,” International Research Journal of Engineering and Technology (IRJET), vol. 2, no. 4, pp. 425–443, 2015. [Google Scholar]
41. R. Sharma and V. P. Singh, “A research on automatic detection of defects in mango fruit through image processing and machine learning techniques,” Journal of Advances in Scholarly Research and Allied Education, vol. 12, pp. 1258–1268, 2017. [Google Scholar]
42. G. Geetha1, S. Samundeswari, G. Saranya1, K. Meenakshi and M. Nithya, “Plant leaf disease classification and detection system using machine learning,” in Proc. Int. Conf. on Computational Physics in Emerging Technologies (ICCPET), India, 2020. [Google Scholar]
43. N. Ganatra and A. Patel, “Applying multiclass classification for leaf disease detection using hybrid feature extraction approach,” International Journal of Advanced Science and Technology, vol. 29, no. 9, pp. 2628–2647, 2020. [Google Scholar]
44. R. M. Prakash, G. P. Saraswathy, G. Ramalakshmi, K. H. Mangaleswari and T. Kaviya, “Detection of leaf diseases and classification using digital image processing,” in Proc. of Int. Conf. on Innovations in Information, Embedded and Communication Systems (ICIIECS), India, pp. 1–4, 2017. [Google Scholar]
45. D. M. Sharath, Akhilesh, S. A. Kumar, M. G. Rohan and C. Prathap, “Image based plant disease detection in pomegranate plant for bacterial blight,” in Proc. of Int. Conf. on Communication and Signal Processing (ICCSP), India, pp. 645–649, 2019. [Google Scholar]
46. S. D. Khirade and A. B. Patil, “Plant disease detection using image processing,” in Proc. of Int. Conf. on Computing Communication Control and Automation, India, pp. 768–771, 2015. [Google Scholar]
47. C. G. Dhaware and K. H. Wanjale, “A modern approach for plant leaf disease classification which depends on leaf image processing,” in Proc. of Int. Conf. on Computer Communication and Informatics (ICCCI), India, pp. 1–4, 2017. [Google Scholar]
48. U. B. Korkut, Ö. B. Göktürk and O. Yildiz, “Detection of plant diseases by machine learning,” in Proc. of 26th Signal Processing and Communications Applications Conf. (SIU), Turkey, pp. 1–4, 2018. [Google Scholar]
49. J. Francis and B. K. Anoop, “Identification of leaf diseases in pepper plants using soft computing techniques,” in Proc. 2016 Conf. on Emerging Devices and Smart Systems (ICEDSS), India, vol. 2016, pp. 168–173, 2016. [Google Scholar]
50. J. Abdulridha, R. Ehsani and A. De Castro, “Detection and differentiation between laurel wilt disease, phytophthora disease and salinity damage using a hyperspectral sensing technique,” Agriculture, vol. 6, no. 4, pp. 56, 2016. [Google Scholar]
51. D. Moshoua, C. Bravoa, J. West, S. Wahlena, A. McCartney et al., “Automatic detection of “yellow rust” in wheat using reflectance measurements and neural networks,” Computer and Electronic Agriculture, vol. 44, no. 3, pp. 173–188, 2004. [Google Scholar]
52. G. W. Lawrence, A. T. Kelley, R. L. King, J. Vickery, H. -K. Lee et al.,” “Remote sensing and precision nematicide applications for rotylenchulus reniformis management in cotton,” in Proc. of the Fourth Int. Congress of Nematology, Tenerife, Spain, pp. 13–21, 2004. [Google Scholar]
53. B. Li, Z. Liu, J. Huang and L. Zhang, “Hyperspectral identification of rice diseases and pests based on principal component analysis and probabilistic neural network,” Transactions of the Chinese Society of Agricultural Engineering, vol. 25, no. 9, pp. 143–147, 2009. [Google Scholar]
54. S. P. Mohanty, D. P. Hughes and M. Salathe, “Using deep learning for image-based plant disease detection,” Frontline Plant Science, vol. 7, pp. 1–10, 2016. [Google Scholar]
55. S. Sladojevic, M. Arsenovic, A. Anderla, D. Culibr and D. Stefanovic, “Deep neural networks-based recognition of plant diseases by leaf image classification,” Computational Intelligence and Neuroscience, vol. 2016, pp. 1–11, 2016. [Google Scholar]
56. T. R. Gadekallu, “A novel PCA–whale optimization-based deep neural network model for classification of tomato plant diseases using GPU,” Journal of Real-Time Image Processing, vol. 18, no. 4, pp. 1383–1396, 2020. [Google Scholar]
57. S. Zhang, H. Wang, W. Huang and Z. You, “Plant diseased leaf segmentation and recognition by fusion of superpixel, K-means and PHOG,” Optik Journal, vol. 157, pp. 866–872, 2018. [Google Scholar]
58. G. Barenboim, J. Hirn and V. Sanz, “Symmetry meets AI,” arXiv preprint arXiv:2103.06115, 2021. [Google Scholar]
59. S. I. Zandalinas, Y. Fichman, A. R. Devireddy, S. Sengupta, R. K. Azad et al., “Systemic signaling during abiotic stress combination in plants,” in Proc. of the National Academy of Sciences, USA, vol. 117, no. 24, pp. 13810–13820, 2020. [Google Scholar]
60. R. R. daSilva, C. A. G. daCâmara, A. V. Almeida and C. S. Ramos, “Biotic and abiotic stress-induced phenylpropanoids in leaves of the mango (Mangiferaindica L., Anacardiaceae),” Journal of the Brazilian Chemical Society, vol. 23, pp. 206–211, 2012. [Google Scholar]
 | This work is licensed under a Creative Commons Attribution 4.0 International License, which permits unrestricted use, distribution, and reproduction in any medium, provided the original work is properly cited. |