DOI:10.32604/iasc.2022.025421
| Intelligent Automation & Soft Computing DOI:10.32604/iasc.2022.025421 | |
| Article |
Smartphone Sensors Based Physical Life-Routine for Health Education
1Department of Humanities and Social Science, Al Ain University, Al Ain, 15551, UAE
2Department of Computer Science, Air University, Islamabad, 44000, Pakistan
3Department of Computer Science, College of Computer, Qassim University, Buraydah 51452, Saudi Arabia
4Department of Computer Science and Software Engineering, Al Ain University, Al Ain, 15551, UAE
5Department of Computer Engineering, Korea Polytechnic University, Siheung-si, Gyeonggi-do, 15073, Korea
*Corresponding Author: Jeongmin Park. Email: jmpark@kpu.ac.kr
Received: 23 November 2021; Accepted: 18 January 2022
Abstract: The physical and the mental health of a human being largely depends upon his physical life-routine (PLR) and today’s much advanced technological methods make it possible to recognize and keep track of an individual’s PLR. With the successful and accurate recognition of PLR, a sublime service of health education can be made copious. In this regard, smartphones can play a vital role as they are ubiquitous and have utilitarian sensors embedded in them. In this paper, we propose a framework that extracts the features from the smartphone sensors data and then uses the sequential feature selection to select the most useful ones. The system employs a novel approach of codebook assignment that uses vector quantization to efficiently manipulate the data coming from the smartphone sensors of different nature and serve as a data compression module at the same time. The proposed system uses a multilayer perceptron classifier to differentiate among different PLRs. The experimentation was performed on the benchmark Real-life HAR dataset. It provides the data of four sensors: accelerometer, gyroscope, magnetometer, and global positioning system (GPS) for the recognition of four activities namely active, inactive, walking, and driving. The performance of the proposed system was validated using 10-fold cross-validation and the confidence of the system was recorded to be 91.80%.
Keywords: Codebook generation; human activity recognition; multilayer perceptron; physical life routines; smartphone sensors
With the technological evolution of the world, humans expect technology to pillar their lives in every domain and one of the areas that are of key importance in a human being’s life is his physical health [1,2]. If a person gets to know his current physical health condition [3,4], he can be more cautious in case of danger and can save his life. As PLR [5,6] is a combination of locomotion activities that are performed by a human being, this research problem lies in the domain of human locomotion activity recognition (HLAR) [7]. If we are able to accurately recognize and track the locomotion activities of a specific human being, we can identify his PLR and as its benefit, we can predict his current physical health condition and make useful suggestions to make him keep his health up [8].
HLAR has been a field of research that has kept the interest of researchers for more than a decade now. Besides health education, HLAR has many other applications like indoor localization [9], security [10], rescue [11], entertainment [12], smart homes [13] and life-logging [14,15]. But for the sake of this paper, we will be concentrating only on the application of health education and physical exercise. There has been a lot of work done to accurately recognize the human locomotion activities following various approaches including wearable sensors [16,17], computer vision [18] and smartphone sensors [19]. Every technique has its benefits and drawbacks also. The wearable sensors provide ease in analysis and more reliable data due to their fixed position, but they can annoy the users as it is strenuous to wear the sensors. Vision-based techniques can be user-friendly because they have no physical contact with the user, but the vision system has a high cost and can also cause privacy issues [20]. On the other hand, smartphones are ubiquitous, and people carry them without any annoyance. Although they can cause difficulties in computing and analysis as their position is not fixed, these difficulties can be easily overcome with the help of appropriate computation methods and the addition of useful sensors in the data that can eliminate the ambiguity [21]. Due to ease of use and the cost-effectiveness of smartphone technology, the basis of our research is smartphone sensors.
In this research article, we proposed an efficient method for HLAR using some very useful features like Parseval’s energy, skewness, FFT-min-max-difference, FFT-min-max-ratio, and ar-coefficients. For the classification purpose, it utilizes a multilayer perceptron (MLP) classifier. The proposed system starts its operation by denoising the acquired signal and then performs windowing and segmentation. After that, it extracts useful time-domain and frequency-domain features. To select the best features among the extracted, our system performs the feature selection based on the sequential feature selection (SFS) methodology. A very useful aspect of our proposed system is the codebook assignment. The codebook assignment module uses vector quantization (VQ) for the generation of the codewords. The labeled codeword for every example of a certain class is accumulated into a single data-frame that is known as a codebook of that particular class. Finally, the classification of locomotion activities is performed using a multilayer perceptron (MLP) classifier [22]. We used a publicly available benchmark dataset “real-life HAR” that provides the data of four smartphone sensors i.e., accelerometer, gyroscope, magnetometer, and GPS to recognize four locomotion activities namely active, inactive, walking, and driving. We validated our HLAR results against other available state-of-the-art models. The proposed system comprehensively outperformed the state-of-the-art methods.
The rest of the article is organized in the following fashion. Section 2 describes previously accomplished related work for HLAR while Section 3 represents methodology and architecture of the proposed system. In Section 4, evaluation of performance of our system is given. Finally, Section 5 concludes the paper and expresses the future directions.
A lot of work has been done in the field of HLAR while following various remarkable and streamlined methods. We had a comprehensive review of the systems that had been implemented in this field. Some of which were implemented using accelerometer and others were implemented using GPS as their basis. The following sub-sections provide a deep insight into the related work for HLAR.
While working with inertial sensors for an HLAR system, accelerometer is the first and generic priority for the researchers. There is a lot of work regarding HLAR that revolves around accelerometer. An accelerometer measures the inertial forces along the x, y, and z direction. Jalal et al. used a tri-axial accelerometer for a smart home application [23]. They extracted statistical features from accelerometer data and then applied a random forest classifier to perform the classification. In [24], Batool et al. used an accelerometer to analyze human activities. They extracted the mel-frequency-cepstral-coefficients (MFCC) and statistical features and then employed particle swarm optimization (PSO) along with a support vector machine (SVM) classifier to distinguish among the locomotion activities. Kusuma et al. used tri-axial accelerometer data to classify static and dynamic activities based on one-dimensional convolutional neural network (CNN) [25]. A system with statistical features with an SMO-based random forest classifier was proposed in [26] by Badar et al. An accelerometer-based approach produced very useful frameworks for the HLAR but the common issue with the accelerometer either wearable or smartphone accelerometer is that it cannot measure the altitude so efficiently. Moreover, in case of smartphone accelerometer, there comes another additional issue of the orientation of smartphone. These issues can only be addressed with the use of some additional useful sensors like gyroscope and magnetometer etc.
GPS provides the longitude and latitude information and the use of GPS sensors has been encouraged with the development of smartphone technology. In [27], Casella et al. used finite state automata that are constructed using the grammatical inference technique. They used GPS based approach to recognize human locomotion activities. Another work captured smartphone GPS data and enhanced its effectiveness by adding points of interest and user profile information to it. After that they classified the activities that they initially divided into stop and moves activities [28]. Natal et al. divided their system in two phases i.e., generation phase and execution phase. Besides the GPS data, they also used annotated user profile as an input for their system. In the generation phase, they extracted timestamped GPS data from user’s smartphone and preprocessed the it. After that they extracted features and combined them with offline user profile information and trained their model. In the execution phase, they tested their framework for HLAR [29]. Another research work extracted GPS data corresponding to a certain activity and using overlapping windows, they generated shapelets and extracted features using those shapelets. By pseudo-randomly shuffling the order, they generated training, testing, and validation datasets. They used majority voting to predict the performed activity [30]. GPS sensor provides the location information that proves to be very useful contextual information. Using this information along with other inertial sensors of the smartphone can enhance activity recognition accuracy.
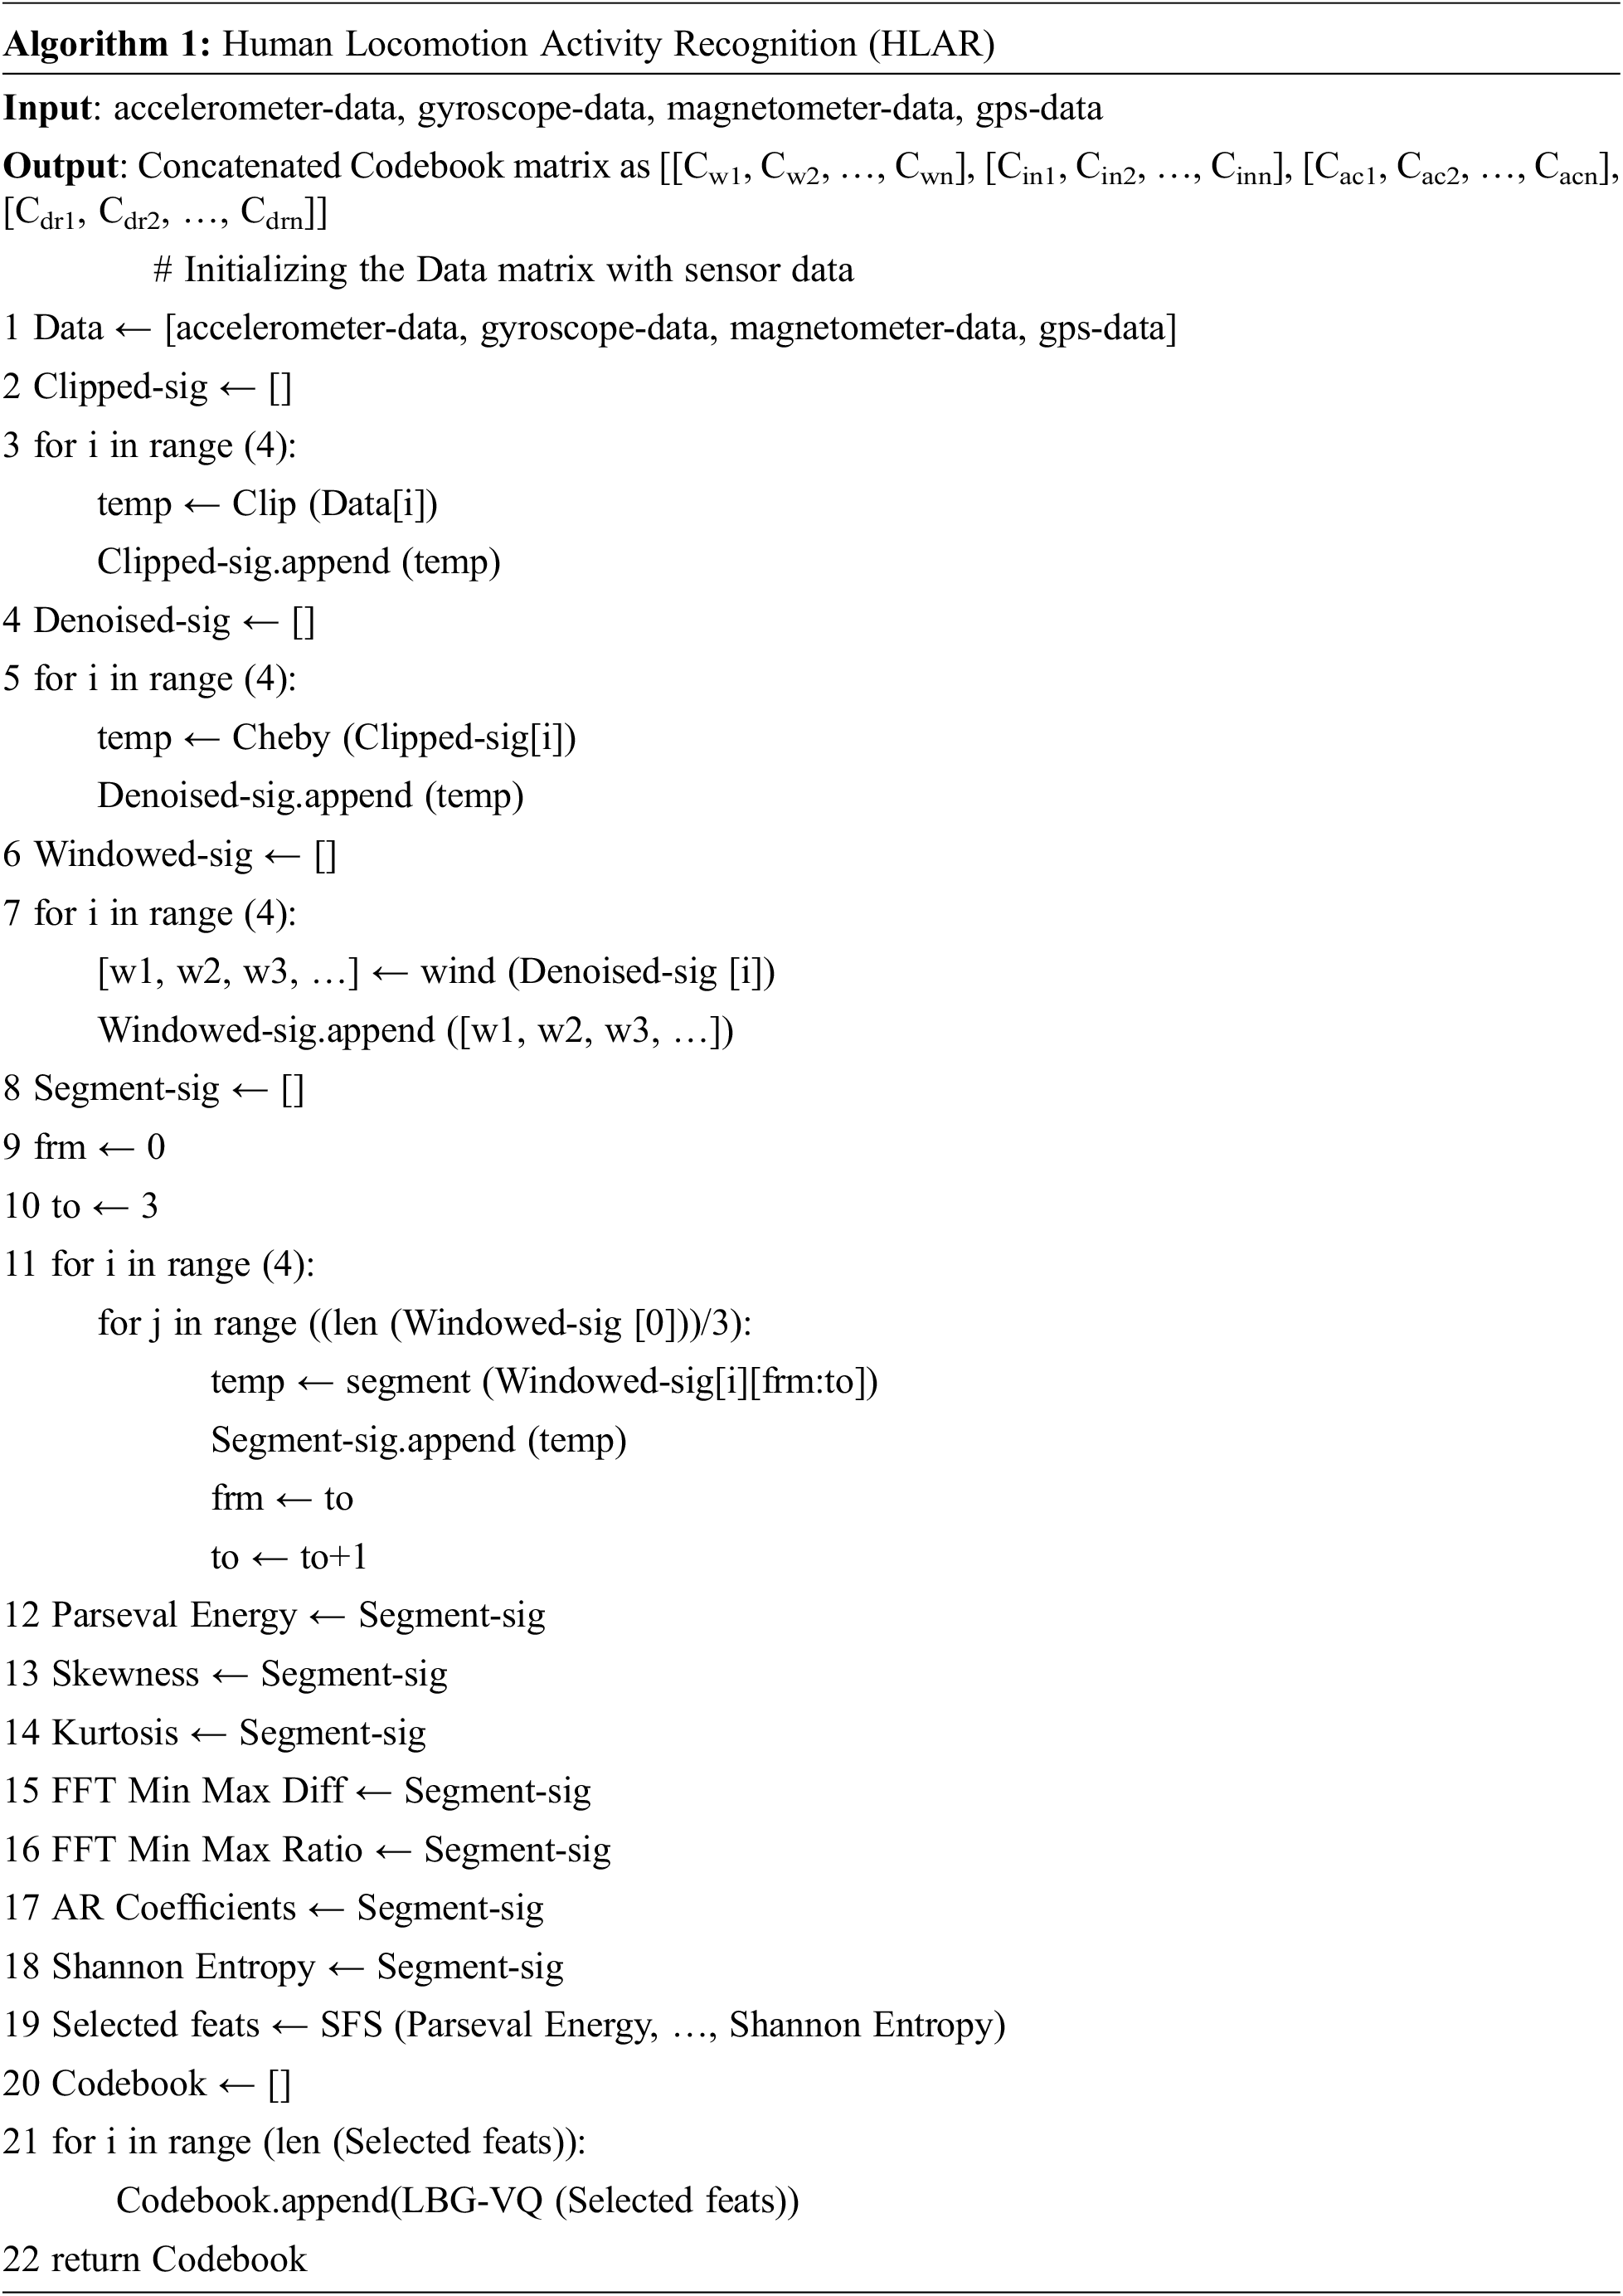
The proposed system consists of a total of seven modules that are preprocessing, windowing, segmentation, feature extraction, feature selection, codebook assignment, and classification. Fig. 1 manifests the architecture of the proposed system.

Figure 1: The proposed framework for HLAR
Preprocessing module clips the unwanted parts and denoises the input signals using the Chebyshev filter and forwards the results to the windowing module that divides the signal into small rectangular windows that are then segmented with the segmentation module. Using these signal segments, useful time-domain and frequency-domain features are extracted. Feature selection module that uses sequential feature selection, selects the best performing features among all of the features that were extracted. The selected features are then sent to the codebook assignment block where vector quantization is used to generate the codebook for each feature and a final data frame is generated along with the labels. This data frame is processed by a multilayer perceptron algorithm for classification purpose.
The signals that are just acquired from the sensors have a lot of noise due to the acquisition process. There is another factor that produces disturbance in the signal and that is the initial and the final states of the subject. For example, if we are to measure a walking activity, at the very start of performing the activity the subject would be standing and the same situation will be there at the end of the activity. This fact makes it very important to clip some part of the signal from the start and also from the end so that we can get the data that represents the concerned activity in actuality. In our case, clipping 25% of the data from the start and 25% data from the end produced the best results. The next step in preprocessing is to denoise the signal using a suitable filter. Usually, the noise is of high frequency so was in our case. We tried multiple filters including the Butterworth filter and the Chebyshev filters and we also tested them with different orders and parameters [31]. In our case, the Chebyshev filter performed in the best way. The Chebyshev filter defined by Eq. (1) is given below:
where TN represents the Nth order Chebyshev polynomial and is defined by the Eq. (2):
The Chebyshev filter performs better than the Butterworth filter with respect to the execution speed and absolute error. We used 2nd order type-I Chebyshev filter with a ripple factor of 0.001 and wn equal to 0.0003. This filter was able to denoise input signal very well. Noisy and denoised signals are shown in Fig. 2.

Figure 2: Signal denoising using the second-order Chebyshev-I filter with a ripple factor equal to 0.001 (a) Magnetometer Channel-x (b) Magnetometer Channel-y (c) Magnetometer Channel-z
3.2 Windowing and Segmentation
Windowing of the signal is done to reduce the computational complexity of the system [32]. We used the rectangular windowing approach and divided the preprocessed signal into windows having a duration of five seconds. If we take a very short length window then important information might not be acquired completely and if we take a very long length window then we might process redundant information that increases the computational complexity. According to our experimentation, five-second window produces the best results.
Segmentation is performed by concatenating the windows into an array. It is an excellent technique to test the performance of the system on different parts of the signal [33]. In our system, we created the segments using three five-second windows for each segment and then processed the information based on these segments.
Human locomotion activities can have idle activities like sitting or standing and also dynamic activities like walking and jumping. Time-domain features prove to work better for the idle category of activities while frequency domain features prove beneficial for the dynamic category [34–36]. So, we extracted a total of seven features from the dataset including both time-domain and frequency-domain features. The features that we extracted are explained below:
Parseval energy is used to find the percentage distribution of the energy features in a one-dimensional signal [37]. It can be calculated both in the time and frequency domain with the help of Eqs. (3) and (4) respectively. Parseval’s energy theorem states that the energy of a signal in the time domain is equal to the energy of the signal in the frequency domain Eq. (5).
where x(t) and x(jω) are the signals in the time and frequency-domain respectively. Parseval’s energy is a popular feature in the field of brain-computer-interface (BCI) where a one-dimensional EEG signal has to be processed. Noticing its usefulness for EEG signals, we decided to use it for our HLAR system. Fig. 3a represents the Parseval energy for walking, inactive, active, and driving activities.

Figure 3: Feature extraction (a) Time-domain Parseval energy for all four activities of the dataset (b) Skewness for all four activities of the dataset, (c) Kurtosis for all four activities of the dataset
Asymmetry of a distribution is measured in terms of the skewness, and it is given by Eq. (6). Where n is the number of samples, Xi represents an ith sample,
The skewness for all of the four concerned classes is shown in Fig. 3b
Kurtosis gives information about the length and weight of the tail of the distribution [38]. Fig. 3c displays the kurtosis plot for all four classes of the dataset.
The distribution of the signal data over its length is very important. Every activity has a special kind of distribution that can prove helpful in its successful recognition. Kurtosis is defined by Eq. (7). Where n is the number of samples, Xi and
For this feature [39], the signal is taken from the time-domain to the frequency-domain and power spectral density is computed. Power spectral density (PSD) analyses the complete frequency range for the distribution of power. Then the maximum and the minimum points of PSD are calculated and difference of these two points is taken to use as a feature. Fig. 4a shows the FFT-min-max-difference for all four activities in the dataset.
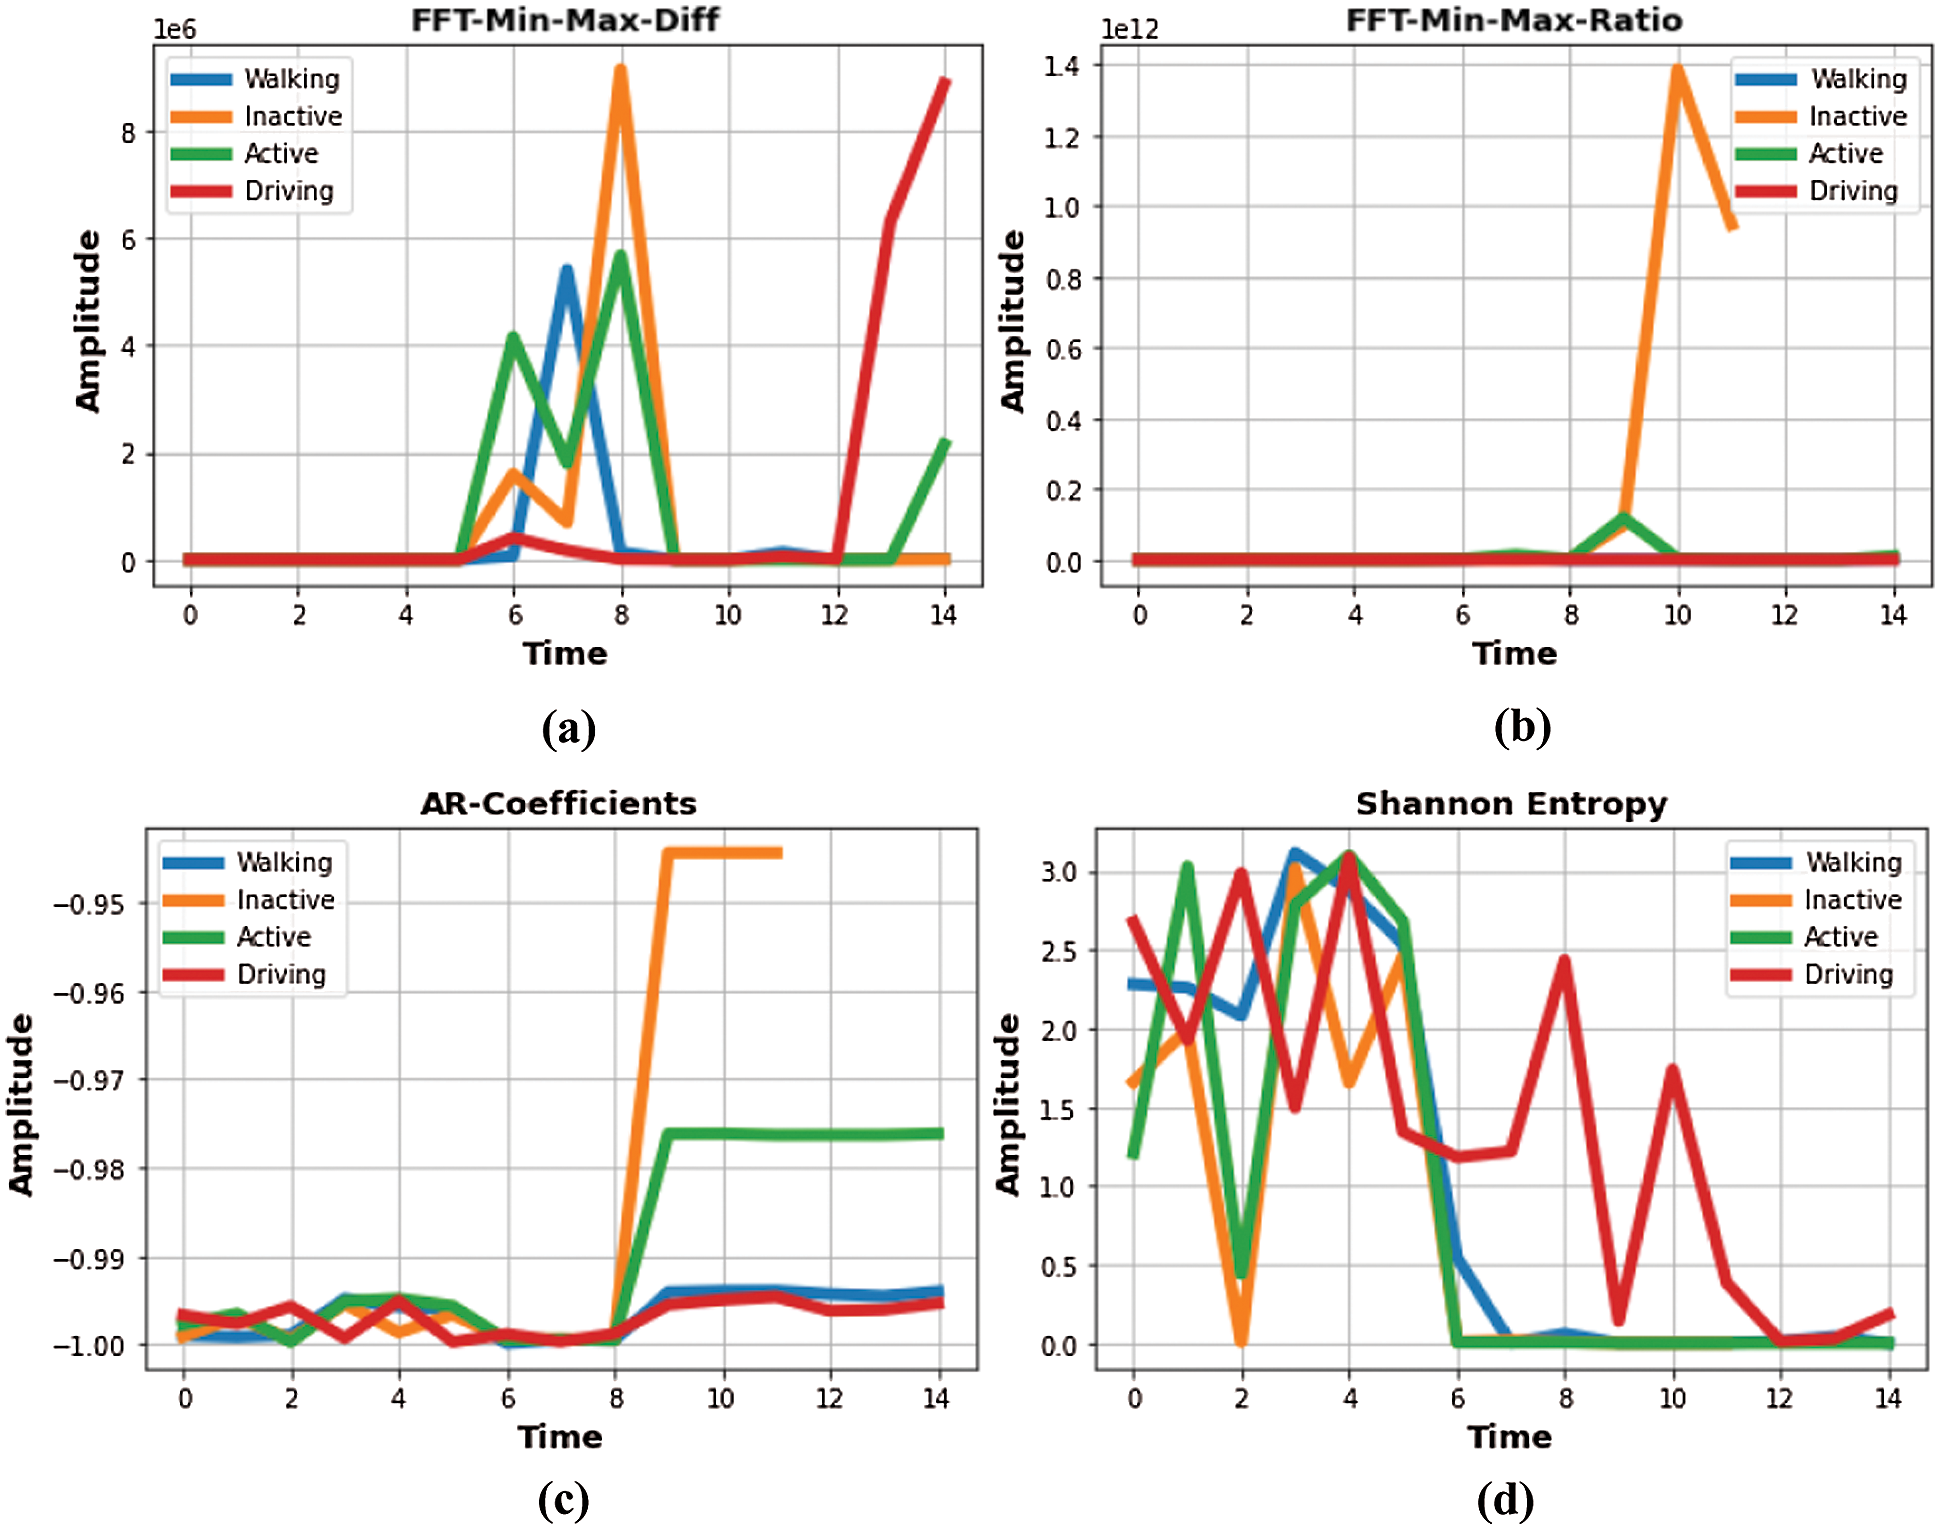
Figure 4: Feature extraction (a) FFT min-max difference for walking, inactive, active and driving (b) FFT min-max ratio (c) AR-coefficients (d) Shannon Entropy
To compute this feature, the same procedure has to be followed that is used to find the FFT-min-max-difference. Instead of taking the difference of the minimum and maximum points, their ratio is calculated. Fig. 4b represents the FFT-min-max-ratio for all activities.
3.3.6 Autoregressive Coefficients
The autoregressive (AR) model is used for the forecasting of the time-series. It predicts the future values based on the previous values [40]. AR-coefficients decide the weightage of a specific previous value. Eq. (8) represents the AR model.
where βi represents the weights of the past values m and the white noise of the system is represented by E(t). Fig. 4c depicts the AR-coefficients for all four activities.
Shannon entropy [41–43] measures the amount of uncertainty in the signal. The mathematical representation of the Shannon entropy is given by Eq. (9).
where gi refers to the probability of occurrence of a specific data point. We took the negative log of the current data point and then multiplied the result with the original data point. Then repeated the same process for complete data vector and sum all the results together to find the Shannon entropy for a specific vector. The manifestation of the Shannon entropy is done in Fig. 4d.
In the feature extraction module, we extracted seven features. With the aid of feature selection, we can find the most informative features of the dataset that can help attaining the best performance of the classification algorithm. For this purpose, we used novel sequential forward selection (SFS) which is a wrapper-based approach. SFS algorithm considers all possible combinations of the features and evaluates them for the best accuracy [44,45]. As its output, SFS provides the combination of the best performing features while the number of features that are to be selected is a hyper-parameter. Previously described seven features were forwarded to the sequential feature selection algorithm to select five most informative features among all. The algorithm dropped kurtosis and Shannon entropy and selected Parseval’s energy, skewness, FFT-min-max-difference, FFT-min-max-ratio, and AR-coefficients as the most informative features.
Vector Quantization (VQ) codebook assignment works as a feature improvement and data compression technique that passes the features of divergent nature from a single channel and generates a codeword that has the properties of all the features together [46]. The system uses one of the customary VQ codebook generation algorithms that is Linde-Buzo-Gray (LBG). It takes non-overlapping feature vectors for the training. As a result, it generates a reference codeword that is then used to generate the codewords for the feature vectors of other activities. For the generation of the reference codeword, the algorithm requires to specify the number of bits. We experimented with various number of bits for the codebook generation and for our system, the 16-bit codebook provided the best results. Fig. 5a represents a 16-bits codeword for the walking activity, Fig. 5b shows a 16-bit codeword for inactive, Fig. 5c shows codeword for active, and Fig. 5d shows codeword for driving. The number of bits (N) can be calculated by Eq. (10). After the codewords for each of the activities of a specific class are generated, they are concatenated into one data frame that is called a codebook of a specific activity. Whenever the system is tested with an unknown example, the system generates the codeword for that unknown example and matches it with the codewords present in the codebook of every class, and makes its decision.
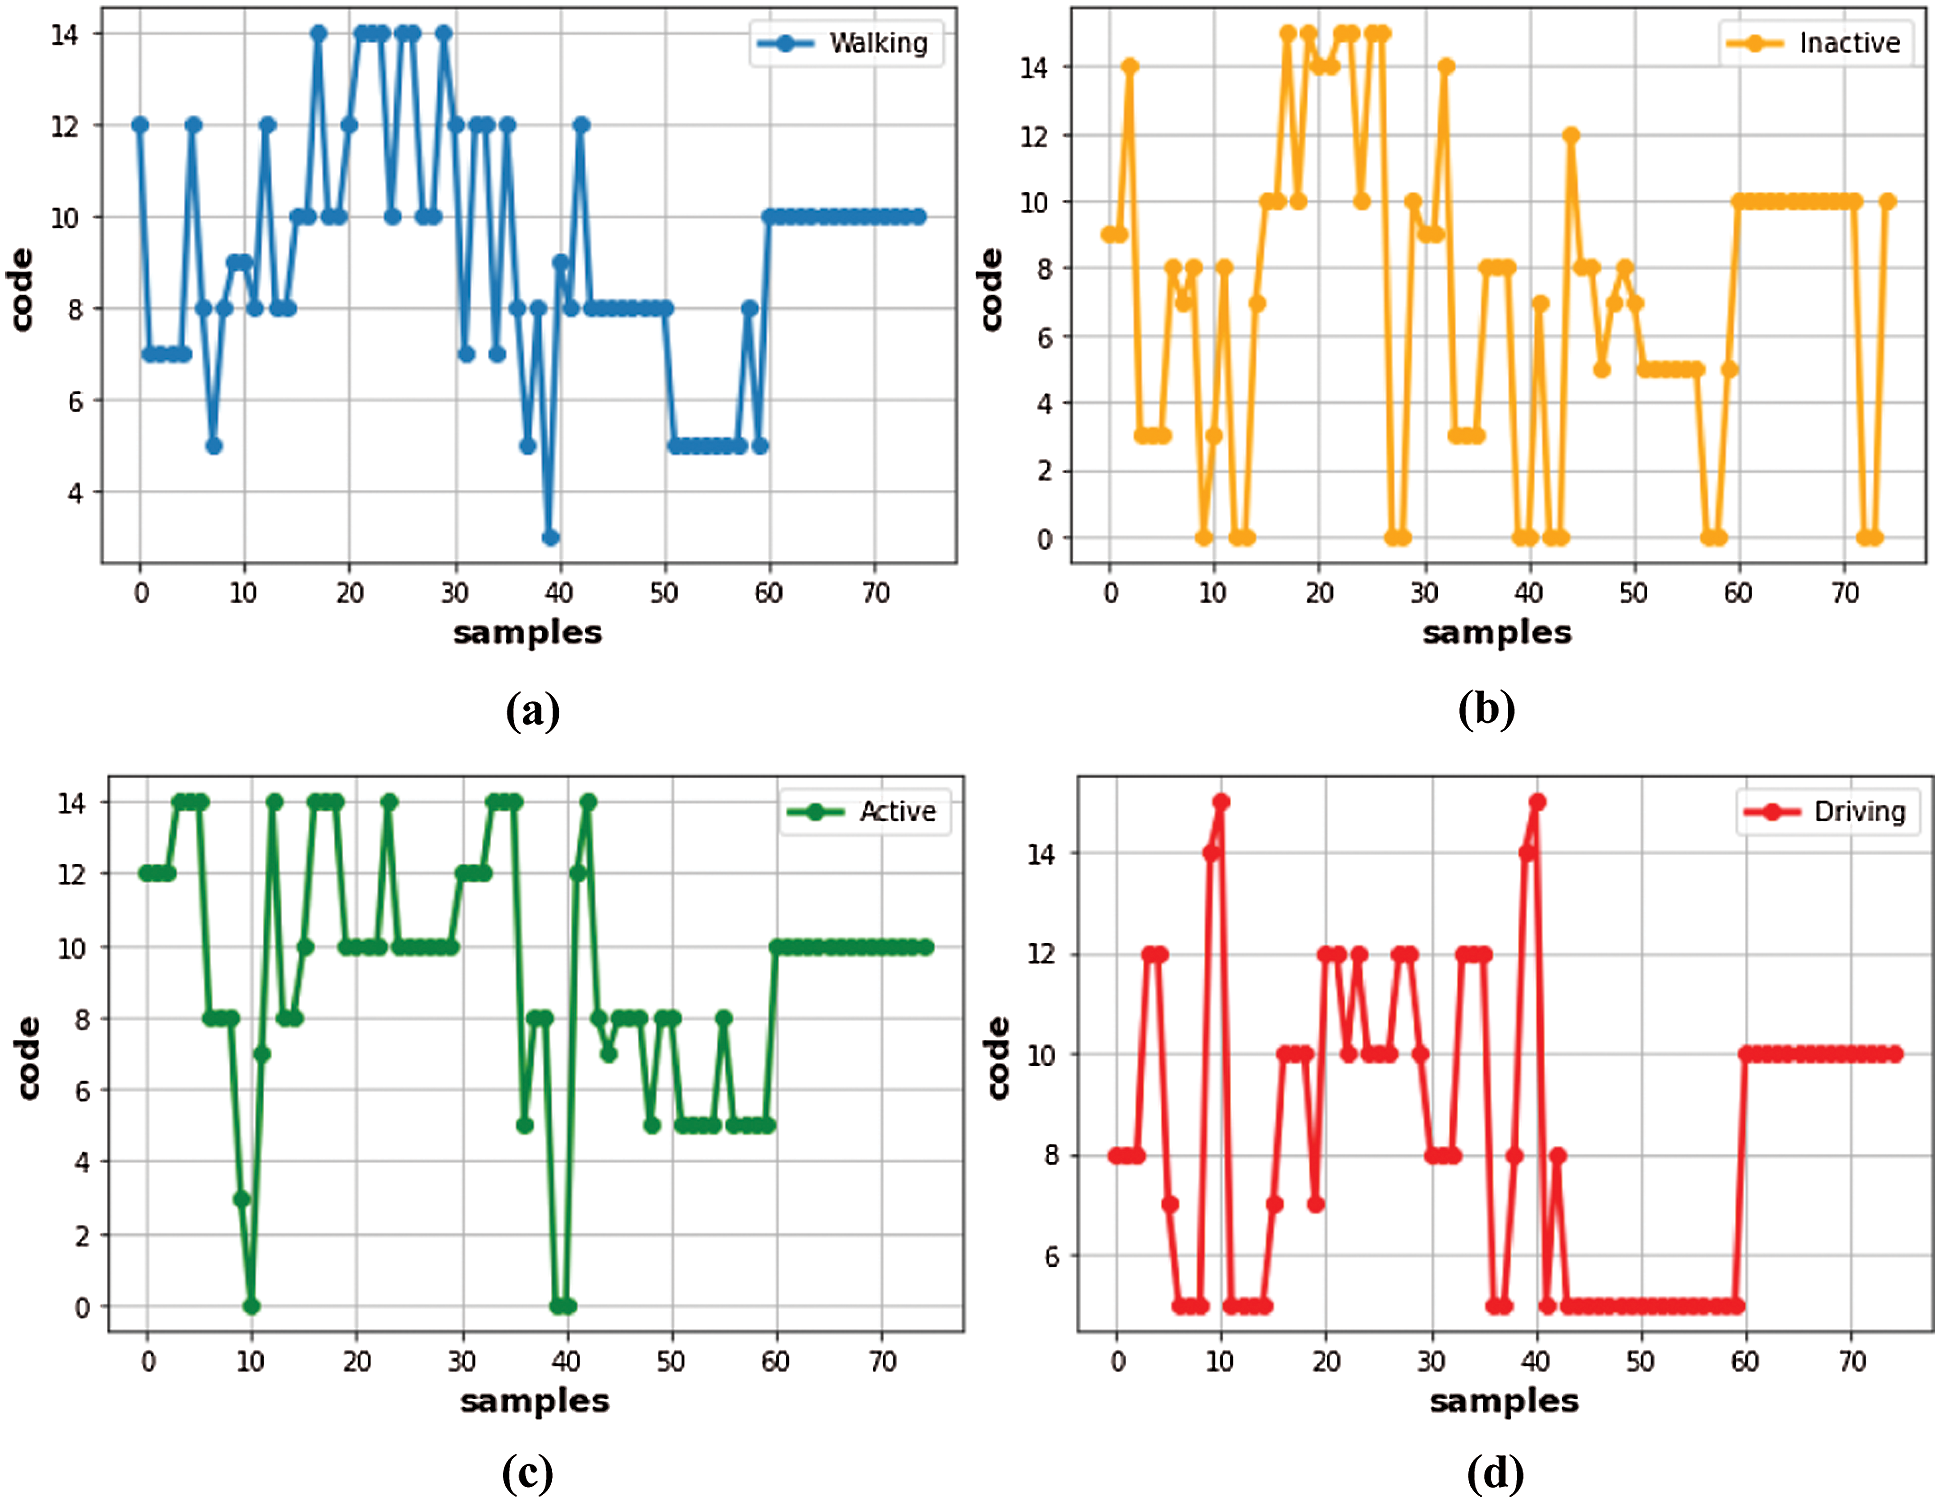
Figure 5: Codewords for different activities (a) 16-bit codeword for walking (b) 16-bit codeword for Inactive (c) 16-bit codeword for Active (d) 16-bit codeword for Driving
3.6 Algorithm of the Proposed System
Due to their remarkable performance, deep learning algorithms have caught the attention of many technological fields. For our research work, we used a multilayer perceptron (MLP) which is a feed-forward multilayer network. In MLP, the input layer nodes hold the network’s input features while the hidden layers gather the input layer’s weighted inputs and pass their output data to the next layer. Then the classification results for the input data are stored in the output layer. The network has to learn the weight matrix to produce the best classification results [47]. Back-propagation is the technique that is usually used to learn the weight matrix. MLP works in such a way that it multiplies each input with corresponding weight and adds a bias term to the result. Following the same procedure, it processes all of the inputs and after adds them together. Then it passes the result to the activation function that converts the results into a probability distribution. All this multiplication and addition work is done in the hidden layer and after the application of the activation function, the highest probability value represents the prediction for the input [48]. The network architecture of MLP is manifested in Fig. 6.
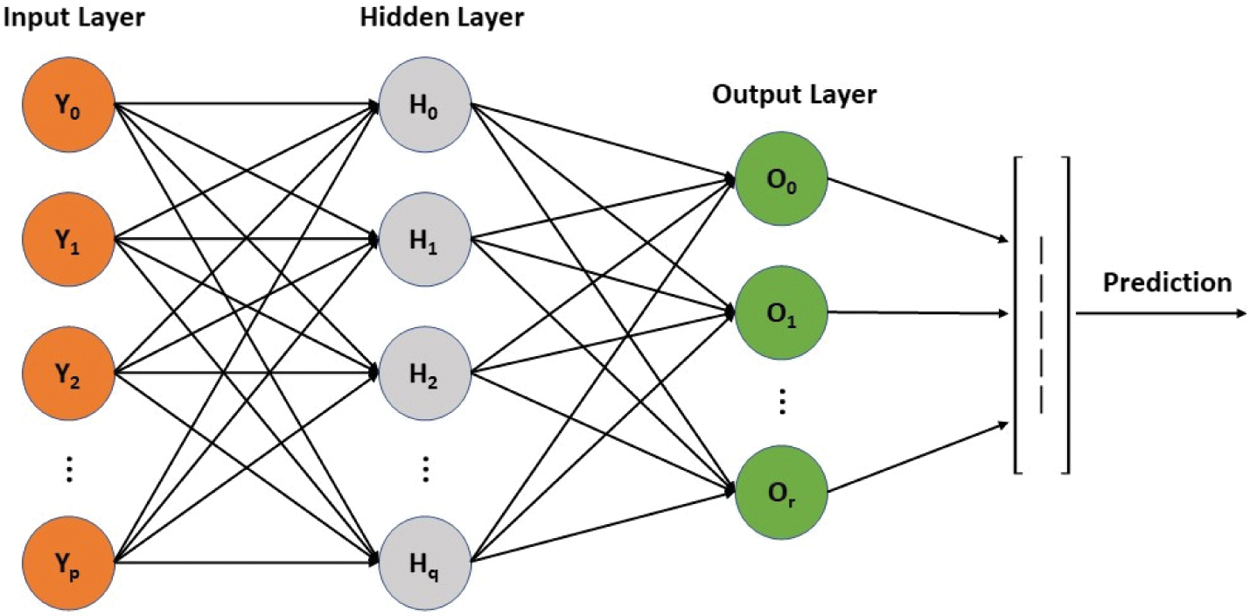
Figure 6: Network Architecture of Multilayer Perceptron with single hidden layer
The mathematical representation of MLP is given in Eq. (11) where Yk represents the output of the kth perceptron, wki is the point of the weight matrix that is at ith position for kth perceptron, xi is the ith input and bk is the bias for kth perceptron. Moreover, n represents the number of neurons in the current layer and f is the activation function.
For our system, we used an MLP classifier with one input layer, one hidden layer, and an output layer. Our input layer consisted of 75 neurons as it was the length of our feature vector. Hidden layer contained 100 neurons in it and output layer had 4 neurons because we had four classes to work with. The activation function and the optimization method were tanh and adam respectively.
This section contributes to the paper with a brief description of the dataset and the results of the experiments that were performed for this research. Lastly, it includes the comparison of the proposed system with the state-of-the-art systems.
The dataset used for this research work is applied for real-life human activity recognition. For this dataset, the data was collected from nineteen subjects in a real-life environment where the subjects were not required to hold the phone in a specific position or tie it somewhere on their bodies rather, they were free to keep their smartphones according to their desire. The dataset provided the data of four sensors namely accelerometer, gyroscope, magnetometer, and GPS. Accelerometer, gyroscope, and magnetometer provided 3-axial data each and GPS provided six-axial data including latitude increment, longitude increment, altitude increment, GPS speed, GPS bearing, and GPS accuracy. A special property of this dataset is that all the sensor readings are frequency-independent because when the data was collected, the frequency was not kept fixed at a constant value. All these features make this dataset a real challenge for the researchers because it encompasses a real-life scenario. Four activities were performed by all of the subjects for the data collection i.e., walking, inactive, active, and driving. A brief description of the dataset is provided in Tab. 1.

4.2 Experimental Settings and Results
All of the experimentation and analysis is done using python on Jupyter notebook 6.1.4. The system used for the development is Intel(R) Core (TM) i7-7500U CPU @ 2.70 GHz 2.90 GHz with a 64-bit Windows-10 and 16 GB RAM installed in it. To evaluate our system, we used 10-fold cross-validation to eliminate the dataset bias.
The codebook size selection is a very important hyper-parameter of the proposed system that directly influences the accuracy of the system. Fig. 7a shows the codewords generated for all four activities while using an 8-bit codebook. Fig. 7b depicts the codewords using a 16-bit codebook and Fig. 7c shows the codewords generated using a 32-bit codebook.
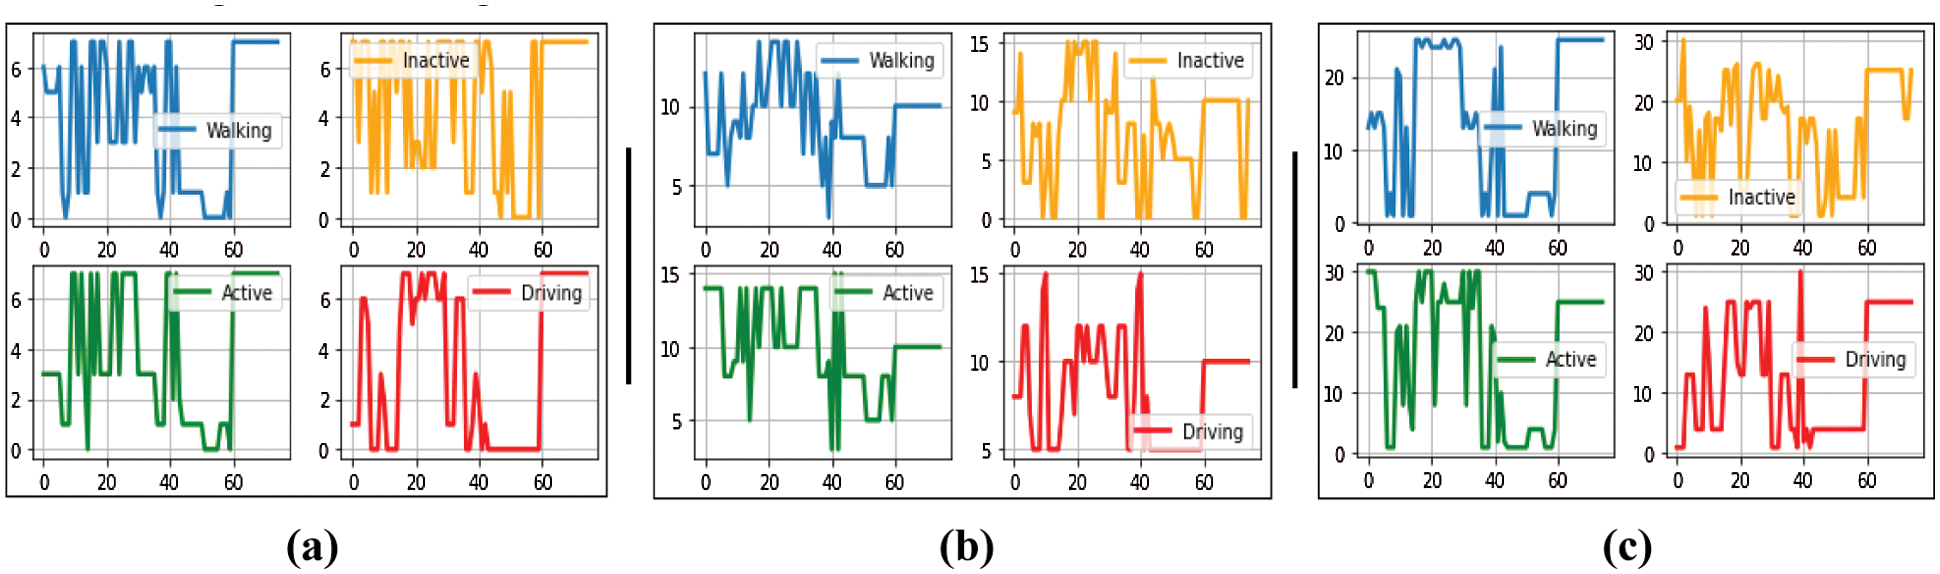
Figure 7: Codewords for varying size of the codebook (a) 8-bit codewords (b) 16-bit codewords (c) 32-bit codewords
We also designed a bar graph to represent the accuracy of the system based on the size of the codebook and it is given in Fig. 8. The system was tested on five different codebook sizes that are 8-bits, 16-bits, 32-bits, 64-bits, and 128-bits. While using a 10-fold cross-validation, we generated a confusion matrix for all five codebook sizes and recorded the accuracy for each one of the classes. According to the obvious results that are recorded in Fig. 8, 16-bit codebook outperformed all other test sizes with each class scoring above 80%.
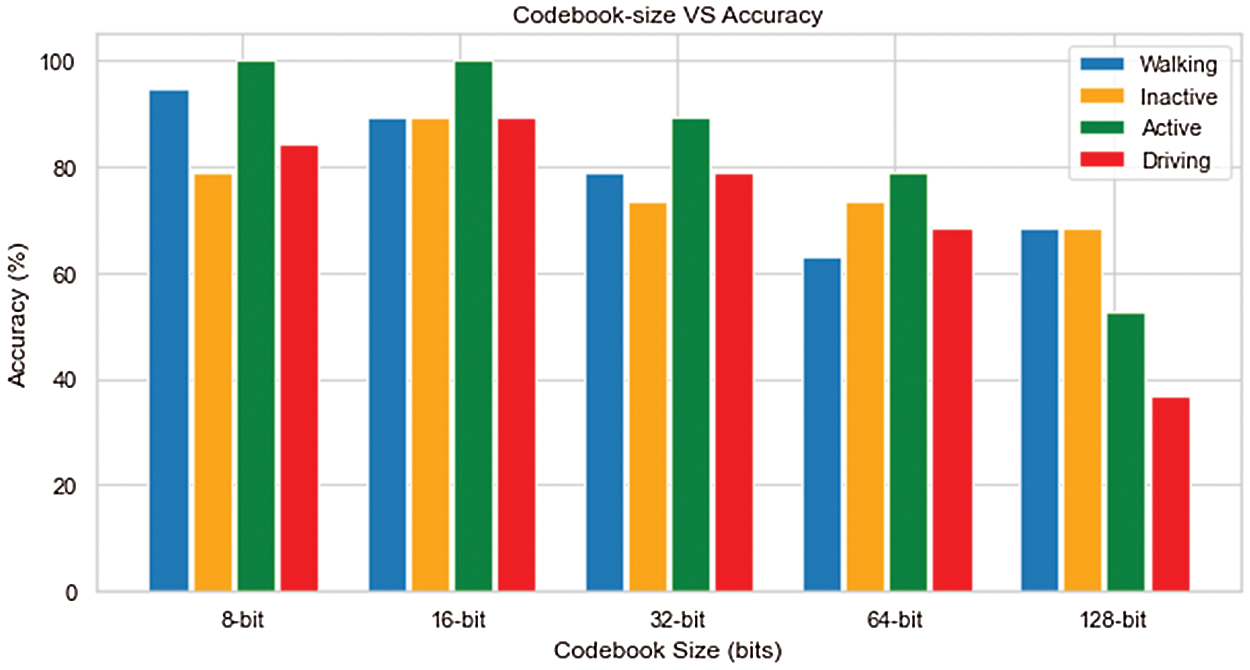
Figure 8: Comparison of the varying codebook sizes with the accuracy of the HLAR system
Working with MLP, the most important factor for the accurate classification of the activities is the tuning of the hyper-parameters. Before starting the tuning, we fixed the solver and the activation function because these two attributes play a vital role in the classification process. Among all other parameters, according to our experimentation, the most important parameter to tune is the learning rate. After we got the best learning rate, we tuned the number of layers and number of neurons in that layer. Then we tuned the number of iterations using a comprehensive range of numbers. Finally, we tuned the random state. If we could not have a significantly high accuracy after all this tuning, then we altered the activation function while keeping the solver the same as before and repeat the described tuning procedure. After training and fine-tuning MLP, we achieved the best mean accuracy of 91.80% in the recognition of locomotion activities. As the final values of the hyper-parameters, learning rate was 0.003, alpha was 0.0164, random state was 26, hidden layer size was 100, tanh was the activation function that we used, and the solver was adam. The confusion matrix for the proposed system is shown in the Tab. 2.

Besides the confusion matrix, we also computed the precision, recall, and F1-score for our system that is stated in Tab. 3. Precision represents the ratio of the predictions that were correct positives and total positives. Recall is the ratio of the predictions that were correct positives and total class observations and F1-score is the weighted average of precision and recall. Mean precision of our system is 0.923 while mean recall and mean F1-score for the proposed system is 0.918 both.

As this dataset is a new addition to the technological world, we made our contribution by accepting the challenge and outperforming the state-of-the-art. Garcia-Gonzalez et al. scored an accuracy of 67.53% while using a support vector machine (SVM) over accelerometer and GPS data. They also evaluated their model over accelerometer, gyroscope, magnetometer, and GPS data and scored 69.28% accuracy. Finally, while evaluating their model over accelerometer, magnetometer, and GPS they scored their highest accuracy and that was 74.39% [49]. The proposed method comprehensively outperformed the available state-of-the-art methods. A tabular comparison of the aforementioned algorithms is provided in Tab. 4.

This paper proposes a physical life routine recognition system that can successfully and accurately recognize the locomotion activities performed by a human being. The system extracts useful features from the time-domain and the frequency-domain and performs feature reduction using a sequential feature selection (SFS) algorithm. Then it forwards the most useful features that are selected by SFS to the codebook assignment unit where every feature vector is converted into a codeword and by combining those codewords, codebooks are generated for each activity. All of the codebooks are concatenated into a single matrix and labels are assigned. This labeled data matrix is then forwarded to the novel MLP classifier for classification. The proposed system outperforms the existing state-of-the-art methods as shown by the comparison statistics. Besides the PLR recognition and health education, the proposed system can be used in diverse applications like security, life-logging, and indoor localization.
One of the plans of our team is to develop a system that can recognize more kinds of locomotion activities than this system irrespective of the indoor or outdoor environments.
Acknowledgement: This research was supported by a grant (2021R1F1A1063634) of the Basic Science Research Program through the National Research Foundation (NRF) funded by the Ministry of Education, Republic of Korea.
Funding Statement: The authors received no specific funding for this study.
Conflicts of Interest: The authors declare that they have no conflicts of interest to report regarding the present study.
1. J. Madiha, M. Gochoo, A. Jalal and K. Kim, “HF-SPHR: Hybrid features for sustainable physical healthcare pattern recognition using deep belief networks,” Sustainability, vol. 13, no. 4, pp. 1699, 2021. [Google Scholar]
2. T. J. Swamy and T. N. Murthy, “eSmart: An IoT based intelligent health monitoring and management system for mankind,” in Proc. Int. Conf. on Computer Communication and Informatics, Coimbatore, India, pp. 1–5, 2019. [Google Scholar]
3. M. A. K. Quaid and A. Jalal, “Wearable sensors based human behavioral pattern recognition using statistical features and reweighted genetic algorithm,” Multimedia Tools and Applications, vol. 79, pp. 6061–6083, 2019. [Google Scholar]
4. A. Jalal, M. A. Quaid, S. B. Tahir and K. Kim, “A study of accelerometer and gyroscope measurements in physical life-log activities detection systems,” Sensors, vol. 20, no. 22, pp. 6670, 2020. [Google Scholar]
5. A. Jalal, A. Nadeem and S. Bobasu, “Human body parts estimation and detection for physical sports movements,” in Proc. Int. Conf. on Communication, Computing and Digital Systems, Islamabad, Pakistan, pp. 104–109, 2019. [Google Scholar]
6. J. Meyer, E. Beck, K. V. Holdt, F. Koppelin, A. Pauls et al., “ActiThings: Reminders for physical activity exercises in daily lives of inactive older adults,” in 2021 IEEE 9th Int. Conf. on Healthcare Informatics (ICHI), Victoria, BC, Canada, pp. 386–395, 2021. [Google Scholar]
7. A. Jalal, M. Batool and K. Kim, “Stochastic recognition of physical activity and healthcare using tri-axial inertial wearable sensors,” Applied Sciences, vol. 10, no. 20, pp. 7122, 2020. [Google Scholar]
8. A. Jalal and M. Mahmood, “Students’ behavior mining in E-learning environment using cognitive processes with information technologies,” Education and Information Technologies, vol. 24, pp. 1–25, 2019. [Google Scholar]
9. M. Javeed and A. Jalal, “Body-worn hybrid-sensors based motion patterns detection via Bag-of-features and fuzzy logic optimization,” in Proc. Int. Conf. on Innovative Computing, Islamabad, Pakistan, 2021. [Google Scholar]
10. C. Liu, J. Ying, F. Han and M. Ruan, “Abnormal human activity recognition using Bayes classifier and convolutional neural network,” in Proc. Int. Conf. on Signal and Image Processing, Shenzhen, China, pp. 33–37, 2018. [Google Scholar]
11. S. Kalita, A. Karmakar and S. M. Hazarika, “Human fall detection during activities of daily living using extended CORE9,” in Proc. Int. Conf. on Advanced Computational and Communication Paradigms, Gangtok, India, pp. 1–6, 2019. [Google Scholar]
12. H. A. Imran and U. Latif, “HHARNet: Taking inspiration from inception and dense networks for human activity recognition using inertial sensors,” in Proc. Int. Conf. on Smart Communities: Improving Quality of Life Using ICT, IoT and AI, Charlotte, NC, USA, pp. 24–27, 2020. [Google Scholar]
13. M. Batool, A. Jalal and K. Kim, “Telemonitoring of daily activity using accelerometer and gyroscope in smart home environments,” Journal of Electrical Engineering and Technology, vol. 15, pp. 2801–2809, 2020. [Google Scholar]
14. A. Jalal, M. Batool and K. Kim, “Sustainable wearable system: Human behavior modeling for life-logging activities using K-ary tree hashing classifier,” Sustainability, vol. 12, pp. 10324, 2020. [Google Scholar]
15. B. Tahir, A. Jalal and K. Kim, “IMU sensor based automatic-features descriptor for healthcare patient’s daily life-log recognition,” in Proc. Int. Conf. on Applied Sciences and Technology, Lahore, Pakistan, 2021. [Google Scholar]
16. M. Gochoo, S. Badar, A. Jalal and K. Kim, “Monitoring real-time personal locomotion behaviors over smart indoor-outdoor environments via body-worn sensors,” IEEE Access, vol. 9, pp. 70556–70570, 2021. [Google Scholar]
17. S. Badar, A. Jalal and K. Kim, “Wearable inertial sensors for daily activity analysis based on adam optimization and the maximum entropy markov model,” Entropy, vol. 22, no. 5, pp. 579, 2020. [Google Scholar]
18. A. Bagate and M. Shah, “Human activity recognition using RGB-D sensors,” in Proc. Int. Conf. on Intelligent Computing and Control Systems, Madurai, India, pp. 902–905, 2019. [Google Scholar]
19. A. Nandy, J. Saha, C. Chowdhury and K. P. D. Singh, “Detailed human activity recognition using wearable sensor and smartphones,” in Proc. Int. Conf. on Opto-Electronics and Applied Optics, pp. 1–6, 2019. [Google Scholar]
20. K. Kim, A. Jalal and M. Mahmood, “Vision-based human activity recognition system using depth silhouettes: A smart home system for monitoring the residents,” Journal of Electrical Engineering and Technology, vol. 14, pp. 2567–2573, 2019. [Google Scholar]
21. C. Y. Shan, P. Y. Han and O. S. Yin, “Deep analysis for smartphone-based human activity recognition,” in Proc. Int. Conf. on Information and Communication Technology, Yogyakarta, Indonesia, pp. 1–5, 2020. [Google Scholar]
22. A. Nadeem, A. Jalal and K. Kim, “Human actions tracking and recognition based on body parts detection via artificial neural network,” in Proc. Int. Conf. on Advancements in Computational Sciences, Lahore, Pakistan, pp. 1–6, 2020. [Google Scholar]
23. A. Jalal, M. A. K. Quaid and K. Kim, “A wrist worn acceleration based human motion analysis and classification for ambient smart home system,” Journal of Electrical Engineering & Technology, vol. 10, pp. 1–7, 2019. [Google Scholar]
24. M. Batool, A. Jalal and K. Kim, “Sensors technologies for human activity analysis based on SVM optimized by PSO algorithm,” in Proc. Int. Conf. on Applied and Engineering Mathematics, Taxila, Pakistan, pp. 145–150, 2019. [Google Scholar]
25. W. A. Kusuma, A. E. Minarno and M. S. Wibowo, “Triaxial accelerometer-based human activity recognition using 1D convolution neural network,” in Proc. Int. Workshop on Big Data and Information Security, Depok, Indonesia, pp. 53–58, 2020. [Google Scholar]
26. S. Badar, A. Jalal and M. Batool, “Wearable sensors for activity analysis using SMO-based random forest over smart home and sports datasets,” in Proc. Int. Conf. on Advancements in Computational Sciences, Lahore, Pakistan, pp. 1–6, 2020. [Google Scholar]
27. E. Casella, M. Ortolani, S. Silvestri and S. K. Das, “Hierarchical syntactic models for human activity recognition through mobility traces,” Personal and Ubiquitous Computing, vol. 24, pp. 451–464, 2020. [Google Scholar]
28. I. D. P. Natal, R. D. A. C. Cordeiro and A. C. B. Garcia, “Activity recognition model based on GPS data, points of interest and user profile,” in Proc. Int. Symposium on Methodologies for Intelligent Systems, Graz, Austria, pp. 358–367, 2017. [Google Scholar]
29. I. D. P. Natal, L. Correia, A. C. Garcia and L. Fernandes, “Efficient out-of-home activity recognition by complementing GPS data with semantic information,” FM, vol. 24, no. 11, pp. 1–21, 2019. [Google Scholar]
30. A. Gentek, “Activity Recognition Using Supervised Machine Learning and GPS Sensors,” Dissertation, 2020. [Google Scholar]
31. S. Bakshi, I. Javid, M. Rajoriya, S. Naz, P. Gupta et al., “Designand comparison between IIR butterwoth and chebyshev digital filters using matlab,” in Proc. Int. Conf. on Computing, Communication, and Intelligent Systems, pp. 439–446, 2019. [Google Scholar]
32. B. Puterka, J. Kacur and J. Pavlovicova, “Windowing for speech emotion recognition,” in Proc. Int. Symposium ELMAR, Zadar, Croatia, pp. 147–150, 2019. [Google Scholar]
33. A. Ahmed, A. Jalal and K. Kim, “Region and decision tree-based segmentations for multi-objects detection and classification in outdoor scenes,” in Proc. Int. Conf. on Frontiers of Information Technology, Islamabad, Pakistan, pp. 205–209, 2019. [Google Scholar]
34. A. Jalal, M. Mahmood and A. S. Hasan, “Multi-features descriptors for human activity tracking and recognition in indoor-outdoor environments,” in Proc. Int. Bhurban Conf. on Applied Sciences and Technology, Islamabad, Pakistan, pp. 371–376, 2019. [Google Scholar]
35. M. Ehatisham-Ul-Haq, A. Javed, M. A. Azam, H. M. A. Malik, A. Irtaza et al., “Robust human activity recognition using multimodal feature-level fusion,” IEEE Access, vol. 7, pp. 60736–60751, 2019. [Google Scholar]
36. U. Azmat and A. Jalal, “Smartphone inertial sensors for human locomotion activity recognition based on template matching and codebook generation,” in Proc. Int. Conf. on Communication Technologies, Rawalpindi, Pakistan, pp. 109–114, 2021. [Google Scholar]
37. M. Baykara and A. Abdulrahman, “Seizure detection based on adaptive feature extraction by applying extreme learning machines,” Traitement du Signal, vol. 38, no. 2, pp. 331–340, 2021. [Google Scholar]
38. R. Bono, J. Arnau, R. Alarcón and M. J. Blanca-Mena, “Bias, precision, and accuracy of skewness and kurtosis estimators for frequently used continuous distributions,” Symmetry, vol. 12, no. 1, pp. 19, 2020. [Google Scholar]
39. A. Jalal, M. Batool and B. Tahir, “Markerless sensors for physical health monitoring system using ECG and GMM feature extraction,” in Proc. Int. Bhurban Conf. on Applied Sciences and Technologies, Islamabad, Pakistan, pp. 340–345, 2021. [Google Scholar]
40. I. Mazumder, “An analytical approach of EEG analysis for emotion recognition,” in Proc. Devices for Integrated Circuit, Kalyani, India, pp. 256–260, 2019. [Google Scholar]
41. A. Jalal, A. Ahmed, A. Rafique and K. Kim, “Scene semantic recognition based on modified fuzzy c-mean and maximum entropy using object-to-object relations,” IEEE Access, vol. 9, pp. 27758–27772, 2021. [Google Scholar]
42. A. Nadeem, A. Jalal and K. Kim, “Automatic human posture estimation for sport activity recognition with robust body parts detection and entropy markov model,” Multimedia Tools and Applications, vol. 80, pp. 21465–21498, 2021. [Google Scholar]
43. A. Jalal, N. Khalid and K. Kim, “Automatic recognition of human interaction via hybrid descriptors and maximum entropy markov model using depth sensors,” Entropy, vol. 22, pp. 817, 2020. [Google Scholar]
44. S. Amna, A. Jalal, M. Gochoo and K. Kim, “Robust active shape model via hierarchical feature extraction with SFS-optimized convolution neural network for invariant human age classification,” Electronics, vol. 10, no. 4, pp. 465, 2021. [Google Scholar]
45. J. Madiha, A. Jalal and K. Kim, “Wearable sensors-based exertion recognition using statistical features and random forest for physical healthcare monitoring,” in Proc. Int. Bhurban Conf. on Applied Sciences and Technologies, Islamabad, Pakistan, pp. 512–517, 2021. [Google Scholar]
46. P. Yang, J. Tsai and J. Chou, “PCA-Based fast search using PCA-LBG-based VQ codebook for codebook search,” IEEE Access, vol. 4, pp. 1332–1344, 2016. [Google Scholar]
47. F. Rustam, A. A. Reshi, I. Ashraf, A. Mehmood, S. Ullah et al., “Sensor-based human activity recognition using deep stacked multilayered perceptron model,” IEEE Access, vol. 8, pp. 218898–218910, 2020. [Google Scholar]
48. N. B. Gaikwad, V. Tiwari, A. Keskar and N. C. Shivaprakash, “Efficient FPGA implementation of multilayer perceptron for real-time human activity classification,” IEEE Access, vol. 7, pp. 26696–26706, 2019. [Google Scholar]
49. D. Garcia-Gonzalez, D. Rivero, E. Fernandez-Blanco and M. R. Luaces, “A public domain dataset for real-life human activity recognition using smartphone,” Sensors, vol. 20, no. 8, pp. 2200, 2020. [Google Scholar]
 | This work is licensed under a Creative Commons Attribution 4.0 International License, which permits unrestricted use, distribution, and reproduction in any medium, provided the original work is properly cited. |