DOI:10.32604/iasc.2022.022707
| Intelligent Automation & Soft Computing DOI:10.32604/iasc.2022.022707 | |
| Article |
Medical Image Demosaicing Based Design of Newton Gregory Interpolation Algorithm
1Department of ECE, Arunachala College of Engineering for Women, Nagercoil, 629203, India
2Department of ECE, Lourdes Mount College of Engineering and Technology, Marthandam, 629195, India
3Department of CSE, Arunachala College of Engineering for Women, Nagercoil, 629203, India
*Corresponding Author: E. P. Kannan. Email: epkannanece@gmail.com
Received: 16 August 2021; Accepted: 13 December 2021
Abstract: In this paper, Field-Programmable Gate Array (FPGA) implementation-based image demosaicing is carried out. The Newton Gregory interpolation algorithm is designed based on FPGA frame work. Interpolation is the method of assessing the value of a function for any in-between value of self-regulating variable, whereas the method of computing the value of the function outside the specified range is named extrapolation. The natural images are collected from Kodak image database and medical images are collected from UPOL (University of Phoenix Online) database. The proposed algorithm is executed on using Xilinx ISE (Integrated Synthesis Environment) Design Suite 14.2 and is confirmed on Xilinx Virtex-5 FPGA board. The main aim of this paper is to develop a demosaicing method based on the FPGA technique. Implementing image processing on hardware reduces the cost and make simpler for debugging and verification. The hardware implementation in this system gives the better quality of output image. Implementing image processing on hardware reduces the cost and makes simpler for debugging and verification. Newton- Gregory interpolation technique produces the full resolution of green channel with red and blue channels. The experimental result clearly shows that proposed Newton-Gregory interpolation-based image demosaicing outperformed other algorithms. FPGA implementation attains the maximum Peak Signal-To-Noise Ratio (PSNR) of 40.53 dB and MATLAB (Matrix Laboratory). implementation attains the maximum PSNR of 38.15 dB.
Keywords: FPGA implementation; image demosaicing process; Newton Gregory interpolation algorithm; resampling
The word “interpolation” denotes to interpolating some unidentified info from a specified set of well-known info. The method of interpolation is wide used as a valued tool in science and engineering [1]. The matter may be a traditional one and dates back to the time of Newton and stargazer, United Nations agency required to resolve such a retardant in investigating information on the location of stars and planets [2]. Scientific applications of interpolation embody derivation of machine systems for numerical differentiation, numerical integration and numerical solutions of differential equations [3]. One amongst the most important issues in pictures employed in analysis is their resolution [4]. The unprocessed high-resolution spatial information and low-resolution spectral information of satellite pictures square measure connected with one another [5]. Therefore, spatial and spectral resolution sweetening of satellite pictures is fascinating [6]. The most focus of this analysis is to enhance the classification accuracy of clamant pictures [7]. So as to enhance the accuracy of satellite pictures with efficiency, preservation of edges and contour info is extremely vital [8]. Pictures square measure being analyzed and processed to get the improved resolution and classified result. Interpolation is one amongst the techniques typically used for image resolution sweetening [9]. This is often in the main accustomed increase the number of pixels in an exceedingly digital image [10–12].
The interpolation of a picture aims at estimating intermediate constituents between the well-known pixel values within the on the market low-resolution image. The image interpolation method is nothing however the image synthesis operation. This method is achieved row by row and so column by column. In digital image process, a method that converts a separate image outlined at one set of coordinate sites to a brand-new set of coordinate points is labeled as resampling. The method of resampling uses the interpolation purposes to seek out the pixel(s) value(s) at new coordinates as exposed in Fig. 1. Resampling method is employed in several image process procedures like rotation and resizing of pictures. This resampling method is undertaken in 2 stages. Within the opening move digital image is interpolated into a nonstop image and so this interpolated nonstop image is once more sampled to alter it into a digital image [13]. For instance, convolution is completed among a separate perform x(n) associate degreed an interpolating perform ℎ(t) to supply a nonstop perform y(t) as shown in Fig. 1. Within the sampling method, this nonstop perform is increased through a sampling perform to supply a separate perform resampled at a brand-new set of points [14]. The implementation of resampling method considerably based on the interpolation purposes used and also their frequency domain features within the pass band and the stop band [15]. The magnitude of FT (Fourier Transform) is employed to look at the operation within the passband and also the index plot of the magnitude is employed to look at the operation within the stopband.

Figure 1: The resampling process using interpolation purposes
There is several interpolation methods advanced to date which are separated into three key types described as:
• Nearest neighbor interpolation
• Bilinear interpolation
• Bicubic interpolation
Maschal et al. (2013) have proposed a method to compare the quality of two demosaicing procedures by considering the two-color artifacts, fringing and zippering effects. The prior algorithm measures the reconstructed edges formed in the image whether it is perfectly matched or not by edge slope measure algorithm. The second algorithm is based on color component difference field which determines the deviations in the color plane and estimates the red-blue plane and red–green plane in the demosaicing algorithm and it is known to be false measure demosaicing scheme. The sharpness of the pixels and the deviations in the images are the two most criteria to be considered in the calculation of the accuracy scheme of the demosaicing algorithm.
Hsieh Hou et al. (2013) presented the work in cubic splines for image interpolation and digital filtering especially the B-spline (Basis Spline) interpolation and B-spline filtering. The sampling rate adaption is required in image processing. The lag-range interpolation is the basic concept in spline interpolation. The guarantee is not given and the process is inaccurate in this lag-range interpolation. This leads to the polynomial interpolation which runs in a local procedure. The cardinal spline can be used by sampling theorem. Truncations are needed in the cardinal spline and produce the smoothest results. In magnification and modification and smoothing process, the B-spline interpolation is considered as the best. But the computation of this interpolation technique is complex.
Venkadesh et al. (2014) presented a work on color filter array interpolation using the adaptive filter. This work states the color filter array is better than beam splitters. Here for demosaicing the color difference ratio is considered. The noise is removed by using the adaptive filter since it is well performed in edges to eliminate the error that occurs due to interpolation. This method produces a highly robust and high PSNR output. The image quality should be improved.
Pekkucuksen et al. (2013) have presented a work on demosaicing the image on color filter array model by reconstructing the missing sample in interpolation by taking multicolor gradient technique. This algorithm won’t need threshold value and it is not a repeatable procedure and does not need to make any decisions. This technique is best suitable for Bayers CFA (Color Filter Array) pattern and is tested against Lukae CFA pattern for the performance parameters. This interpolation method uses edge-based filtering technique and it also uses the high strength edge for the finding of missing values. This technique works according to the edge detection and the directional approach. It can produce good CPSNR (color peak signal-to-noise ratio) value.
Daisuke Kiku et al. (2018) proposed another work which is a minimized-laplacian residual interpolation (MLRI). This work is the same as residual interpolation but small modifications are done. In the MLRI, tentative estimates of R image are calculated by reducing the Laplacian energies of the residuals. This process will be done in both horizontal and vertical way. The upsampling of observed R and B images are called the tentative image. The upsampling will be done by guided filter (edge preserving filter). By this Laplacian energy minimization, bilinear interpolation technique gives the accurate result with small Laplacian energy. This method is combined into GBTF (Gradient-based Threshold-Free) algorithm. This method makes the process very accurate. This method also provides sharply interpolated color image without artifacts. The CPSNR value for this method is 38.35.
3 Proposed Image Interpolation Hardware Architecture for Image Demosaicing
The main aim of this chapter is to develop a demosaicing method based on FPGA. Implementing image processing on hardware reduces the cost and make simpler for debugging and verification [16–18]. FPGAs are incorporated circuits whose inside practical task is characterized by client, through interior programmable interconnect hardware [19]. On the other hand, specially crafted systems need a final customized manufacturing venture for client characterized capacities. Inside, FPGAs normally contain numerous duplicates of a LE (Logic Element) or cell. The logic component can actualize a system of a few logic gates that then deliver into 1 or 2 flip-flops. Logic components are masterminded in a column or matrix on chip. To achieve more perplexing activities, logic units can be naturally associated with other logic components on the chip, through a programmable interconnection network likewise contained in FPGA.
Demosaicing is the process of renovating the lost color channels of a pixel in the color-filtered image. Many demosaicing algorithms are developed based on image quality and computational complexity. Implementation of image demosaicing using interpolation methods suggestively performs the present image demosaicing methods in several computer vision algorithms.
A demosaicing (sometimes de-mosaicing, demosaicking, or debayering) algorithm is a digital image reconstruction technique that uses incomplete colour samples generated from an image sensor overlaid with a colour filter array to recreate a full colour image CFA. It’s also known as colour reconstruction or CFA interpolation. There are a variety of image demosaicing techniques available, but they can be divided into six categories as shown in Fig. 2.

Figure 2: Classifications of image demosaicing techniques
Though, Image demosaicing using interpolation is complex, a time-consuming process with high hardware cost. To solve these problems, a novel Gregory-Newton interpolation is proposed to reconstruct the image without any loss. The FPGA based Newton Gregory interpolation is described in this section. The main objective of proposed methodology is to reconstruct the image using combination of Red-Green-Blue Color Filter Array (RGBCFA) and Gregory-Newton interpolation method. Newton- Gregory interpolation technique produces the full resolution of green channel with red and blue channels. The proposed system consists of two parts such a sensor captures Bayer image using Color Filter Array (CFA), and demosaicing using Newton Gregory interpolation. The overall diagram of the proposed image demosaicing using RGBCFA Gregory-Newton interpolation is given in Fig. 3.

Figure 3: Overall diagram of image demosaicing using RGBCFA Newton Gregory interpolation
4 Interpolation of Green Channel Using Gregory Newton Interpolation
The main step in the planned demosaicing approach is the interpolation of green channel. In this proposed work the interpolation of Green Channel is calculated using Gregory Newton interpolation method which is implemented on FPGA.
The block diagram representation of proposed Newton-Gregory interpolation-based FPGA design is given in Fig. 4.

Figure 4: FPGA block diagram of Newton-Gregory interpolation
The block diagram of Newton-Gregory interpolation technique-based image demosaicing is shown in Fig. 4. The system consists of accumulator, memory address generator, row/column address generator, weight updater, register and Newton-Gregory forward interpolator and Newton-Gregory backward interpolator. Newton-Gregory interpolation is a two-dimensional interpolation technique, which is a combination of two one dimensional interpolation such as forward interpolation and backward interpolation. For implementation, Newton-Gregory interpolation is requiring 16 adjacent pixels for obtaining every interpolated pixel. Based on these 16 adjacent pixels of an original image, the weighting factors are updated which is difficult to implement in extended linear interpolation. To ease the implementation and reduce the computational complexity, the weighting factors are updated with the help of an accumulator which is used to store the intermediate values for every iteration of the input image. The accumulated output is exploited to generate the row/column address which is suitable for generating the memory address. The data from memory is interpolated forwardly and stored in a register. The interpolated data from register is again interpolated backwardly to obtain the interpolated pixel. The step-by-step process of image demosaicing process is explained below.
4.1 Computation of Coordinate’s Location
In Newton-Gregory interpolation technique, the coordinates of original image are located in the position of (1, 1) in the memory and interpolated pixels are relocated based on the coordinates which are scaled at (1/2SR, 1/2SR) where SR denotes the scaling ratio of coordinates. Coordinates of an original image, interpolated coordinates of an image and its mapping technique is exposed in Fig. 5.

Figure 5: Process of computing coordinates location (a) Coordinates of an original image (b) Interpolated coordinates (c) Mapping of original coordinates into interpolated coordinates
The determination of next interpolated coordinates can be done by scaling the time interval which is 1/SR in any one of the directions x/y and these are computed in row wise. The position of ath interpolated pixel in x direction and bth interpolated pixel in y direction is as given in Eqs. (1) and (2).
4.2 Generation of Row/Column Address
After obtaining the position of an interpolated pixel (xa, yb), the row address (row_addr) is computed based on yb of the interpolated pixel. The row address of an original pixel (Ak, l) is computed based on Eq. (3).
The neighbors of row_addrk such as row_addrk + 1, row_addrk + 2 and row_addrk + 3 are computed by adding C as a constant given in Eq. (4)
where C = 1, 2 and 3. The same procedure is repeated to compute the column address (col_addrl, col_addrl + 1, col_addrl + 2 and col_addrl + 3) as given in Eqs. (5) and (6).
The architecture of row/column address generator is shown in Fig. 6. F/B is used as a control signal for generating row address and column address. If F/B is set as ‘1’, forward interpolation is enabled and it generates row address, distance between the horizontal coordinates. If F/B is set as ‘0’, backward interpolation is enabled to generate column address and distance between vertical coordinates.

Figure 6: Architecture of row/column address generator
4.3 Computation of Weighting Factors
The weighting factor updating is simplified by computing the distance in vertical direction (wv) and horizontal direction (wh) as given in Eqs. (7) and (8).
Vertical weighting coefficients are denoted by vwk, vwk + 1, vwk + 2, vwk + 3 for its corresponding pixels Ak, l, Ak + 1, l, Ak + 2, l, Ak + 3, l explained in Eq. (9) to Eq. (12). The distance between the virtual pixel and original pixel is denoted as wv.
Similarly, the horizontal weighting coefficients are computed by the Eq. (13) to Eq. (16).
After the weight updating is completed, forward interpolation is carried out. The forward interpolation is calculated using row wise. The forward interpolation process is given in Fig. 7. VPl, VPl + 1, VPl + 2, VPl + 3 are virtual pixels that can be computed from the original pixels. These are exploited to determine the interpolated pixel (IP) which is surrounded by 4 × 4 adjacent pixels.

Figure 7: Forward interpolation
After the weight updating is completed, backward interpolation is carried out. The backward interpolation is calculated using column wise. The backward interpolation process is given in Fig. 8.

Figure 8: Backward interpolation
After the process, finally the interpolated pixel is obtained. This process is repeated for all the pixels present in the input image captured by CFA. Finally, the interpolated green channel is obtained.
4.6 Interpolation of Red and Blue Channel
After calculating full resolution of green channel (G), calculate full resolution of blue and red channels for reconstructing the Bayer pattern into color image. To calculate full resolution of blue and red channels, utilize bilinear interpolation. Fig. 9 shows the color difference interpolation used for reconstructing missing R signals.

Figure 9: Color difference interpolation used for reconstructing missing red signals
In bilinear interpolation the missing B and R signals are computed by the average of their corresponding two adjacent signals. Instead of using B and R images directly, the color differences are employed using the interpolated G channel. The same steps in Fig. 9 can be repeated for reconstructing missing B signals. As the color differences are used for reconstructing B and R signals, the functioning of demosaicing approach mainly based on the interpolation of G channel.
For experimental analysis, two types of dataset are utilized such as Kodak and UPOL dataset. The description of both datasets is explained in this section.
The Kodak database contains 24 pictures, these are films caught and afterward digitized at the resolution of 512 × 768 pixels with 8-bit depth per color module. The ubiquity of Kodak picture database is chiefly because of the way that database covers normal genuine scenes and differs in unpredictability and shading attendances.
The UPOL data base contains iris picture. For experimentation, in the proposed work 10 pictures are used. The irises were examined by TOPCON TRC50IA (Tunnel Oxide Passivated Contact) optical gadget associated with SONY DXC-950P 3CCD (SONY Digital cross connect system) camera. The pictures are 24 bit, RGB (Red Green Blue), 576 × 768 pixels and it is PNG (Portable Network Graphics) record design.
5 Experimental Results and Discussion
Experimental results obtained from proposed image demosaicing are explained in this section. Initially the image is captured using RGB CFA sensor and then the image is given to the Newton Gregory interpolation method. In this chapter, Newton Gregory interpolation is implemented using FPGA. Figs. 10 and 11 show the output images of bilinear interpolation, green plane interpolation, Residual interpolation, Local directional interpolation, convolution interpolation and proposed Newton Gregory interpolation of Kodak and UPOL database image implemented on the FPGA architecture.

Figure 10: Output outcomes of (a) Input image, (b) Bilinear interpolation, (c) Green plane interpolation, (d) Residual interpolation, (e) Local directional interpolation (f) Convolution interpolation and (g) Proposed Newton Gregory interpolation for Kodak database image

Figure 11: Output outcomes of (a) Input image, (b) Bilinear interpolation, (c) Green plane interpolation, (d) Residual interpolation, (e) Local directional interpolation, (f) Convolution interpolation and (g) Proposed Newton Gregory interpolation for UPOL database image
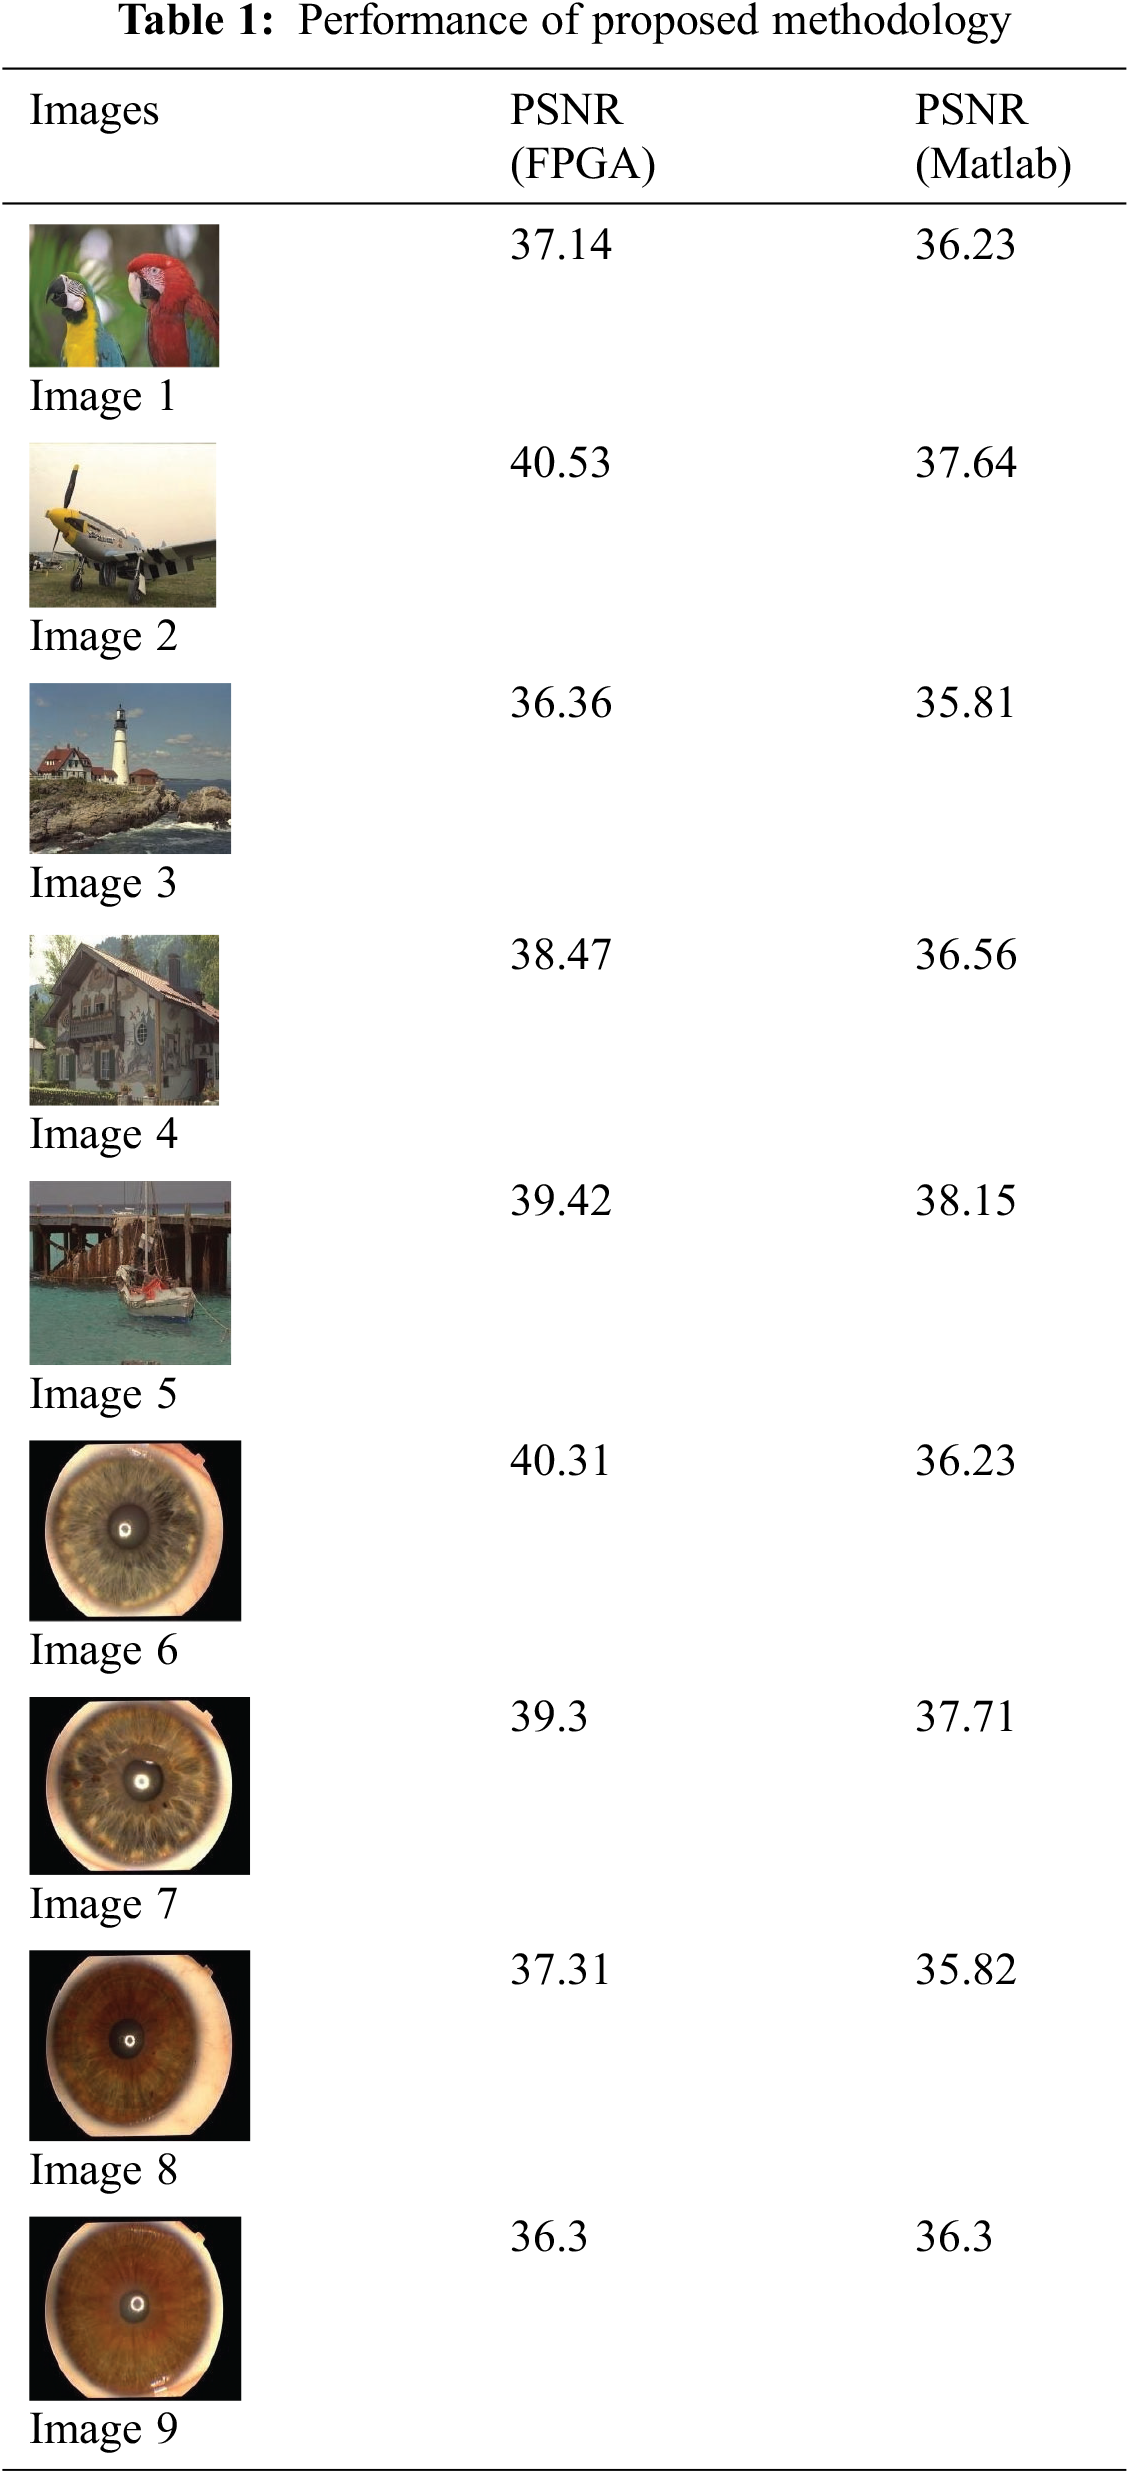
Tab. 1 shows the Performance of proposed methodology based on PSNR measure. In this chapter, the proposed work is implemented using FPGA. For comparison, the proposed Newton interpolation-based image demosaicing implemented with MATLAB also. The performance of both MATLAB and FPGA are given in Tab. 1. Basically, implementing image processing on hardware reduces the cost and makes simpler for debugging and verification. When analyzing Tab. 1, FPGA implementation attains the maximum PSNR of 40.53 dB and MATLAB implementation attains the maximum PSNR of 38.15 dB (Decibel). In Fig. 12, the overall performance of FPGA and MATLAB implementation is analyzed. The FPGA implementation attains the average PSNR of performance of 38.8 dB and MATLAB implementation attains 36.71 dB and the comparison of resource utilization and computation time is shown Fig. 13.

Figure 12: Average PSNR for FPGA vs. MATLAB implementation

Figure 13: Comparison results of resource utilization
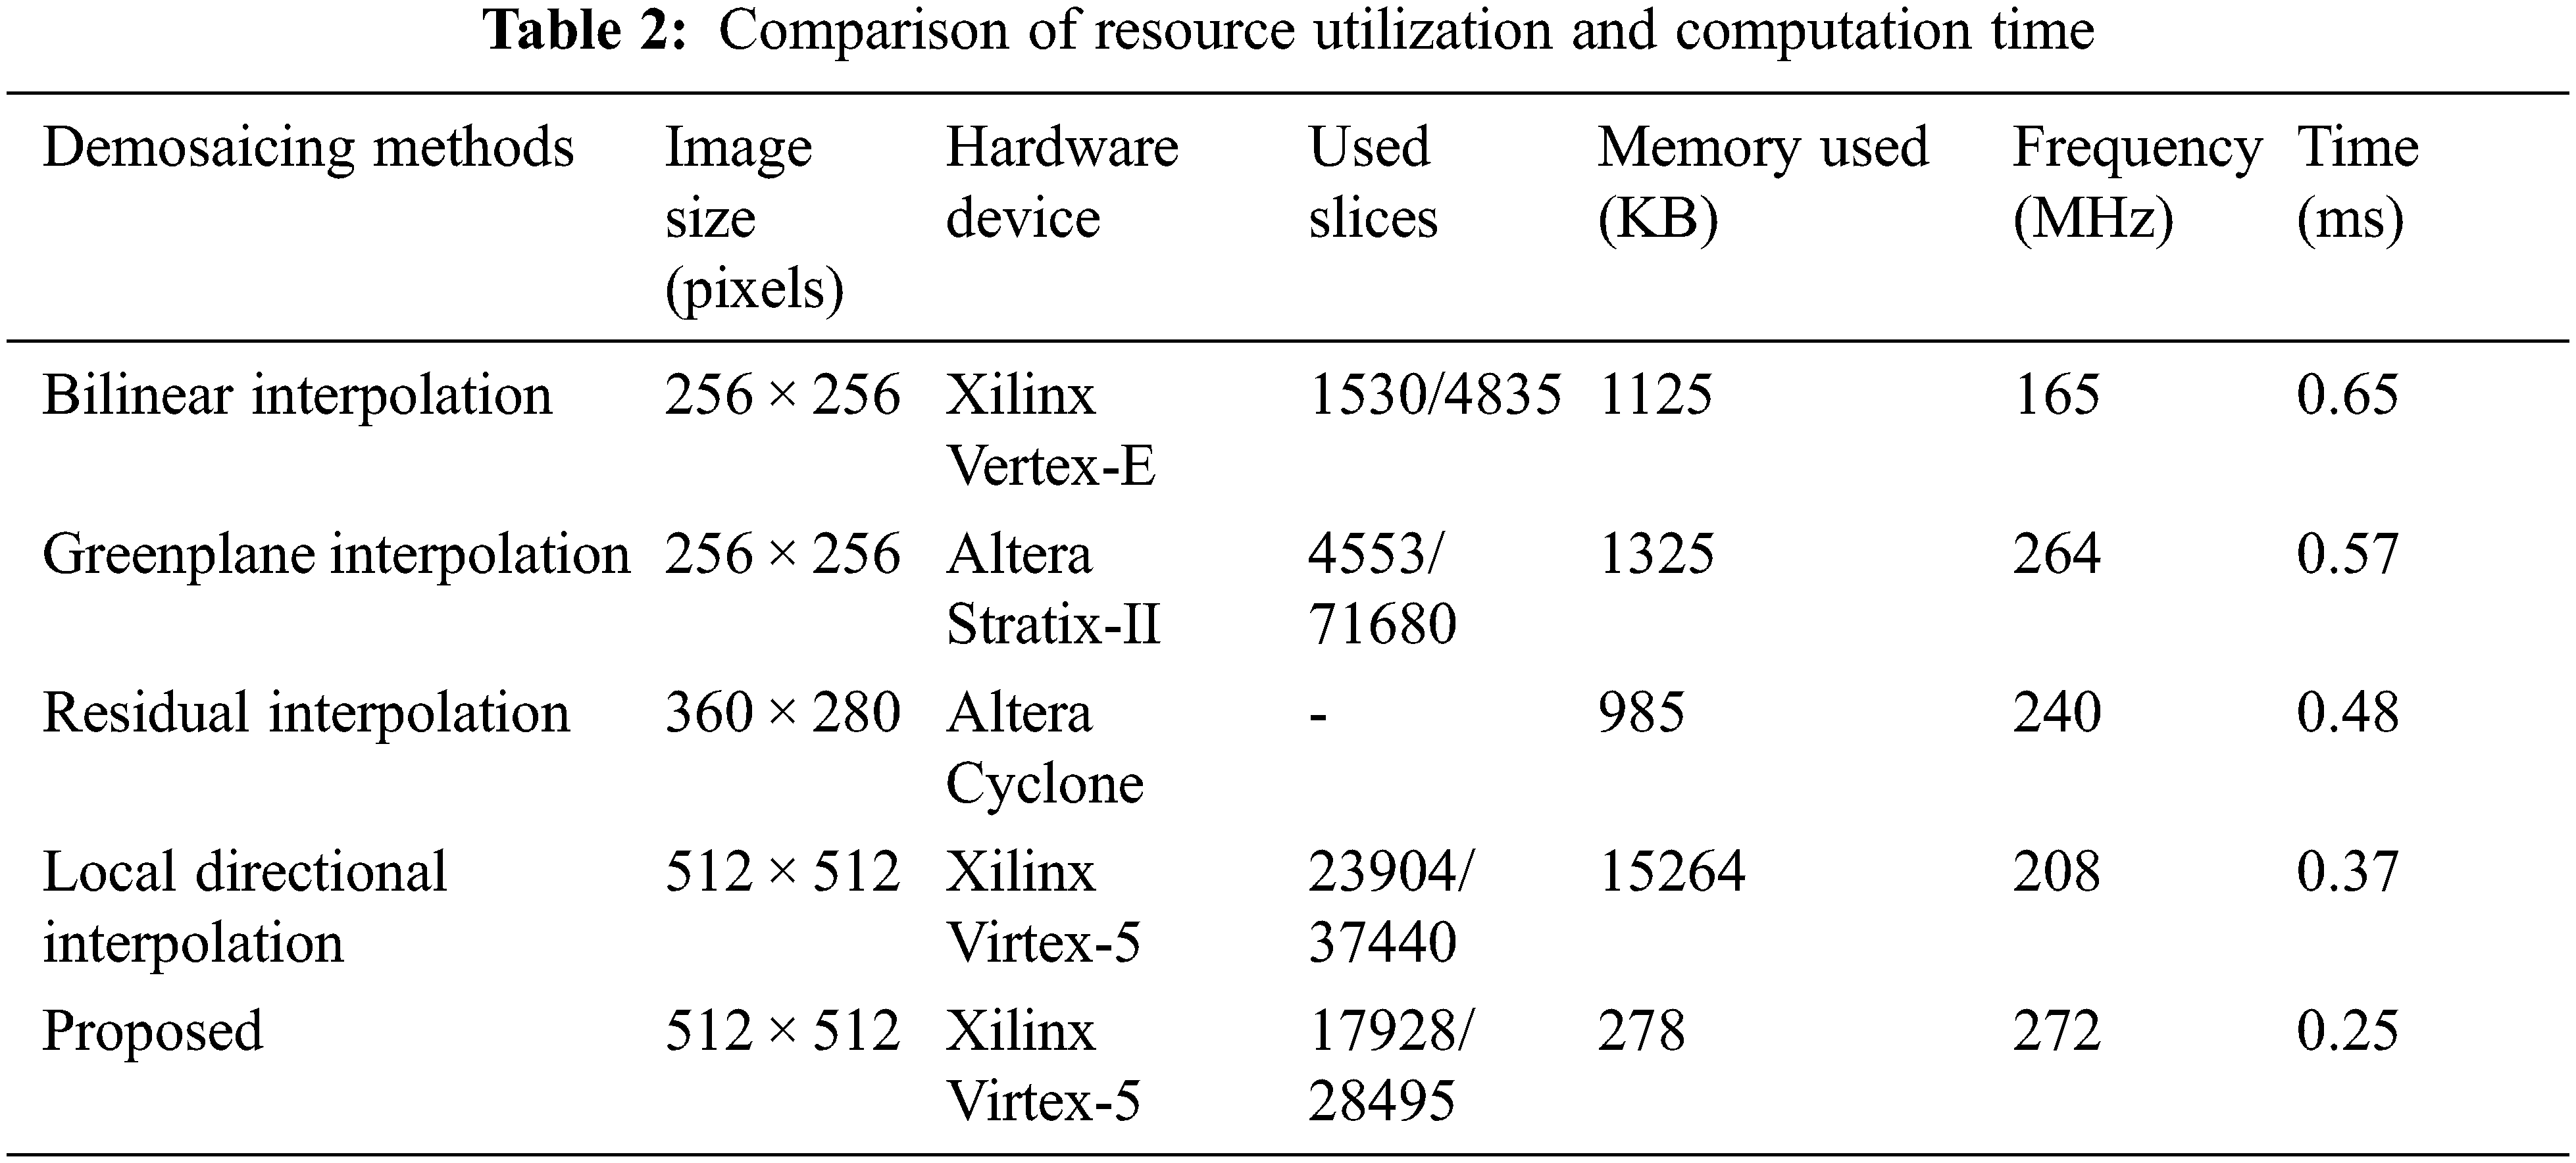
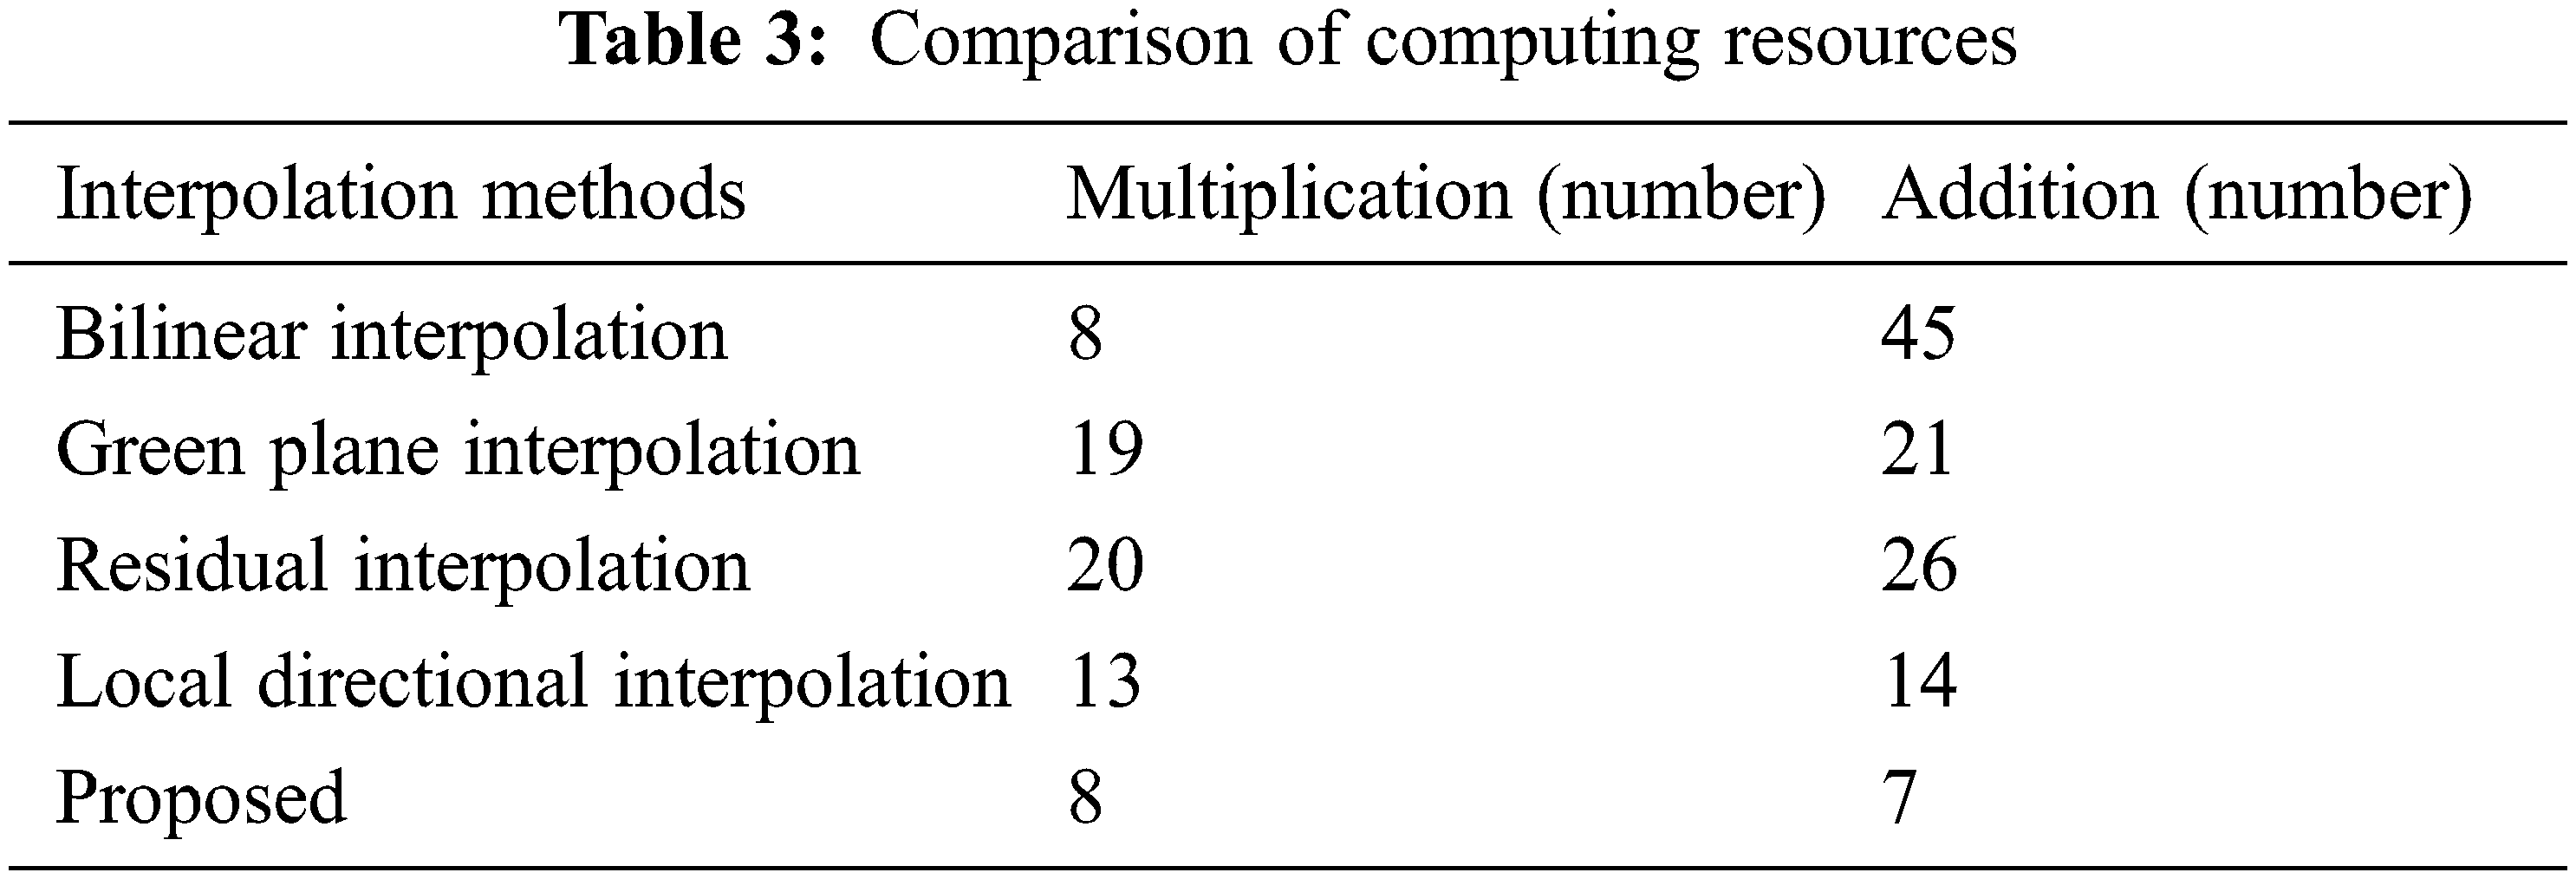
The performance comparison of proposed image demosaicing algorithm with other demosaicing FPGA implementations is presented in Tab. 2. Although, the bilinear interpolation is implemented on a 256 × 256-pixel image, it processes a smaller number of pixels by utilizing more hardware and takes more time (0.65 ms) to demosaiced image compared with proposed algorithm. Compare to the other entire algorithm proposed method takes minimum time to complete the process. Tab. 3 describes that the number of arithmetic elements such as multiplication and addition are used for various interpolation techniques. The computation complexity of proposed VLSI (Very large-scale integration) circuit is mainly affected by arithmetic element. The large number of arithmetic elements may increase the complexity of the interpolations. From Tab. 3, the proposed demosaicing method utilized minimum number of multiplication and addition is compared to other interpolation methods. This will decrease the complexity of process.
The Peak Signal to Noise Ratio (PSNR) values shown in Tab. 4 and MSE value is given in Tab. 5. The PSNR is obtained by the differences of gray levels between the original image and demosaiced image for each channel and combining all channels, PSNR is obtained. Moreover, MSE value is also calculated. From the results, it’s clearly understood the proposed approach attains better result when compared to other algorithms.
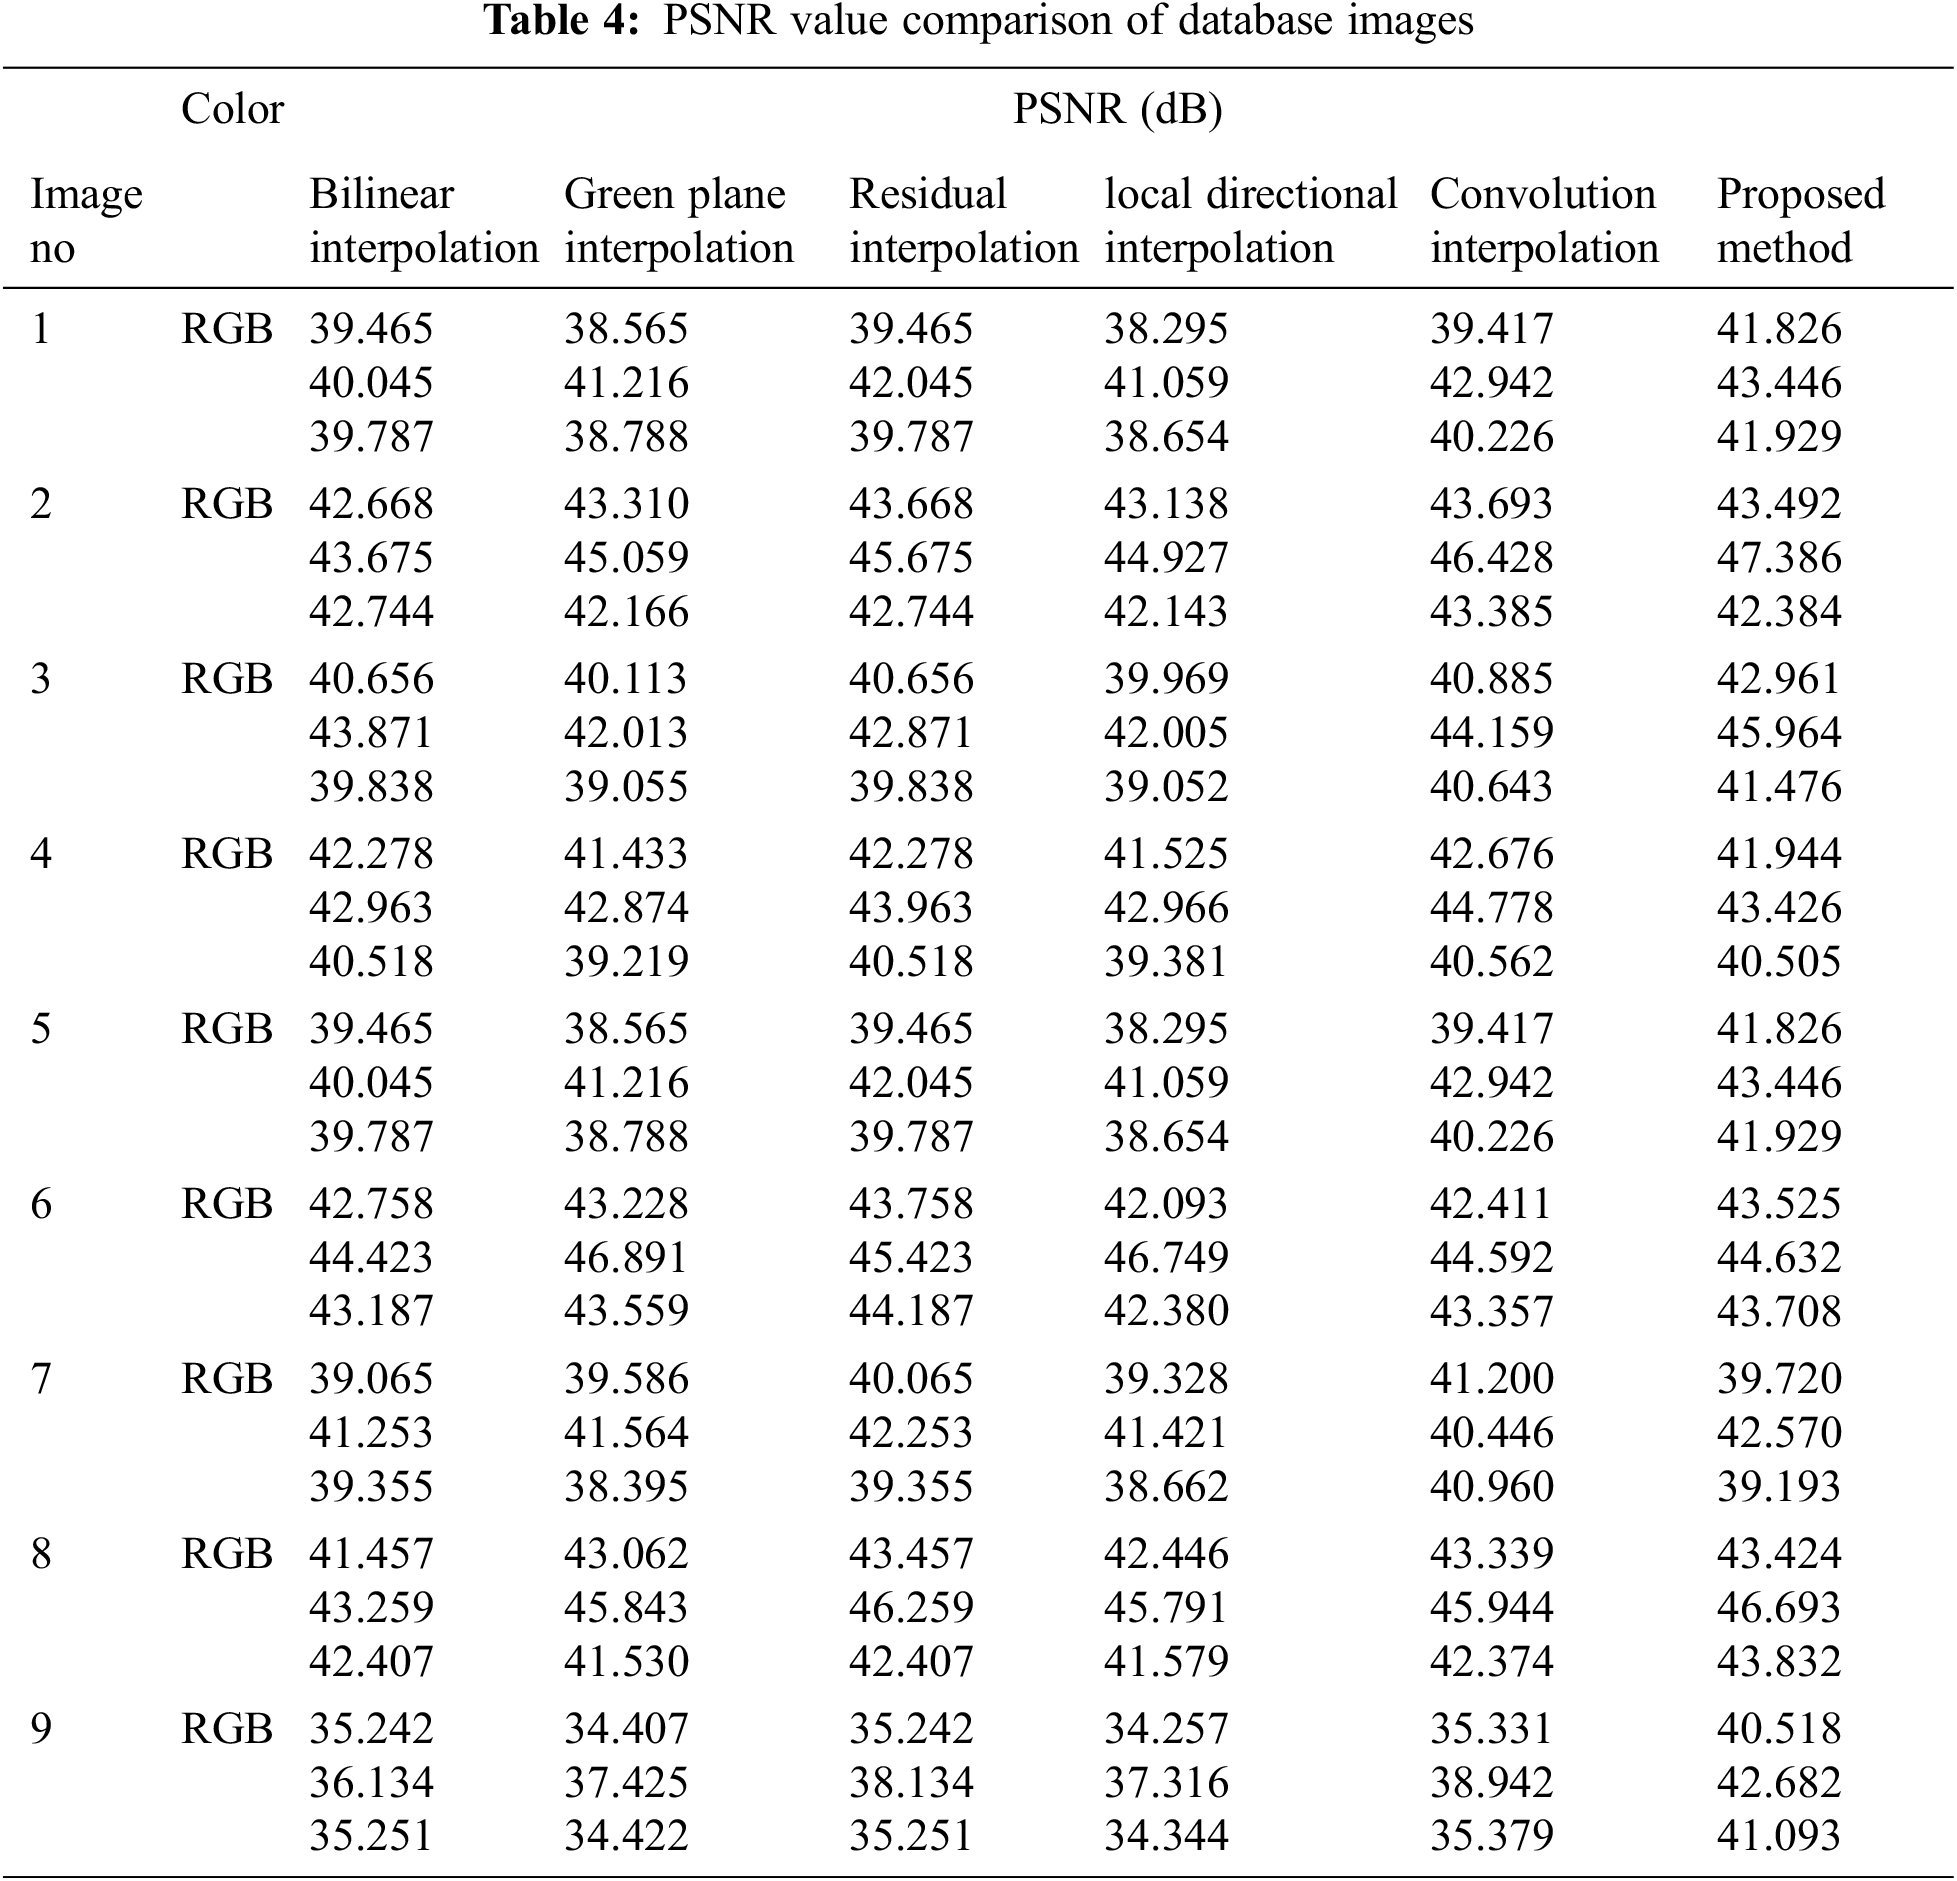
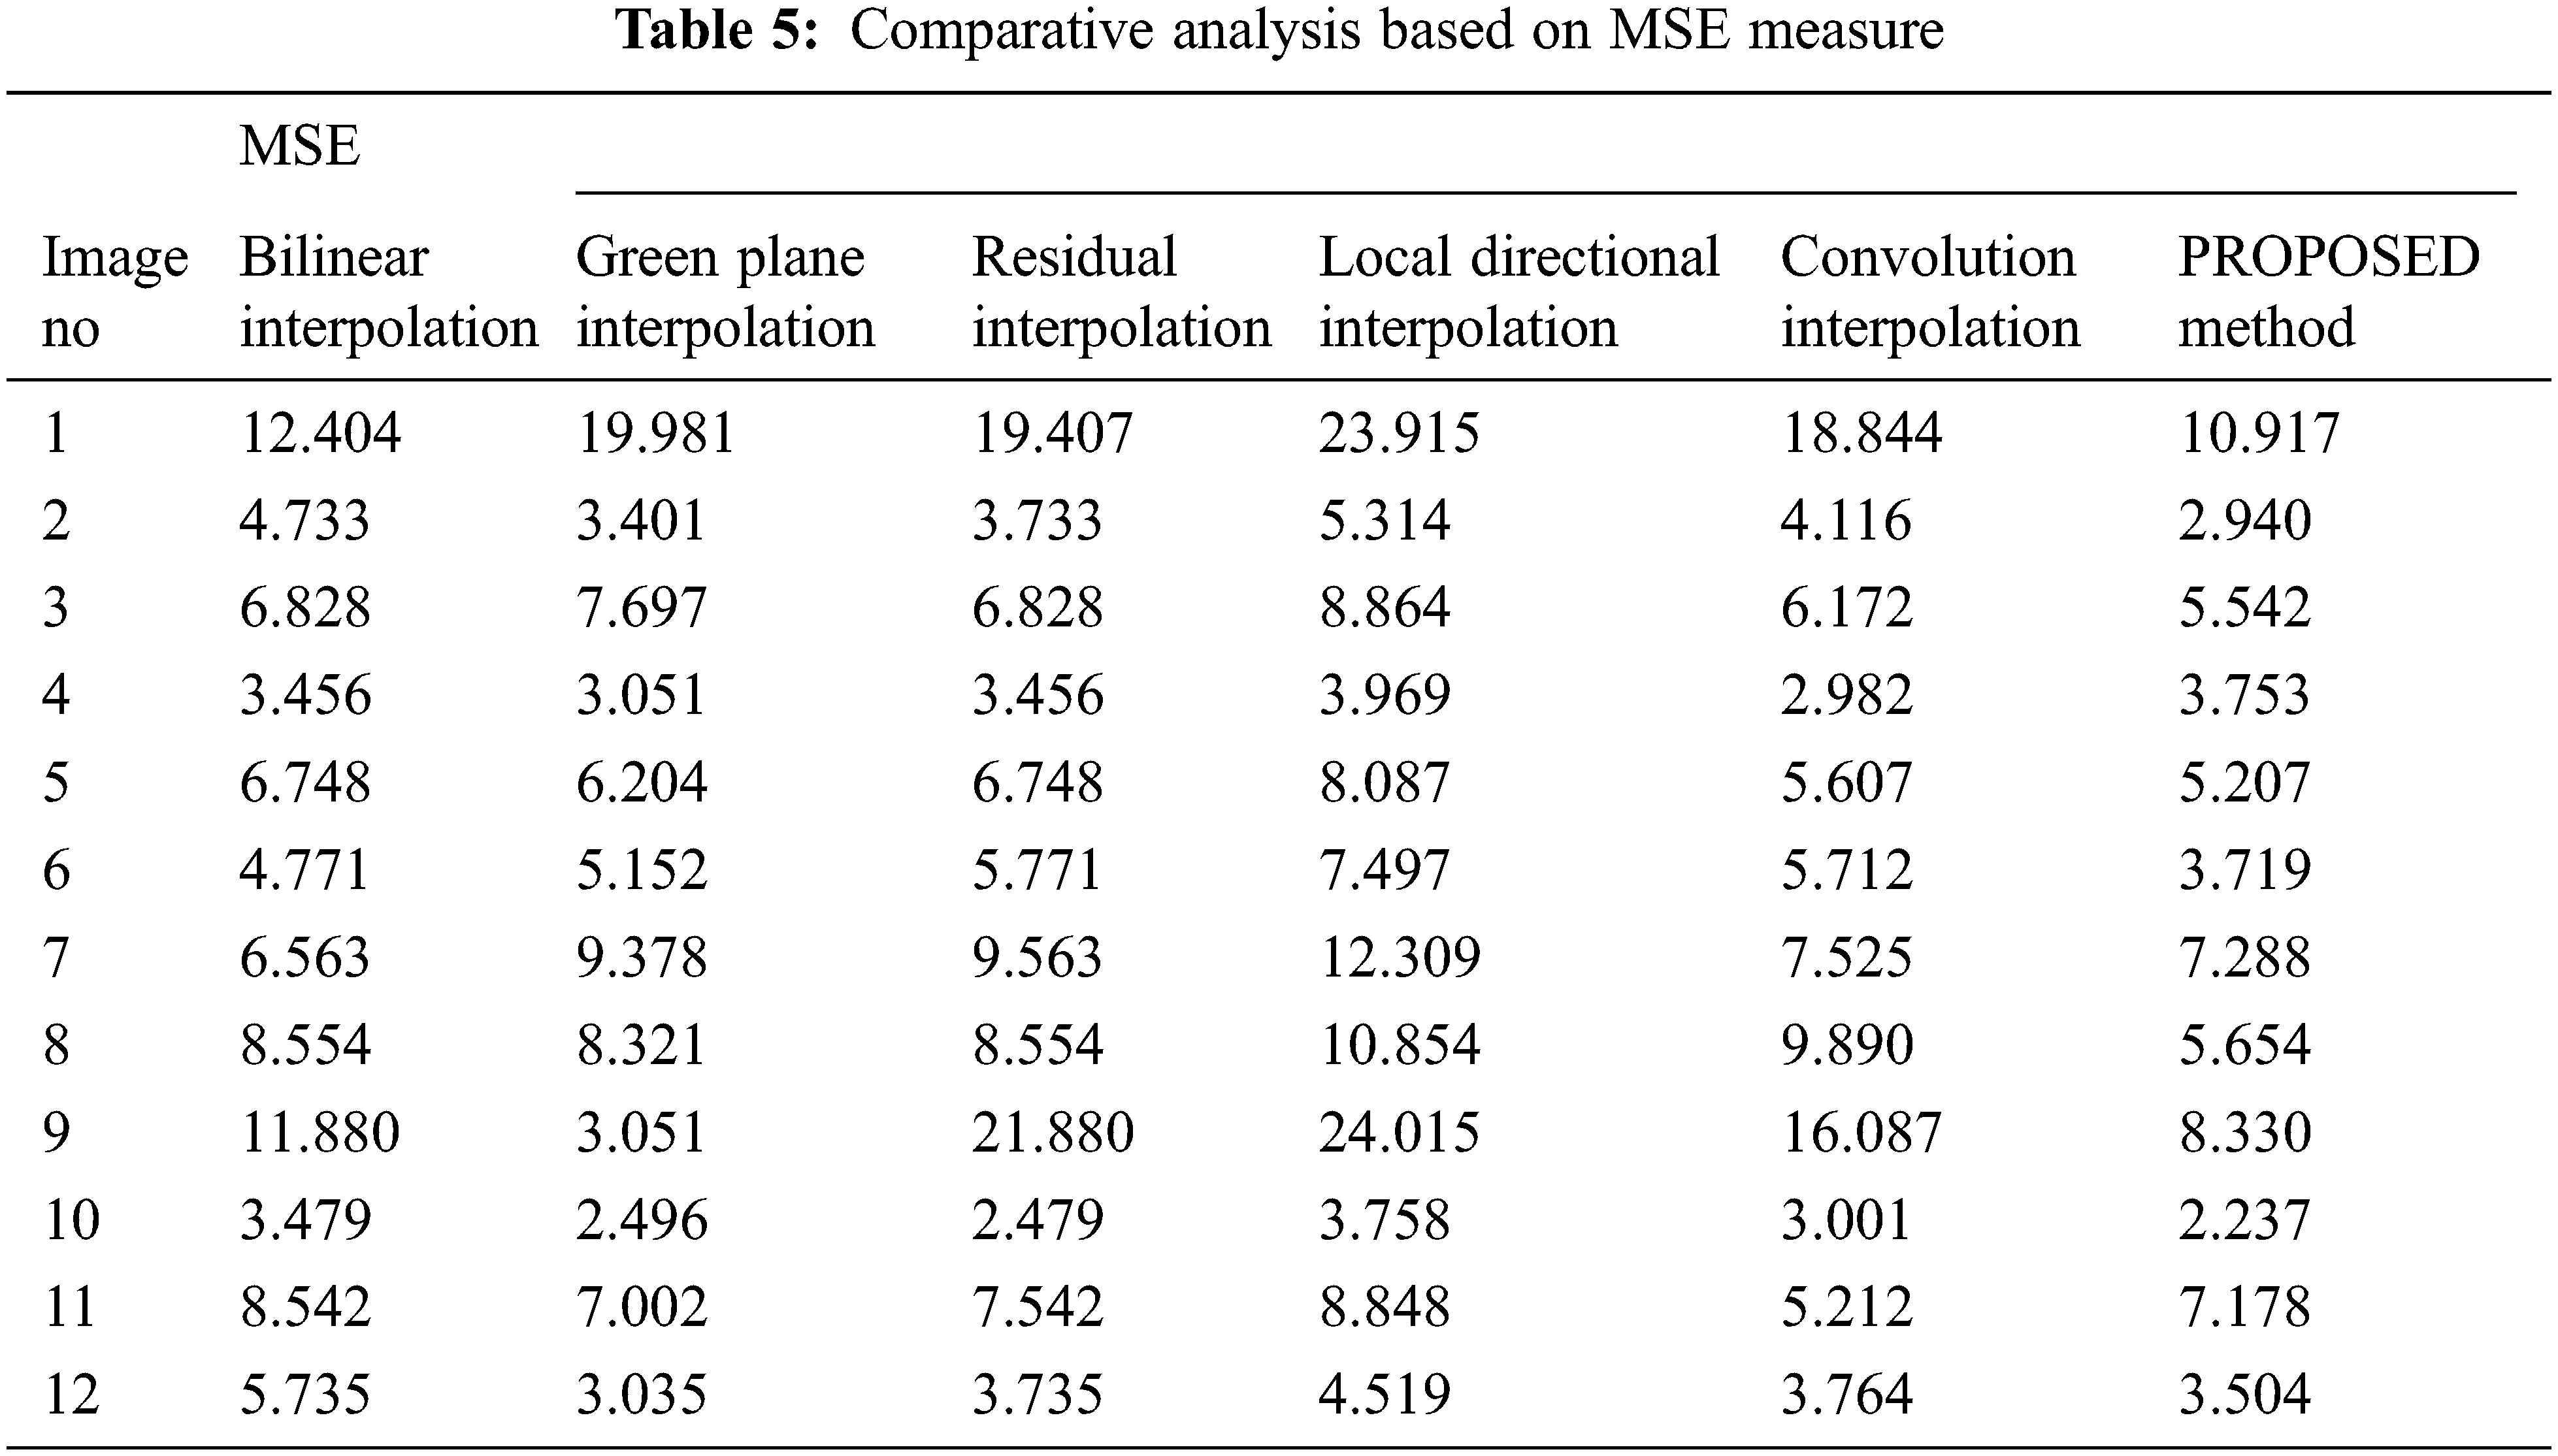
Fig. 14 shows the frequency of different interpolation methods. When analyzing Fig. 14, PLCI (Physical Link Connection Identifier) and edge-oriented interpolation methods utilize the minimum frequency. All the other methods are utilized in similar range of frequency between 260 and 270 MHz (megahertz)

Figure 14: Frequency (MHz) of different interpolation methods
An efficient image demosaicing using Newton Gregory interpolation in FPGA implementation is explained in this chapter. Implementing image processing on hardware reduces the cost and makes simpler for debugging and verification. The Newton interpolation with FPGA framework was implemented and the mathematical expressions are derived. To verify the efficiency of the proposed technique, the operation of planned system is equated with existing interpolation algorithms. The overall performance of FPGA and MATLAB implementation is analyzed. The FPGA implementation attains the average PSNR of performance of 38.8 dB and MATLAB implementation attains 36.71 dB. This technique was done for both natural and medical images and experimental results carried out for FPGA and MATLAB.
Acknowledgement: The authors would like to thank Anna University and also, we like to thank Anonymous reviewers for their so-called insights.
Funding Statement: The authors received no specific funding for this study.
Conflicts of Interest: The authors declare that they have no conflicts of interest to report regarding the present study.
1. A. Maalouf, M. C. Larabi and S. Süsstrunk, “An efficient demosaicing technique using geometrical information,” in Proc. IEEE Int. Conf. on Image Processing, Orlando, FL, USA, pp. 2789–2792, 2012. [Google Scholar]
2. J. E. Adams, “Design of practical color filter array interpolation algorithms for digital cameras. 2,” in Proc. Int. Conf. on Image Processing, Chicago, IL, USA, pp. 488–492, 1998. [Google Scholar]
3. A. B. Abrams, J. M. Hillis and D. H. Brainard, “The relation between color discrimination and color constancy: When is optimal adaptation task dependent,” Neural Computation, vol. 19, no. 10, pp. 2610–2637, 2007. [Google Scholar]
4. D. Alleysson, S. Susstrunk and J. Hérault, “Linear demosaicing inspired by the human visual system,” IEEE Transactions on Image Processing, vol. 14, no. 4, pp. 439–449, 2005. [Google Scholar]
5. A. Criminisi, P. Perez and K. Toyama, “Region filling and object removal by exemplar-based image inpainting,” IEEE Transactions on Image Processing, vol. 13, no. 9, pp. 1200–1212, 2004. [Google Scholar]
6. B. K. Gunturk, Y. Altunbasak and R. M. Mersereau, “Color plane interpolation using alternating projections,” IEEE Transactions on Image Processing, vol. 11, no. 9, pp. 997–1013, 2002. [Google Scholar]
7. A. Nithya, A. Appathurai, N. Venkatadri, D. R. Ramji and C. A. Palagan, “Kidney disease detection and segmentation using artificial neural network and multi-kernel k-means clustering for ultrasound images,” Measurement, vol. 149, pp. 106952, 2020. [Google Scholar]
8. R. Rubin and A. D. Hon, “Design of FPGA interconnect for multilevel metallization,” in Proc. Association of Computer Machinery/Special Interest Group on Design Automation, New York, NY, USA, pp. 154–163, 2003. [Google Scholar]
9. A. Majumdar, “FPGA implementation of integer linear programming accelerator,” in Proc. Int. Conf. on Systematic Cybernet and Informatics, Florida, USA, pp. 1–11, 2006. [Google Scholar]
10. A. Appathurai and P. Deepa, “Design for reliablity: A novel counter matrix code for FPGA based quality applications,” in Proc. Asian Symp. on Quality Electronics Devices, Kula Lumpur, Malaysia, pp. 56–61, 2015. [Google Scholar]
11. A. Upegui, R. Moeckel, E. Dittrich, A. Ijspeert and E. Sanchez, “An FPGA dynamically reconfigurable framework for modular robotics,” in Proc. Int. Conf. on Architectural Computation and Systems, Verlag, Berlin, pp. 1–7, 2005. [Google Scholar]
12. A. Tumeo, M. Monchiero, G. Palermo, F. Ferrandi and D. Sciuto, “A design kit for a fully working shared memory multiprocessor on FPGA,” in Proc. ACM Great Lakes Symp. on VLSI, New York, NY, USA, pp. 219–222, 2007. [Google Scholar]
13. A. Appathurai, G. Manogaran and N. Chilamkurti, “Trusted FPGA-based transport traffic injects, impersonate (i 2) attacks beaconing in the internet of vehicles,” Institution of Engineering and Technology Networks, vol. 8, no. 3, pp. 169–178, 2015. [Google Scholar]
14. A. M. Lienhardt, G. Gateau and T. A. Meynard, “Digital sliding-mode observer implementation using FPGA,” IEEE Transactions on Industrial Electronics, vol. 54, no. 4, pp. 1865–1875, 2007. [Google Scholar]
15. P. Verma, D. E. Meyer, H. Xu and F. Kuester, “Splatty- A unified image demosaicing and rectification method,” in Proc. IEEE/CVF Winter Conf. on Applications of Computer Vision, Waikoloa, HI, USA, pp. 786–795, 2021. [Google Scholar]
16. I. Kim, S. Song, S. Chang, S. Lim and K. Guo, “Deep image demosaicing for submicron image sensors,” Electronic Imaging, vol. 63, no. 6, pp. 60410–60411, 2020. [Google Scholar]
17. J. Luo and J. Wang, “Image demosaicing based on generative adversarial network,” Mathematical Problems in Engineering, vol. 2020, no. 1, pp. 1–13, 2020. [Google Scholar]
18. D. R. Ramji, C. A. Palagan, A. Nithya, A. Appathurai and E. J. Alex, “Soft computing based color image demosaicing for medical image processing,” Multimedia Tools and Applications, vol. 79, no. 15, pp. 10047–10063, 2020. [Google Scholar]
19. J. Khalifat, A. Ebrahim and T. Arslan, “An efficient implementation of the Adams-Hamilton’s demosaicing algorithm in FPGAs,” in Proc. Int. Symp. on Applied Reconfigurable Computing, Springer, Cham, pp. 205–212, 2014. [Google Scholar]
 | This work is licensed under a Creative Commons Attribution 4.0 International License, which permits unrestricted use, distribution, and reproduction in any medium, provided the original work is properly cited. |