DOI:10.32604/iasc.2022.024539
| Intelligent Automation & Soft Computing DOI:10.32604/iasc.2022.024539 | |
| Article |
Shrinkage Linear with Quadratic Gaussian Discriminant Analysis for Big Data Classification
1Department of Computer Science and Engineering, Kongu Engineering College, Erode, 638060, Tamilnadu, India
2Department of Applied Cybernetics, Faculty of Science, University of Hradec Králové, Hradec Králové, 50003, Czech Republic
3Department of Information Technology, College of Computers and Information Technology, Taif University, Taif, 21944, Saudi Arabia
4Department of Mathematics, Faculty of Science, Mansoura University, Mansoura, 35516, Egypt
5Department of Computational Mathematics, Science, and Engineering (CMSE), Michigan State University, East Lansing, 48824, MI, USA
*Corresponding Author: Mohamed Abouhawwash. Email: abouhaww@msu.edu
Received: 21 October 2021; Accepted: 05 February 2022
Abstract: Generation of massive data is increasing in big data industries due to the evolution of modern technologies. The big data industries include data source from sensors, Internet of Things, digital and social media. In particular, these big data systems consist of data extraction, preprocessing, integration, analysis, and visualization mechanism. The data encountered from the sources are redundant, incomplete and conflict. Moreover, in real time applications, it is a tedious process for the interpretation of all the data from different sources. In this paper, the gathered data are preprocessed to handle the issues such as redundant, incomplete and conflict. For that, it is proposed to have a generalized dimensionality reduction technique called Shrinkage Linear Discriminate Analysis (SLDA). As a result, the Shrinkage Linear Discriminate Analysis (LDA) will improve the performance of the classifier with generalization. Even though, dimensionality reduction systems improve the performance of the classifier, the irrelevant features get degraded by the performance of the system further. Hence, the relevant and the most important features are selected using Pearson correlation-based feature selection technique which selects the subset of correlated features for improving the performance of the classification system. The selected features are classified using the proposed Quadratic-Gaussian Discriminant Analysis (QGDA) classifier. The proposed evolution techniques are tested with the localization and the cover data sets from machine learning University of California Irvine (UCI) repository. In addition to that, the proposed techniques on datasets are evaluated with the evaluation metrics and compared to the other similar methods which prove the efficiency of the proposed classification system. It has achieved better performance. The acquired accuracy is over 91% for all the experiment on these datasets. Based on the results evaluated in terms of training percentage and mapper, it is meaningful to conclude that the proposed method could be used for big data classification.
Keywords: Dimensionality reduction; shrinkage; LDA; feature selection pearson; gaussian; classification
Huge dataset is difficult to handle using classical database structure such as big data [1]. Big data is a collection of processing a large data volume [2]. It is defined based on data size, inability of processing in some systems due to the demands of primary storage [3,4]. To the year, there are voluminous data processed that directs to the regular data analytics of big data in every organization [5,6]. Handling of big data is a primary challenge because of the frequent gathering of data, storage/memory management, network security, and related issues [7,8]. Due to the creation of large volume of data of 2.5 and above quintillion bytes of data per day, big data classification is essentially needed [9].
The big data is characterized based on volume, veracity and variety associated to it. In order to solve the issue, machine learning and mining algorithms are used. The existing approaches are not dealt with the data size [10–12]. Hence, the knowledge mining of big data needs to be further improved. The classification of big data process [13–15] is handled by variety of classifying techniques like Naïve Bayes [16], Extreme Learning Machine [17] and Support Vector Machine [18]. The computational complexity of big data processing has been increased [19]. The traditional systems are insufficient to address the issues and challenges related to big data [20,21].
Discriminant analyses composed of many techniques are used to solve the classification problems. These are recognized as the model-based machine learning methods [22]. Linear and Quadratic Discriminant Analysis (LDA, QDA) are two familiar supervised classifications in statistical learning. In reality, LDA and QDA usage are not shown with high performances due to covariance and mean of each class. To overcome this, regularized LDA and QDA are used in the form of regularized covariance matrix. However, this solution will not reduce the estimation noise. The theoretical analysis of Regularized Quadratic Discriminant Analysis (R-QDA) is based on the specific limitation where the sample is larger than the dimensions [23].
These limitations will motivate the present work so as to investigate the behavior of discriminant techniques in the classification. The major contributions of the work are as follows:
• Input data are preprocessed with the dimensionality reduction method called LDA with the improvement of shrinkage. This shrinkage LDA will improve the data into low dimensional space for better execution of classification approaches.
• Reduced data are processed using Pearson Correlation based feature selection for the selection of relevant and most important features
• Reduced dimensional data and selected features are classified using proposed Quadratic Gaussian Discriminant classifier.
• Classification algorithm performance is evaluated by evaluation metrics and compared with the existing algorithms.
The organization of paper consists of 5 sections: Section 2 describes the review process of traditional techniques, Section 3 introduces the approaches such as evolutionary techniques, feature selection and deep classification, Section 4 discusses the results of the experiment and Section 5 states the conclusion of the research work.
Following section illustrates the literatures related to big data classification and implemented methods.
Mujeeb et al. [24] analyzed Bayesian algorithm for the classification in the framework of big data. The analyzed Bayesian based classifiers are Correlative in Naïve Bayes as CNB, Cuckoo with Grey wolf CNB as CGCNB, Fuzzy with CNB as FCNB and Holoentropy with CNB as HCNB. In addition to that, CNB was developed with the extension of naïve bayes with correlation concept. The optimization technique called cuckoo search with grey wolf were combined with CNB approach. Therefore, the evaluated result of the study showed that CGCNB had obtained better performance by measuring metrics accuracy, sensitivity, and specificity.
Sleeman et al. [25] proposed echo state network based big data classification algorithm with optimization. With the implementation of multiplier optimization procedure, this method exchanges the data among the nearest elements in the network. The node communication is not necessary in the usage of training samples. Moreover, the dataset required for their experimentation enhances the computation time and accuracy. On the contrary, the major disadvantage of this model is the weights used that depends on the error value. Selvi et al. [26] developed a map reduce framework based big data classifying approach called E-Bat technique. The accuracy of the evaluation was not too high by using the so-called technique.
Bejaoui et al. [27] proposed an imbalanced multi class method for the classification of big data on spark. For solving the big data classification problem, clustering based partitioning of data method such as random forest technique and naïve bayes methods were employed. In the distributed environment, the specific method had secured better predictive power, but time complexity was too high. Bejaoui et al. [27] proposed an optimal selection of feature called firefly with lion assisted model. The method was used as an effective classification model but there was a lack in noisy information. Zhuang et al. [28] proposed a big data classification using deep learning method called adaptive bat algorithm. As a result, the approach had obtained better accuracy, true positive and true negative rate, but there was a lack in security.
2.2 Discriminant Analysis for Big Data Classification
Ghojogh et al. [29] enhanced the Regression-Quadratic Discriminant Analysis with two regularization parameters and changed bias. These properties were used for the enhancement of imbalanced settings of R-QDA to improve the classification performance. Thus, compared to the tradition R-QDA, this enhanced method will be well-suited for both real and synthetic datasets with better accuracy. Reddy et al. [30] proposed a multi correlation approach based on Quadratic Discriminant Analysis (QDA), which had utilised the correlative classification in a supervised learning model. It was observed that the particular approach can effectively measure the Beidou B1C data signals. With the experimental analysis with multi correlates method, QDA based monitoring of signal quality displayed good performance and moreover, failures were accurately identified.
Nanga et al. [31] had discussed the two discriminant methods called Linear and Quadratic Discriminant Analysis (LDA, QDA) for statistical classification and probabilistic learning. The parameter selection of LDA and QDA was deliberately explained and it was also proved that LDA and Fisher Discriminant Analysis were the same.
Some of the previous studies on algorithms used by various researchers are shown in Tab. 1.

Further, quality optimization in article resource managing using optimization algorithm in [38–40], covid related data extraction and optimization in article [41–52] help to identify the new techniques and the importance of data optimization.
3 Proposed Shrinkage LDA with QGDA Methodology
For processing the high dimensionality of big data, there are numerous data mining and machine learning techniques that are available in the market. Due to the complex nature of big data, the processing such as big data is still a challenge. Preprocessing plays a vital role in processing these huge datasets in order to reduce the dataset for further effective processing with high accuracy. In this regard, irrelevant, missing raw data are handled in preprocessing stage and the collected data are transformed to low dimensional space through dimensionality reduction techniques. Initially, the data set is separated into test and training data based on k-fold validation. The overview of proposed technique is given in Fig. 1. It includes three phases; Dimensionality Reduction using Shrinkage LDA, Feature Selection using Pearson Correlation and Classification using proposed Quadratic-Gaussian Discriminant Analysis (QGDA).

Figure 1: Overview of proposed methodology
3.1 Dimensionality Reduction Using Novel Shrinkage LDA
Big dataset consumes larger storage. The storage space of these big datasets is compressed and reduced using dimensionality reduction techniques for better execution. This low dimensional space process will fasten the computation, improving accuracy of classification, and information loss is reduced [39,40]. In this proposed work, the high dimensionality data is converted into low dimensionality space using Shrinkage Linear Discriminant Analysis (SLDA). LDA can be used as a supervised dimensionality reduction by projecting the data input into a linear subspace that maximize the separation between the classes. However, this model seeks to find the input variables linear combination that maximizes the sample separation between the classes. For the sake of estimating the probabilities, this model uses the Bayes theorem. For given input (x), the output class (k) is estimated using the probability of each class conditional distribution of the data P(X|y = k). The Bayes rule of each training sample x ∈ Rd as in Eq. (1)
where, fk – estimated probability, Plk-base probability of class (k) which is declared as Eq. (2),
For f(x), Gaussian distribution is used. The Gaussian distribution with the discriminant function is declared as Eq. (3),
where d-number of features. The estimation of the covariance matrices is improved using Shrinkage LDA (SLDA) when training samples are compared to total number of features. The LDA performance is generalized using SLDA. The shrinkage parameter is determined using lemma introduced by Fawzi et al. [38]. The shrinkage parameter manual settings are as Eq. (4)
3.2 Feature Selection Using Pearson Correlation
Pearson Correlation is the relationship between the data in the range of [−1, 1] where positive 1 indicates the positive correlation, 0 indicates no correlation and negative 1 indicates negative correlation of the data. In comparison to the other feature selection machine learning models that remove the features at each step, PCRFE removes the irrelevant data at once. Due to this factor of hybrid approach, it is faster than filter, wrapper and embedded FS methods. The Correlation Coefficient of the features are calculated using the Eq. (5).
where, xi, yi–features for correlation consideration. The value of this falls in the close interval [−1, 1]. The value close to −1 or 1 indicates the strong relationship and 0 indicates weak relationship of the two features. Once the features are correlated, a threshold value is used to rank the features. The features obtain minimum rank will be removed.
3.3 Classification Using Proposed Quadratic Gaussian Discriminant Classifier
Quadratic Discriminant Analysis is a variant of LDA that a covariance matrix for the individual data is estimated for each observation. QDA has been used for the individual classes with various co-variance. Unlike LDA, QDA cannot be used for dimensionality reduction. In this proposed work, the Quadratic Discriminant Analysis is combined with gaussian property to use as a classifier. In QDA, the class measurements are normally distributed and no assumption of the covariance matrix to be identical. The log posterior of the Eq. (3) is written for QDA as Eq. (6)
where C-constant from the gaussian. The class which maximizes the log posterior is the predicted class. Given the training dataset of X with x input variables and respective target variable t, the Gaussian of QDA is normally distributed as Eq. (7)
Where, μ_C-mean vector, Σ_C-covariance matrix. The class posterior is calculated using bayes theorem as Eq. (8)
where,

Figure 2: Quadratic gaussian distribution illustration with predicted classes
The workflow of the proposed discriminant-based classification using proposed QGDA is shown in Fig. 3. From the figure, it is understood that the input data are fed into the dimensionality reduction module to low dimensional space using proposed Shrinkage LDA. This will execute the data in low dimensional space which increases the classification accuracy. Next, the transformed data are then pass onto the feature selection algorithm called Pearson correlation method for relevant features selection. And the selected subset of features with transformed data is moved to classification phase to classify the data points. Therefore, the discriminant-based dimensionality reduction and classification will improve the classification accuracy.

Figure 3: Workflow of proposed discriminant QGDA classification
The following section discusses the experimental results of the proposed discriminant algorithms using python (scikit).
In order to check the efficiency and strength of the proposed algorithm, it was examined with the localization datasets from machine learning UCI repository. For that, the activities such as attiring tags, ankle left and right, belt and chest of five people were recorded and collected. It contained 164860 instances and eight attributes. The tags of localization data were formed for each instance and they were recognized using attributes. For the process of evaluation, cover dataset type was also taken from UCI machine learning repository. The dataset contained 581012 instances with 54 attributes.
4.2 Performance Evaluation Metrics
Five metrics such as sensitivity, accuracy, specificity, time and memory were evaluated to prove the performance of proposed algorithm. Veracity degree was measured by accuracy proportion of true results. The proportion of correctly classified true positives and true negatives were referred as sensitivity and specificity respectively.
where, TP = True Positive, TN = True Negative, FP = False Positive, FN = False Negative. The performance of the proposed algorithm was evaluated in comparison to the existing big data classification algorithms such as Naïve Bayes (NB), Correlated Naïve Bayes (CNB), Fuzzy Naïve Bayes (FNB). After that, the evaluation was analyzed with the metrics in terms of training percentage and mappers size And thus, the mapper size was mentioned as the number of desktops used for the process of execution.
4.3 Analysis of Localization Dataset Using Proposed QGDA Classifier
The analysis of the proposed approach on localization dataset was performed with the training percentages such as 80%, 85% and 90% accordingly. The evaluation consideration of Mapper sizes were 3, 4 and 5. Tab. 2 shows the evaluated results.

Based on the training percentage analysis from Tab. 1, the accuracy of NB classifier for 80% training data is 76.3% while increasing the training percentage, the classifier accuracy also starts increasing. Likewise, all the metrics such as sensitivity, specificity, memory and time get improved while increasing the training percentage of all the classifiers. Among all the contemporary classifiers, the proposed QGDA had obtained improved performance in terms of all the metrics. For mapper size 3 with the training percentage of 90%, the metrics results of accuracy, sensitivity, specificity, memory and time were 88.4%, 91.4%, 92.7%, 26.3 MB and 16.6 s respectively. Similarly, for the mapper size 5 with the training percentage of 90%, the metrics results of accuracy, sensitivity, specificity, memory and time were 88.8%, 91.8%, 93.1%, 26.1 MB and 15.4 s respectively. From the analysis, the proposed QGDA had obtained high performance on all the evaluation metrics. In addition to that, for all the classifiers, while increasing the training percentage, the metrics such as accuracy, sensitivity and specificity were increased and while increasing the mapper size, the memory and execution time got decreased.
4.4 Analysis of Cover Dataset Using Proposed QGDA Classifier
The analysis of the proposed approach on localization dataset was performed with the training percentages such as 80%, 85% and 90%. The evaluation consideration of Mapper sizes were 3, 4 and 5. Tab. 3 shows the evaluated results.

Based on the analysis of Tab. 2, the proposed QGDA had obtained high accuracy for all kind of training percentage and mapper sizes. For training percentage of 90% with mapper size 5, it was observed that QGDA had secured 89.5% of accuracy, 92.5% of sensitivity, 93.8% of specificity, 20.3MB memory and 10.9 s of execution time.
The comparative analysis from Tab. 2 and Tab. 3 of all the classifiers had proved that the increase in the training percentage would certainly increase the performance of overall system in terms of the evaluation metrics. With the same criteria, the increase in the mapper size of all the classifiers would surely decrease the memory and the time of execution. Evaluation results of both datasets such as localization and cover dataset, the proposed QGDA classifiers had improved the performance of the system in terms of accuracy, sensitivity and specificity compared to the other existing algorithms. The proposed QGDA had obtained improved performance due to the highest posterior value selected for the consequential class. Hence the proposed discriminant-based classifier called QGDA is well suited for the classification of big data. Fig. 4 shows the experimented evaluation of two classes of classification with same and different numbers using proposed QDGA classifier.
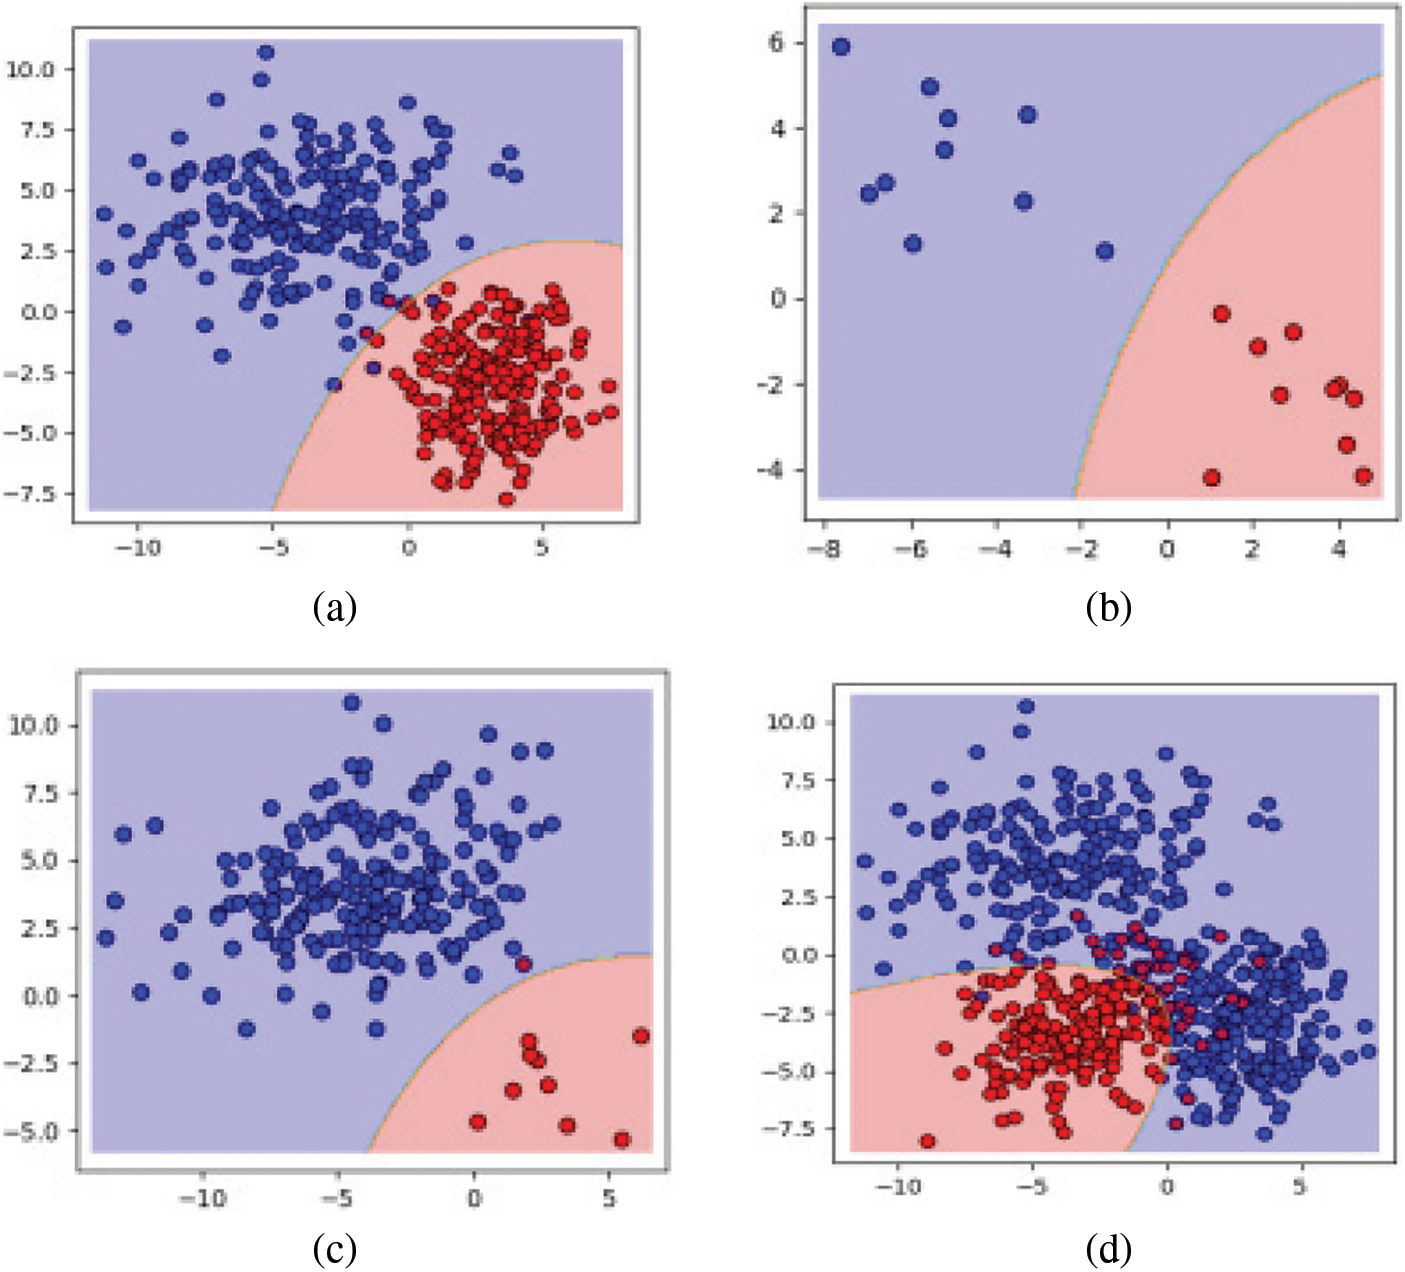
Figure 4: Experiments with two classes using QGDA (a) equal class sample sizes b) small class sample sizes (c) different class sample size (d) multi-modal data with three classes
The proposed paper which pays attention on big data classification based on discriminant technologies was implemented using python sklearn. The initial dataset was transformed to low dimensional space for improving the accuracy of the classification using Shrinkage LDA. Then the proposed approach had used the correlation-based feature selection algorithm called Pearson Correlation in order to select the relevant features for further processing. The proposed classification algorithm based on Gaussian bayes theorem called Quadratic Gaussian Discriminant method had obtained high accuracy on classifying the localization and cover datasets. The proposed algorithm had been evaluated in terms of various training percentages and Mapper's sizes. Similarly, the methods such as NB, CNB and FNB were evaluated and compared to the proposed algorithm. The simulation outcomes had shown the performance of proposed algorithm was high in terms of accuracy, sensitivity and specificity, memory, and execution time as 88.8%, 91.8%, 93.1%, 26.1MB, and 15.4 s respectively for localization dataset. Moreover, it was found that the metrics were 89.5% for accuracy, 92.5% for sensitivity, 93.8% for specificity, 20.3MB for memory and 10.9 s of execution time for cover dataset. Hence, the proposed QGDA is proven to be the best algorithm for big data classification.
Acknowledgement: We would like to give special thanks to Taif University Research supporting Project Number (TURSP-2020/211), Taif University, Taif, Saudi Arabia.
Funding Statement: This work was supported by Taif University Researchers Supporting Projects (TURSP). Under Number (TURSP-2020/211), Taif University, Taif, Saudi Arabia.
Conflicts of Interest: The authors declare that they have no conflicts of interest to report regarding the present study.
1. S. Benabder, N. Mellouli, M. Lamolle and P. Paroubek, “Smart4job: A big data framework for intelligent job offers broadcasting using time series forecasting and semantic classification,” Big Data Research, vol. 7, no. 3, pp. 16–30, 2017. [Google Scholar]
2. V. Marx, “The big challenges of big data,” Nature, vol. 498, no. 7453, pp. 255–260, 2013. [Google Scholar]
3. M. Minelli, M. Chambers and A. Dhiraj, Big Data, big Analytics: Emerging Business Intelligence and Analytic Trends for Today's Businesses, John Wiley & Sons, vol. 578, no. 1, pp. 1–26, 2013. [Google Scholar]
4. G. Pole and P. Gera, “A recent study of emerging tools and technologies boosting big data analytics,” Innovations in Computer Science and Engineering, vol. 413, no. 1, pp. 29–36, 2016. [Google Scholar]
5. W. Lin, Z. Wu, L. Lin, A. Wen and J. Li, “An ensemble random forest algorithm for insurance big data analysis,” IEEE ACCESS, vol. 5, no. 4, pp. 16568–16575, 2017. [Google Scholar]
6. S. S. Patil and S. P. Sonavane, “Enriched oversampling techniques for improving classification of imbalanced big data,” in Proc. BigDataService, Redwood City, USA, pp. 1–10, 2017. [Google Scholar]
7. S. A. Thanekar, K. Subrahmanyam and A. Bagwan, “Big data and mapreduce challenges, opportunities and trends,” International Journal of Electrical & Computer Engineering, vol. 6, no. 6, pp. 2088–8708, 2016. [Google Scholar]
8. R. Raghav, J. Amudhavel and P. Dhavachelvan, “A survey on tools used in big data platform,” Advanced Applied Mathematical Science, vol. 17, no. 1, pp. 213–29, 2017. [Google Scholar]
9. ] X. Wu, X. Zhu, G. Wu and W. Ding, “Data mining with big data,” IEEE Transactions on Knowledge and Data Engineering, vol. 26, no. 1, pp. 97–107, 2013. [Google Scholar]
10. V. López, S. Del Río, J. M. Benítez and F. Herrera, “Costsensitive linguistic fuzzy rule based classification systems under the map reduce framework for imbalanced big data,” Fuzzy Sets and Systems, vol. 258, no. 3, pp. 5–38, 2015. [Google Scholar]
11. V. Sucharita, S. Jyothi and P. V. Rao, “Comparison of machine learning algorithms for classification of penaeid prawn species,” in Proc. 3rd Int. Conf. on Computing for Sustainable Global Development, New Delhi, India, pp. 1610–1613, 2016. [Google Scholar]
12. A. Haque, B. Parker, L. Khan and B. Thuraisingham, “Evolving big data stream classification with mapreduce,” in Proc. 7th Int. Conf. on Cloud Computing, Vancouver,Canada, pp. 570–577, 2015. [Google Scholar]
13. O. Hegazy, S. Safwat and M. E. Bakry, “A mapreduce fuzzy techniques of big data classification,” in Proc. SAI Computing Conf., London, UK, pp. 118–128, 2016. [Google Scholar]
14. G. Santafé, J. A. Lozano and P. Larrañaga, “Bayesian model averaging of naive Bayes for clustering,” IEEE Transactions on Systems, Man, and Cybernetics, Part B (Cybernetics), vol. 36, no. 5, pp. 1149–1161, 2006. [Google Scholar]
15. G. B. Huang, Q. Y. Zhu and C. K. Siew, “Extreme learning machine: Theory and applications,” Neurocomputing, vol. 70, no. 1–3, pp. 489–501, 2006. [Google Scholar]
16. X. Huang, L. Shi and J. A. Suykens, “Support vector machine classifier with pinball loss,” IEEE Transactions on Pattern Analysis and Machine Intelligence, vol. 36, no. 5, pp. 984–997, 2013. [Google Scholar]
17. Á. A. González, A. GonzálezRogel, J. F. DíezPastor and C. LópezNozal, “MR-DIS: Democratic instance selection for big data by Mapreduce,” Progress in Artificial Intelligence, vol. 6, no. 3, pp. 211–219, 2017. [Google Scholar]
18. H. Hu, Y. Wen, T. S. Chua and X. Li, “Toward scalable systems for big data analytics: A technology tutorial,” IEEE Access, vol. 2, no. 12, pp. 652–687, 2014. [Google Scholar]
19. A. Bechini, F. Marcelloni and A. Segatori, “A map reduce solution for associative classification of big data,” Information Sciences, vol. 332, no. 2, pp. 33–55, 2016. [Google Scholar]
20. A. K. Jain, R. P. W. Duin and J. Mao, “Statistical pattern recognition: A review,” IEEE Transactions on Pattern Analysis and Machine Intelligence, vol. 22, no. 1, pp. 4–37, 2000. [Google Scholar]
21. H. R. Farland and D. S. P. Richards, “Exact misclassification probabilities for plug-in normal quadratic discriminant functions: Ii. the heterogeneous case,” Journal of Multivariate Analysis, vol. 82, no. 2, pp. 299–330, 2002. [Google Scholar]
22. C. Banchhor and N. Srinivasu, “Analysis of Bayesian optimization algorithms for big data classification based on map reduce framework,” Journal of Big Data, vol. 8, no. 1, pp. 1–19, 2021. [Google Scholar]
23. S. Scardapane, D. Wang and M. Panella, “A decentralized training algorithm for echo state networks in distributed big data applications,” Neural Networks, vol. 78, no. 3, pp. 65–74, 2016. [Google Scholar]
24. S. M. Mujeeb, R. P. Sam and K. Madhavi, “Adaptive hybrid optimization enabled stack autoencoderbased map reduceframework for big data classification,” in Proc. Int. Conf. on Emerging Trends Information Technology and Engineering, Vellore, India, pp. 1–5, 2020. [Google Scholar]
25. W. C. Sleeman and B. Krawczyk, “Multiclass imbalanced big data classification on spark,” Knowledge-Based Systems, vol. 212, no. 3, pp. 106598, 2021. [Google Scholar]
26. R. S. Selvi and M. L. Valarmathi, “Optimal feature selection for big data classification: Firefly with lionassisted model,” Big Data, vol. 8, no. 2, pp. 125–146, 2020. [Google Scholar]
27. A. Bejaoui, K. Elkhalil, A. Kammoun, M. S. Alouni and T. A. Naffouri, “Improved design of quadratic discriminant analysis classifier in unbalanced settings,” Arxiv Preprint Arxiv:2006.06355, 2020. [Google Scholar]
28. C. Zhuang, H. Zhao, C. Sun and W. Feng, “Detection and classification of gnss signal distortions based on quadratic discriminant analysis,” IEEE Access, vol. 8, no. 4, pp. 25221–25236, 2020. [Google Scholar]
29. B. Ghojogh and M. Crowley, “Linear and quadratic discriminant analysis: Tutorial,” arxiv preprint arxiv:1906.02590, 2019. [Google Scholar]
30. G. T. Reddy, M. P. K. Reddy, K. Lakshmanna, R. Kaluri, D. S. Rajput et al., “Analysis of dimensionality reduction techniques on big data,” IEEE Access, vol. 8, no. 3, pp. 54776–54788, 2020. [Google Scholar]
31. S. Nanga, A. T. Bawah, B. A. Acquaye, M. I. Billa, F. D. Baeta et al., “Review of dimension reduction methods,” Journal of Data Analysis and Information Processing, vol. 9, no. 3, pp. 189–231, 2021. [Google Scholar]
32. L. Fu, “The discriminate analysis and dimension reduction methods of high dimension,” Open Journal of Social Sciences, vol. 3, no. 3, pp. 7, 2015. [Google Scholar]
33. J. T. Vogelstein, E. W. Bridgeford, M. Tang, D. Zheng, C. Douville et al., “Supervised dimensionality reduction for big data,” Nature Communications, vol. 12, no. 1, pp. 1–9, 2021. [Google Scholar]
34. O. Ledoit and M. Wolf, “Honey, I shrunk the sample covariance matrix,” The Journal of Portfolio Management, vol. 30, no. 4, pp. 110–119, 2004. [Google Scholar]
35. L. Mitja, K. Bostjan and P. Rok, Localization Data for Person Activity Data Set. [Online]. 2010. Available: https://archive.ics.uci.edu/ml/datasets/Localization+Data+for+Person+Activity. [Google Scholar]
36. M. Duan, K. Li, X. Liao and K. Li, “A parallel multiclassification algorithm for big data using an extreme learning machine,” IEEE Transactions on Neural Networks and Learning Systems, vol. 29, no. 6, pp. 2337–2351, 2017. [Google Scholar]
37. H. Fawzi, S. A. Mostafa, D. Ahmed, N. Alduais, M. A. Mohammed et al., “TOQO:A new tillage operations quality optimization model based on parallel and dynamic decision support system,” Journal of Cleaner Production, vol. 316, no. 1, pp. 128263, 2021. [Google Scholar]
38. A. A. Mutlag, M. K. Ghani and M. A. Mohammed, “A healthcare resource management optimization framework for ECG biomedical sensors,” Efficient Data Handling for Massive Internet of Medical Things, vol. 12, no. 2, pp. 229–244, 2021. [Google Scholar]
39. S. Maheswaran, P. Kuppusamy, S. Ramesh, T. Sundararajan and P. Yupapin, “Refractive index sensor using dual core photonic crystal fiber–glucose detection applications,” Results Phys, vol. 11, no. 3, pp. 577–578, 2018. [Google Scholar]
40. S. Maheswaran, B. K. Paul, M. A. Khalek, S. Chakma, K. Ahmed et al., “Design of tellurite glass based quasi photonic crystal fiber with high nonlinearity,” Optik, vol. 181, no. 13, pp. 185–190, 2019. [Google Scholar]
41. M. Abdel Basset, N. Moustafa, R. Mohamed, O. Elkomy and M. Abouhawwash, “Multi-objective task scheduling approach for fog computing,” IEEE Access, vol. 9, no. 14, pp. 126988–127009, 2021. [Google Scholar]
42. M. Abouhawwash and A. Alessio, “Multi-objective evolutionary algorithm for PET image reconstruction: Concept,” IEEE Transactions on Medical Imaging, vol. 12, no. 4, pp. 1–10, 2021. [Google Scholar]
43. N. M. Kumar, M. A. Mohammed, K. H. Abdulkareem, R. Damasevicius, S. A. Mostafa et al., “Artificial intelligence based solution for sorting COVID related medical waste streams and supporting data-driven decisions for smart circular economy practice,” Process Safety and Environmental Protection, vol. 152, no. 2, pp. 482–494, 2021. [Google Scholar]
44. M. Abouhawwash, “Hybrid evolutionary multi-objective optimization algorithm for helping multi-criterion decision makers,” International Journal of Management Science and Engineering Management, Taylor& Francis, vol. 16, no. 2, pp. 94–106, 2021. [Google Scholar]
45. H. S. Gill, T. Singh, B. Kaur, G. S. Gaba, M. Masud et al., “A metaheuristic approach to secure multimedia big data for IoT-based smart city applications,” Wireless Communications and Mobile Computing, vol. 2021, no. 3, pp. 1–10, 2021. [Google Scholar]
46. M. Abdel Basset, R. Mohamed, M. Abouhawwash, R. K. Chakrabortty and M. J. Ryan, “EA MSCA: An effective energy-aware multi-objective modified sine-cosine algorithm for real-time task scheduling in multiprocessor systems: Methods and analysis,” Expert Systems with Applications, vol. 173, no. 3, pp. 114699, 2021. [Google Scholar]
47. M. Abdel Basset, D. Elshahat, K. Deb and M. Abouhawwash, “Energy aware whale optimization algorithm for real-time task scheduling in multiprocessor systems,” Applied Soft Computing, vol. 93, no. 2, pp. 106349, 2020. [Google Scholar]
48. P. Singh, M. Masud, M. S. Hossain and A. Kaur, “Blockchain and homomorphic encryption-based privacy-preserving data aggregation model in smart grid,” Computers & Electrical Engineering, vol. 93, no. 4, pp. 1–9, 2021. [Google Scholar]
49. M. Abouhawwash, “Hybrid evolutionary multi objective optimization algorithm for helping multi-criterion decision makers,” International Journal of Management Science and Engineering Management, vol. 16, no. 2, pp. 94–106, 2021. [Google Scholar]
50. M. Abouhawwash and K. Deb, “Reference point based evolutionary multi-objective optimization algorithms with convergence properties using KKTPM and ASF metrics,” Journal of Heuristics, vol. 27, no. 12, pp. 575–614, 2021. [Google Scholar]
51. M. Abouhawwash, K. Deb and A. Alessio. “Exploration of multi-objective optimization with genetic algorithms for PET image reconstruction,” Journal of Nuclear Medicine, vol. 61, no. 4, pp. 572–572, 2020. [Google Scholar]
52. M. Masud, P. Singh, G. S. Gaba, A. Kaur, R. A. Alghamdi et al., “CROWD: Crow search and deep learning based feature extractor for classification of Parkinson's disease,” ACM Transactions on Internet Technology (TOIT), vol. 21, no. 3, pp. 1–18, 2021. [Google Scholar]
 | This work is licensed under a Creative Commons Attribution 4.0 International License, which permits unrestricted use, distribution, and reproduction in any medium, provided the original work is properly cited. |