DOI:10.32604/iasc.2022.025305
| Intelligent Automation & Soft Computing DOI:10.32604/iasc.2022.025305 | |
| Article |
Depression Detection on COVID 19 Tweets Using Chimp Optimization Algorithm
1Department of Computer Science and Engineering, Prathyusha Engineering College, Chennai, 602025, India
2Department of Electronics and Communication Engineering, KCG College of Technology, Chennai, 600097, India
*Corresponding Author: R. Meena. Email: meenarajeswaran@gmail.com
Received: 19 November 2021; Accepted: 09 February 2022
Abstract: The Covid-19 outbreak has an unprecedented effects on people's daily lives throughout the world, causing immense stress amongst individuals owing to enhanced psychological disorders like depression, stress, and anxiety. Researchers have used social media data to detect behaviour changes in individuals with depression, postpartum changes and stress detection since it reveals critical aspects of mental and emotional diseases. Considerable efforts have been made to examine the psychological health of people which have limited performance in accuracy and demand increased training time. To conquer such issues, this paper proposes an efficient depression detection framework named Improved Chimp Optimization Algorithm based Convolution Neural Network–Long Short Term Memory and Natural Language Processing for Covid-19 Twitter data. In the proposed method, the tweets are pre-processed, user's frequent tweet identification, and hash tag identification has been done. The processed tweets are then clustered through cluster head selection using Swap-Displacement-Reversion-Bull based Optimization Algorithm and cluster formation using the Bregman distance-based K-Means algorithm. Then, the psycholinguistic features are extracted from the clustered data and inputted to the Improved Chimp Optimization Algorithm-based-Convolution Neural Network-Long Short Term Memory network for depression classification. Preliminary results show that the proposed method provides greater performance with 97.7% efficiency and outperforms the existing methodologies.
Keywords: Swap-displacement-reversion-bull based optimization algorithm (SDR-BOA); hash tag identification; psychological process; linguistic process; bregman distance based K-means (BD-K-means); improved chimp optimization algorithm based CNN-LSTM (ICHOA–CNN-LSTM)
COVID-19, or the corona virus disease of 2019, is an infectious disease that reportedly discovered in China and has been spreading rapidly across the globe in 2020 [1]. Though the mortality rate of the virus is significantly low, there have been millions of registered deaths all over the world [2]. The COVID-19 disease has been declared a pandemic due to the quick spread of the virus all over the world [3]. To mitigate the rapid spread of COVID-19, many countries have forbidden indoor and outdoor gatherings in excess of particular numbers of people; asked non-essential services, non-profit entities, and retail businesses to close; issued stay-at-home orders for their residents, and advised them to practice social distancing and avoid all non-essential travel abroad [4]. The changes in social behaviour, as well as in working conditions [5], caused substantial changes to people's daily routine and the economic, psychological, and social impact [6]. On the other hand, actions to mitigate the spread of COVID-19, including social distancing, quarantines, and business closures with resulting job losses, are a powerful source of life disruptions and emotional distress [7]. However, many mental symptoms like worry, fear, frustration, depression, and anxiety could occur and cause serious mental health issues to people due to the long-time social activity restriction during the pandemic period [8]. In order to help the governments to make the right decisions, people's general mental status should be understood as a first step [9]. COVID-19 pandemic and the lockdown which followed certainly witnessed a spike in depression and anxiety being diagnosed across the globe [10]. For instance, the World Health Organization has expressed concerns over the mental health and psycho-social consequences of both the pandemic and its preventive policies, as they might increase loneliness, anxiety, and depression, among others [11]. In [12] The internet is the primary means to get in touch with the rest of the world [13] and allows people to self-express [14]. People with depression act differently when they are on social media [15], and they often use social media to talk about their illness and treatment, share information and experiences, seek social support and advice, reduce social isolation, and manage their mental illness [16]. These types of data sources from social media are becoming very important for monitoring a number of public health issues including depression [17]. Twitter, a social media platform, is one of the popular platforms used to conduct social media research about user's opinions, feelings, moods, and social media behaviours [18]. In this paper, an efficient deep learning approach for depression detection COVID-19 Twitter data is proposed.
The remaining of the paper is organized as follows, Section 2 reviews some state-of-the-art approaches developed for depression detection, Section 3 introduces the proposed deep learning approach for depression detection and explains the process of the proposed model, Section 4 presents the comprehensive experiments on the proposed model and the comparative analysis with the existing methods, and finally, Section 5 concludes the paper with future work.
Zhou et al. [19] studied the community depression dynamics due to the COVID-19 pandemic through user-generated content on Twitter and the results found that people became more depressed after the outbreak of COVID-19. The measures implemented by the government, such as the state lockdown, also increased the depression levels. Multimodal features were used and captured depression cues from emotion, topic, and domain-specific perspectives.
Li et al. [20] presented a CorExQ9 algorithm that integrated a Correlation Explanation (CorEx) learning algorithm and clinical Patient Health Questionnaire (PHQ) lexicon to detect COVID-19 related stress. The findings revealed that a rise in COVID-19 patients is directly proportional to people's stress symptoms and fear.
Ghosh et al. [21] aimed to predict depressed users as well as estimate their depression intensity via leveraging social media (Twitter) data in order to aid in raising an alarm. The supervised LSTM analysis revealed that depressed individuals who publish their tweets prefer negative lexicons that are depressive.
Ghosh et al. [22] developed a pipeline, based on recurrent neural networks (in the form of long-short term memory or LSTM) and a convolutional neural network, capable of identifying depressive tweets. The tweets first were preprocessed using a combination of machine learning algorithms in order to derive depressive moods from it.
Viviani et al. [23] aimed at investigating potential lexicon identifiers of vulnerability to psychological distress in digital social interactions with respect to distinct COVID-related scenarios. For this purpose, two approaches based on a “top-down” and a “bottom-up” strategy were adopted. In the top-down approach, three potential scenarios were initially selected by medical experts, and associated with topics extracted from the Twitter dataset in a hybrid unsupervised-supervised way. On the other hand, in the bottom-up approach, three topics were extracted in a totally unsupervised way capitalizing on a Twitter dataset filtered according to the presence of keywords related to vulnerability to psychological distress and associated with at-risk scenarios. The identification of such scenarios with both approaches made it possible to capture and analyze the potential psychological vulnerability such as loneliness, isolation, depression, in critical situations.
People are increasingly using social media to express their depression in response to the outbreak of COVID-19 and related scenarios such as lockdown, based on the related studies.
Social scientists and psychologists take interest in understanding how people express emotions and sentiments when dealing with catastrophic events such as natural disasters, political unrest, and terrorism. A COVID-19 pandemic is a catastrophic event that has raised a number of psychological issues such as depression has given an abrupt social changes and lack of employment. Social media is the leading medium that is used for communication during the COVID-19 pandemic. Multiple studies have investigated the economic and social impacts of COVID-19, but which mental impact gives drastic life changes to people and how to quantify it at the population level are yet to be studied. Psychiatric symptoms are relatively high among the COVID patients and the general public due to many issues such as Quarantine, the severity of spread, fear on proper medication, etc., [24] Therefore, in this paper, a novel deep learning framework is proposed for depression detection of COVID-19 Twitter data, which follows several processes to identify the depression level of people during the COVID-19 pandemic. Initially, the proposed system collects the tweets by using Twitter Application Programming Interface. The API collects around 41,158 tweets of COVID–19 which contains username, location, tweet and timestamp. The proposed system follows a bottom–up approach in which the tweets with the keywords were extracted from the data. The tweet data generated from the Twitter API is fed to the Natural Language Tool Kit library which helps the machine to analyze, pre-process, and understand the written text. The data pre-processing was carried out by performing the following steps called Tokenization, Removal of stop words in English, Removal of Uniform Resource Locator, special characters, and stemming. After pre-processing, the user's frequent tweet identification and the hash tagged Tweets identification are carried out. Next, the hash tagged tweets are clustered by means of Cluster head selection and Cluster Formation. In Cluster Head Selection, the optimized hash tag is selected by using Swap-Displacement-Reversion based Bull Optimization Algorithm (SDR-BOA). After that, the hash tagged tweets are clustered using the Bregman distance-based K-Means (BD-K-Means) algorithm. Next, the Psycholinguistic features, such as the Psychological process, Linguistic process, and other grammar, are extracted. After feature extraction, the depression level classification is done by using the Improved Chimp Optimization Algorithm-based CNN-LSTM (ICHOA-CNN-LSTM) algorithm. The block diagram of the proposed methodology is shown in below Fig. 1.

Figure 1: Block diagram of the proposed methodology
Preprocessing is the essential step that transforms the unstructured data into a suitable format for machine learning algorithms. In the proposed work the input data collected from the Twitter dataset is initialized as,
where, IDn in Eq. (1) represents the input data, IDN denotes the Nth number of data. Tokenization is the process of dividing the input data into smaller units called tokens. This can be done by locating the word boundaries which is known as the ending point of the word and the beginning of the next word. Tokenization can help to identify the number of words and the number of times a corresponding word occurs. The tokens are represented as,
where,
where,
where,
where,
3.2 User's Frequent Tweet Identification
Frequent tweets are known as the users who have posted 4 or more tweets. It is observed that during lock down time the tendency of users is higher to tweet more frequently. These frequent tweets are identified based on the frequency of the tweets. The frequency of the tweets can be found by the most commonly used tweets and the number of times that the tweets appeared. Thus, the frequent tweets
where,
Adding
3.4 Clustering Hashtag Twitter
Clustering is the task of dividing the data points into a number of sub groups. In the proposed work, the hash tagged tweets identified
Cluster Head Selection is to search for an optimized Hash tag related to the content using Swap-Displacement-Reversion based Bull Optimization Algorithm (SDR-BOA). BOA is an evolutionary optimization algorithm that depends on the mutation and crossover operators. In BOA the best individuals are obtained from each individual in the initial population. By doing this, an individual with the worst fitness value gets a better fitness value at the end of the optimization process. In existing BOA the variation between the genes is very low as the method has single point mutation. To improve the bull position updating and the variation between the genes, the Swap-Displacement–Reversion technique is included after the crossover step.
Initially, the population (i.e., the identified hash tagged tweets) with M dimensions and L number of individuals is generated as follows,
where, m = 1, 2, …, M, n = 1, 2, …, L, M is the number of individuals, L is the number of dimensions for certain problems, and e is a randomly chosen parameter in [0, 1].
Then, the two-point cross-over operation is used to generate the new population. Two random numbers in the range of [0, L] are generated for an individual in the L dimension. The cross-over operation for generating new individuals with the best individuals
where,
In the cross-over operation, a new population can be generated by crossing each individual in the population with the best individuals obtained so far. When the crossing points are closer, the process of finding a new region searching for the best solution called exploration is performed. Otherwise, the process of updating solutions based on the best solution called exploitation is done.
After that, the search capability of the method is enhanced by using the mutation operation. In the mutation process, searching for better individuals is done based on the core values of the gene. The mutation process mutates the gene value of each individual based on the Swap-Displacement–Reversion (SDR) technique. In the SDR technique, two values of the selected genes are swapped, and the gene value at the particular position is inserted to the former location by shifting other values to the right, and the selected values are reversed. The mutation process using SDR is shown in Fig. 2.

Figure 2: Swap-Displacement–Reversion (SDR) technique
The steps are continued until the termination criteria are met. In this way of searching for the best individual, the optimal cluster head
After cluster head selection the hash tagged tweets
where,
These steps are repeated until there is no data points are reassigned. Thus, the number of clusters obtained is expressed as,
where, CDk denotes the number of clusters, CDK denotes the Kth cluster.
From the clustered data CDk, each tweet is characterized by extracting the number of features and the features are ranked for classification. In the proposed work, the features are extracted under three aspects: the Psychological process, Linguistic process, and Other grammar. The linguistic process involves grammatical information such as the total of pronouns, articles, negations, word counts, and auxiliary verbs, among others. The second set contains the psychological process, which is able to estimate positive emotions, negative emotions, social processes, and cognitive processes, among others. CountVectorizer converts a collection of text documents into a matrix of token counts. The vector of all of the token frequencies for a given document is considered a multivariate sample The occurrence frequency is considered as the feature. The extracted features are denoted as,
where,
After feature extraction, classification of extracted features

Figure 3: Architecture of IChOA-CNN-LSTM
Convolution Layer: The first step that the LSTM-CNN undergoes is the convolution operation. For this, the convolution layer consists of several kernels (weights) which are also known as feature detectors. In the convolution layer, the convolution between the input features and kernels is expressed as,
where, Cl(fm(i)) in Eq. (14) denotes the detected feature map using kernels Φ,
Pooling Layer: After convolution, the next step is pooling, which reduces the size of the features map by removing the unnecessary features. For this, the network uses max-pooling function and is expressed as,
where, Pl(fm(i)) denotes the pooled feature map, ξmp denotes the max-pooling function used to reduce the dimensionality of the feature map. Then, the pooled feature map Pl(fm(i)) is inputted to the different gates in LSTM to manipulate the behaviour of each memory cell.
Forget Gate: The forget gate is responsible for removing the information which has less importance and is no longer required to understand things. This can be determined by the sigmoid activation through which the information from the previous hidden state and from the current input is passed at the particular time step. The forget gate output fg(m) can be expressed as,
where,
Input Gate: The input gate determines which information is relevant to add to the memory at the current step. For this, two functions are used called sigmoid function and tanh function. The sigmoid function squishes the values to be between (0, 1) to forget the information that is not important. The tanh function transforms the values to be in the range of ( − 1, 1) that helps to regulate the network. The output of the input gate Ig(m) can be expressed as,
where,
Cell State: The cell state allows the information from the previous states to be stored in the network. First, the cell state is point-wise multiplied with the forget gate, and the output is added to the output of the input gate to obtain the modified cell state. Thus, the new cell state is calculated as given in Eq. (20).
where, Cs(m) represent the new cell state, Cs(m − 1) represent the previous cell state, and ° is the point-wise multiplication and
Output Gate: The output gate decides what the next hidden state should be i.e., selecting useful information from the current cell state and showing that as an output. First, the previous hidden state and current input are passed through the sigmoid function while the modified new cell state is passed through the tanh function. Then, the outputs of the sigmoid function and tanh function are multiplied to decide what information the hidden state should carry. The output can be expressed as,
where,
Fully Connected Layer: The fully connected layer contains the surtax layer that converts the input to the probability vector that gives the probability of classes to which the input vector belongs. The computation at each layer of the fully connected layer is given in Eq. (24).
where,
where, ∂tar, ∂obs are the target and observed values. When target value and the observed value are equal, it gives a better classification also there is no optimization is needed. Otherwise, the optimization of weight values in the convolution layer is needed. In this work, the IChOA algorithm is utilized for the optimization process.
Improved Chimp Optimization Algorithm
ChOA is the meta-heuristic algorithm inspired by the hunting behaviour of Chimps. Chimp is a mammal most like a human. They are intelligent, curious, noisy, and social. Chimps live in a community that consists of several groups with a certain number of individuals. In the existing ChOA, the high entrapment in local optima and slow convergence rate in the hunting process of the Chimps is improved by using the Basin chaotic map. Thus, the method is named Improved ChOA (IChOA). Each group in the community has different abilities while hunting. In this regard, the Chimps are categorized into four groups with their abilities such as drivers, barriers, chasers, and attackers.
• Drivers are to follow the prey without trying to catch them
• Barriers swing from branch to branch to make hinders to the escape way of prey
• Chasers move rapidly after the prey to catch them, and
• Attackers prognosticate the progress path of prey to beat it.
Moreover, Chimps have several motivations during the hunt that chimps hunt to obtain meat for trading in social favours such as coalitionary support, sex, or grooming. Thus the social favours motivate the chaotic performance of the Chimps at the final stage of the hunting process. The mathematical model [25] of the hunting process is elucidated using the Eqs. (26)–(35).
On the whole, the hunting behaviour of the Chimps is divided into two phases called exploration and exploitation. The exploration comprises of driving, blocking, and chasing processes, whereas the exploitation phase focuses on attacking the prey. The process starts with the initial population of Chimps generating the random solutions as,
The driving and chasing of the prey can be expressed as,
where, Θ is the distance between Φpr, Φch, Φpr, Φch are the position vectors of prey and chimp,
where, α decreases nonlinearly in the exploration and exploitation phases at each iteration τ, γ1, γ2 are the random vectors drawn from the intervals [0, 1], BChtvec is the chaotic vector computed over the basin of attraction.
In exploration, as the initial position of the prey was unknown, the best solutions are obtained from the four groups (attacker, driver, barrier, and chaser) in the community. The obtained solutions are used to indicate the location of the prey and other Chimps are forced to update their positions based on these four solutions.
The solutions can be obtained as,
Then, the exploitation phase for attacking the prey is carried out. The attacking of prey is represented when the value of
At the final stage of hunting, Chimps can switch duty to chaotic behaviour for the social incentives. During this stage, the updating strategy can be switched between normal behaviour and chaotic behaviour to update Chimp's location. The position updating can be expressed as,
where, ϕ ∈ (0, 1) is the random vector that determines the probability of choosing the updating behaviour. The chaotic maps are used in the final stage of attacking the prey, helps Chimps to alleviate the local optima and slow convergence rate problems. In this way, the optimized weight values are obtained. The pseudo code of the proposed IChOA–CNN-LSTM is shown in below Fig. 4.

Figure 4: Pseudo code of the proposed IChOA-CNN-LSTM method
The pseudo code in Fig. 4, shows the fundamental steps involved in the IChOA-CNN-LSTM method. The proposed IChOA-CNN-LSTM contains different layers for classification and based on the loss function weight values of the convolution layer are optimized by using the IChOA method. Finally, the classifier classifies the depression level of the users into various classes such as disgust, sad, fear, anger, and happy.
The proposed depression classification technique in Covid-19 Twitter data is effectively implemented and the results are tabulated in Tab. 1. The details of the performance together with comparative analysis are explained here.

In this section, the performance of the proposed method is compared with the existing hybrid Long Short-Term Memory and Convolution Neural Network (CNN-LSTM), Long Short-Term Memory (LSTM), and Convolution Neural Network (CNN) in respect of some quality metrics and training time. Then, the results obtained by the proposed IChOA-CNN-LSTM method in terms of class count are given.
Discussion: The precision, recall, and F-measure of the proposed and existing classifiers are analyzed in above Fig. 5. The precision and recall of the proposed method are 97.3658% and 97.8745% whereas, the existing CNN-LSTM, LSTM, and CNN methods have 95.5478%, 93.2356%, and 91.8574% of precision and 95.5478%, 93.3574%, and 91.2514%. In this analysis, the proposed method attains a high value of precision and recall. Fig. 6 shows the training time of the proposed and existing CNN-LSTM, LSTM, and CNN methods. When comparing with the existing methods the proposed method takes a lesser time of 54774 ms for training.

Figure 5: Performance analysis

Figure 6: Training time
Discussion: Fig. 7 analyzes the results obtained by the proposed IChOA-CNN-LSTM method in terms of class count. The various classes taken for the analysis are disgust, sad, anger, fear, and happy. As, the proposed method analysis the depression-related tweets, the class count attained disgust is larger than other classes which are 4105. Followed by disgust, the highest count of 2181 is obtained for the class fear. For the other classes, the results obtained are 1609 for sad, 264 for anger, and 68 for happy which contribute less in depression analysis.

Figure 7: Class count
4.2 Performance Analysis of Clustering
Here, the performance of the proposed BD-K-Means method is analyzed with the existing K-Means, CLARA, Partitioning Around Medoids (PAM), and Fuzzy C-Means methods based on clustering time. Fig. 8 compares the clustering time of the proposed and existing methods in which the time taken by the existing FCM is larger for clustering which is 74584 ms. The proposed BD-K-Means takes a clustering time of 48754 ms.
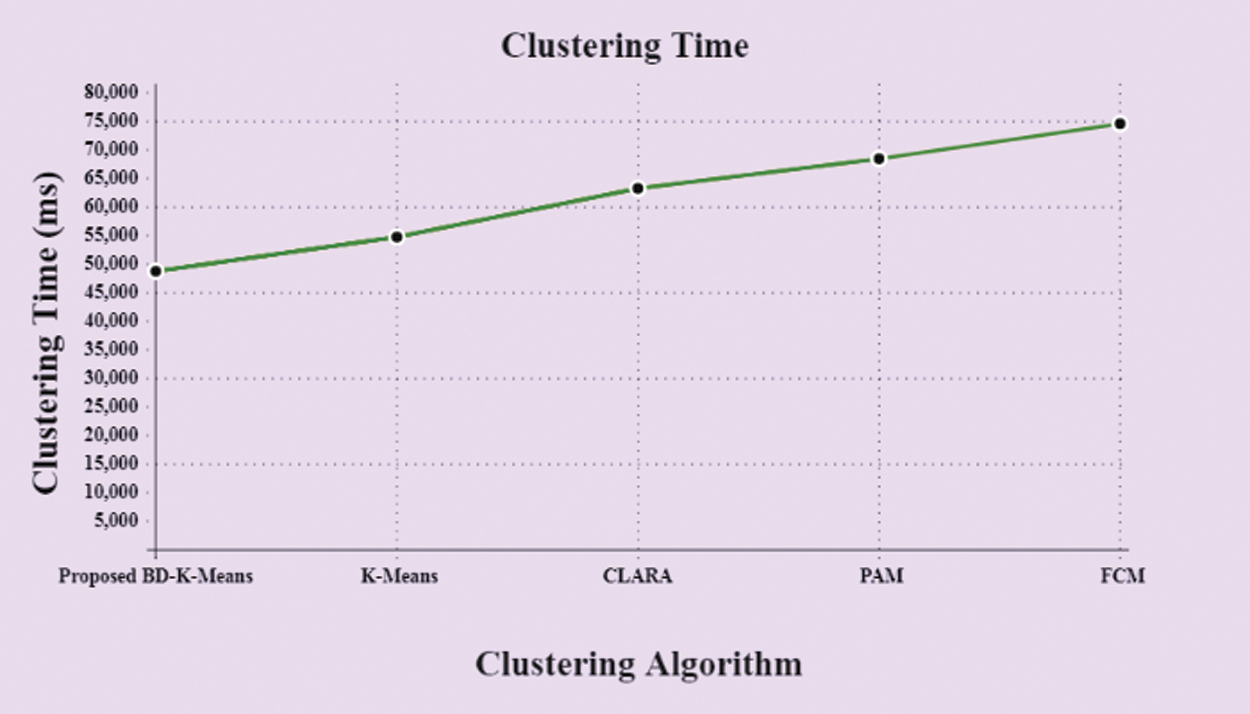
Figure 8: Demonstrates the clustering time of the proposed and existing methods
This paper proposes an efficient framework for analyzing the Covid-19 Twitter data using IChOA-LSTM-CNN with NLP. The main aim of this approach is to perform an efficient depression detection using IChOA-LSTM-CNN on the basis of Psycholinguistic features. The proposed method consists of six phases such as, pre-processing, frequent tweet identification, hash tag tweet identification, clustering, feature extraction, and classification. The performance comparison is done for the proposed IChOA-CNN-LSTM and BD-K-Means algorithm. In classification, the proposed IChOA-CNN-LSTM is compared with the existing methods based on some quality metrics such as sensitivity, specificity, accuracy, precision, recall, and F-measure. The proposed method achieves 97.7458% of accuracy with 2.17% of improvement than the existing methods. Also, the proposed method takes 54774 ms training time which is lower than the existing methods. The proposed BD-K-Means clustering used in the paper achieves a low clustering time of 48754 ms which is considerably low when compared to the other clustering techniques. These results revealed that the proposed method is more efficient and accurate than the other techniques. In the future, the work will be extended by developing a tool with integrating more advanced algorithms and a larger data set with the proposed work to identify the propagation of depression on social media.
Funding Statement: The authors received no specific funding for this study.
Conflicts of Interest: The authors declare that they have no conflicts of interest to report regarding the present study.
1. Y. Zhang, H. Lyu, Y. Liu, X. Zhang, Y. Wang et al., “Monitoring depression trend on twitter during the COVID-19 pandemic,” JMR Infodemiology, vol. 1, e26769, pp. 219, 2021. [Google Scholar]
2. J. Cabezas, D. Moctezuma, A. Fernández-Isabel and I. Martín de Diego, “Detecting emotional evolution on twitter during the COVID-19 pandemic using text analysis,” International Journal of Environmental Research and Public Health, vol. 18, no. 13, pp. 1–20, 2021. [Google Scholar]
3. A. Al-Laith and M. Alenezi, “Monitoring peoples emotions and symptoms from arabic tweets during the COVID-19 pandemic,” Information, vol. 12, no. 2, pp. 1–21, 2021. [Google Scholar]
4. J. Marie Tshimula, B. Chikhaoui and S. Wang, “COVID-19 detecting depression signals during stay-at-home period,” arXiv preprint arXiv:2103.00597, 2021. [Google Scholar]
5. K. N. Fountoulakis, M. K. Apostolidou, M. B. Atsiova, A. K. Filippidou, A. K. Florou et al., “Self-reported changes in anxiety, depression and suicidality during the COVID-19 lockdown in Greece,” Journal of Affective Disorders, vol. 279, pp. 624–629, 2021. [Google Scholar]
6. H. Alhazmi and M. Alharbi, “Emotion analysis of arabic tweets during COVID-19 pandemic in saudiarabia,” (IJACSA) International Journal of Advanced Computer Science and Applications, vol. 11, no. 10, pp. 619–625, 2020. [Google Scholar]
7. K.Saha, J. Torous, E. D. Caine and M. De Choudhury, “Social media reveals psychosocial effects of the COVID-19 pandemic,” Medrxiv, Preprint, 2020. https://doi.org/10.1101/2020.08.07.20170548. [Google Scholar]
8. H. Yin, S. Yang and J. Li, “Detecting topic and sentiment dynamics due to COVID-19 pandemic using social media,” in Int. Conf. on Advanced Data Mining and Applications, Lecture Notes in Computer Science, Cham, Springer, vol. 12447, pp. 610–623, 2020. [Google Scholar]
9. O. Zammit, S. Smith, D. Windridge and C. De Raffaele, “Exposing students to new terminologies while collecting browsing search data,” in Int. Conf. on Innovative Techniques and Applications of Artificial Intelligence Springer, Lecture Notes in Computer Science, Cham, Springer, vol. 12498, 2020. [Google Scholar]
10. H. Shalu, P. Harikrishnan, C. N. Hari Sankar, A. Das, S. Majumder et al., “Depression status estimation by deep learning based hybrid multi-modal fusion model,” arXiv preprint arXiv:2011.14966, 2020. [Google Scholar]
11. A. Tommasel, A. Diaz Pace, J. Manuel Rodriguez and D. Godoy, “Capturing social media expressions during the COVID-19 pandemic in Argentina and forecasting mental health and emotions,” arXiv preprint arXiv:2101.04540, 2021. [Google Scholar]
12. R. Chandra and A. Krishna, “COVID-19 sentiment analysis via deep learning during the rise of novel cases,” arXiv preprint arXiv:2104.10662, 2021. [Google Scholar]
13. H. Kaur, S. UlAhsaan, B. Alankar and V. Chang, “A proposed sentiment analysis deep learning algorithm for analyzing COVID-19 tweets,” Information Systems Frontiers, vol. 23, pp. 1–13, 2021. [Google Scholar]
14. A. Kumar, A. Sharma and A. Arora, “Anxious depression prediction in real-time social data,” in Int. Conf. on Advanced Engineering, Science, Management and Technology (ICAESMT19), Dehradun, https://ssrn.com/abstract=3383359, 2019. [Google Scholar]
15. H. Zogana, I. Razzak, X. Wang, S. Jameel and G. Xua, “Explainable depression detection with multi-modalities using a hybrid deep learning model on social media,” arXiv:2007.02847, vol. 1, pp. 169–196, 2021. [Google Scholar]
16. A. Leis, F. Ronzano, M. A. Mayer, L. I. Furlong and F. Sanz, “Detecting signs of depression in tweets in spanish behavioral and linguistic analysis,” Journal of Medical Internet Research, vol. 21, no. 6, pp. 1–16, 2019. [Google Scholar]
17. T. Gui, L. Zhu, Q. Zhang, M. Peng, X. Zhou et al., “Cooperative multimodal approach to depression detection in twitter,” in The Thirty-Third AAAI Conf. on Artificial Intelligence (AAAI-19), Hawai, vol. 33, pp. 110–117, 2019. [Google Scholar]
18. B. YeowZiwei and H. Na Chua, “An application for classifying depression in tweets,” in Proc. of the 2nd Int. Conf. on Computing and Big Data, Taiwan, pp. 37–41, 2019. [Google Scholar]
19. J. Zhou, H. Zogan, S. Yang, S. Jameel, G. Xu et al., “Detecting community depression dynamics due to COVID-19 pandemic in Australia,” IEEE Transactions on Computational Social Systems, vol. 8, no. 4, pp. 982–991, 2021. [Google Scholar]
20. D. Li, H. Chaudhary and Z. Zhang, “Modeling spatiotemporal pattern of depressive symptoms caused by COVID-19 using social media data mining,” International Journal of Environmental Research Public Health, vol. 17, no. 14, pp. 1–22, 2020. [Google Scholar]
21. S. Ghosh and T. Anwar, “Depression intensity estimation via social media: A deep learning approach,” IEEE Transactions on Computational Social Systems (Early Access), vol. 8, pp. 1465–1474, 2021. [Google Scholar]
22. T. Ghosh, T. Md Hasan Al Banna, J. Al Nahian MJ, K. Abu Taher, M. S. Kaiser et al., “A hybrid deep learning model to predict the impact of COVID-19 on mental health form social media big data,” Artificial Intelligence and Robotics, vol. 1, pp. 1–21, 2021. https://doi.org/10.20944/preprints202106.0654. [Google Scholar]
23. M. Viviani, C. Crocamo, M. Mazzola, F. Bartoli, G. Carrà et al., “Assessing vulnerability to psychological distress during the COVID-19 pandemic through the analysis of microblogging content,” Future Generation Computer Systems, vol. 125, pp. 446–459, 2021. [Google Scholar]
24. G. Serafini, B. Parmigiani, A. Amerio, A. Aguglia, L. Sher et al., “The psychological impact of COVID-19 on the mental health in the general population,” QJM: An International Journal of Medicine, vol. 113, no. 8, pp. 531–537, 2020. [Google Scholar]
25. M. Khishe and M. Reza Mosavi, “Chimp optimization algorithm,” Expert Systems with Applications, vol. 149, pp. 113338, 2020. [Google Scholar]
 | This work is licensed under a Creative Commons Attribution 4.0 International License, which permits unrestricted use, distribution, and reproduction in any medium, provided the original work is properly cited. |