DOI:10.32604/iasc.2022.026927
| Intelligent Automation & Soft Computing DOI:10.32604/iasc.2022.026927 | |
| Article |
Smart Greenhouse Control via NB-IoT
1Department of Electrical Engineering, National Chin-Yi University of Technology, Taichung, 411030, Taiwan
2Department of Information Technology, Takming University of Science and Technology, Taipei City, 11451, Taiwan
*Corresponding Author: Sung-Jung Hsiao. Email: sungjung@gs.takming.edu.tw
Received: 06 January 2022; Accepted: 17 February 2022
Abstract: The Internet of Things (IoT) has flourished in recent years, which brings convenience to people’s lives, improves the quality of life, allows more effectively managing and maximizing benefits in industry, and improves weather predictions as the impact of global warming has complicated traditional methods to infer the weather. To this end, agriculture has also given more attention to greenhouse cultivation. In the early days of industrial research, Wi-Fi and ZigBee were used as short-or medium-distance communication technologies for transmissions in the network layer of the IoT architecture. Instead of long-distance communication technologies, such as LoRa and NB-IoT, the features of low power consumption and low cost are also more favored by the industry. This article uses the NB-IoT communication module with various sensors to monitor and control a small smart greenhouse, and the data sensed on the network platform is visually presented and recorded. On one hand, the control matches the NB-IoT communication module with the relay module. The fan, LED light, and motor can be controlled by the conditions set on the network platform. Therefore, a smart greenhouse with bidirectional control is realized.
Keywords: Internet of thing; NB-IoT; greenhouse; WI-FI; ZigBee
Under the development of the global Industry 4.0, many industries have gradually shifted from labor-intensive to intelligent development. Intelligent services have been introduced under this development, which includes monitoring systems, crop and consumer data collection and analysis, and automatic farming applications. Assisting the industry to conduct more precise management to pursue more efficient production, reduce costs, and ensure food safety has pushed safer agricultural environments as the initial development of smart agriculture in recent years [1].
The Taiwan Trends Research conducted a market survey on Taiwan’s agricultural smart application in 2018, as shown in Fig. 1a. For the industry, the related applications of monitoring systems are the most highly regarded, and agricultural workers rate this as an important application service. The data collection, production and sales history, and water management are also highly valued. However, the part that introduced smart applications to assist crop production is still a minority. The industry believes that the high costs, immaturity of the technology, lack of understanding for its use, whether it is suitable for existing products, etc., can be strengthened and improved, as shown in Fig. 1b [2].
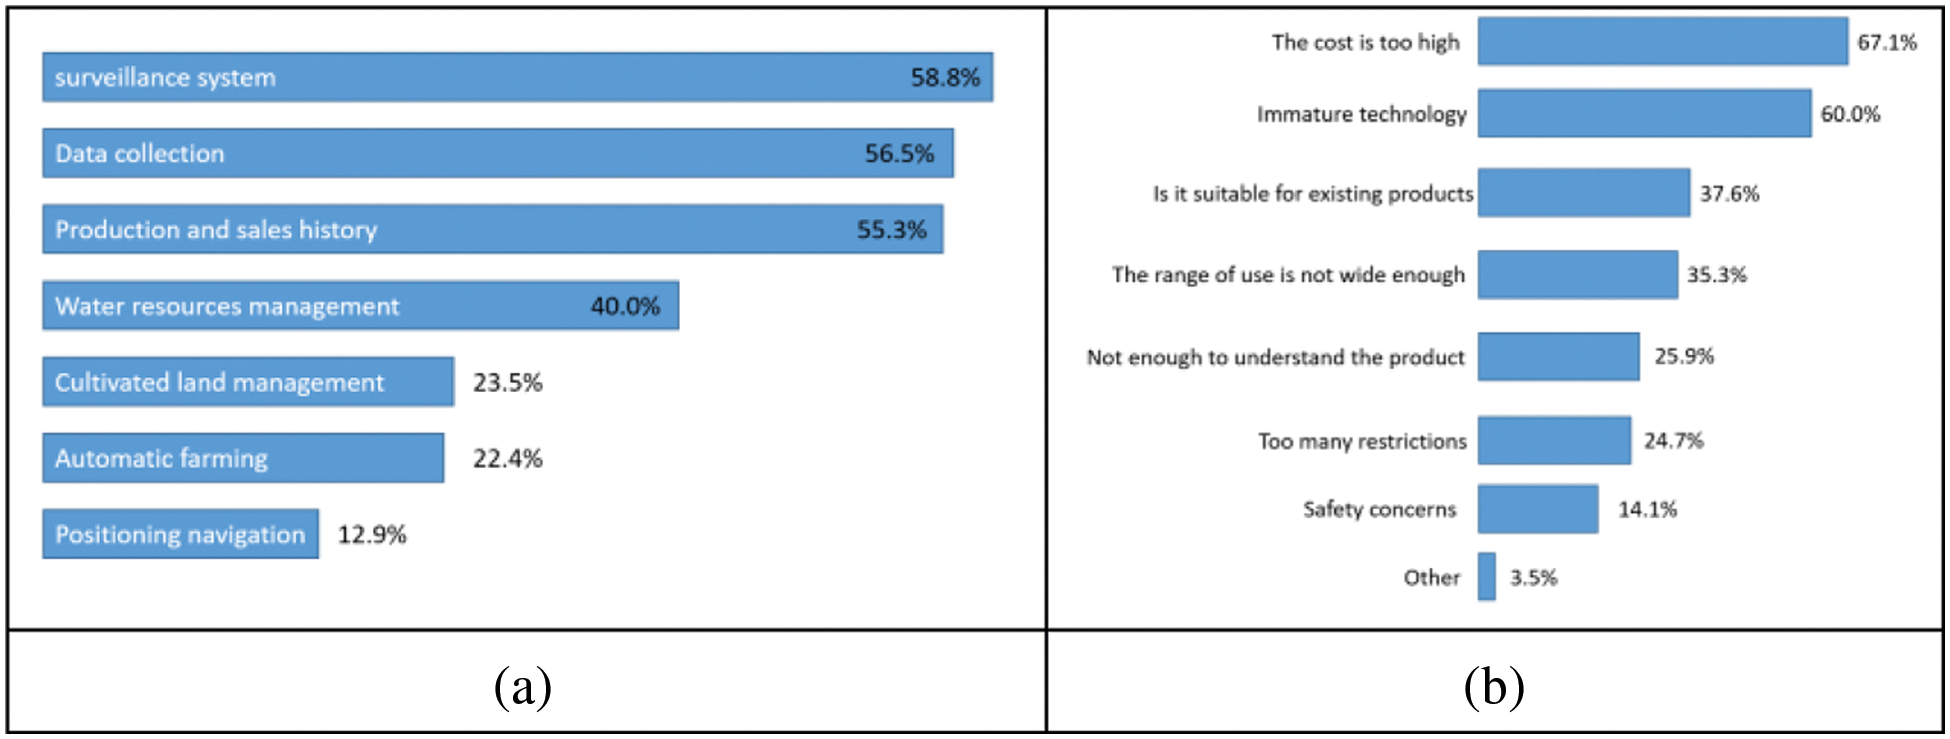
Figure 1: (a) Application services considered important to agricultural workers and (b) troubles when agricultural workers import smart applications
The concept of the Internet of Things (IoT) was proposed in 1999 to connect all items to the Internet through radio frequency identification (RFID) and other information sensing equipment to realize intelligent identification and management. The IoT is known as the third wave of development in the world’s information industry after the computer and the Internet through the integration of sensing, popularizing computing and identification technologies, and ubiquitous networks. The architecture of IoT is generally divided into three layers; from the bottom to the top are the sensing layer, network layer, and application layer, as shown in Fig. 2.
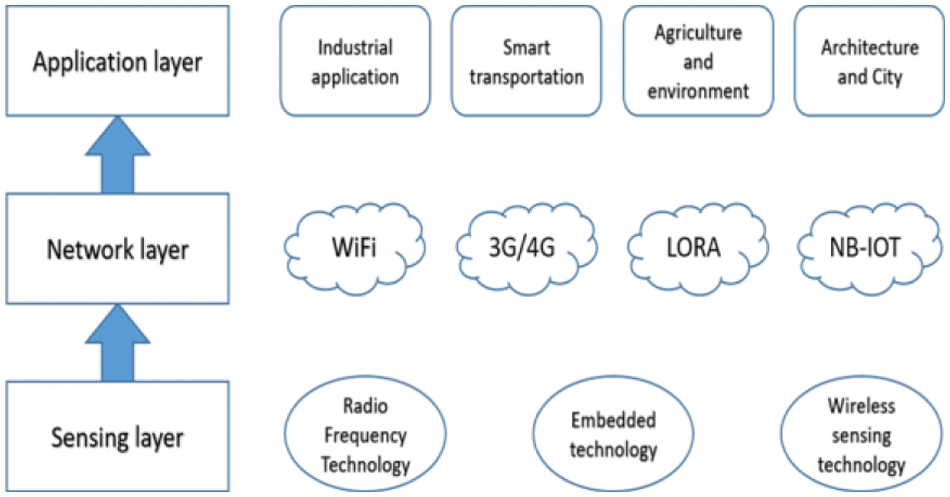
Figure 2: IoT architecture
The sensing layer senses and monitors different environments, which can be divided into sensing and RFID technologies. Sensing technologies include the common temperature, humidity, illuminance, and infrared sensors to collect environmental information. The RFID is a non-contact automatic identification technology that uses RF electronic equipment to generate signals and perform spatial inductive coupling or electromagnetic backscatter coupling to automatically recognize targets and obtain single or multiple object data, which can update the information of the object through the read-write device. The complete RFID system houses the RFID tags, RFID readers, and RFID data management system. The non-contact IC card automatic charging system is a typical RFID component. There are many options for networking technologies, which can be divided into short-, medium-, and long-distance wireless and wired technologies based on the effective transmission distance [3]. These are given as follows.
Bluetooth: Specification of a mesh network using Bluetooth technology to increase the number of nodes and provide a standardized application layer.
Wi-Fi: Wireless local area network technology based on the IEEE 802.11 standard.
RFID: A technology that uses electromagnetic fields to access data in RFID tags.
ZigBee: Personal area network communication protocol based on the IEEE 802.15.4 standard featuring low power consumption, low data rates, and low costs.
LTE-Advanced: A communication specification for high-speed cellular networks, which provides higher data transmission volumes and lower latencies through extended coverage.
3G/4G/5G: All generations of mobile communication technologies provide high data rates, reduced latencies, reduced energy, increased system capacity, and large-scale connected devices.
LPWAN: Provides low data rates and remote communications, which reduces the power consumption and transmission costs. The available Low-Power Wide-Area Network (LPWAN) technologies and protocols are divided into NB-IoT using licensed frequency bands, and into LoRa, Sigfox, Weightless, Random Phase Multiple Access (RPMA), IEEE 802.11ah, etc. using unlicensed frequency bands.
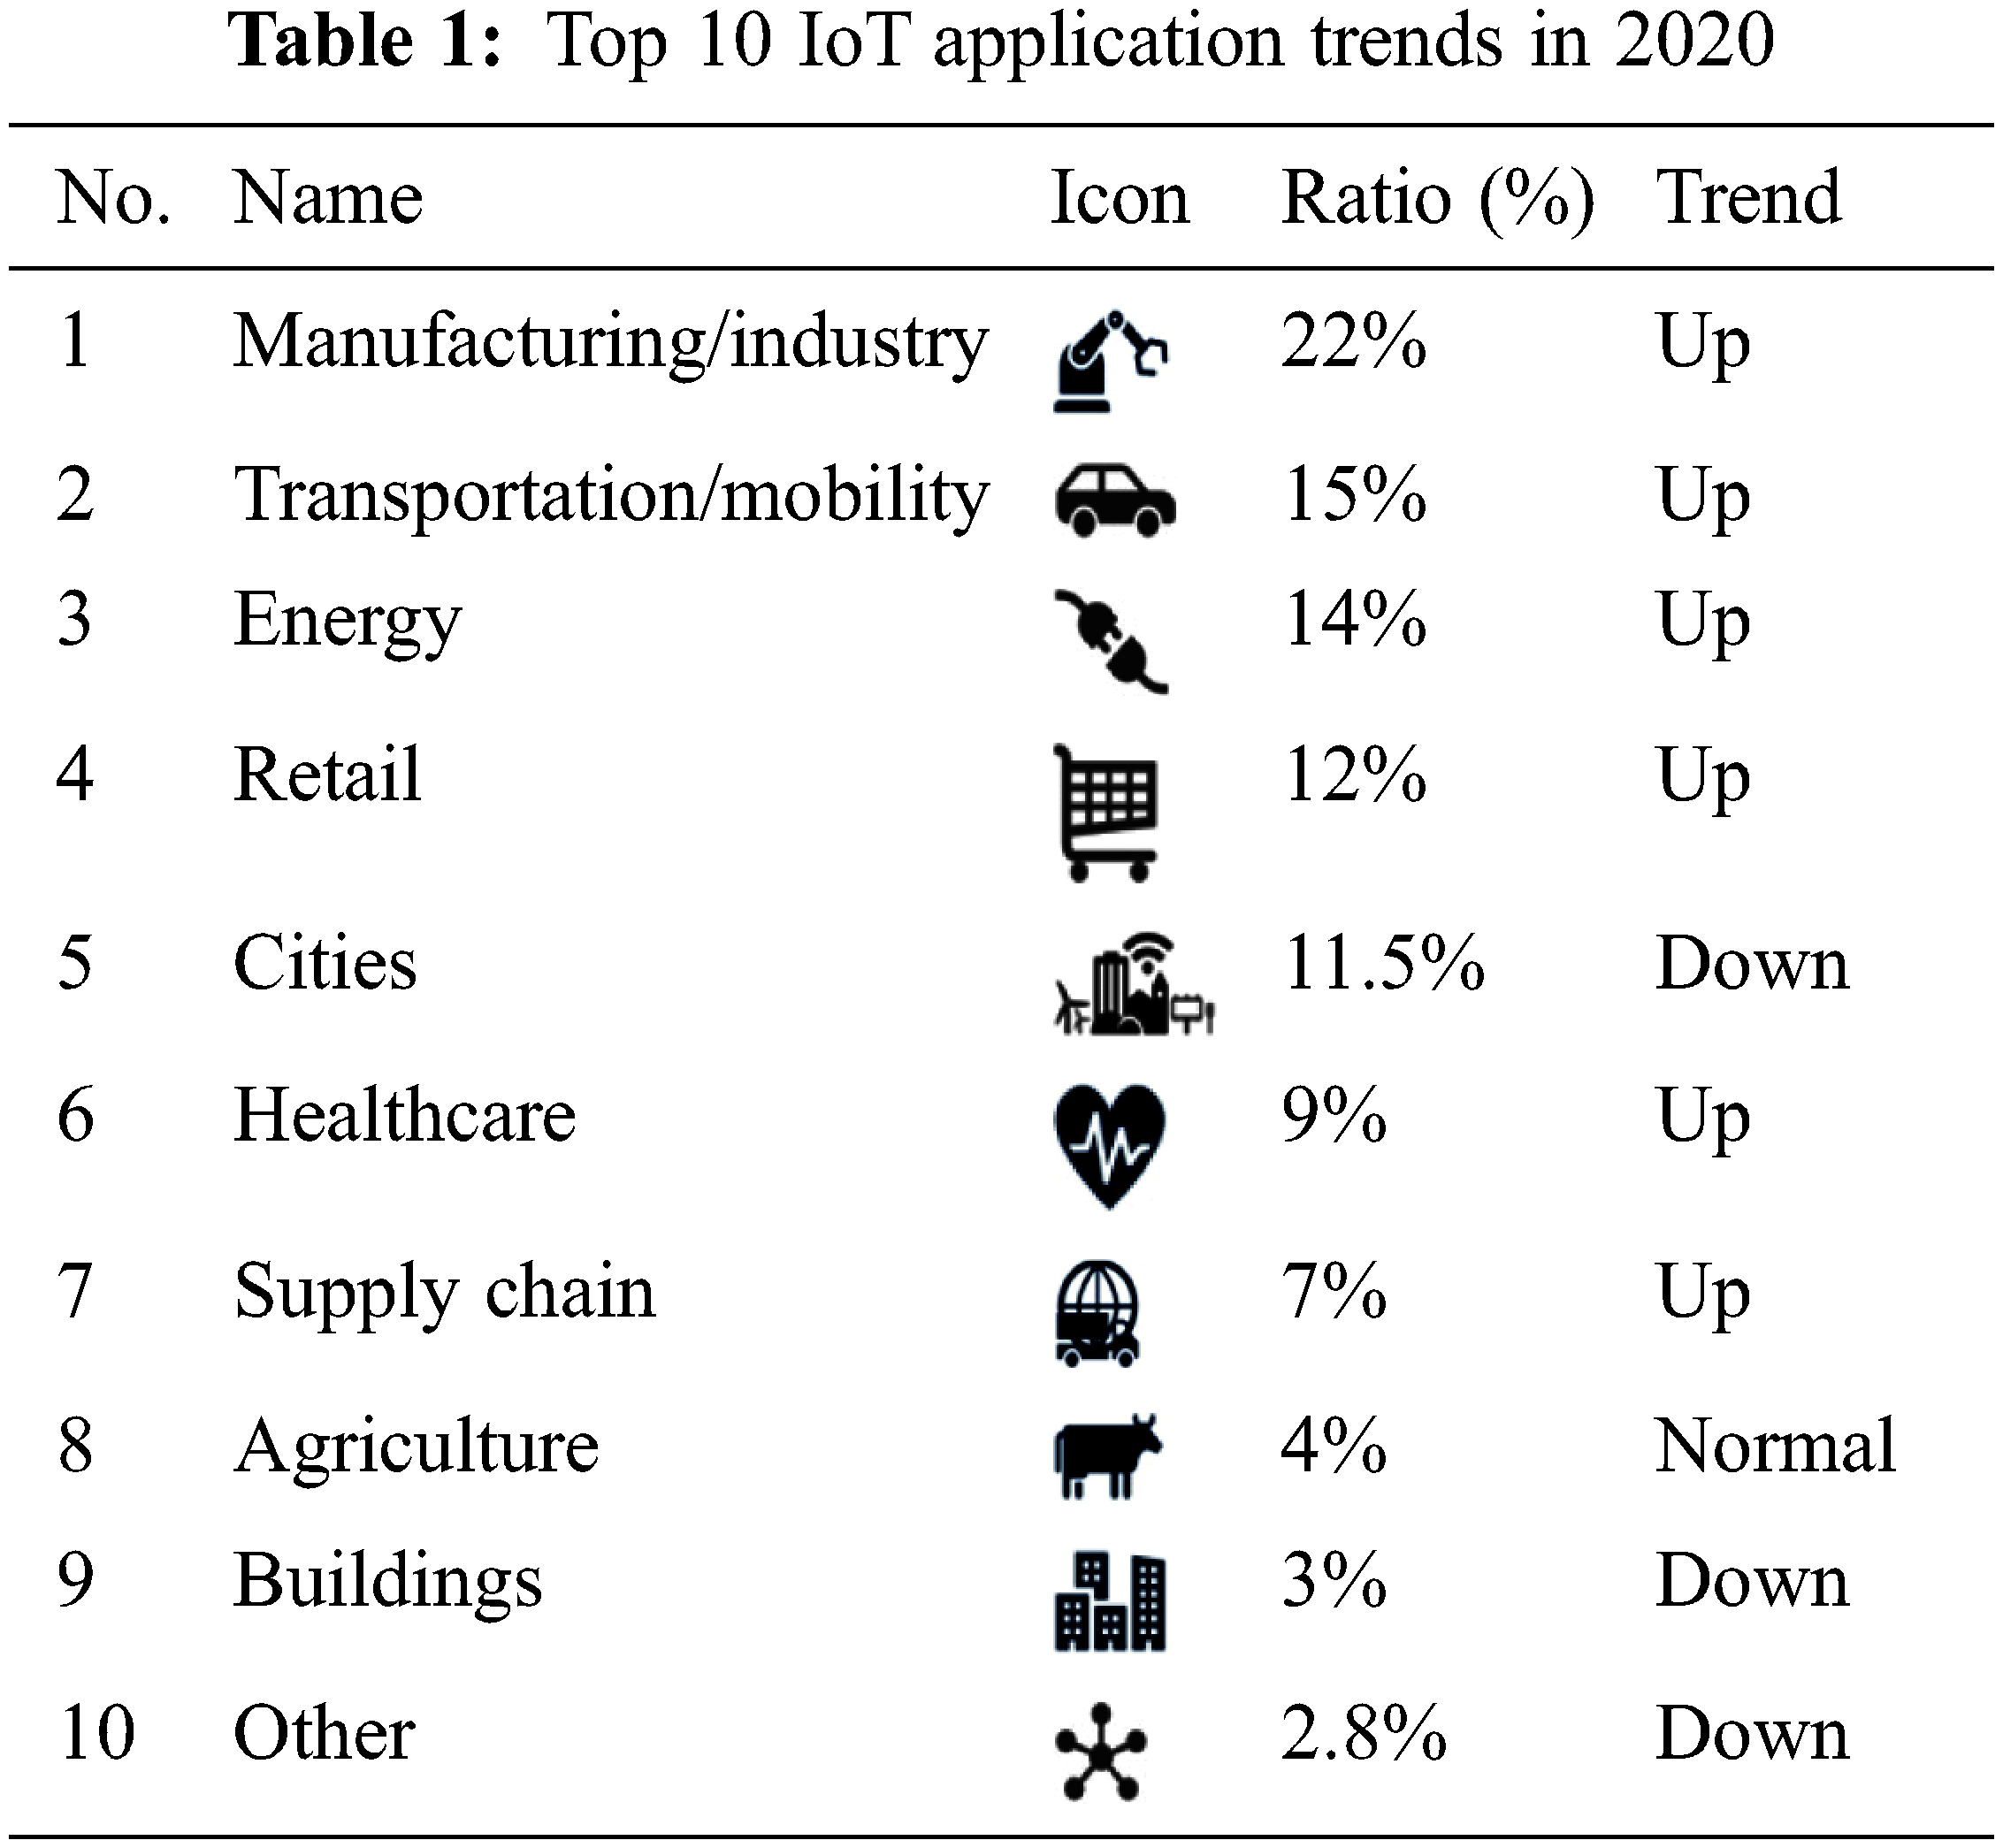
The “sensing” and “networking” technologies provide access to objects at any time, regardless of where they are, and through any form of network access in the application service. The technologies of perception, IoT, cloud, and analysis connect many objects in the physical world into a vast IoT. This provides such things as a smart life, green buildings, smart vehicles, smart logistics, smart learning, smart medicine and health care, and application services in multiple fields such as smart energy savings. Tab. 1 shows the top 10 application trends of IoT in 2020 [4].
This paper employed NB-IoT technologies to enhance the convenience and quality of people’s lives, make industrial manufacturing and production more efficient to maximize revenue, and improve weather forecasting and agricultural greenhouse cultivation techniques. This study uses the NB-IoT communication module with various sensors to monitor and control the small smart greenhouse, and visualize and record the sensed data on the network platform. This study matches an NB-IoT communication module with a relay module and performs basic control of fans, LED lights, and motor devices. This paper carries out the control two-way interactions between users and IoT devices.
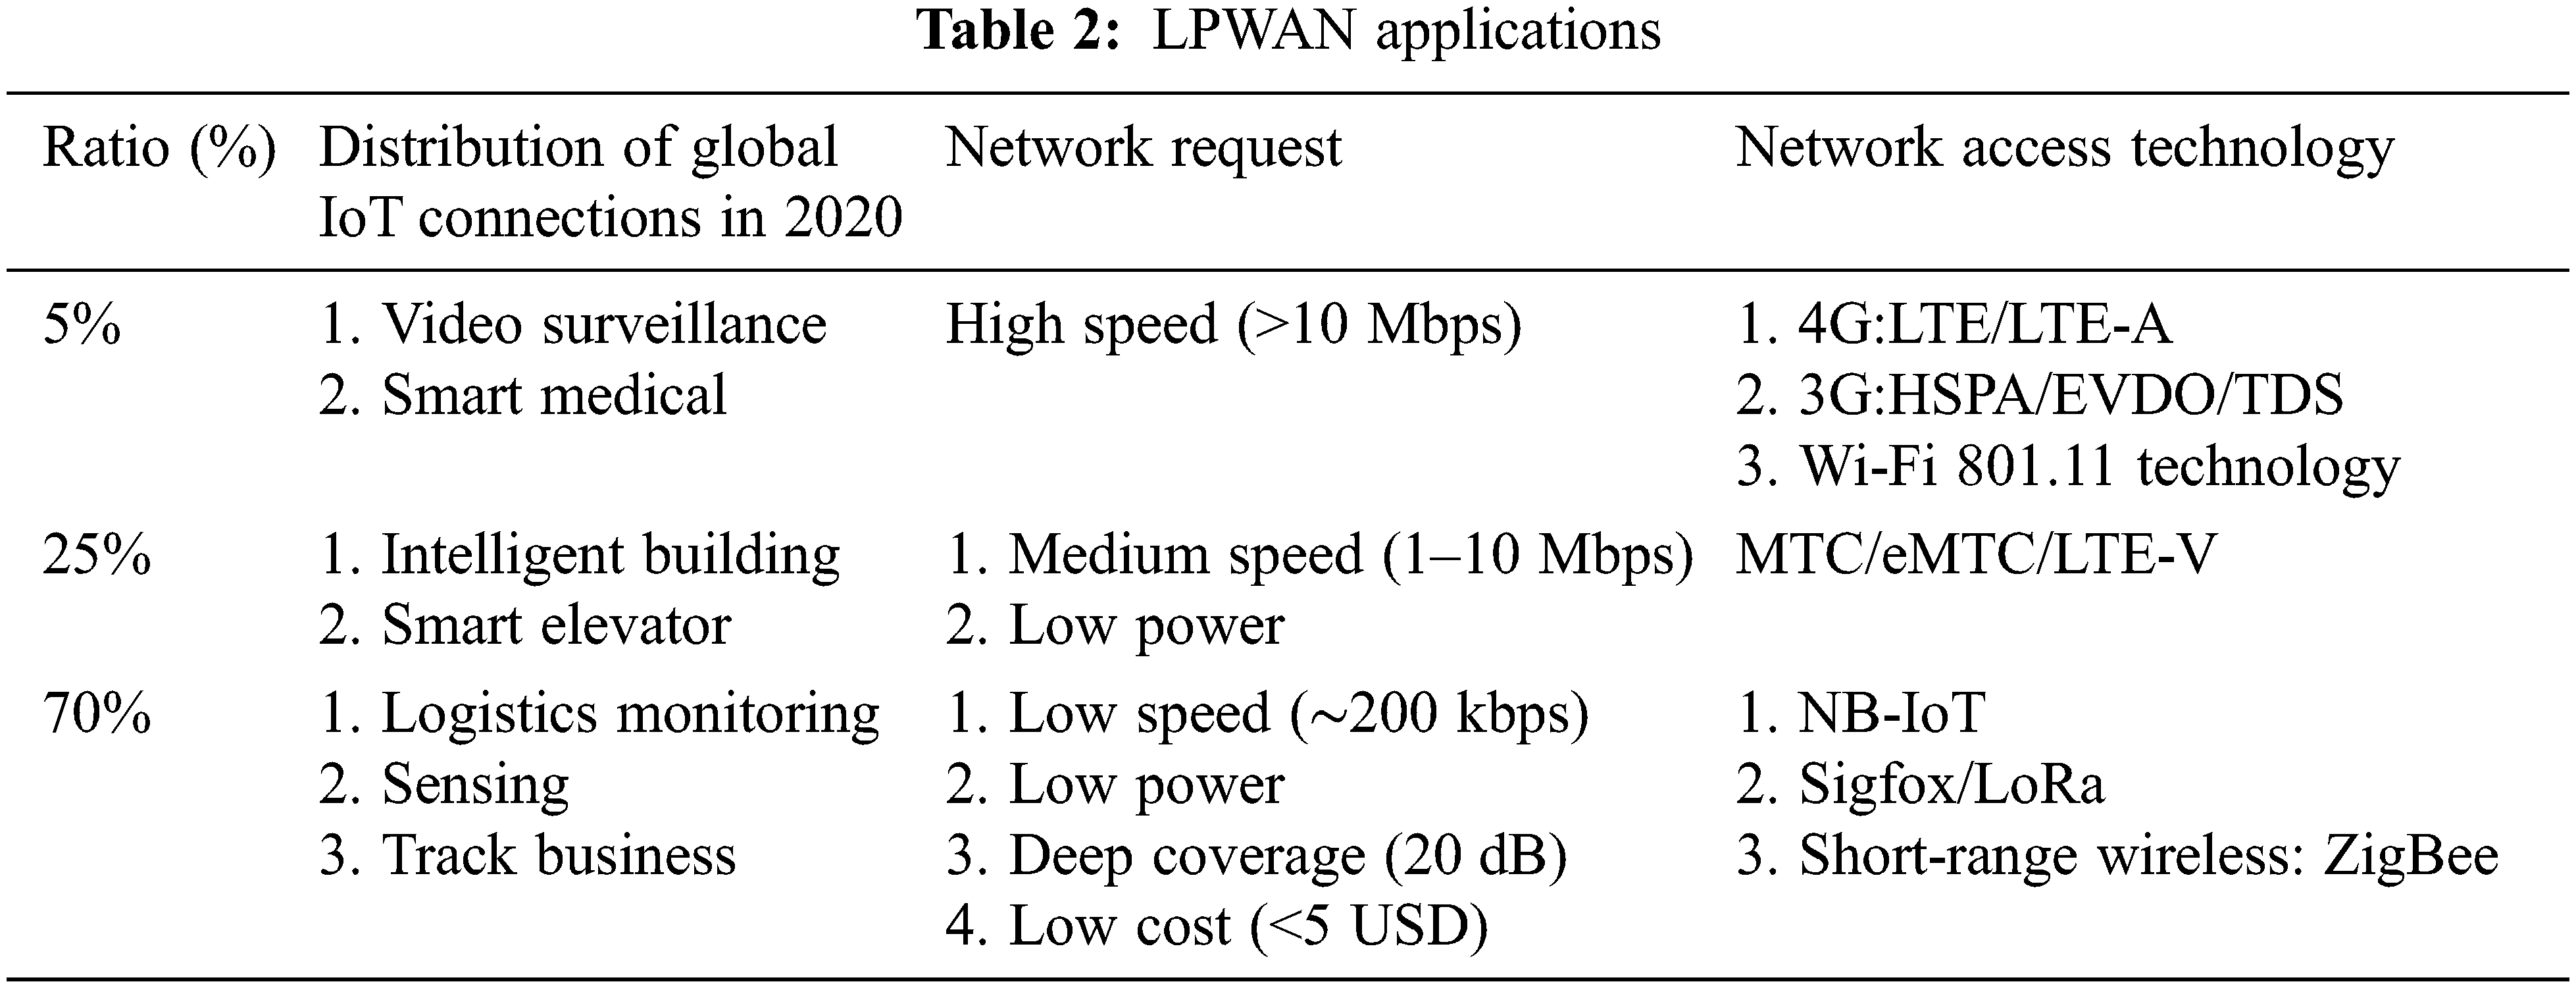
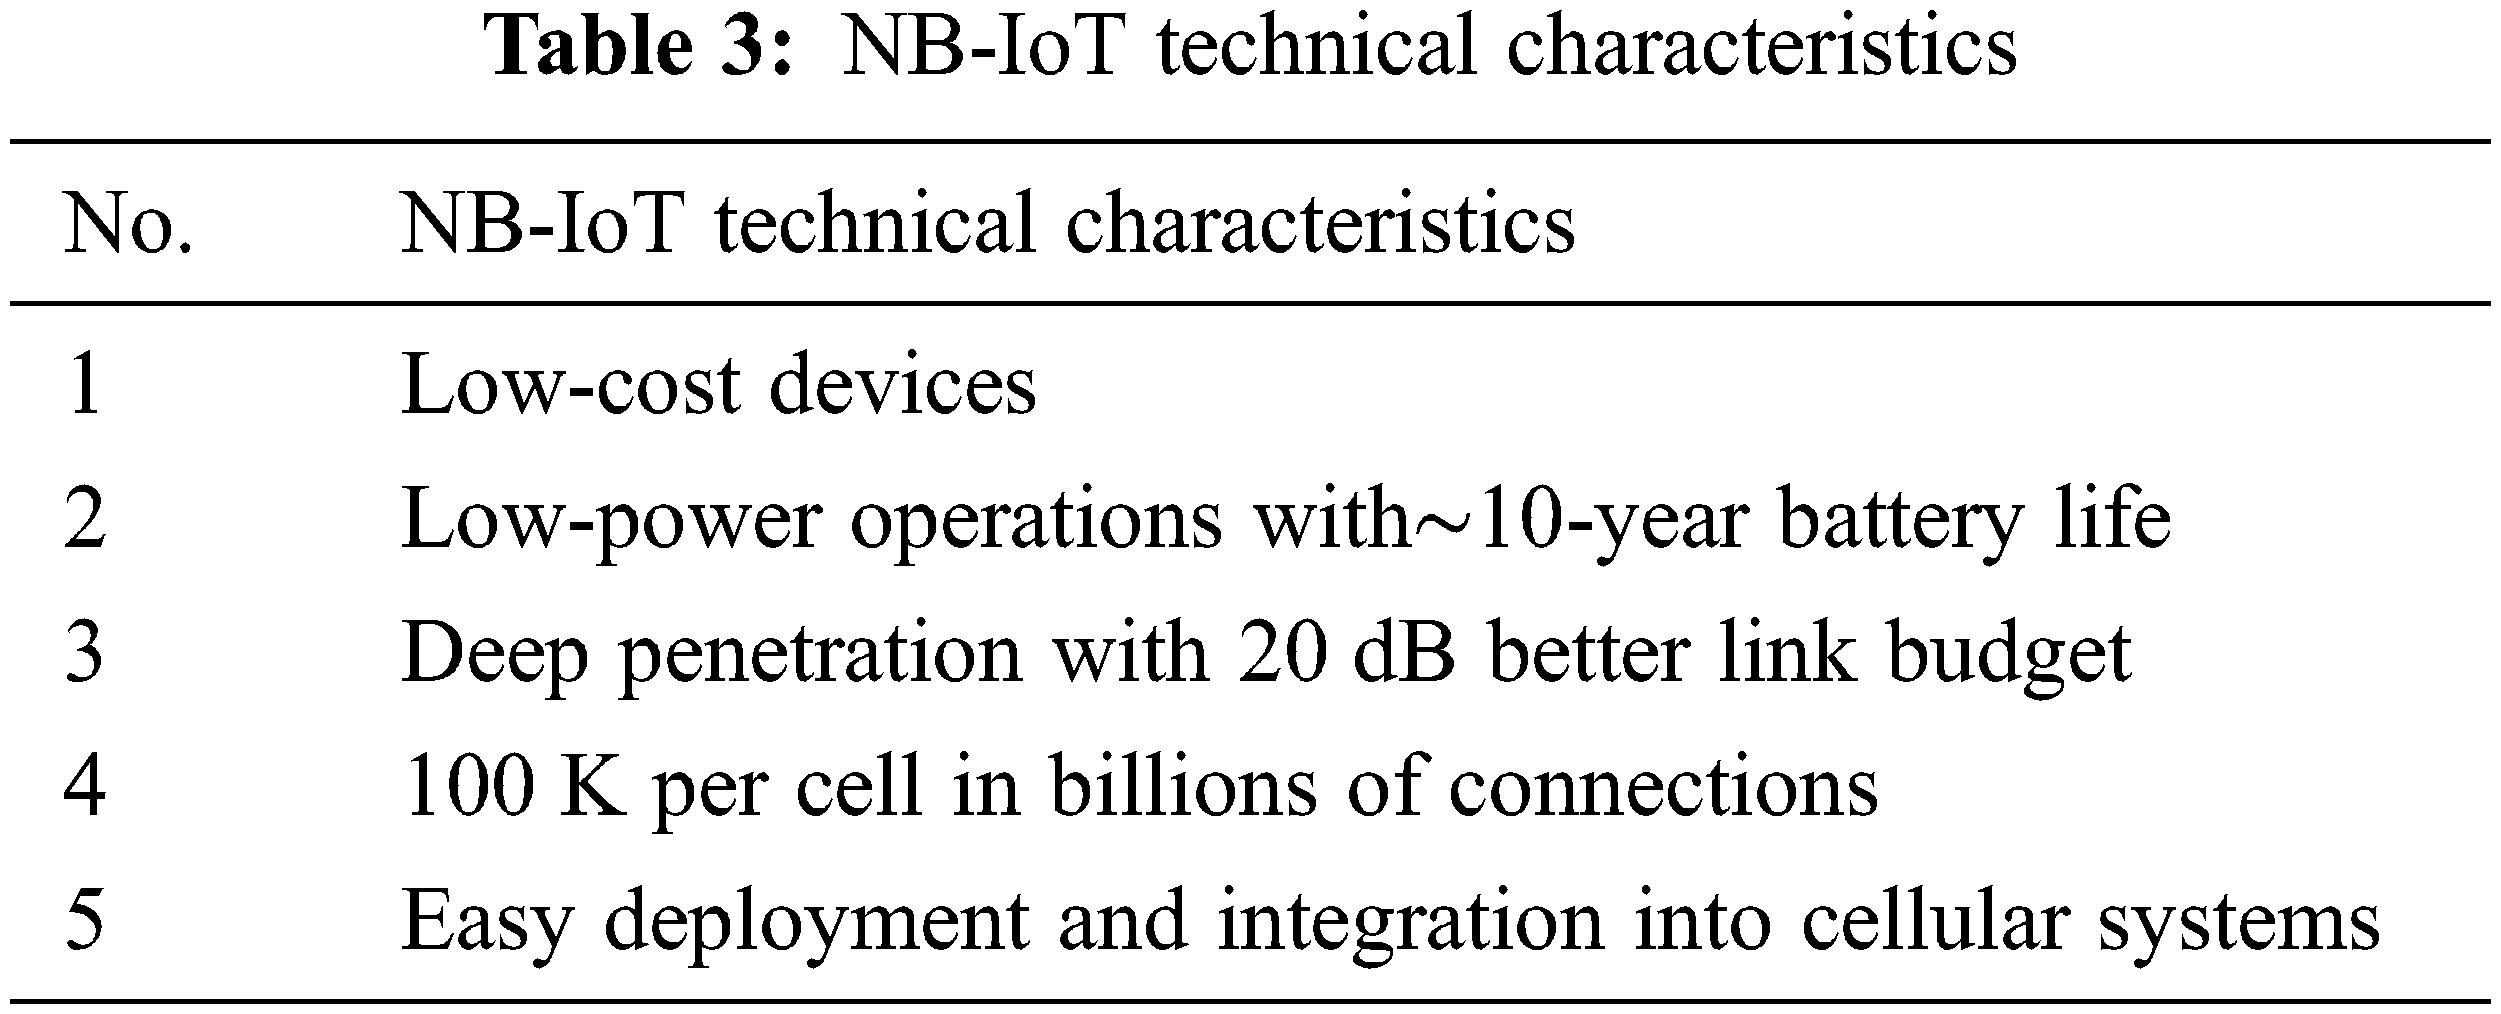
The NB-IoT is a long-distance transmission technology that is classified as LPWAN. Over the past few years, this has been known as NB-IoT, LoRa, and Sigfox. The most important part of NB-IoT was developed by the 3rd Generation Partnership Project (3GPP) camp, which means it will be a unified standard for the global telecommunications industry and will complement the original 3G/4G deficiencies. Statistical estimates indicate that more than 70% of smart applications can be achieved through such network technologies, and the Groupe Speciale Mobile Association (GSMA) places NB-IoT in the 5G ring, as shown in Tab. 2 [5].
The NB-IoT is a new wireless standard developed specifically for low-power, low-cost IoT devices, which can work with cellular network infrastructure. This has the characteristics of low power consumption, long-distance operations, and strong signal penetration while providing advantages that other wireless technologies do not have in a specific environment. In conjunction with these advantages and the support of the mobile communication industry, NB-IoT has become an IoT device connected to Ideal for the cloud. After years of development, the NB-IoT standard was formulated in June 2016 and became part of the thirteenth edition of the 3GPP. This is a narrowband technology that only uses a 180 kHz bandwidth. Therefore, its data transfer rate is only approximately 27.2 kbit/s download and 62.5 kbit/s upload. Although this transmission volume is much lower than Wi-Fi, Bluetooth or high-end cellular technologies, it is more than enough for many IoT applications that only need to transmit status information.
Although NB-IoT just completed standardization in 2016, it has been used in the market to realize the IoT vision of a modern networked city. Many Western countries have completed several field tests, which fully prove that NB-IoT is an ideal solution for urban IoT applications, as shown in Tab. 3. One of the primary tasks of IoT is to promote the effective monitoring and allocation of resources to realize a smarter and more efficient world. The problem with traditional Wi-Fi, Bluetooth, and cellular technologies is that their transmission distance, power consumption, or cost characteristics can truly realize this vision. The main reason for the strengths that NB-IoT brings in metropolitan environments is that it has features that can complement traditional wireless technologies. This provides the transmission distance of cellular technology, the cost-effectiveness of Bluetooth, and unmatched indoor penetration so that the signal is not affected by urban obstacles and the transmission is unimpeded, as shown in Tab. 4 [6].

In recent years, the application of IoT in smart greenhouses has become increasingly widespread. This includes its application to planting technology through hydroponics [7], which replaces the soil with a nutrient-rich solution to eliminate bacteria from the soil. For impurities, these use various sensors connected to a Raspberry Pi with programs written in Python that send the data to the cloud or mobile app for observations. Thus, the difficult technology of hydroponics can be realized, as shown in Fig. 3a.
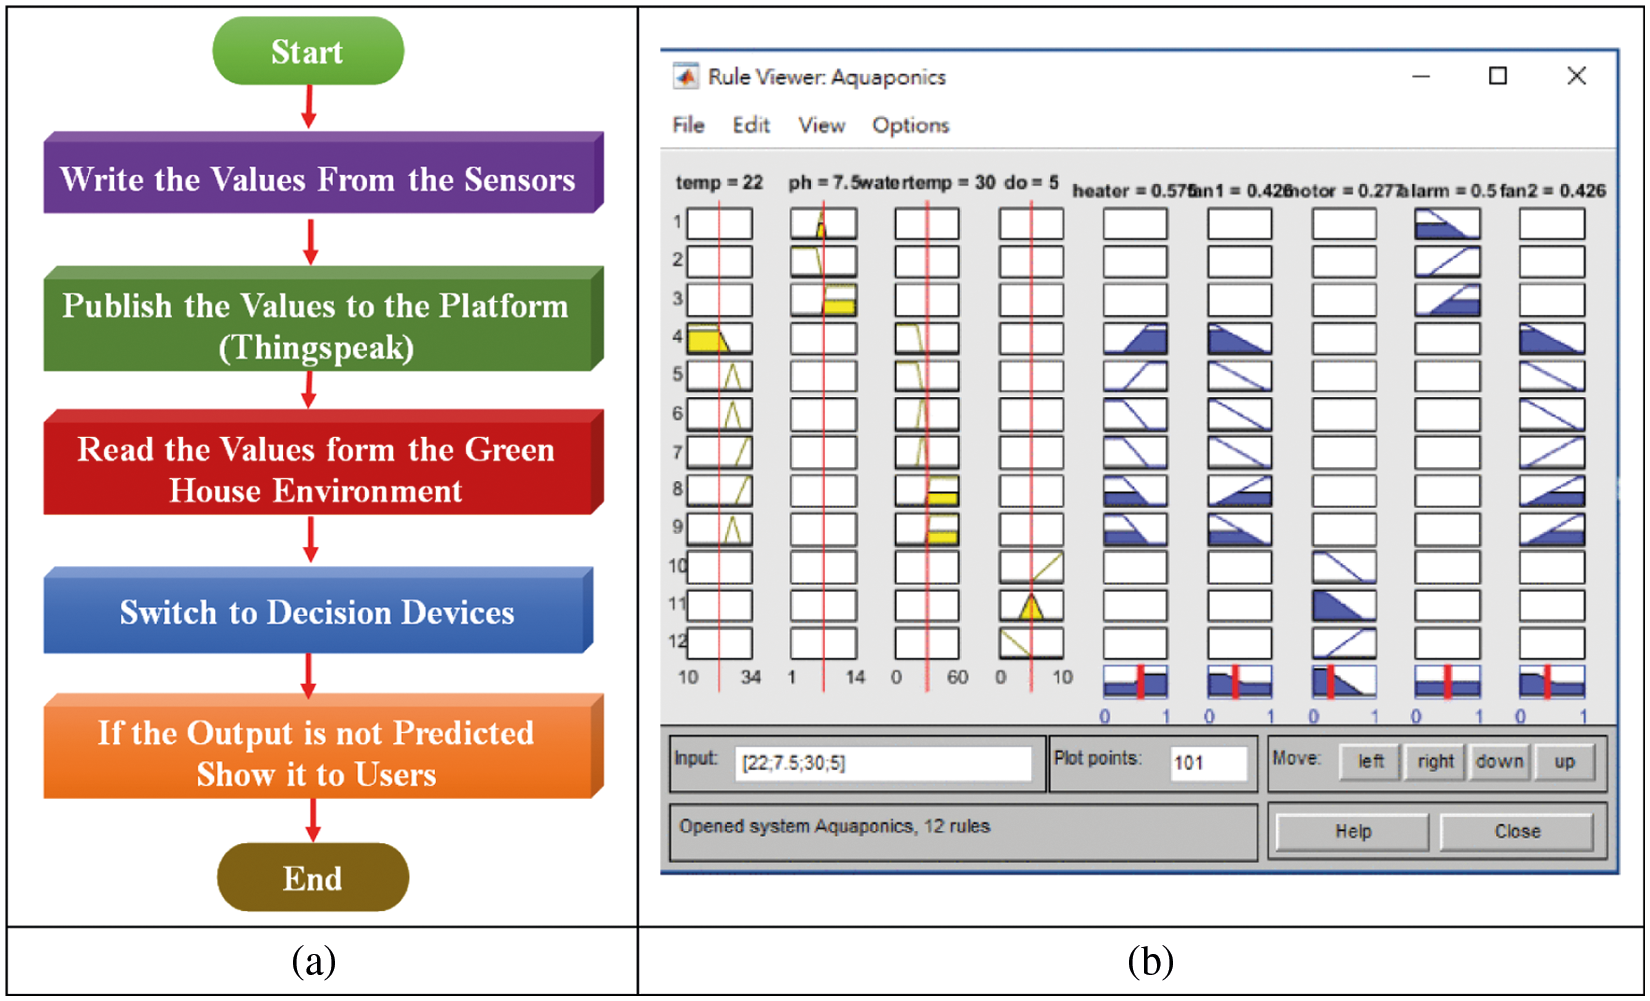
Figure 3: (a) Schematic of the system structure and (b) MATLAB output of the fuzzy rule viewer
The software has gradually added mathematical theories, such as fuzzy theory rules, to help users obtain more precise data and better judge and make decisions, as shown in Fig. 3b [8,9]. The IoT network layer gradually promotes NB-IoT, which is a transmission technology with long transmission distances, low power consumption, and low cost. According to market surveys and inferences, the utilization rate of NB-IoT will reach 48% in 2018–2025. The NB-IoT has a good performance when used for either monitoring and control or a broader smart city, but it is a relatively new technology and its application is not yet mature, which still brings many challenges and problems to be overcome, as shown in Fig. 4 [10–12].
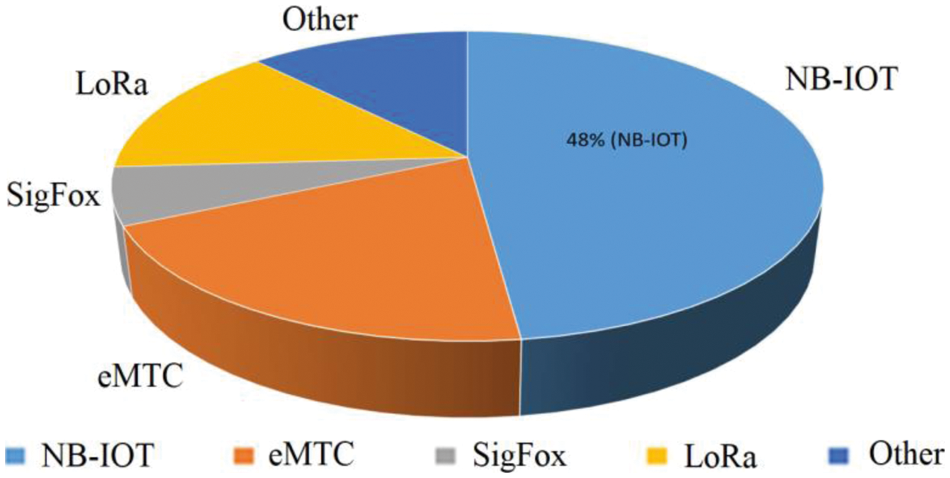
Figure 4: Estimated 2018–2025 LPWAN usage proportion
This research uses the concepts of IoT and smart greenhouses to construct system architecture. The architecture is divided into a sensing layer, network layer, and application layer. The greenhouse environmental sensing includes temperature, humidity, light intensity, and soil moisture sensors, as shown in Fig. 5a.
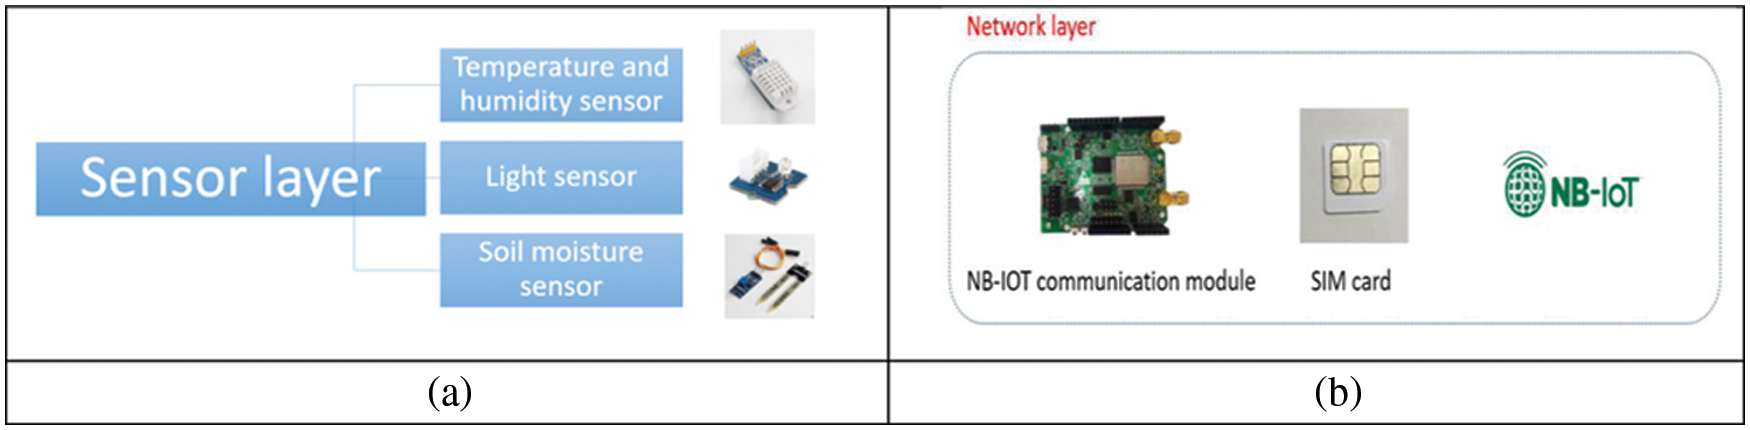
Figure 5: (a) Sensor layer and (b) network layer in the smart greenhouse
The network layer uses the NB-IoT communication module with the Subscriber Identity Module (SIM) card to transmit data received by the sensors, as shown in Fig. 5b. The NB-IoT communication module uses the Universal Asynchronous Receiver/Transmitter (UART) interface and can use attention (AT) Commands. In Fig. 6a, the International Mobile Equipment Identity (IMEI) and International Mobile Subscriber Identity (IMSI) of the SIM card are queried, and the communication module is set to a smart state before finally confirming the current signal strength to ensure there are no network transmission problems [13].
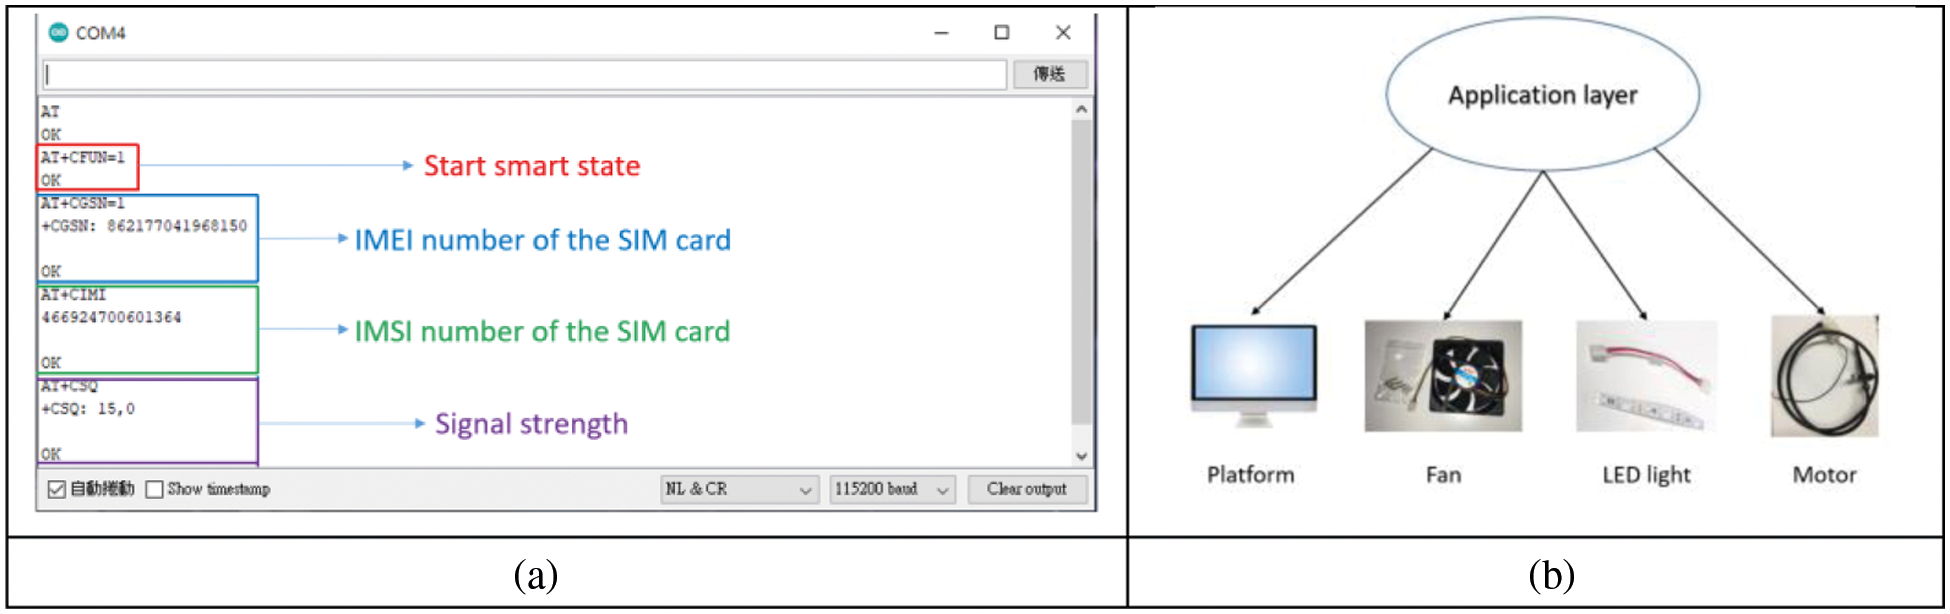
Figure 6: (a) UART interface and (b) application layer
The application layer displays the received data from the web platform, which can also send specific instructions from the platform to operate hardware devices, such as fans, motors, and LED lights, as shown in Fig. 6b. The entire system transfers data received by the various sensors to the web platform through the NB-IoT communication module using a SIM card, as shown in Fig. 7a. On the other hand, this can be connected via a Bluetooth Mobile APP to see whether the data transmission and reception are working properly. The signal strength and received data are monitored through the web platform for analysis and comparisons, which can also be exported to Excel for easy recording. Finally, users can send commands from the platform to control the hardware, as shown in Fig. 7b [14].
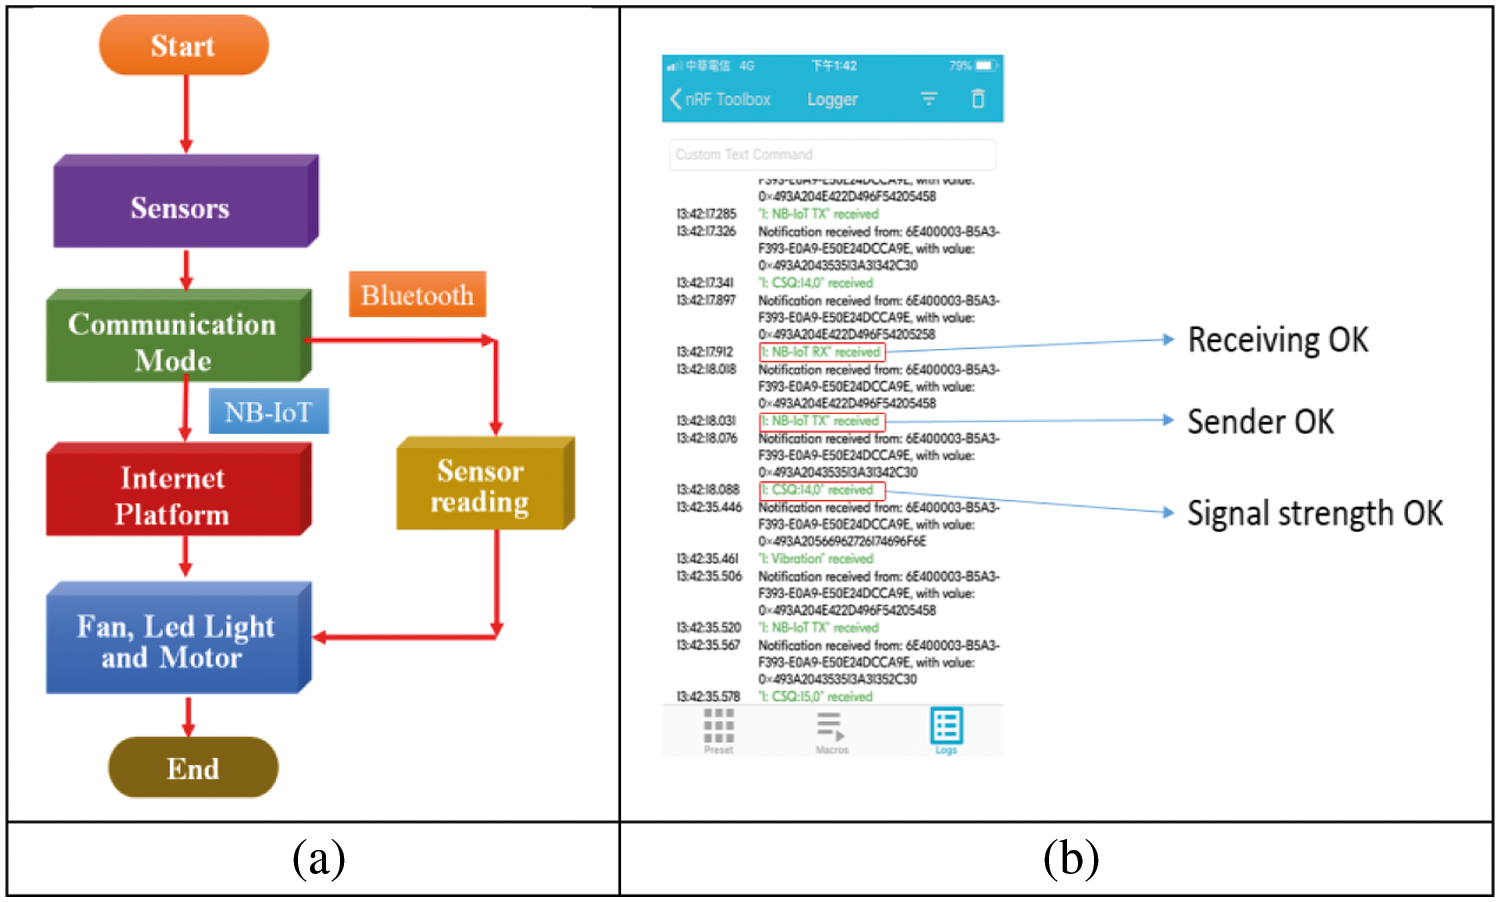
Figure 7: (a) System flow chart and (b) mobile APP interface
3.2 NB-IoT Communication Module
This study uses the NB-IoT communication module as the main development version. In Fig. 8a, the power supply module allocates different voltages to those required by each hardware device. Finally, the relay module is also a switch to control the fan, LED light bar, and motor [15].

Figure 8: (a) NB-IoT communication module and (b) power supply module
The power supply modules used have 3.3, 5, and 12 V outputs. The 3.3 V is supplied to the sensor, the 5 V is supplied to the NB-IoT communication, motor, and relay modules, and the 12 V is supplied to the fan and LED light bar, as shown in Fig. 8b [16].
We use the HW-316 relay module, as shown in Fig. 9a. This uses the input signal as the basis for the switch so that the program can control it instead of manual switching. The general relay structure will have a Common (COM) point and selects high or low potential for conduction based on user input, as shown in Fig. 9b [17].
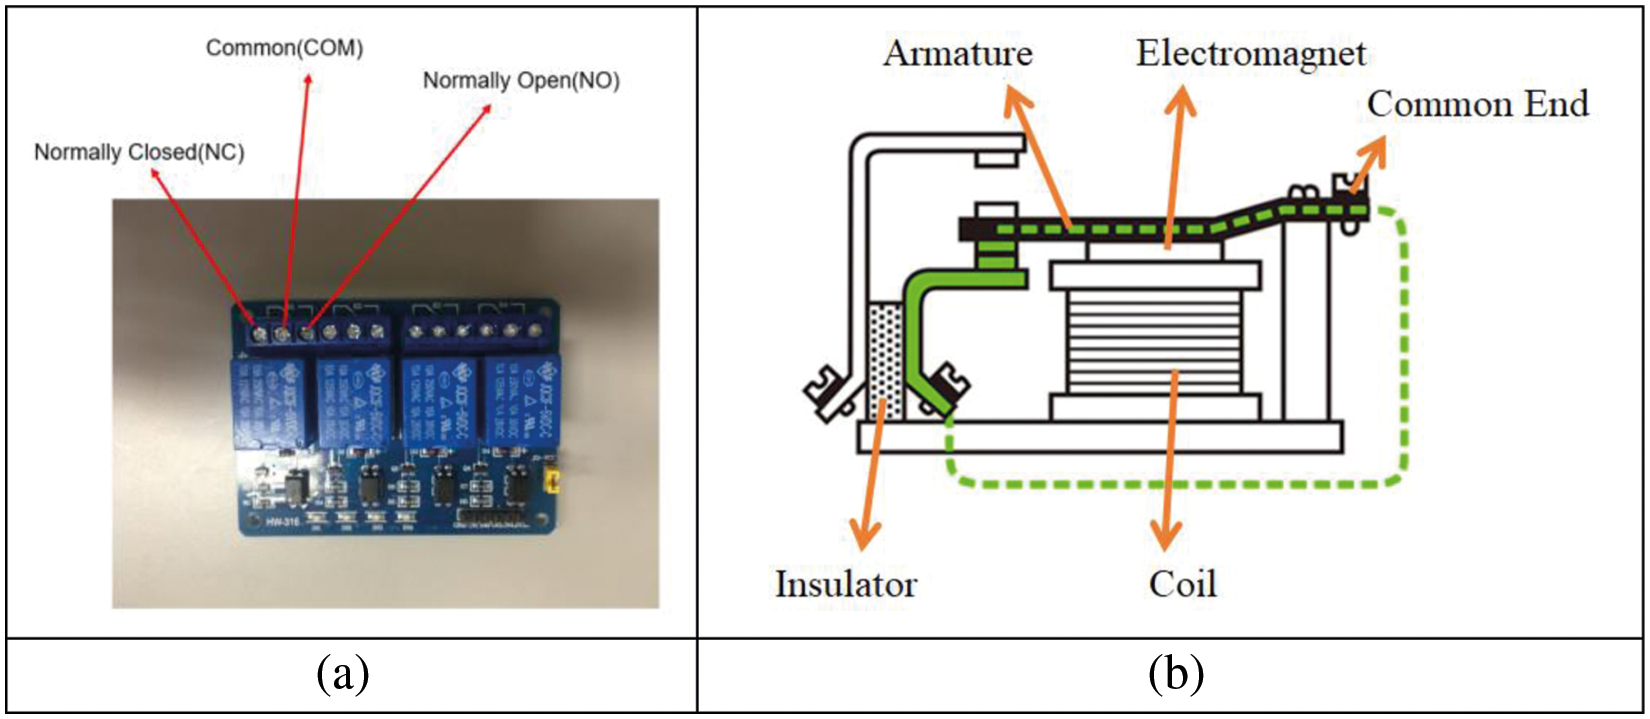
Figure 9: (a) HW-316 relay module and (b) relay structure as an energized coil
The temperature and humidity sensors use the DHT22, as shown in Fig. 10a, with a working voltage of 3.3–5 V. The light sensor is from Grove-Light, as shown in Fig. 10b, with a working voltage of 3–5 V. The soil sensor is an LM393 soil moisture sensing module, as shown in Fig. 10c, with a working voltage of 3.3–5 V [18].
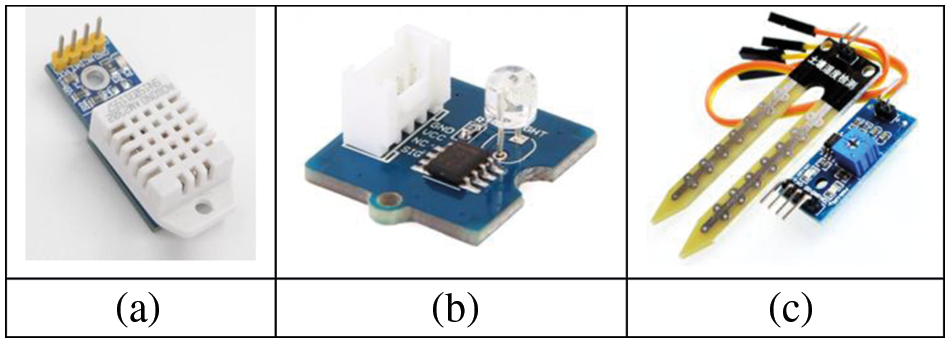
Figure 10: (a) Temperature and humidity sensors, (b) light sensor, and (c) soil moisture sensor
The controlled parts are the fan, LED light bar, and motor, as shown in Figs. 11a–11c, respectively. The specific instructions issued through the web platform are given to the relay module through the NB-IoT communication module to the input signals, which then control their switches [19,20].
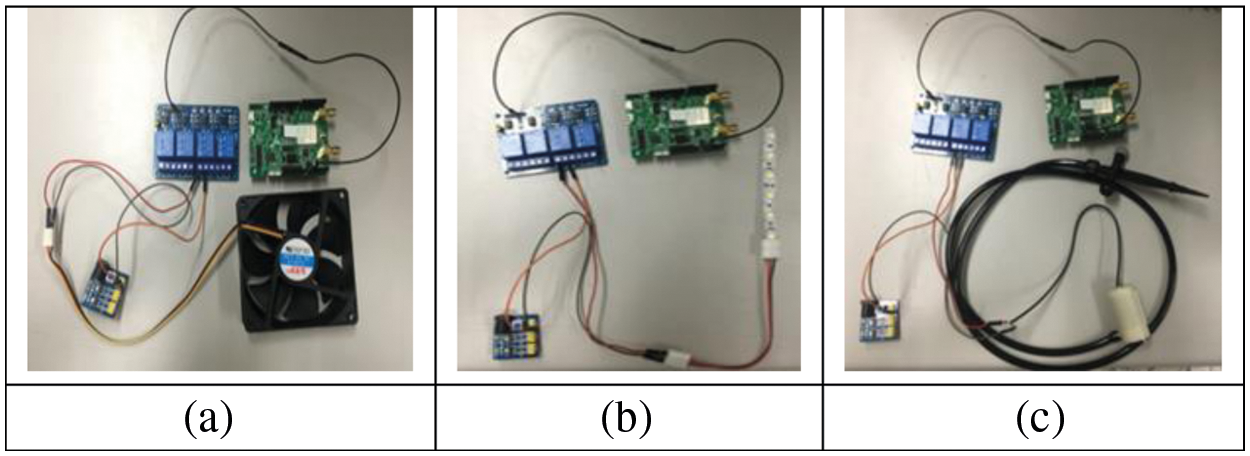
Figure 11: Controller modules for the (a) fan, (b) LED light bar, and (c) motor
3.7 Data Fusion Algorithm Based on Logistic Regression
The basic principle of logistic regression is to establish a logistic function (i.e., Sigmoid) between the content to be predicted and one or more features, which then estimates the probability. The model parameters are continuously optimized through repeated calculations to verify the pros and cons of the classification prediction model. The logistic regression process usually goes through the following three steps [21,22]:
(1) Construct a basic prediction function h(x):
The Sigmoid function maps the infinite continuous results to a probability value within (0, 1). The Sigmoid function is shown as:
The argument is a set of vectors, as:
Then, the prediction function h(x) is shown as:
(2) Construct the loss function j(θ):
The prediction function represents the probability that the classification result is 1, and the probability can be comprehensively expressed as:
Then, the likelihood function l(θ) can be obtained as:
When the θ of max(l(θ)) is obtained, the loss function j(θ) is shown as:
(3) When the loss function j(θ) is minimized, the regression parameter
Assuming a sensor network with n sensors and 1 observation target, the data fusion algorithm based on logistic regression can be decomposed into the following 4 steps [23,24]:
(1) Build sensor model
The establishment of the sensor model mainly uses the non-deterministic polynomial (NP) complexity criterion to decide whether the target exists and to find the attenuation between the target and sensor due to noise. In practical applications, as the sensor and target characteristics to be observed have been set in advance, the characteristics of the sensor are the primary concern.
(2) Design logistic regression fusion rules
The prediction function of the logistic regression is shown in Eq. (3), where θ represents the weight vector, x represents the number of identifiable sensors n, and the value received by the fusion center is:
The sum classification result is the number of l’s or the performance value of the sensor. When the number of sensors is constant, the parameter form in the logistic regression prediction function is:
When the number of sensors is variable, the parameter form of the logistic regression prediction function is:
(3) Fusion algorithm for basic logistic regression
According to the construction process of the loss function in the logistic regression algorithm and considering the independence of the information in the sensor network, the maximum likelihood function can be modified as:
Then, the regression parameters can be solved by minimizing the loss function as:
where j(θ) is the loss function.
(4) Analyze the logistic regression algorithm with a certain and uncertain number of sensors and select appropriate logistic regression parameters as the criteria for data fusion
The advantage of this algorithm from the perspective of the implementation process of data fusion based on logistic regression is that there are fewer data calculations, the calculations are not difficult, and the algorithm is easily implemented [25].
4 Experimental Results and Analysis
In Fig. 12, the GUIs visually represent the air humidity, temperature, soil humidity, and illuminance. Each data stream is recorded in the form of a graph, as shown in Figs. 13a and 13b. Thus, the time point of the data transmission can be determined.
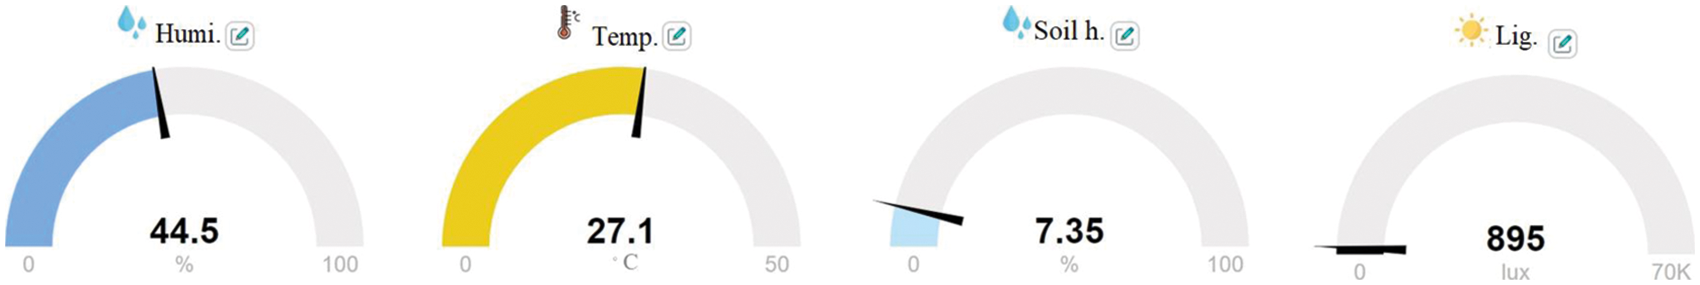
Figure 12: Sensor visual display

Figure 13: (a) Air temperature and humidity curves and (b) illumination and soil moisture curves
The comparison chart monitored by the above experiment suggests that there are obvious and reasonable changes. The data are uploaded every 5 min, and the equipment is disconnected in rainy environments. Therefore, there are three comparison charts where no data were uploaded for a short period at noon, and no data were transmitted between 2:00 and 2:25 pm. We also received the wrong alert on the mobile app that told us to check the SIM card status, as shown in Fig. 14.
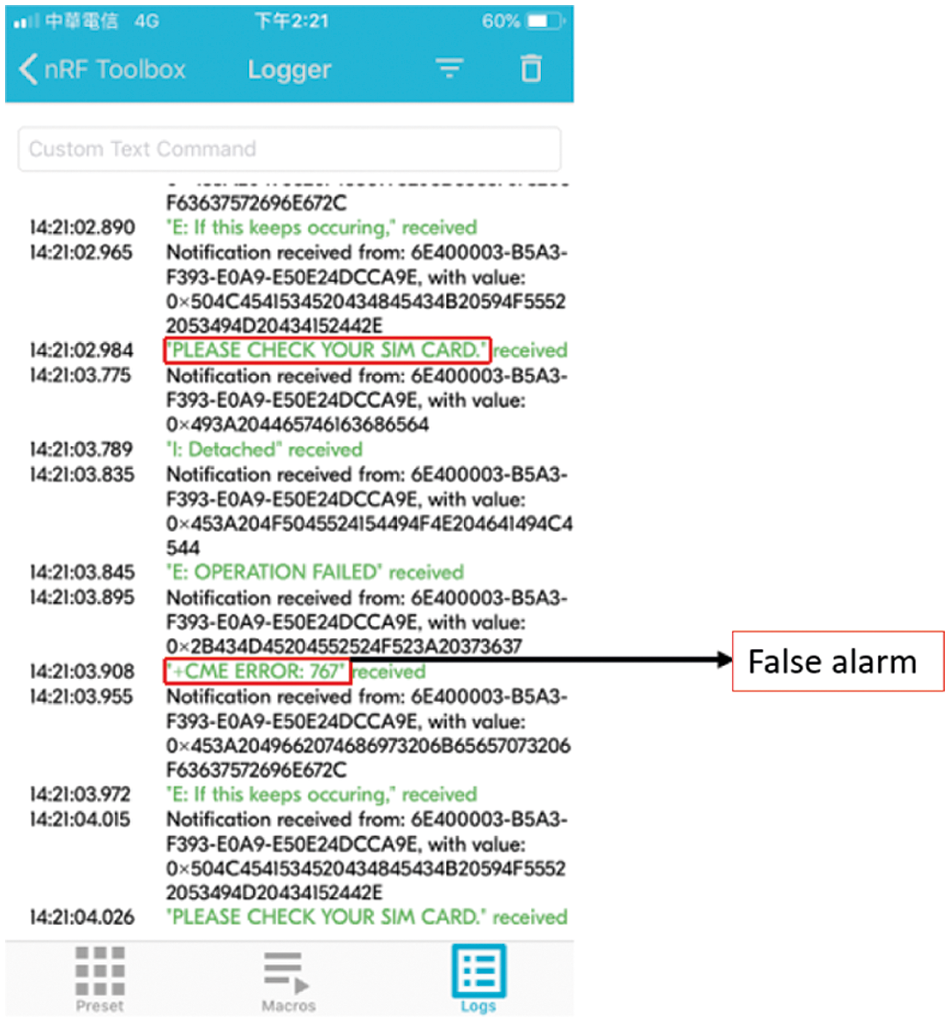
Figure 14: Output from the mobile APP that returned an error alert
Experiments were performed in different environments: normal indoor and simulated rain. The experiments simulated a normal indoor environment from 9:10 am to 12:00 pm and simulated rain from 12:00 pm until 4 pm. The export function on the network platform was used to access the data as an Excel file and present it in the form of a discount graph to better show the air temperature, humidity, and soil humidity. Fewer than two different environmental test comparison charts were generated, as shown in Fig. 15. In a typical room temperature environment, the temperature was mostly maintained in the range of 27–28°C. In the simulated rainy environment, the temperature plummeted to the range of 23–25°C after noon.
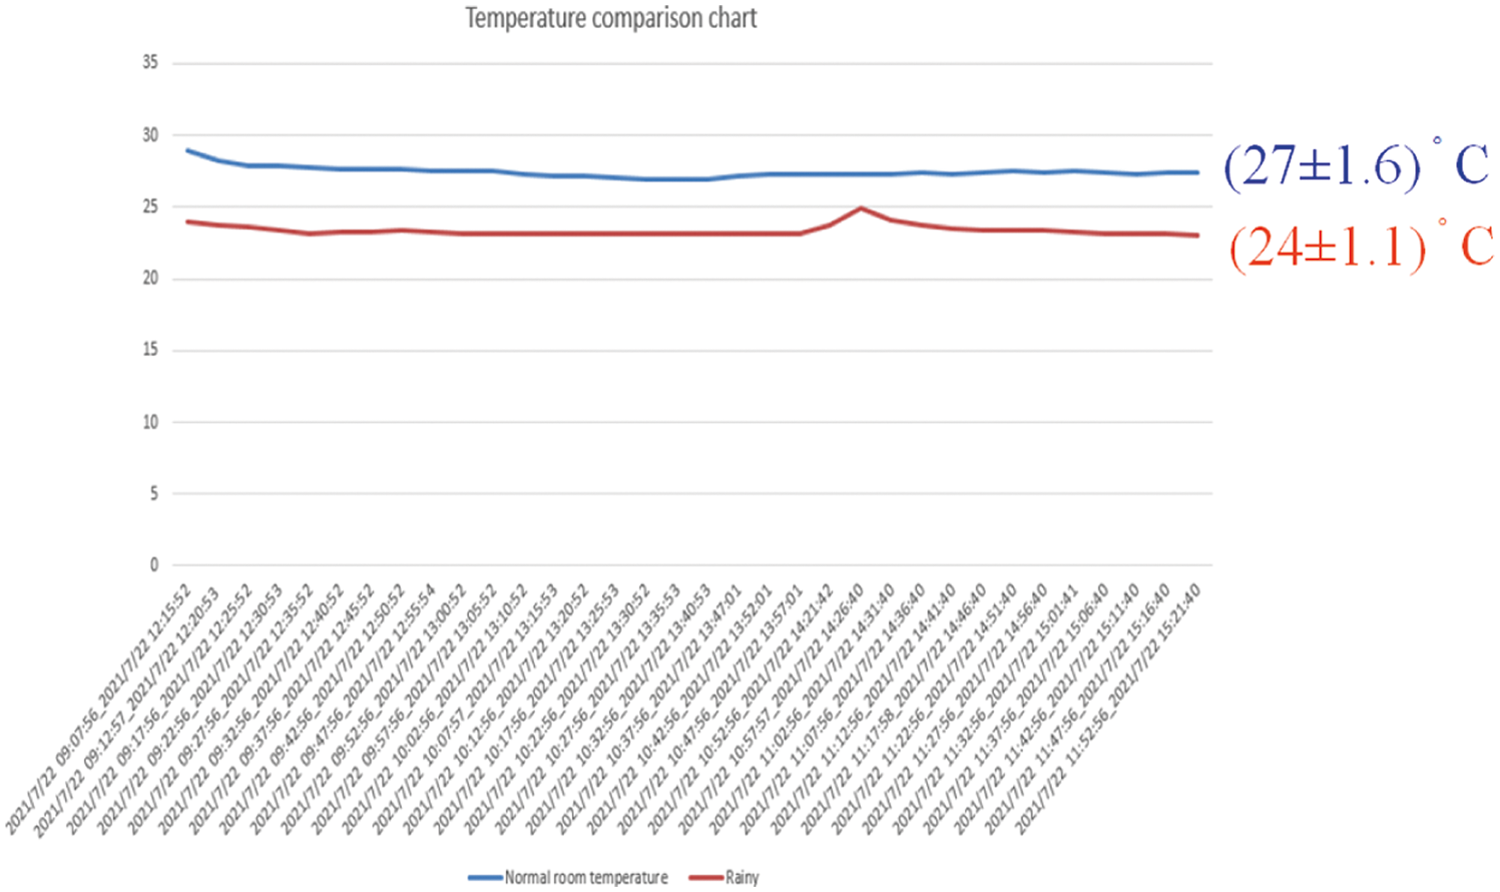
Figure 15: Temperature comparison chart for indoor and rainy environments
Fig. 16 compares the humidities in indoor and rainy environments. Indoors, the humidity is mostly in the range of 40%–50%, but it reaches 80%–90% in the simulated rainy environment.
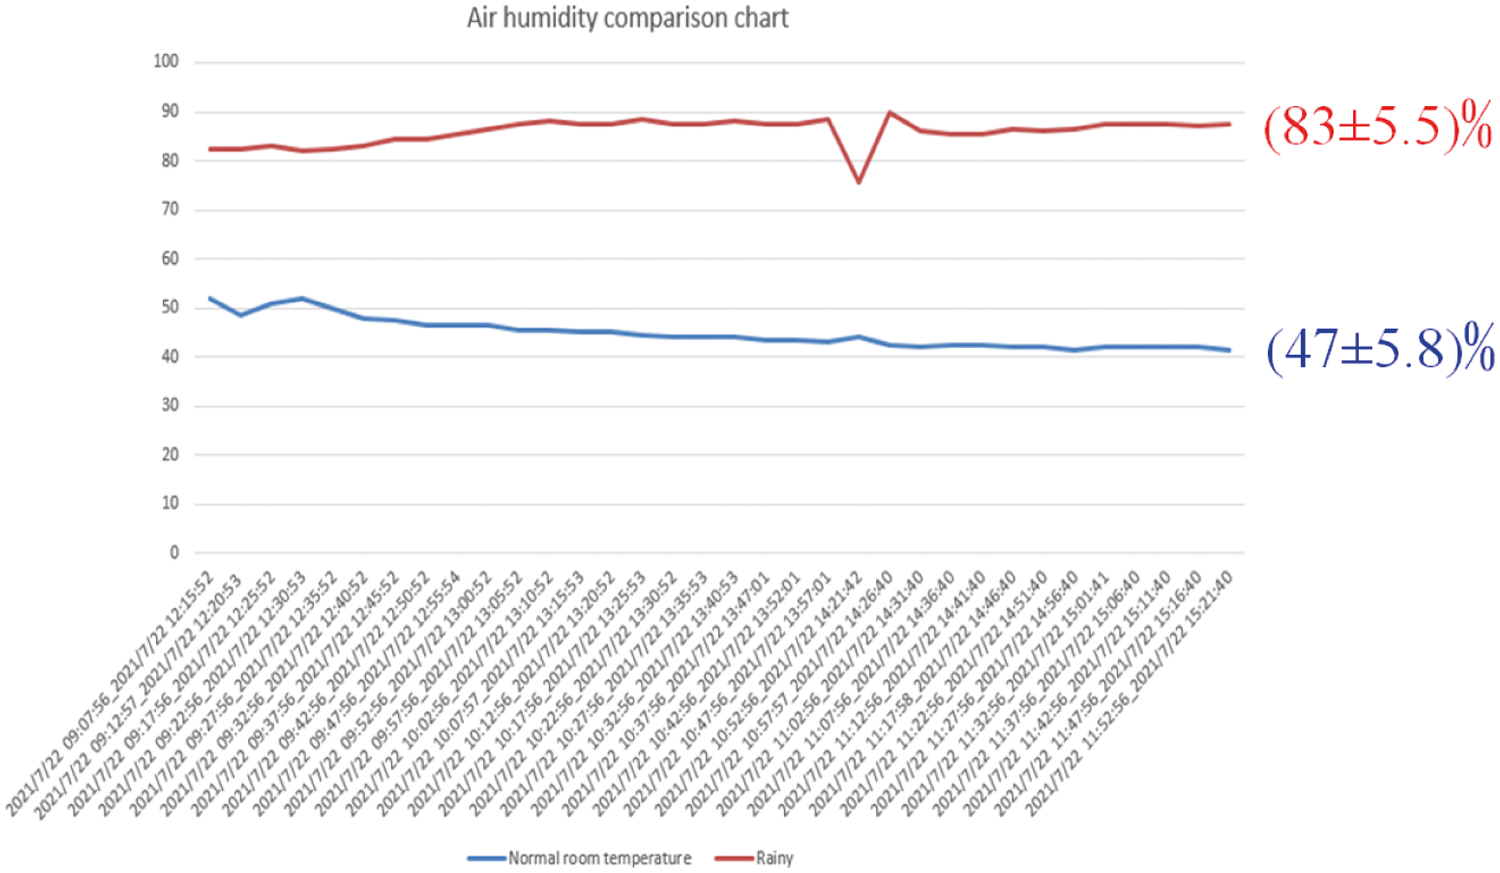
Figure 16: Air humidity comparison chart for indoor and simulated rainy environments
Fig. 17 compares the soil moistures in indoor and simulated rainy environments. Indoors, the soil moisture is mostly maintained in the range of 60%–65%. In the rainy environment, the soil moisture soars to the range of 95%–100%, which is a state of being too wet.

Figure 17: Soil moisture comparison chart for indoor and simulated rainy environments
The control part of the greenhouse is shown Figs. 18a and 18b. The former is the web platform interface to control the screen displayed by the fan, and the latter is fan wiring.

Figure 18: (a) Control interface and (b) wiring diagram for the fan
Fig. 19a shows the sensing statistics of the three-axis accelerator. This device in the green energy smart house lets users understand the position of the green energy greenhouse environment in three-dimensional space and detects whether it has moved tilted, etc. This informs the user whether the location of the greenhouse is proper. Fig. 19b shows the battery power consumption of the green energy greenhouse.

Figure 19: (a) Statistics of the three-axis accelerator (b) system battery power consumption
The simulations were performed in a 1000 m × 2500 m network when measuring the elapsed time to run the algorithms. The setup has 250 nodes with a communication range of 30 m. As shown in Fig. 20, the simulations were performed with 100–1200 s intervals. The results suggest that the proposed method (logistic regression fusion) took less time during the simulations. This condition is difference between this method and traditional data fusion (feature fusion) increases with time [26].
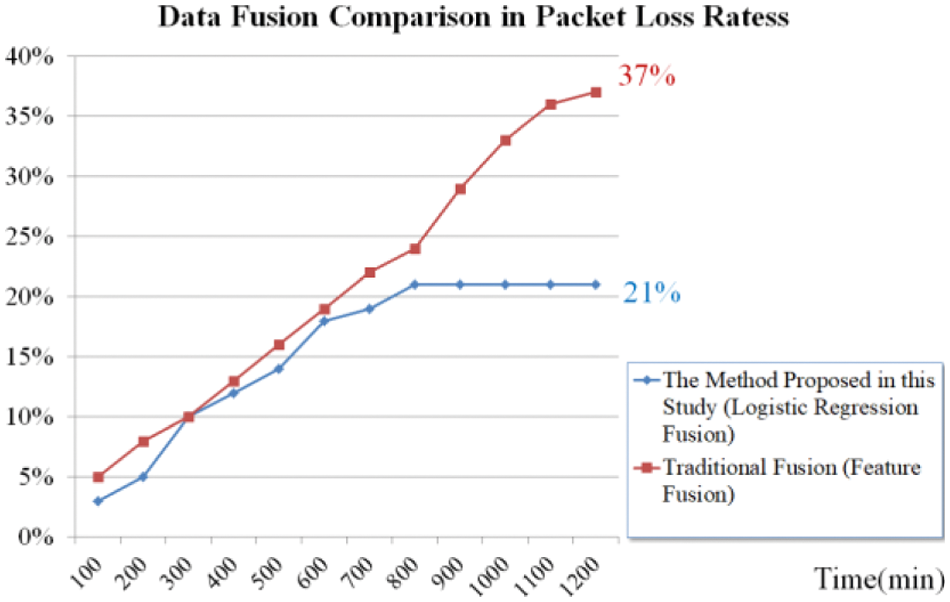
Figure 20: Comparison of the packet loss rate execution times between the proposed method (logistic regression fusion) and the traditional data fusion (feature fusion) in a 1000 m × 2500 m IoT for 1200 s
From the figure, the percentage of remaining power consumption can be used. Fig. 21 is a schematic diagram of the prototype for the green energy greenhouse.

Figure 21: Prototype of the green energy greenhouse
The channel mean square error (MSE) performance comparison of the proposed RL algorithm with the conventional data fusion algorithm is shown in Fig. 22a. The simulation curves are taken by averaging 10,000 independent channel realizations. The simulation curves suggest that the additional SNR from the proposed algorithm is approximately 3.7 dB at an MSE of 10−3 compared to the conventional data fusion method. The block error rate (BLER) performance curves of the given downlink NB-IoT systems based on different channel estimators are depicted in Fig. 22b. The proposed RL algorithm performs better than the traditional data fusion algorithm by about 3.2 dB SNR at a BLER of 10−1, which proves its superiority [27–29].
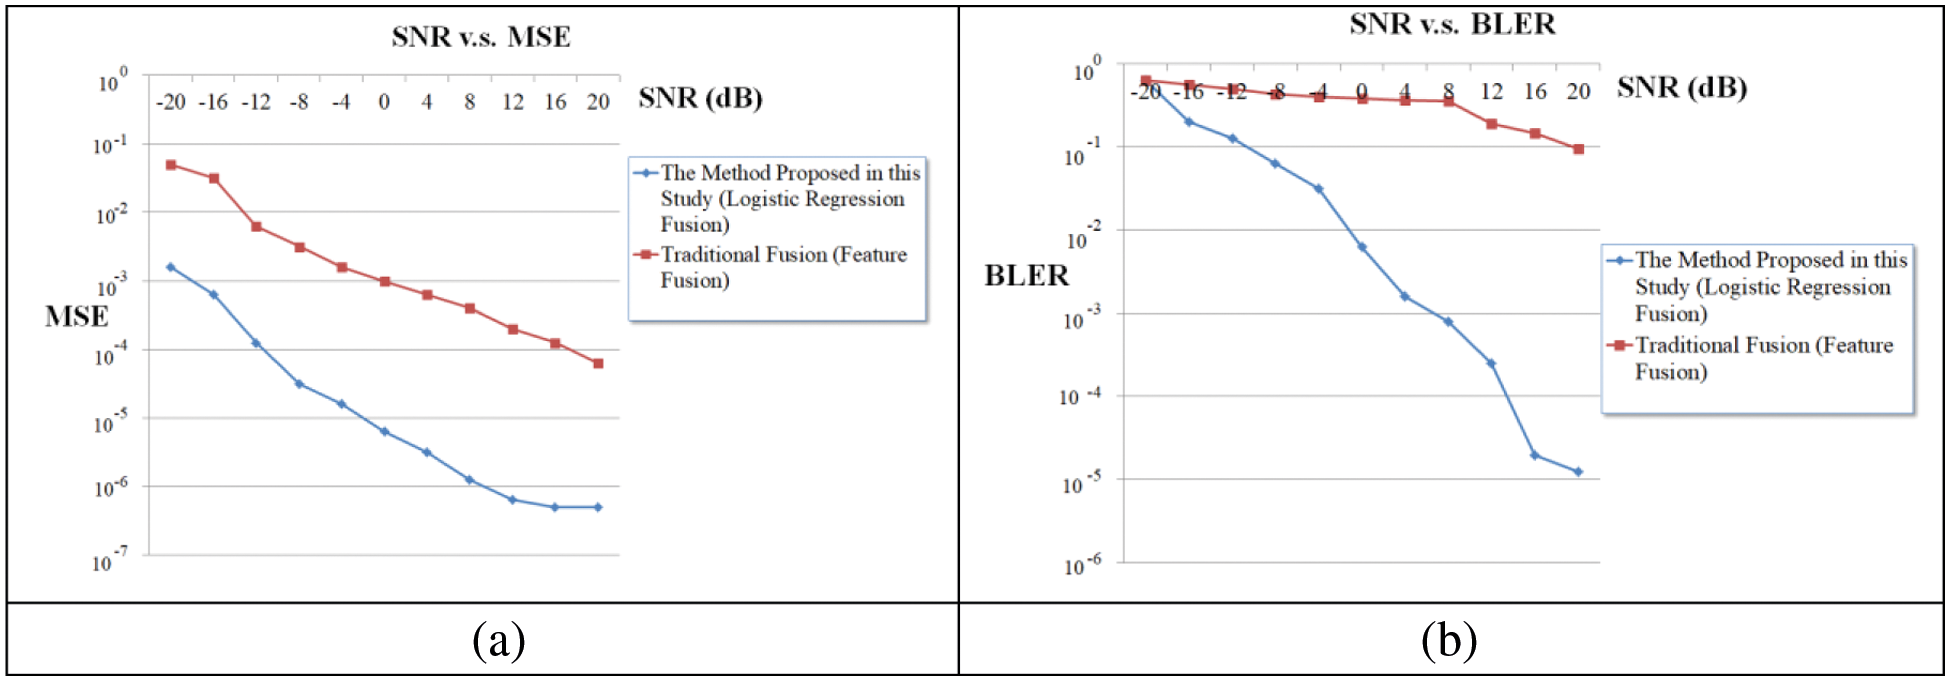
Figure 22: (a) MSE performance curves and (b) BLER performances for the different algorithm estimators
5 Conclusions and Future Works
To cope with changing climates caused by global warming, agriculture has focused increasingly on greenhouse technology. With the advancement of science and technology, various industries have developed new ways to maximize benefits. Therefore, this article uses the NB-IoT communication module and proposes logistic regression fusion with low cost, low power consumption, strong penetrating power, and wide coverage to match various sensors that collect and store data and send it to the platform. This allows timely visual monitoring and can issue specific instructions on the platform to operate equipment, such as fans and motors, to achieve a two-way controlled smart small greenhouse. The future development of this research will use cloud technology to network and transmit the measured data to the cloud for monitoring as a network of multiple greenhouse stations.
Acknowledgement: This research was supported by the Department of Electrical Engineering at the National Chin-Yi University of Technology. The authors would like to thank the National Chin-Yi University of Technology, Takming University of Science and Technology, Taiwan, for supporting this research.
Funding Statement: The authors received no specific funding for this study.
Conflicts of Interest: The authors declare that they have no conflicts of interest to report regarding the present study.
1. B. Bajic, A. Rikalovic, N. Suzic and V. Piuri, “Industry 4.0 implementation challenges and opportunities: A managerial perspective,” IEEE Systems Journal, vol. 15, no. 1, pp. 546–559, 2021. [Google Scholar]
2. Y. Liu, X. Ma, L. Shu, G. P. Hancke and A. M. Abu-Mahfouz, “From industry 4.0 to agriculture 4.0: Current status, enabling technologies, and research challenges,” IEEE Transactions on Industrial Informatics, vol. 17, no. 6, pp. 4322–4334, 2021. [Google Scholar]
3. M. L. Liya and D. Arjun, “A survey of LPWAN technology in agricultural field,” in Proc. 2020 Fourth Int. Conf. on I-SMAC (IoT in Social, Mobile, Analytics and Cloud), Palladam, India, pp. 313–317, 2020. [Google Scholar]
4. J. Jose and T. Sasipraba, “Indoor air quality monitors using IoT sensors and LPWAN,” in Proc. 2019 3rd Int. Conf. on Trends in Electronics and Informatics (ICOEI), Tirunelveli, India, pp. 633–637, 2019. [Google Scholar]
5. L. Chettri and R. Bera, “A comprehensive survey on internet of things (IoT) toward 5G wireless systems,” IEEE Internet of Things Journal, vol. 7, no. 1, pp. 16–32, 2020. [Google Scholar]
6. D. Xiong, Y. Chen, X. Chen, M. Yang and X. Liu, “Design of power failure event reporting system based on NB-IoT smart meter,” in Proc. 2018 Int. Conf. on Power System Technology (POWERCON), Guangzhou, China, pp. 1770–1774, 2018. [Google Scholar]
7. S. Sakphrom and S. K. Korkua, “Simplified stream discharge estimation for hydrological application based on NB-IoT deployment,” in Proc. 2019 10th Int. Conf. of Information and Communication Technology for Embedded Systems (IC-ICTES), Bangkok, Thailand, pp. 1–5, 2019. [Google Scholar]
8. S. Cho, H. Kim and G. Jo, “Determination of optimum threshold values for NPRACH preamble detection in NB-IoT systems,” in Proc. 2018 Tenth Int. Conf. on Ubiquitous and Future Networks (ICUFN), Prague, Czech Republic, pp. 616–618, 2018. [Google Scholar]
9. Y. B. Lin, H. C. Tseng, Y. W. Lin and L. J. Chen, “NB-IoTtalk: A service platform for fast development of NB-IoT applications,” IEEE Internet of Things Journal, vol. 6, no. 1, pp. 928–939, 2019. [Google Scholar]
10. N. Zhang and Y. Liu, “NB-IoT drives intelligent cold chain for best application,” in Proc. 2019 IEEE 9th Int. Conf. on Electronics Information and Emergency Communication (ICEIEC), Beijing, China, pp. 188–191, 2019. [Google Scholar]
11. M. Praveen and V. Harini, “NB-IoT based smart car parking system,” in Proc. 2019 Int. Conf. on Smart Structures and Systems (ICSSS), Chennai, India, pp. 1–5, 2019. [Google Scholar]
12. T. Li and P. Hou, “Application of NB-IoT in intelligent fire protection system,” in Proc. 2019 Int. Conf. on Virtual Reality and Intelligent Systems (ICVRIS), Jishou, China, pp. 203–206, 2019. [Google Scholar]
13. Y. Li, C. Zheng and S. Wang, “Efficient one M2M protocol conversion platform based on NB-IoT access,” China Communications, vol. 16, no. 11, pp. 56–69, 2019. [Google Scholar]
14. H. Sui, G. Zheng, J. Zhou, H. Li and Z. Gu, “Application of NB-IoT technology in city open water monitoring,” in Proc. 2020 6th Int. Symposium on System and Software Reliability (ISSSR), Chengdu, China, pp. 95–98, 2020. [Google Scholar]
15. Y. Li, H. Wang, X. Jin, J. Ma and C. Zhang, “Research on information collection technology of power information assets based on NB-IoT,” in Proc. 2019 2nd Int. Conf. on Information Systems and Computer Aided Education (ICISCAE), Dalian, China, pp. 1–5, 2019. [Google Scholar]
16. W. Choi, I. Galkin, S. Lee, J. Park, J. Lee et al., “Efficient NB-IoT and GNSS chipset solution,” in Proc. 2019 26th IEEE Int. Conf. on Electronics, Circuits and Systems (ICECS), Genoa, Italy, pp. 719–722, 2019. [Google Scholar]
17. Y. Yin, L. Xiong, Y. Zhu, B. Chen, H. Min et al., “A compact dual-band digital Doherty power amplifier using parallel-combining transformer for cellular NB-IoT applications,” in Proc. 2018 IEEE Int. Solid-State Circuits Conf. -(ISSCC), San Francisco, CA, USA, pp. 408–410, 2018. [Google Scholar]
18. M. S. Ali, M. K. H. Jewel and F. Lin, “An efficient channel estimation technique in NB-IoT systems,” in Proc. 2018 IEEE Int. Conf. on Integrated Circuits, Technologies and Applications (ICTA), Beijing, China, pp. 22–23, 2018. [Google Scholar]
19. Y. C. P. Chang, S. Chen, T. J. Wang and Y. Lee, “Fog Computing node system software architecture and potential applications for NB-IoT industry,” in Proc. 2016 Int. Computer Symposium (ICS), Chiayi, Taiwan, pp. 727–730, 2016. [Google Scholar]
20. Z. Wang, F. Wang, H. Liu, Z. Qian and Z. Bi, “Design of human health monitoring system based on NB-IoT,” in Proc. 2019 IEEE 3rd Advanced Information Management, Communicates, Electronic and Automation Control Conf. (IMCEC), Chongqing, China, pp. 6–9, 2019. [Google Scholar]
21. S. Kawata, S. Takahashi and T. Hagiwara, “Visibility level estimation in winter CCTV images based on decision level fusion using logistic regression,” in Proc. 2020 IEEE 9th Global Conf. on Consumer Electronics (GCCE), Kobe, Japan, pp. 640–641, 2020. [Google Scholar]
22. X. Hu, Y. Yang, S. Zhu and L. Chen, “Research on a hybrid prediction model for purchase behavior based on logistic regression and support vector machine,” in Proc. 2020 3rd Int. Conf. on Artificial Intelligence and Big Data (ICAIBD), Chengdu, China, pp. 200–204, 2020. [Google Scholar]
23. H. Kong, S. Lin, J. Wu and H. Shi, “The risk prediction of mobile user tricking account overdraft limit based on fusion model of logistic and GBDT,” in Proc. 2019 IEEE 3rd Information Technology, Networking, Electronic and Automation Control Conf. (ITNEC), Chengdu, China, pp. 1012–1016, 2019. [Google Scholar]
24. C. Chen and J. Zhou, “Data association via logistic regression model for multiple target tracking problems,” in Proc. 2017 20th Int. Conf. on Information Fusion, Xi’an, China, pp. 1–6, 2017. [Google Scholar]
25. R. Chen, M. Hawes, O. Isupova, L. Mihaylova and H. Zhu, “Online vehicle logo recognition using Cauchy prior logistic regression,” in Proc. 2017 20th Int. Conf. on Information Fusion, Xi’an, China, pp. 1–8, 2017. [Google Scholar]
26. B. Mazumder, S. M. T. Islam and M. M. Rahman, “Non-subsampled shearlet entropy and logistic regression based multiple sclerosis detection,” in Proc. 2020 2nd Int. Conf. on Advanced Information and Communication Technology (ICAICT), Dhaka, Bangladesh, pp. 105–110, 2020. [Google Scholar]
27. M. A. Islam, D. T. Anderson, A. J. Pinar, T. C. Havens, G. Scott et al., “Enabling explainable fusion in deep learning with fuzzy integral neural networks,” IEEE Transactions on Fuzzy Systems, vol. 28, no. 7, pp. 1291–1300, 2020. [Google Scholar]
28. N. Kussul, A. Shelestov, M. Lavreniuk, I. Butko and S. Skakun, “Deep learning approach for large scale land cover mapping based on remote sensing data fusion,” in Proc. 2016 IEEE Int. Geoscience and Remote Sensing Symposium (IGARSS), Beijing, China, pp. 198–201, 2018. [Google Scholar]
29. W. Wang and M. Zhang, “Tensor deep learning model for heterogeneous data fusion in internet of things,” IEEE Transactions on Emerging Topics in Computational Intelligence, vol. 4, no. 4, pp. 32–41, 2020. [Google Scholar]
 | This work is licensed under a Creative Commons Attribution 4.0 International License, which permits unrestricted use, distribution, and reproduction in any medium, provided the original work is properly cited. |