DOI:10.32604/iasc.2023.025303
| Intelligent Automation & Soft Computing DOI:10.32604/iasc.2023.025303 | |
| Article |
Modified Satin Bowerbird for Distributed Generation in Remotely Controlled Voltage Bus
Department of Electrical and Electronics Engineering, Government College of Engineering, Salem, Tamil Nadu, 636011, India
*Corresponding Author: K. Dharani Sree. Email: dharanisreephd@gmail.com
Received: 19 November 2021; Accepted: 22 February 2022
Abstract: The distributed generators in the radial distribution network are to improve the Grid performance and its efficiency. These Distributed Generators control the PV bus; it is converted as a remote controlled PVQ bus. This PVQ bus reduces the power loss and reactive power. Initially, the distributed generators were placed in the system using mathematical modelling or the optimization. This approach improves the efficiency but it has no effect in loss minimization. To minimize the loss the reconfigured network with Genetic algorithm based Distributed generator placement proposed as existing work. This approach minimizes the loss effectively; but the genetic algorithm takes more time for DG placement. Hence, in this, the network reconfiguration is performed using a modified Satin bower bird algorithm after DG placement and DG sizing. Initially, the sensitive analysis applied the load flow analysis to identify the optimal placement for the distributed generator. Then, the modified Satin Bowerbird (SBO) used for the network reconfiguration. This approach minimizes the loss of effectively by combining the network reconfiguration process. The proposed modified SBO-based network reconfiguration implemented on standard bus systems 33 and 69 using MATLAB R2021b version under Windows 10 environment. The proposed approach compared with the existing work in terms of real power loss and loss reduction.
Keywords: IEEE bus system; DG placement; optimization; network reconfiguration; real power loss
In today’s world, electricity also becomes a daily need like food and shelter because most of the appliances and technologies work using electricity. The increased technological development and population leads to a higher electricity consumption and scarcity in the resources. To overcome this problem, the distributed network system is introduced with the help of distributed energy sources like renewable energy sources and distributed generators. In the distributed network, the tie switches are available to provide the power to the system, when there is a fault in the system. This tie switches can alter its position placement and its operating condition using a network reconfiguration approach. This network reconfiguration approach helps to minimize the power loss and improve the power quality in the system. Even when the network is reconfigured, the radiality of the system has to be maintained. In this section, different network reconfiguration approaches from various works are discussed. A shuffled frog leaping algorithm (SFLA) is combined with the pareto frontier optimization and fuzzy logic to improve its boundary condition of the traditional SFLA and network reconfiguration [1]. This improved SFLA is tested on the IEEE 69 bus system and it reduces the voltage drop and power loss as compared to the traditional SFLA, genetic algorithm and particle swarm optimization algorithm.
Due to the placement of distributed generators and network reconfiguration the system suffers from the output uncertainties. This problem is overcome with the help of measurement placement in the distributed system. Here, a Markov Random Process (MRP) and Montecarlo (MC) simulation is performed for the measurement placement after finding the saturation number in the system [2]. This approach is tested on the IEEE 33 and 119 bus system. The power fluctuation in the system is reduced with the help of a Gaussian Mixture Model (GMM). A combination of graph theory and metaheuristic algorithm is proposed for distributed generator placement and size along with the network reconfiguration in IEEE 39,69 and 119 buses [3]. Here, the graph theory is utilized for network reconfiguration and checking the radiality condition. It also provides the search space for the cuckoo search algorithm for DG placement in the network. An optimization based approach for placing and sizing the distributed generators and link capacitors in the IEEE 33 and 69 bus systems is proposed [4]. Here, the Intersect mutation differential evolution algorithm is used and it works by minimizing the power loss of the system. The article [5] also proposed a multi-objective based optimization algorithm for the distributed network system like Baran and Civlar system to operate in the offline mode. Here, the non-dominated sorting genetic algorithm is utilized. This algorithm is utilized to perform both DG placement and sizing with network reconfiguration. This approach reduces the power loss and cost for the DG placement.
Orthogonal array based Taguchi optimization is proposed in [6] for the optimal distributed generators placement in the IEEE bus systems like 33, 118 and 201 bus systems. It utilized the euclidean distance metric to update its position for the optimization process.
Most of the research works concentrate on the DG placement in the network to reduce the power loss in the system. But the DG placement may result in a reverse power flow in the system as DG supplies energy to the system. Hence, this reverse power flow is considered in the embedded particle swarm optimization for placing the DG in IEEE 30 and 33 bus systems [7]. A stochastic mixed integer linear programming is proposed for the optimal placements of renewable sources like solar, wind and energy storage systems as DG in IEEE-119 bus system [8]. This approach selects the optimal placements by minimizing the cost and energy share.
A modified genetic algorithm is proposed for the network reconfiguration in the Baran reconfiguration system [9]. Here, the genetic algorithm is modified by updating the population based on the solution of the configured network. The population size may shrink or grow based on the fitness value. This approach minimizes the loss effectively. A new approach with two exploration steps for the network reconfiguration in IEEE –33 and 70 bus systems [10]. Here, the runner root algorithm is proposed, in which the position update is performed using longer jumps and re-initialization is performed to overcome the local optimal solution trapping. These two steps help to minimize the loss and improve the load balancing in the feeder as well as the branch.
A two stage network reconfiguration is proposed for the reconfiguration in the PG and E 69 bus system. In the first stage, the DG placement is performed using loss sensitivity factor. In the second stage, the actual reconfiguration is performed using the Ant lion optimizer with multi-objective function. This approach minimizes the losses effectively with constant power output.
Based on the above research works, it observed that most of the works consider the network reconfiguration in PQ bus only. But the voltage profile can be improved better in the remote voltage control bus. Hence, in this paper, the network reconfiguration in the presence of a remote voltage control bus in IEEE-33 and 69 bus systems is proposed. The network reconfiguration is performed using the modified satin bower bird algorithm. The paper is organized as follows: Recent techniques in network reconfiguration are discussed in Section 2. The existing modified circular reconfiguration in the remote voltage control bus is discussed in Section 3. Section 4 elaborates the proposed approach network reconfiguration in IEEE bus systems. Section 5 discusses the proposed method results and compares it with the existing approach. Finally, the paper summarized in Section 6 and Section 7 mentioned the future works.
Essallah et al. (2019) proposed a mathematical approach for an optimal distributed generator placement and its power value in IEEE 33 and 69 bus systems. Here, first the bus for the DG placement is selected with the help of an index called voltage stability margin. Then, the optimal DG power is determined with the help of a curve fitting toolbox. This approach is a tedious operation with higher time consumption as it reprocesses its operation till it achieves minimal loss. In recent years, the bus control has been modified by the introduction of a remote voltage control bus called PQV bus. Here, the PQV bus is controlled by the generator bus called P bus. A new approach with two exploration steps for the network reconfiguration in IEEE –33 and 70 bus systems [10]. Here, the runner root algorithm is proposed, in which the position update is performed using longer jumps and re-initialization is performed to overcome the local optimal solution trapping. These two steps help to minimize the loss and improve the load balancing in the feeder as well as the branch [11]
A combination of flower pollination and cloning selection algorithms are used to reconfigure the distribution system by modifying the tie and line positions. The network’s radial topology is protected when a load node is shifted to a collection of power nodes during reconfiguration. The PV arrays and D-STATCOM installation is based on the index value called voltage stability [12].
Even though the optimization algorithms determine the optimal network reconfiguration with minimal power loss. It faces a major drawback in time consumption and non-radial nature in the reconfigured network [13]. To overcome this problem, a predefined radiality based configured network solutions are used for finding the optimal configuration. Then, these positions are processed using Discrete evolutionary programming and discrete evolutionary particle swarm optimisation approaches for network reconfiguration in IEEE-33 and 118 bus systems [14].
A comprehensive teaching learning-based optimization with single objective function called power loss and multi objective function called power loss, voltage and residual energy is proposed for the DG placements in IEEE 33, 69 and 118 bus systems [15]. The main advantage of this approach is that it does not suffer from the local optimal solution.
Generally, the real and reactive power is only considered in the bus control. But in the PQV bus the voltage is also present along with the real and reactive power. In the optimal DG placement in the remote voltage control bus is proposed. But it does not discuss the network reconfiguration process. Based on this, a network reconfiguration in a remote voltage control bus is chosen with optimal DG and size placement using a genetic algorithm is considered as a conventional approach to evaluate the proposed network reconfiguration algorithm.
In the network reconfiguration in the remote voltage control bus is proposed using a Modified Cyclic Reconfiguration (MCR) approach. Here, the PQV bus is controlled by the P-bus, which is selected using a sensitivity analysis approach. Then, the DG’s are placed in the selected buses with the help of a genetic algorithm. Once the DG’s are placed in the corresponding positions, the network reconfigures its switch position using MCR technique. In this, the following shortcomings are observed.
• A basic reconfiguration strategy is proposed, with only one branch being processed at a time.
• It focuses primarily on DG placement and size.
To address this, a modified satin bower bird optimization technique is suggested in this paper to reconfigure the remote voltage control bus network.
The network reconfiguration for the remote-controlled voltage bus is presented in order to reduce network power loss. The modified satin bower bird algorithm is utilized to achieve this reconfiguration, using power loss minimization as the objective function. The following steps must be completed before the network reconfiguration procedure may begin.
• Convert PQ bus into PQV bus using P as remote-control.
• Find the minimal power loss in the network.
• Optimal place and size for distributed generators in PQV bus network
• Reconfigure the network using a proposed algorithm to minimize power loss.
4.1 Remote Control Voltage Bus
Generally the P and Q bus only will be available in the bus data. But in the remote voltage control bus, both the PQ and voltage magnitude will be present in the bus. Due to this there will be a change in the bus data and it can be achieved with the help of the Jacobian matrix. Here, the P bus will act as the control bus with its reactive power and PQV bus will act as the remote voltage bus to be controlled. Since, there is no role of Q bus in controlling; it will act as a state variable.
Fig. 1 shows an example for the PQV bus. Generally the bus 1 will be a slack bus. In this configuration, the bus 4 has minimum loss and it will act as a remote voltage bus. Then, bus 2 will act as a control bus and it is represented in mathematical form in Eqs. (1) and (2).
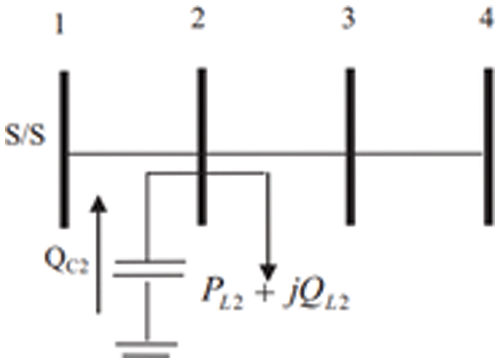
Figure 1: An example for PQV bus
Using the above equations, the bus and line data will be modified. After the modified voltages and reactive power, the load flow analysis using the Newton-Raphson method for the magnitude and angles is given in equation for (3).
After obtaining the magnitude and angles, the reactive power (QC2) required by bus 2 is adjusted to maintain the voltage profile in bus 4 is given in Eq. (4).
where Q2 - Bus 2 net reactive power
QC2 - Bus 2 Shunt capacitor reactive power.
QL2 - Bus 2 load reactive power
From Eq. (4), the shunt capacitor reactive power can be obtained as follows.
The above equation is the required power by the control bus 2 for maintain the voltage profile in bus 4.
4.2 Control and Remote Voltage Bus Selection
In this research, the proposed modified satin bowerbird algorithm for network reconfiguration is tested on the two IEEE bus systems 33 and 69. The line diagram of the two bus systems is shown in Fig. 2. Both the systems have a base power of 12.66 kV. But the P and Q power values are as follows: 3715 kW 2300 kVAr and 3791.89 kW, 2696.1 kVAr for IEEE 33 and 69 bus respectively.
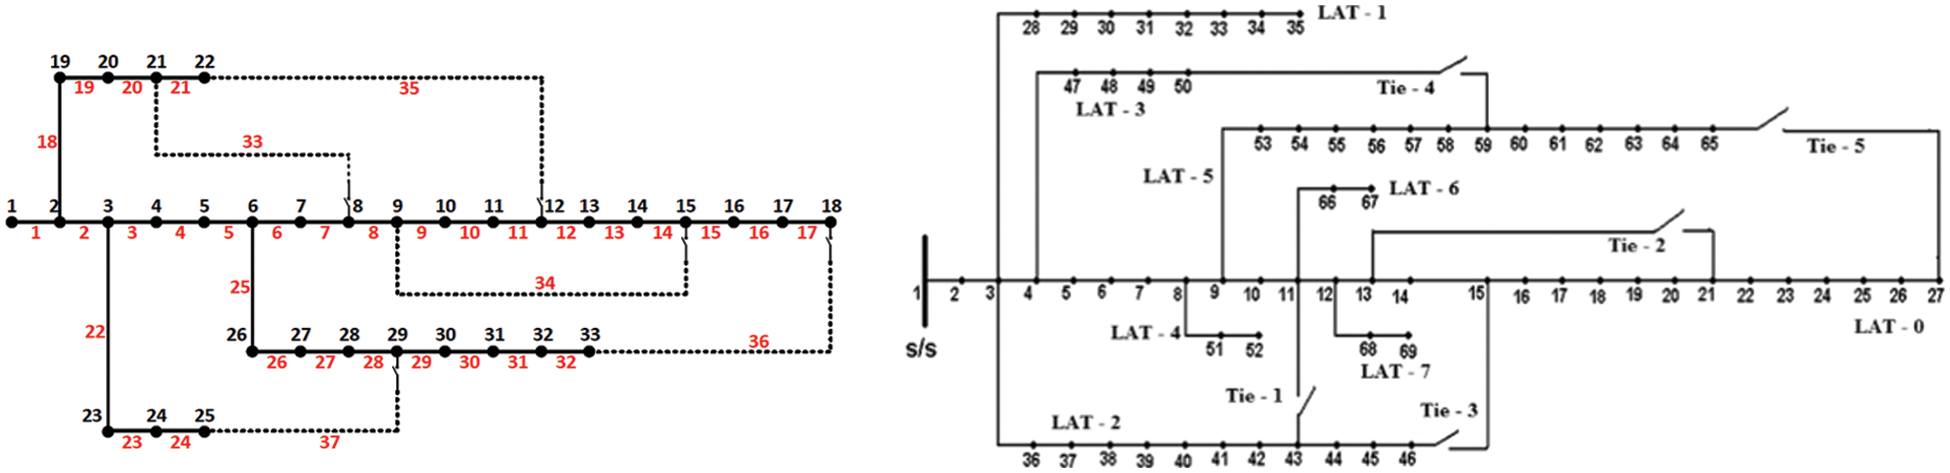
Figure 2: Radial distribution bus
This paper’s objective is to improve the voltage profile and achieve the minimum power loss through remote voltage control bus. For this, the control bus should be properly selected. Requirements for Control (P) and Remote voltage (PQV) bus selection
4.2.1 Remote Voltage Bus Selection
After the modifications of the voltage magnitude and angles in the bus data, the load flow analysis is performed. Based on that, the bus with minimum voltage will be selected as the remote voltage bus. The bus which is lateral to the remote voltage bus will act as a control bus.
The control bus should be properly selected because it not only regulates the voltage in the remote voltage bus and it also reduces the overall network loss. To achieve this, it injects the reactive power through the control bus. The control bus selection in the 33 and 69 bus systems is given below.
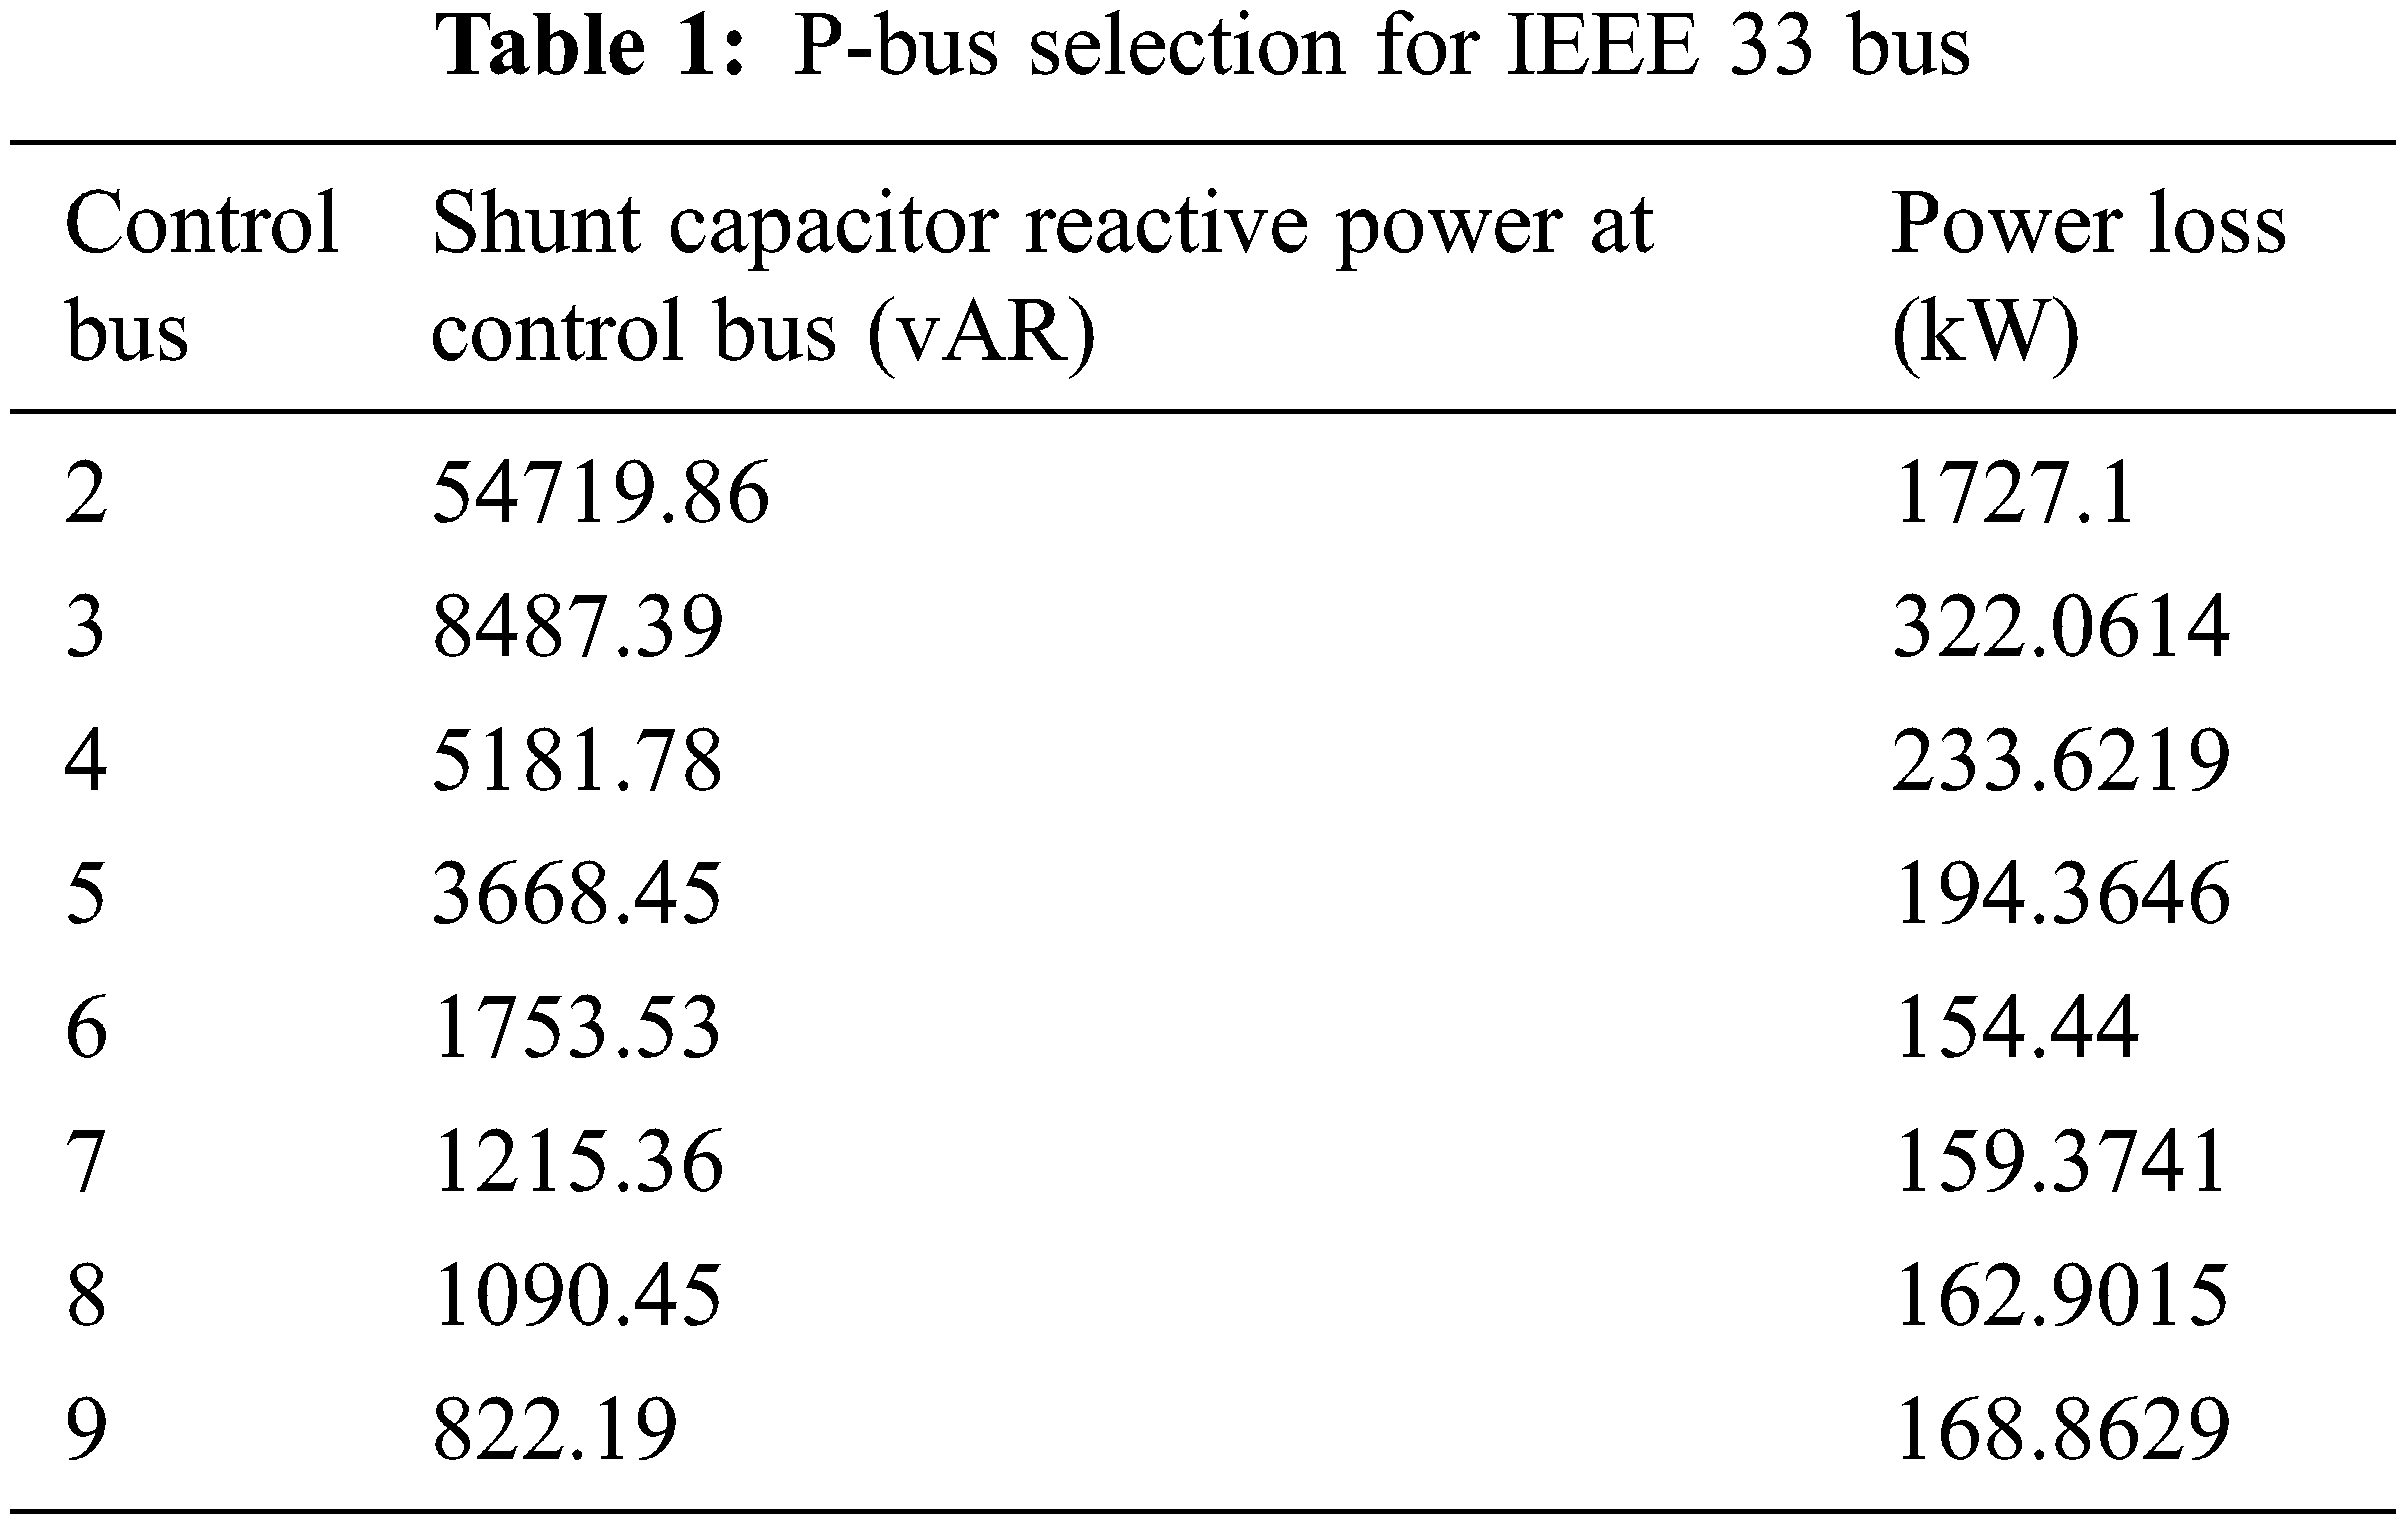
After the modification process and load flow analysis, the minimum voltage is obtained at 18 bus for 33 network systems and the minimum voltage is 0.93 p.u. Therefore, the bus 18 is considered as the remote voltage pus and the bus in the lateral branch with minimum loss is considered as the control bus.
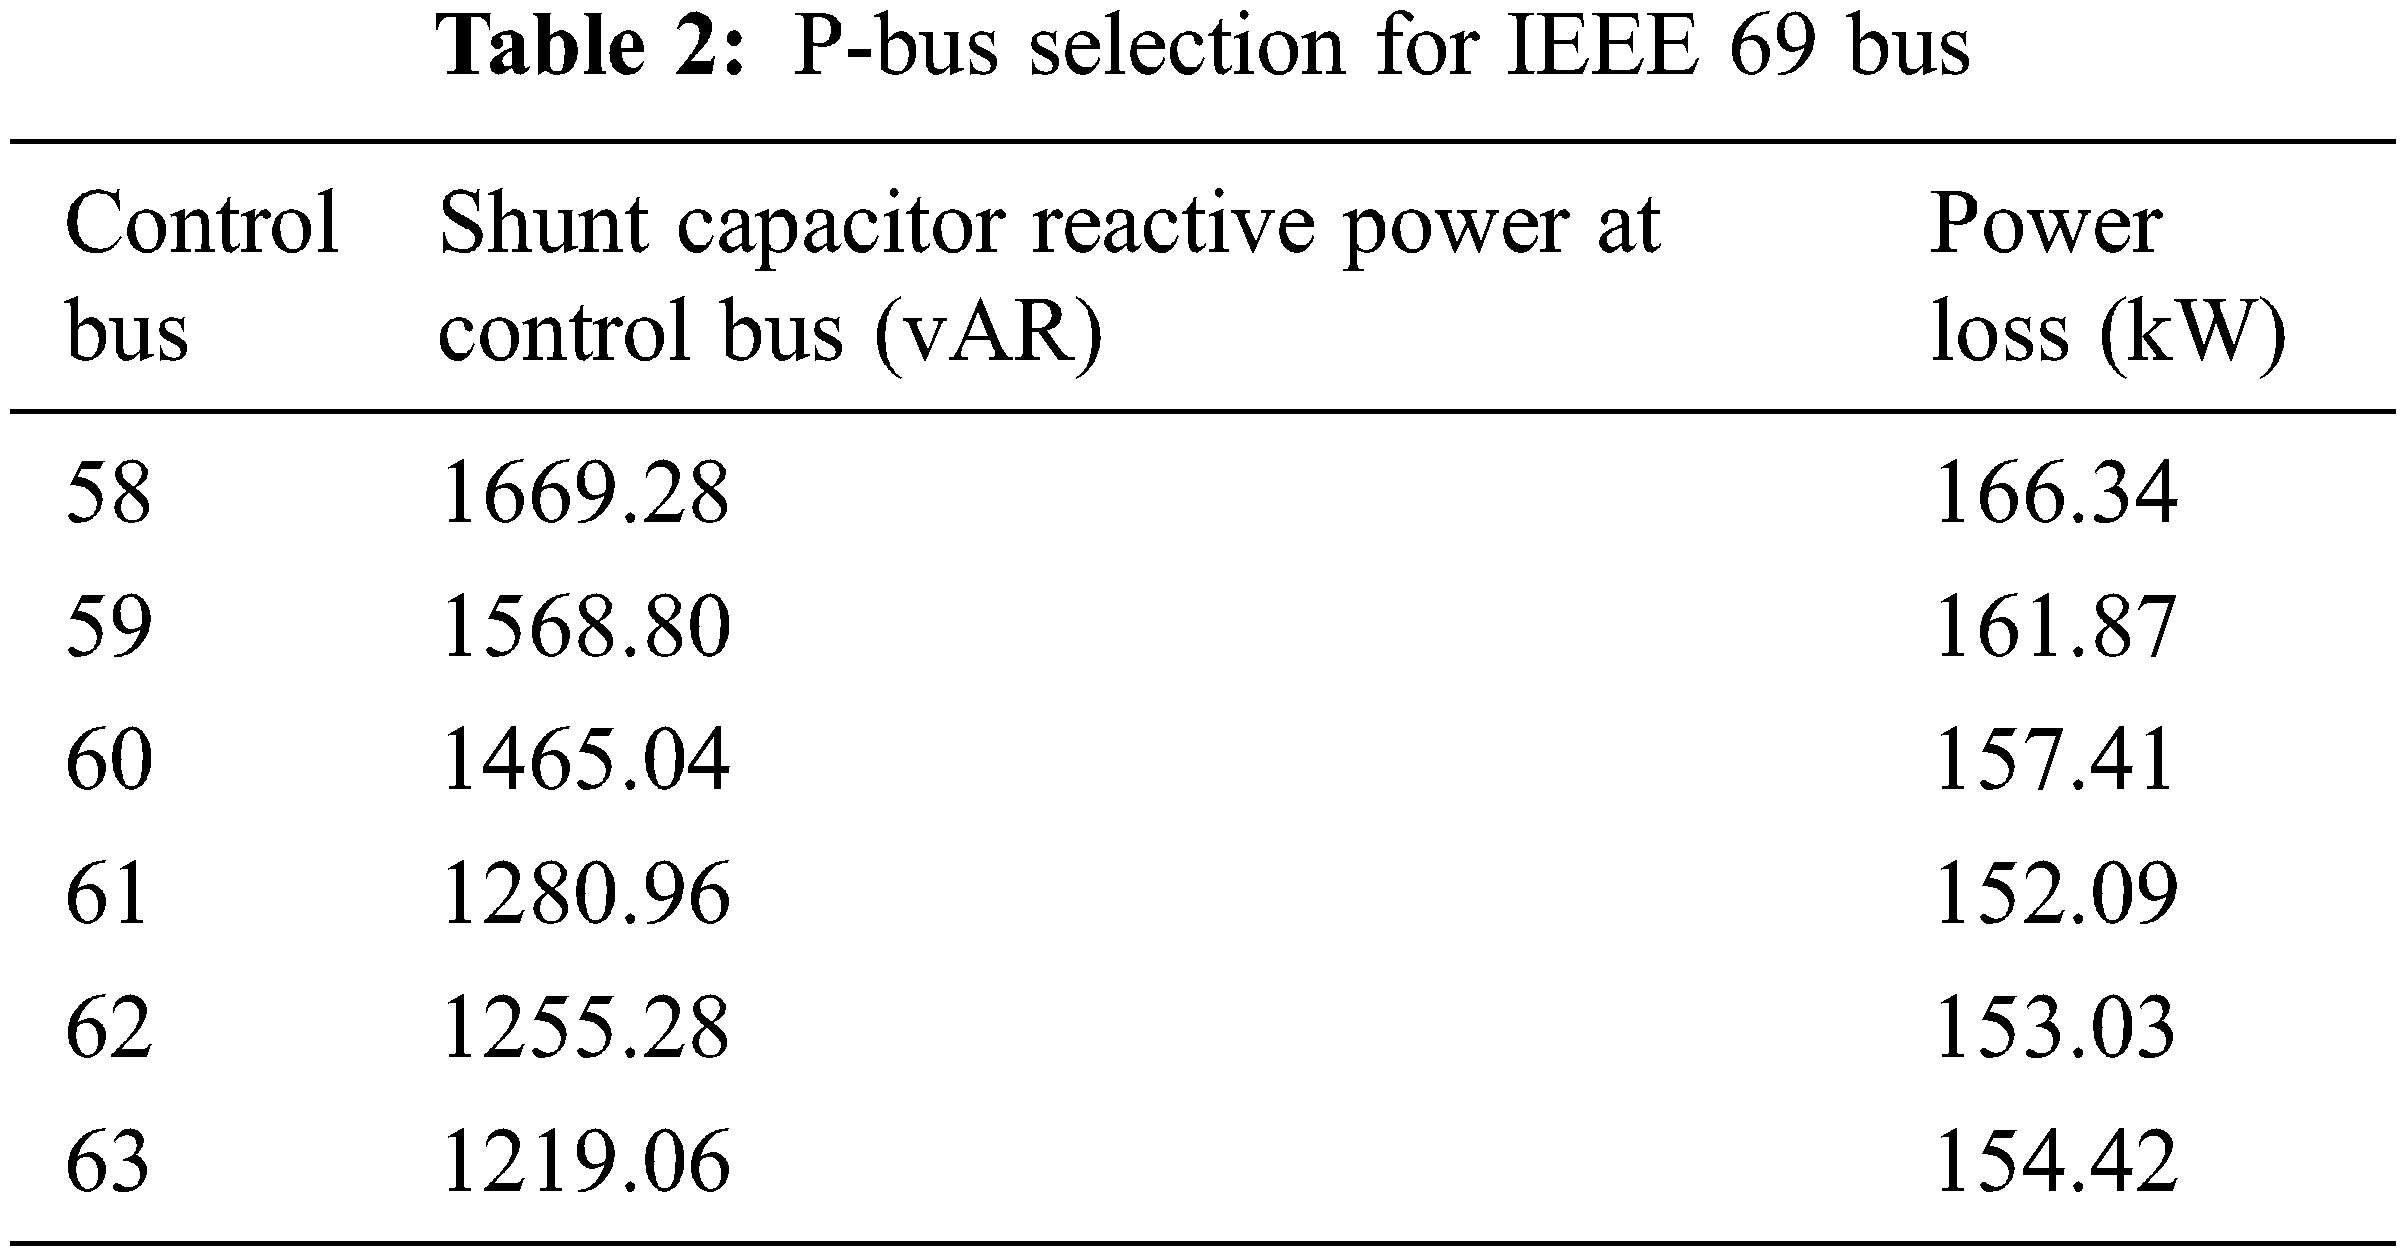
After the modification process and load flow analysis, the minimum voltage is obtained at 65 bus for 69 network systems and the minimum voltage is 0.90 p.u. Therefore, bus 18 is considered as the remote voltage pus and the bus in the lateral branch with minimum loss is considered as the control bus.
Tab. 1 shows the lateral bus power loss in 33 network systems and it is observed that the minimum loss is obtained at bus 6.
Tab. 2 shows the lateral bus power loss in 69 network systems and it is observed that the minimum loss is obtained at bus 61.
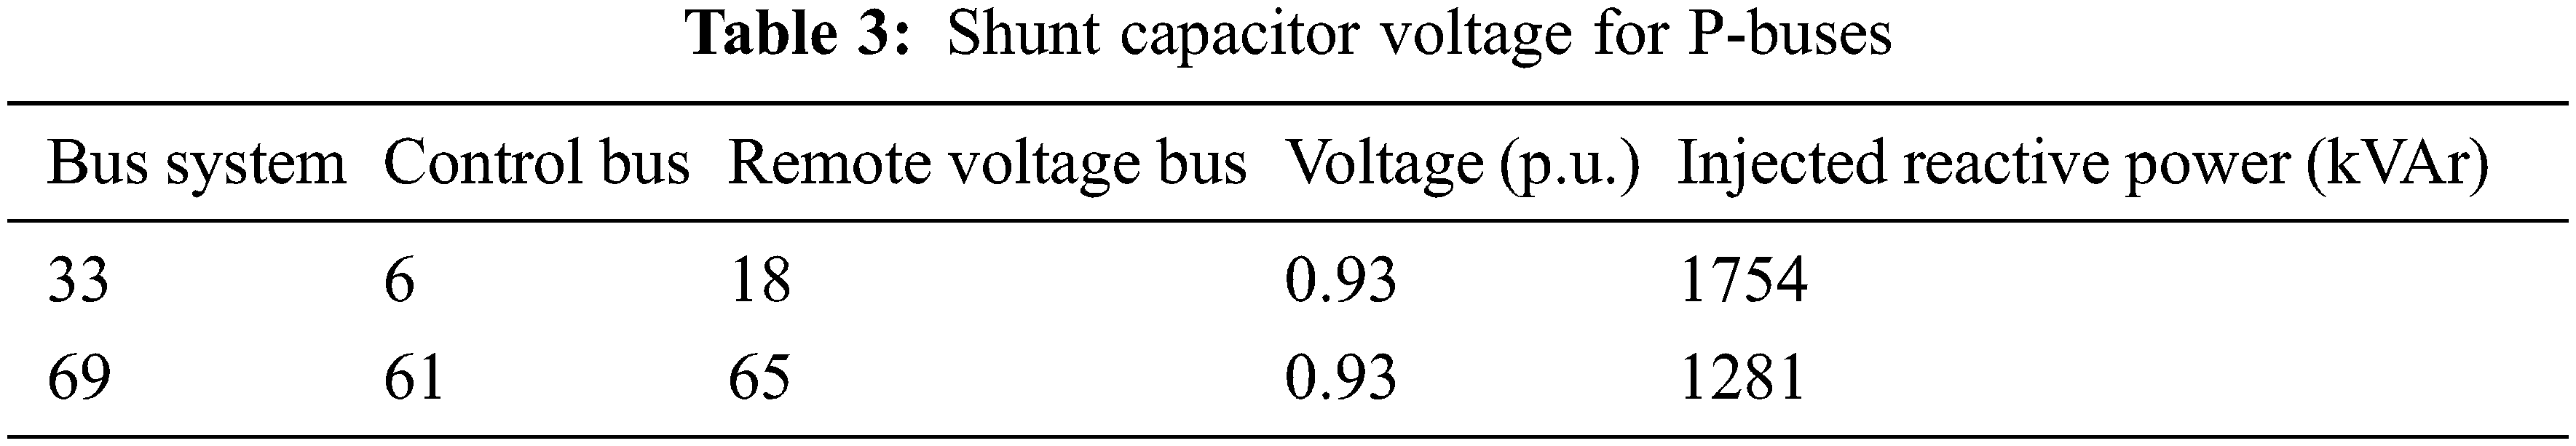
After the control bus selection, the reactive power that is required to maintain the voltage at the remote voltage bus is determined by Eq. (5) and its values are tabulated in Tab. 3.
4.3 Distributed Generator Placement Using Sensitivity Analysis
After the control bus selection, the distributed generator needs to be placed to provide the required power to the network without affecting the radiality. Here, the distributed generators are placed using a sensitivity analysis approach. Initially, the power factor is considered as 1.0 for placing the Distributed generators. Then, the size is determined through the optimization algorithm. The DG should be placed only if it satisfy the following conditions.
• Higher voltages should be used on buses with higher load values.
• The network’s real power losses are reduced.
Based on the above conditions, the Eq. (6) is constructed for analysis of the sensitivity index.
After placing the unity power factor DG,
Once the sensitivity index for each bus is calculated with unity power factor and the sensitivity index is ordered using the Eq. (7).
The bus satisfies the above equation and the conditions considered for the distributed generator placement. Each time of processing, each bus will utilize 30% of the power.
The buses are sorted based on the sensitivity index Eq. (7) and also it’s utilized for selecting the DG placement and optimization algorithm for size. The DG size may vary and the reactive power should be constant.
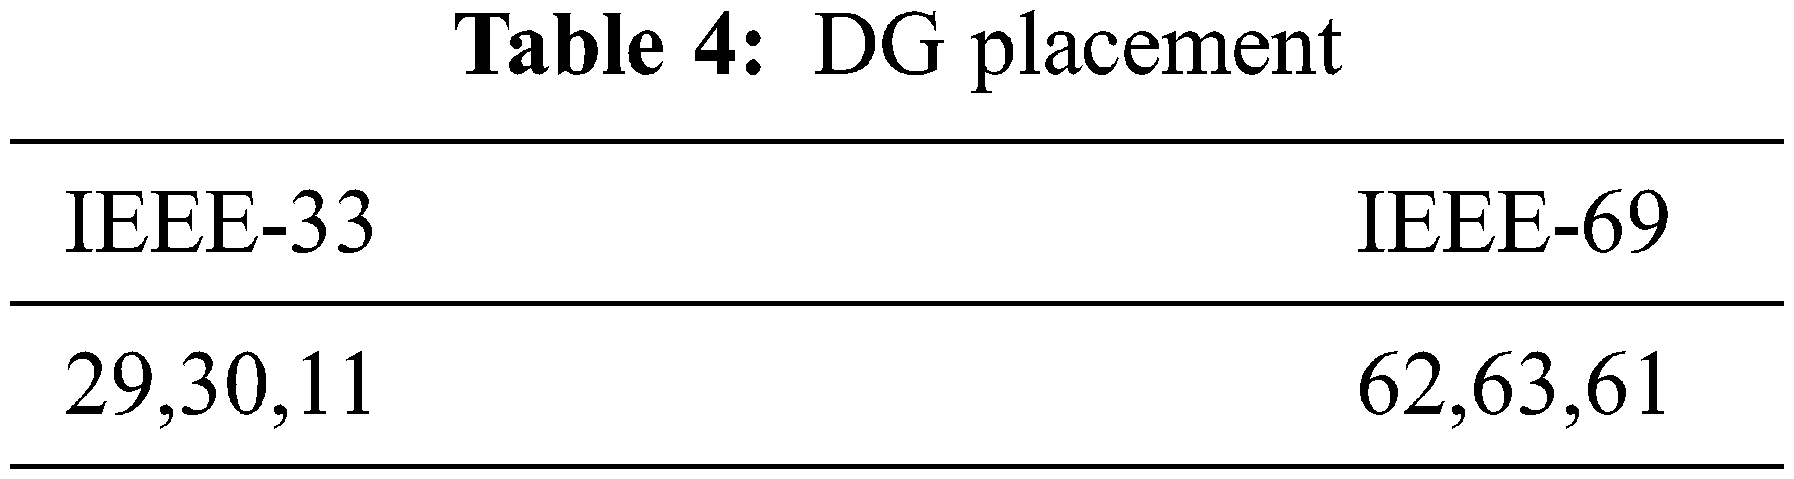
Here, the buses for DG placement are directly determined from the Eq. (7). That is, it takes the first three buses as the place for the distributed generators placement. Based on that, Tab. 4 gives the buses for both the systems.
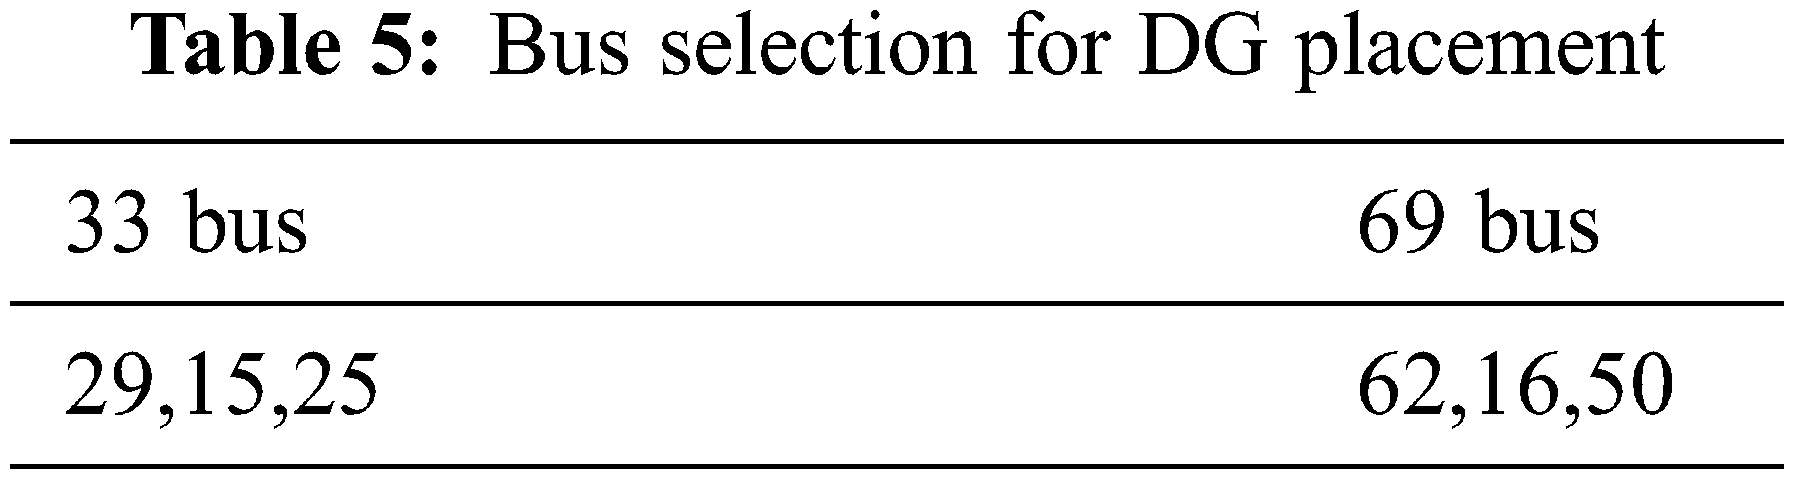
Here, only the top node from Eq. (7) for the first DG placement. After that the process repeated the procedure for another two placements. Tab. 5 gives the Bus places for the two systems.
The sizes of the DGs are optimised using Genetic Algorithm once the buses have been chosen (GA). GA is an optimization technique based on natural selection mechanics and natural genetics GA has grown in popularity over the last two decades as a tool for handling a wide range of optimization and machine learning challenges. In GA, the term “fitness” refers to the goal function that should be maximised.
where i = 1, 2,…, Npop,
‘m’ is a positive value.
‘ploss’ is total power loss after DG placed.
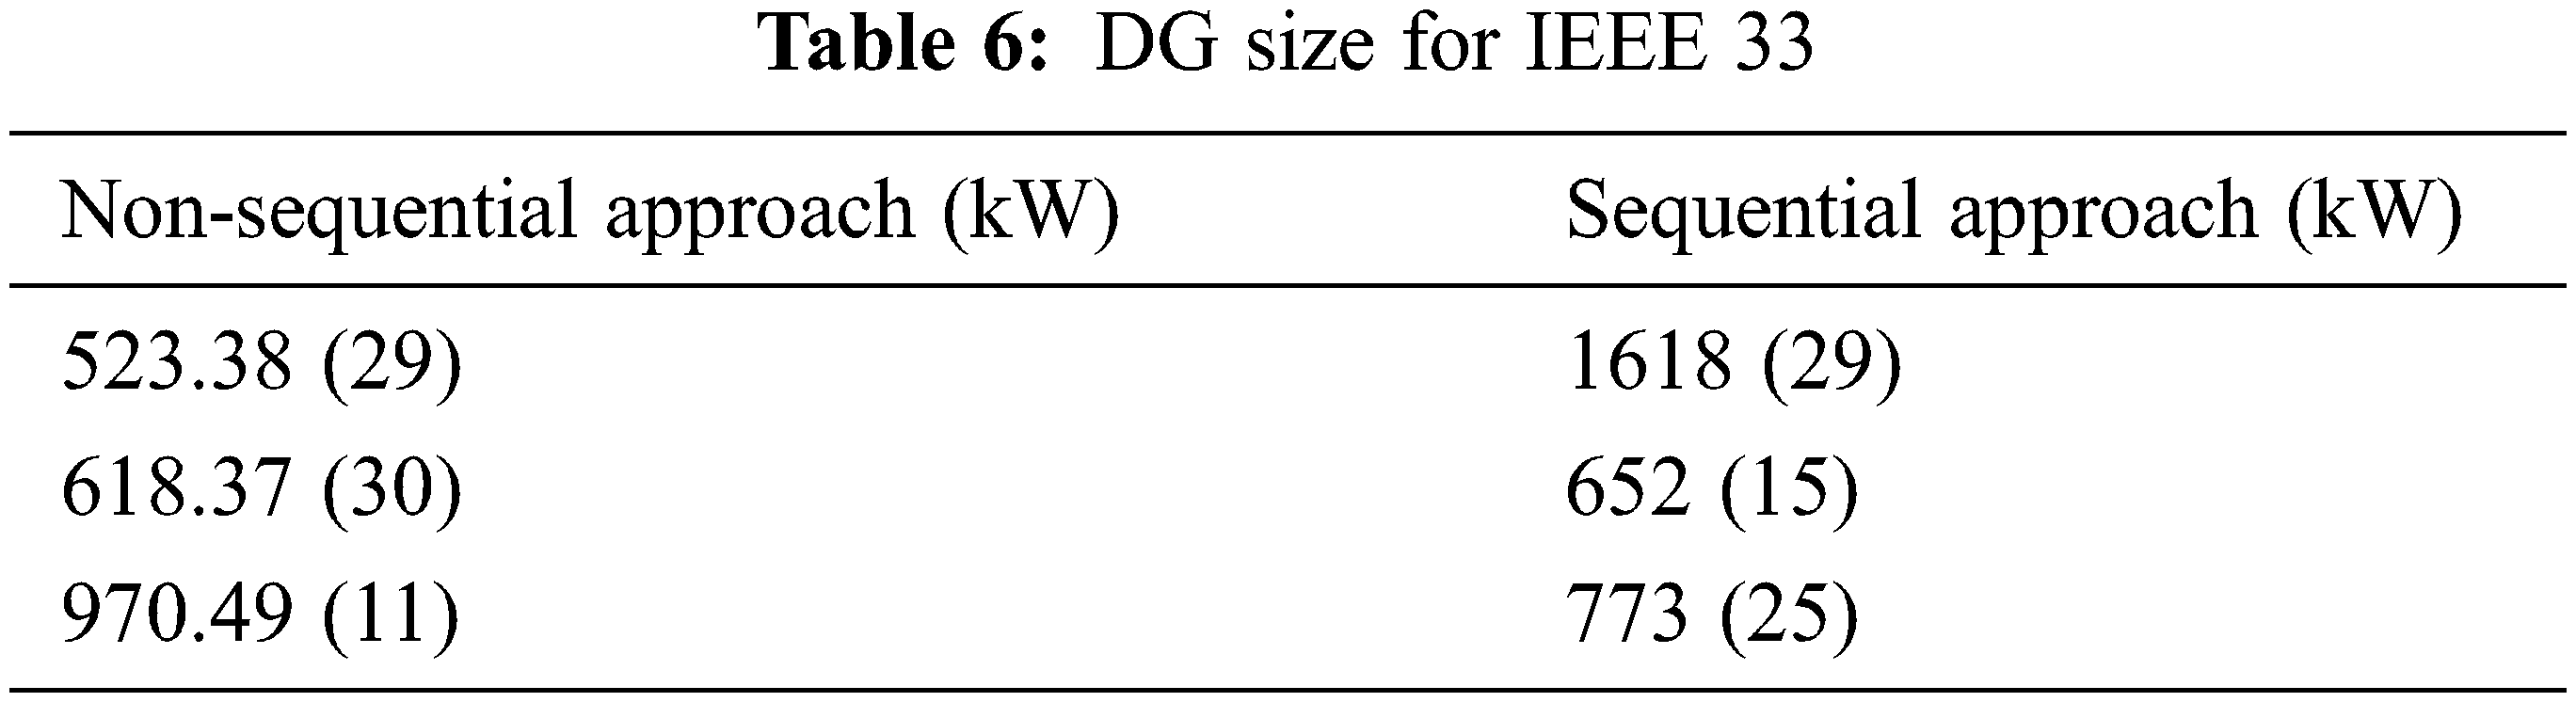
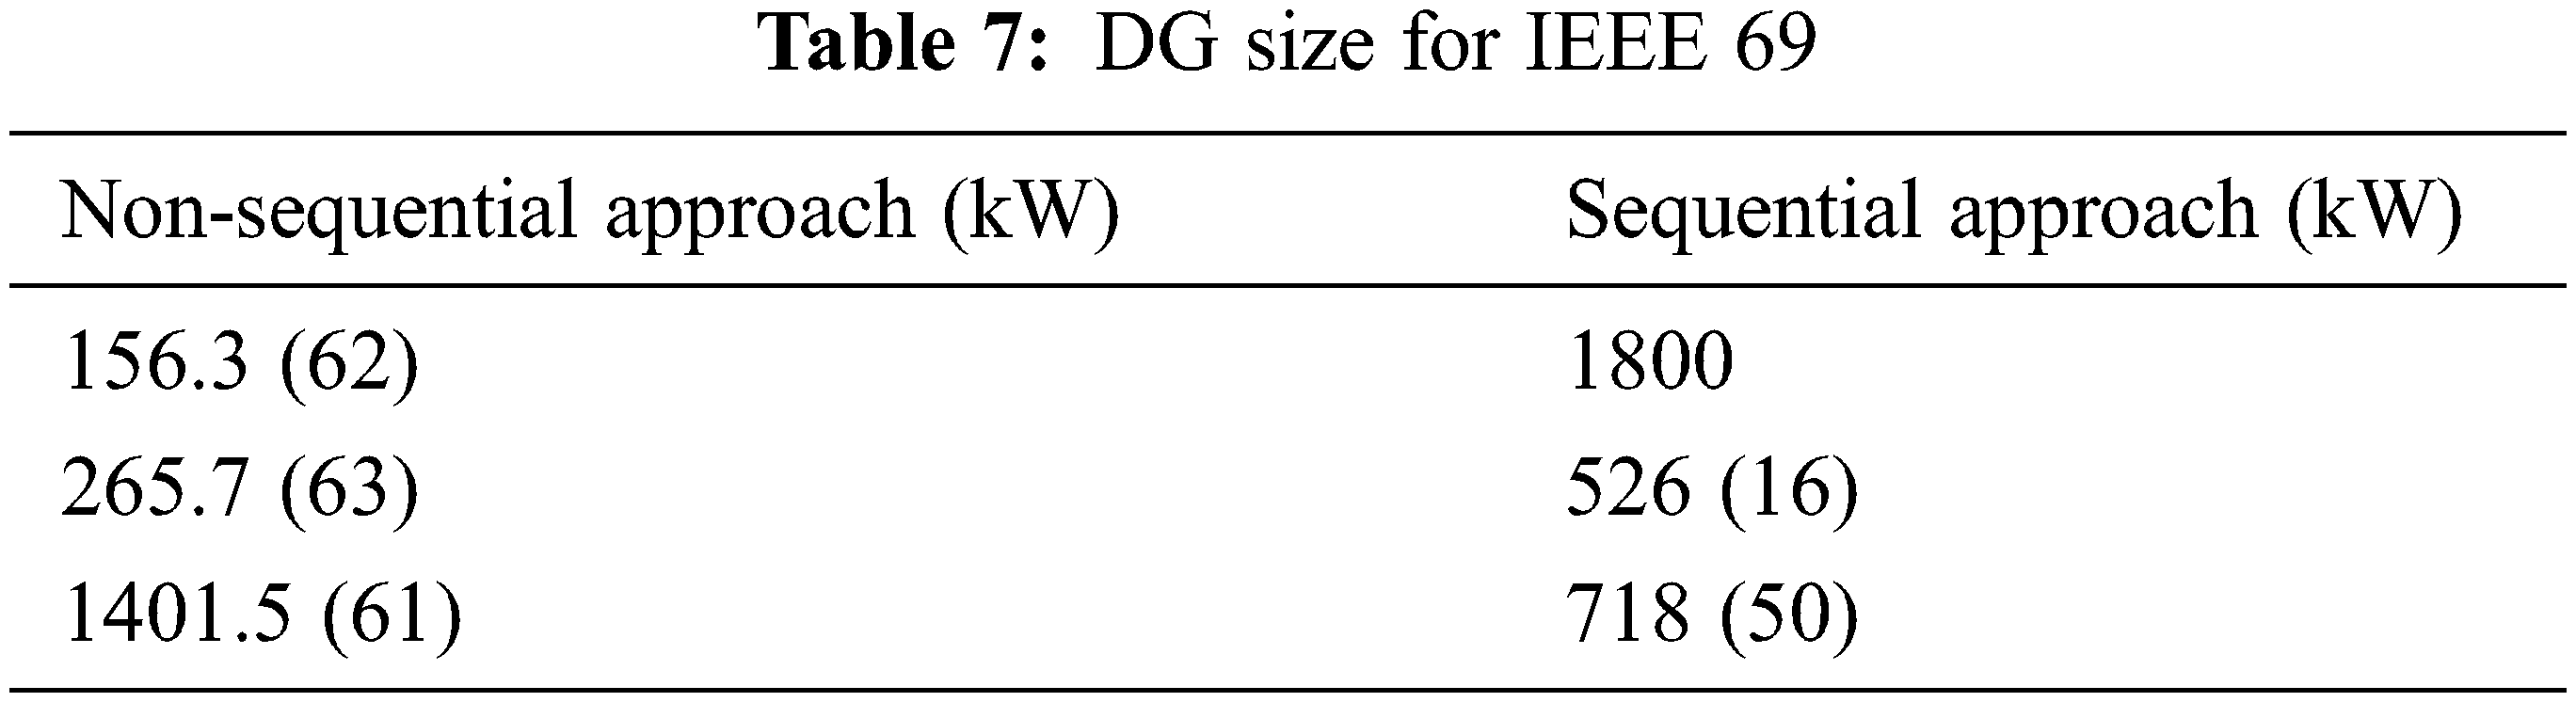
From the genetic algorithm, the DG value for the bus system using both the approaches is given in Tabs. 6 and 7
4.5 Network Reconfiguration Using Modified Satin Bower Bird Algorithm
By redesigning the Distributed Generations Network (DGN), the satin bowerbird optimises to minimise network power loss. The following objective function was employed in this paper to accomplish this.
The satin bowerbird algorithm was used to reduce the above Eq. (9) by performing the steps below.
4.5.1 Parameter Initialization
The first step is defining the problem, iterations, initial solution, updating step size and its boundary. It is the basic step for all the optimization processes to define the problem. The tie switch positions are then given to reconfigure the network to be more efficient. This information is used in the second step, which is the configuration of the tie switch position.
All of the bowers are reviewed after the first iteration to determine their usefulness in achieving the best solution. The analysis is based on a male bower attracting a female bower. As a result, male bowers exclusively evaluate this procedure, which is referred to as male bower probability (MBP). It is calculated using Eqs. (10) and (11).
After analysing the likelihood of bower, all bower are exposed to determining the best solution to the problem in 9.
Bower’s position must be updated on a frequent basis in order to identify better solutions, but this must be done within reason. The roulette wheel and MBP attractions are employed as major factors to limit and update position. The placements of bowers are calculated using the formulas (12) and (13).
Bowers with lower MBPA (attractiveness) are removed to give other bowers a better chance and to speed up procedures. Formulas (14) to (16) are used to calculate it.
z is the percentage difference between the least and maximal power loss in an optimized Distributed generation network.
The preceding processes, from bower evaluation through bower reduction, are repeated until the reconfigured optimised distributed generation’s network reaches its final iteration or achieves the minimum power loss.
5 Implementation and Discussion
In this research, the proposed modified satin bowerbird algorithm for network reconfiguration is tested on the two IEEE bus systems 33 and 69 using MATLAB R2021b version. The line diagram of the two bus systems is shown in Fig. 2 Both the systems have a base power of 12.66 kV. But the P and Q power values are as follows: 3715 kW 2300 kVAr and 3791.89 kW, 2696.1 kVAr for IEEE 33 and 69 bus respectively.
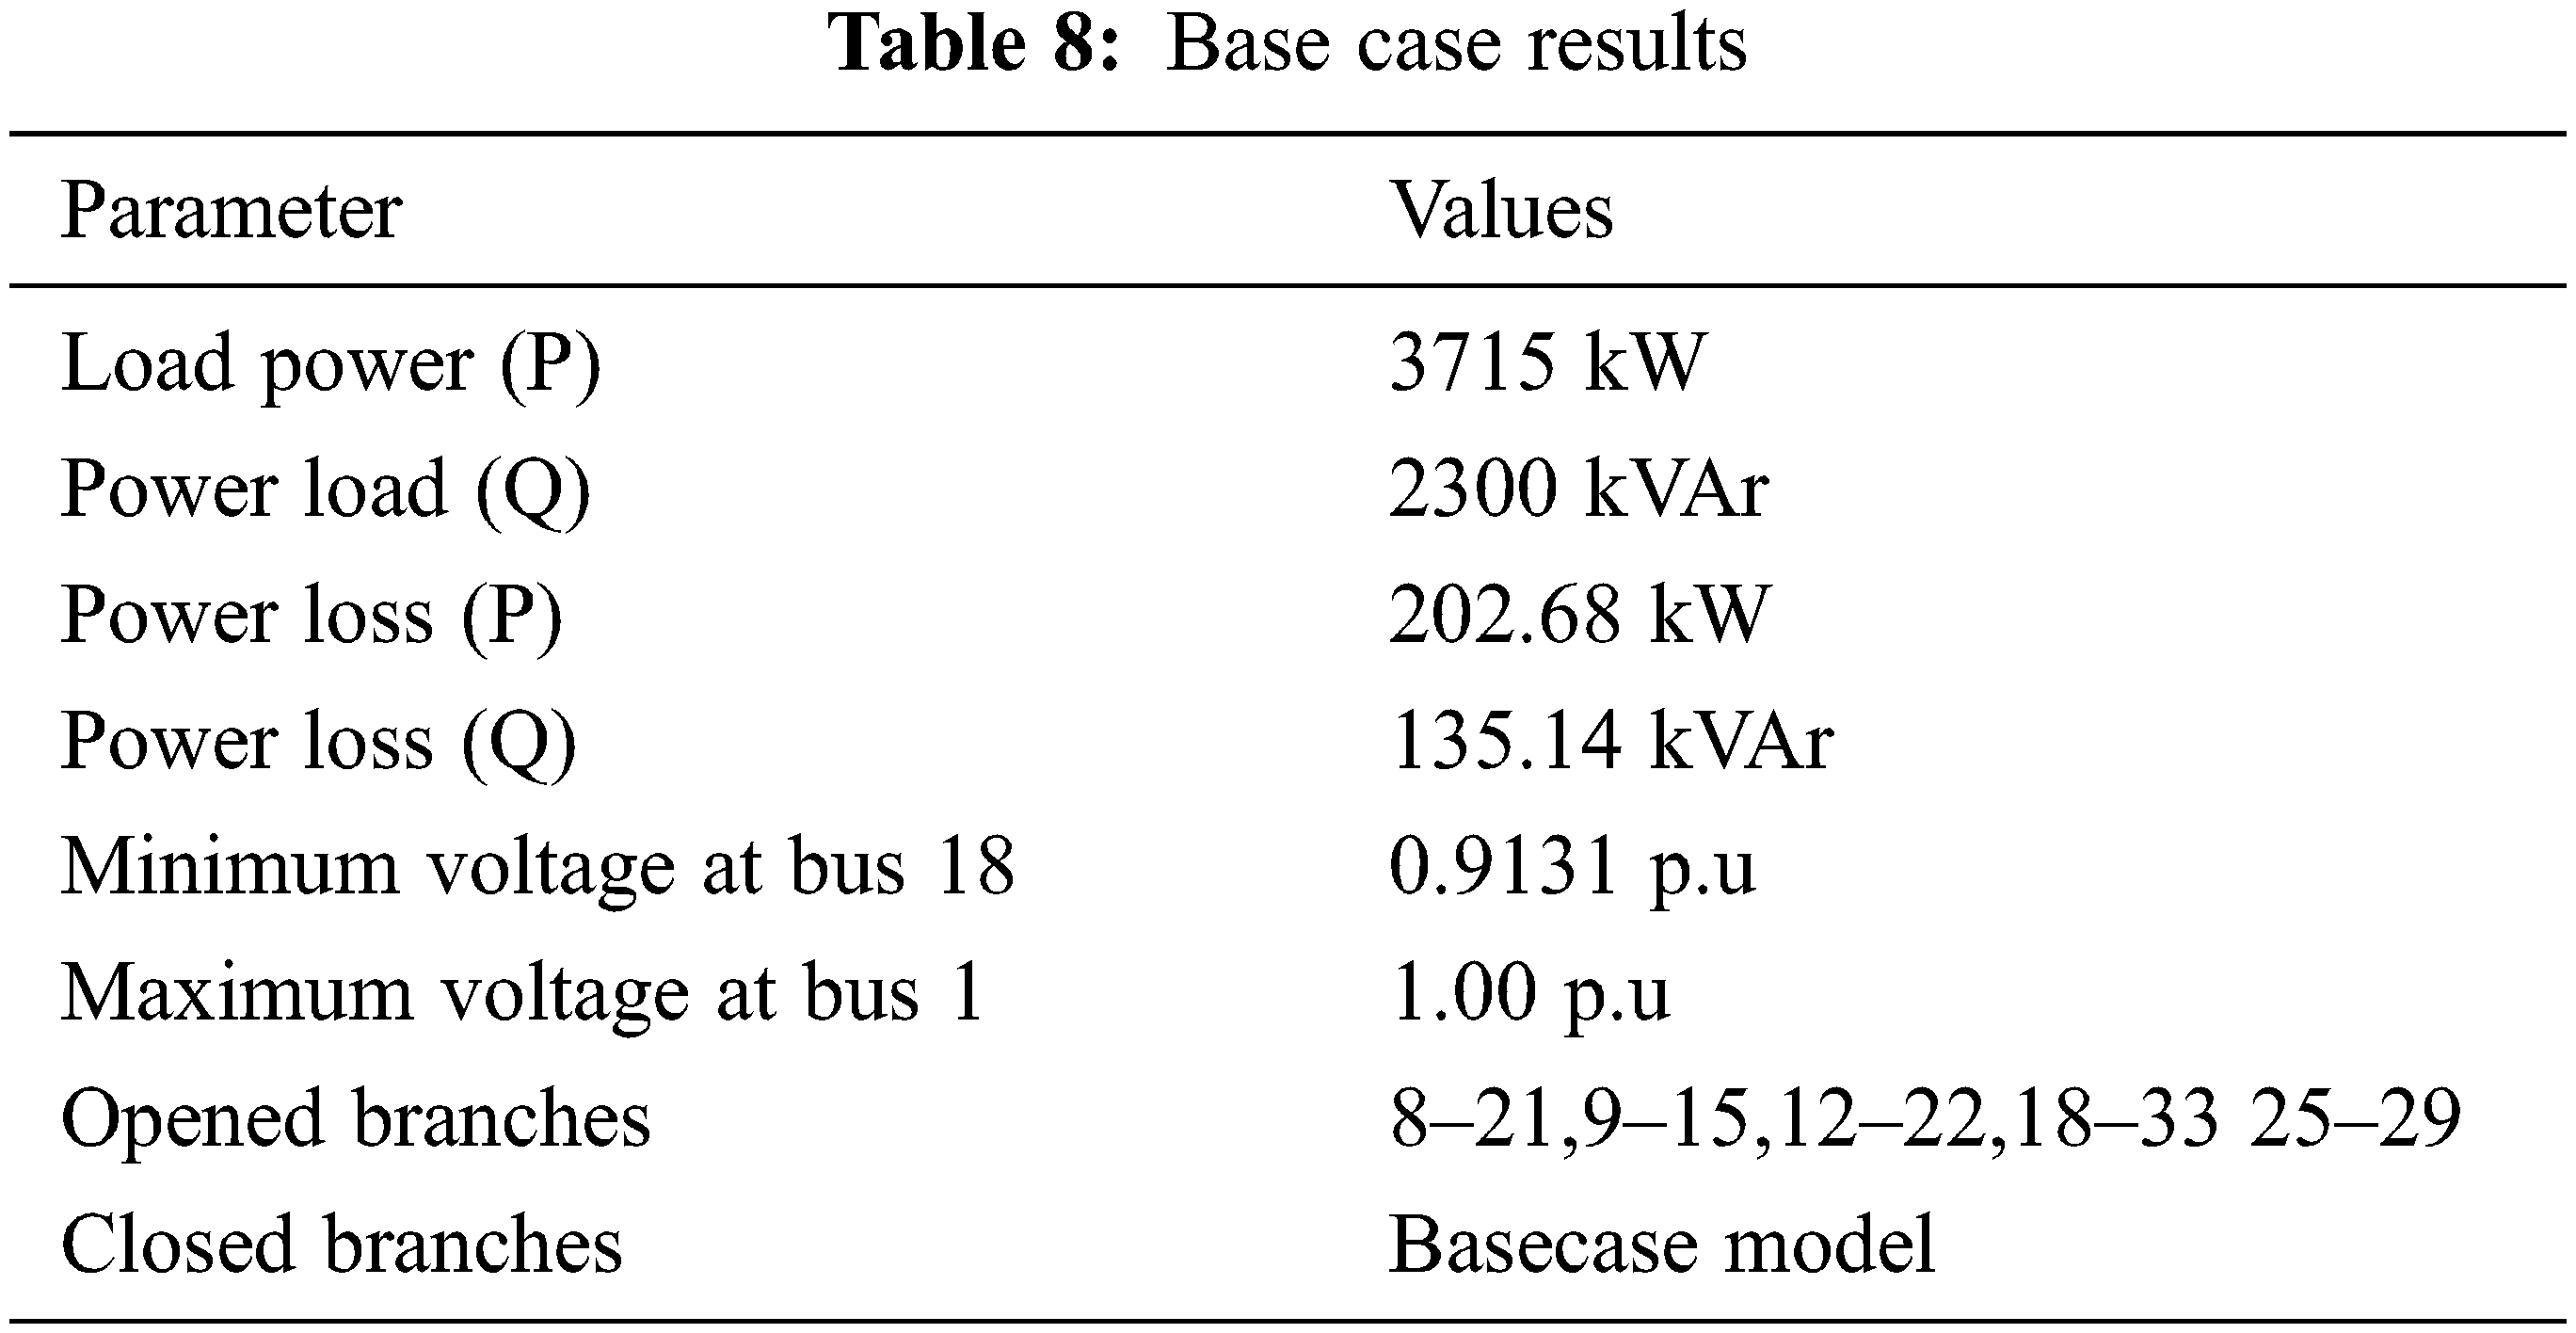
For the first example, Tab. 8 illustrates the load flow outcome of a 33 bus distribution network. In the presence of the PQ bus, the power loss in the network is 202.68 kW and 0.9131 is the voltage to be maintained at bus 18.
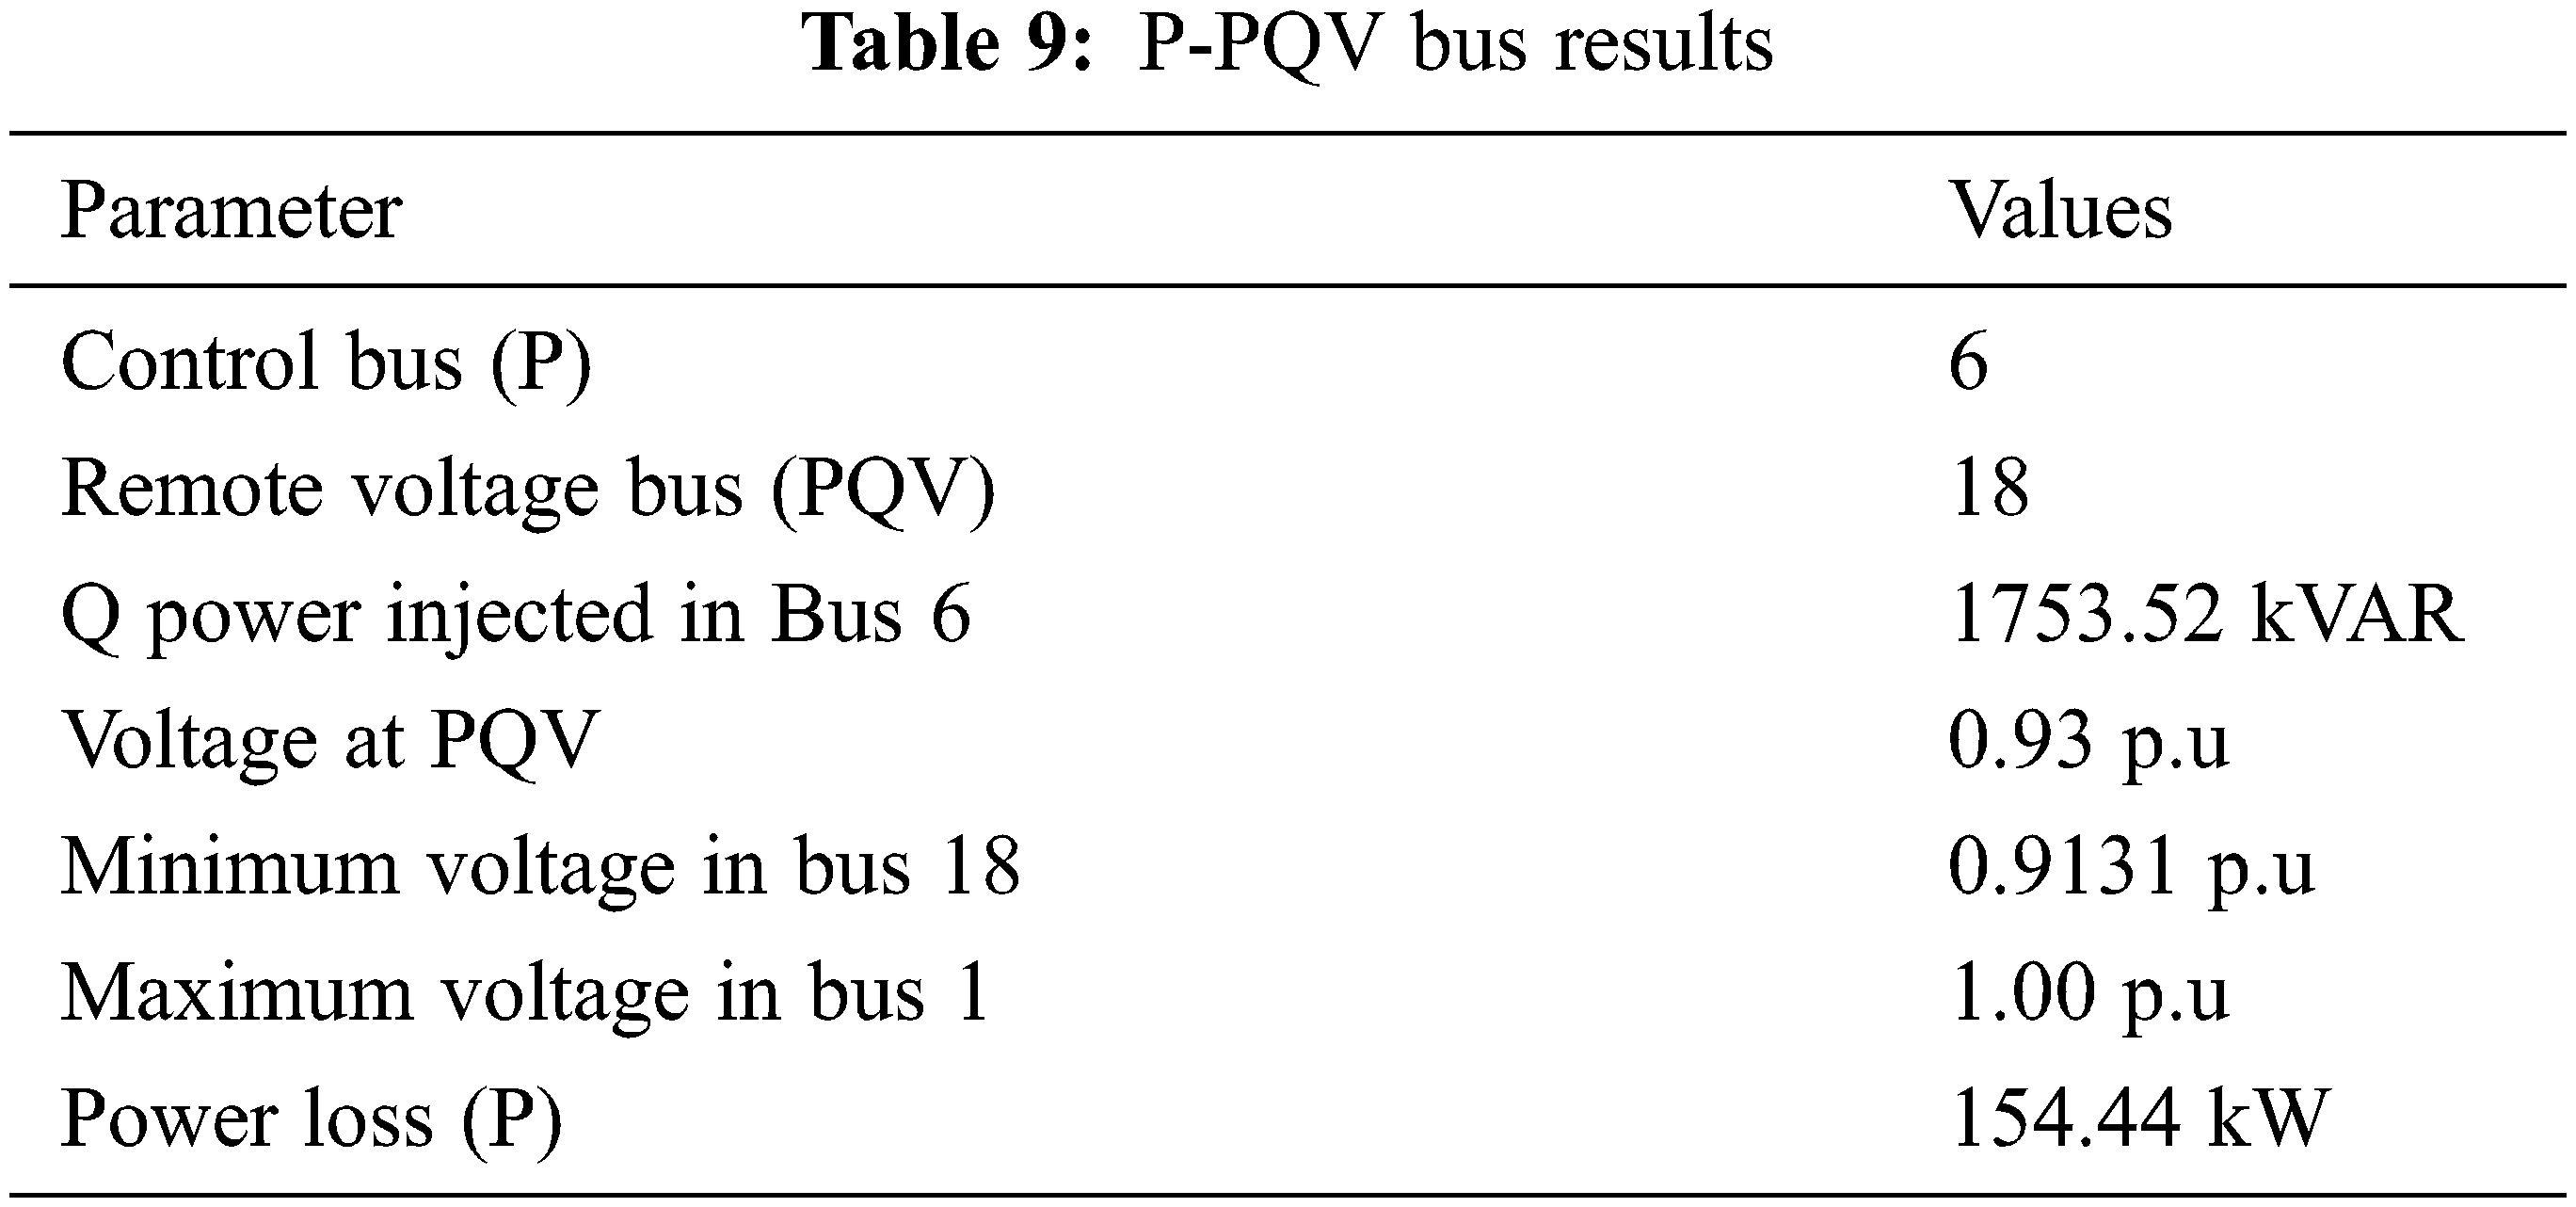
After the introduction of the remote voltage control bus process, the power loss (P) is minimized to 154.44 kW. It is achieved by modifying the basecase 33 system by considering bus 6 as P bus by injecting the power of 1753.52 kVAr and Bus 18 as PQV bus and the voltage to be maintained is shown in Tab. 9.
The DGs are then assigned to 33 bus distribution networks, which include control (P) and remote voltage (PQV) buses. According to the non-sequential method and genetic algorithm, the DGs should be placed at three relevant sites (bus 29, 30, 11) to reduce real power losses. The reconfiguration of the network takes place using the proposed modified satin bower bird algorithm given in Tab. 10
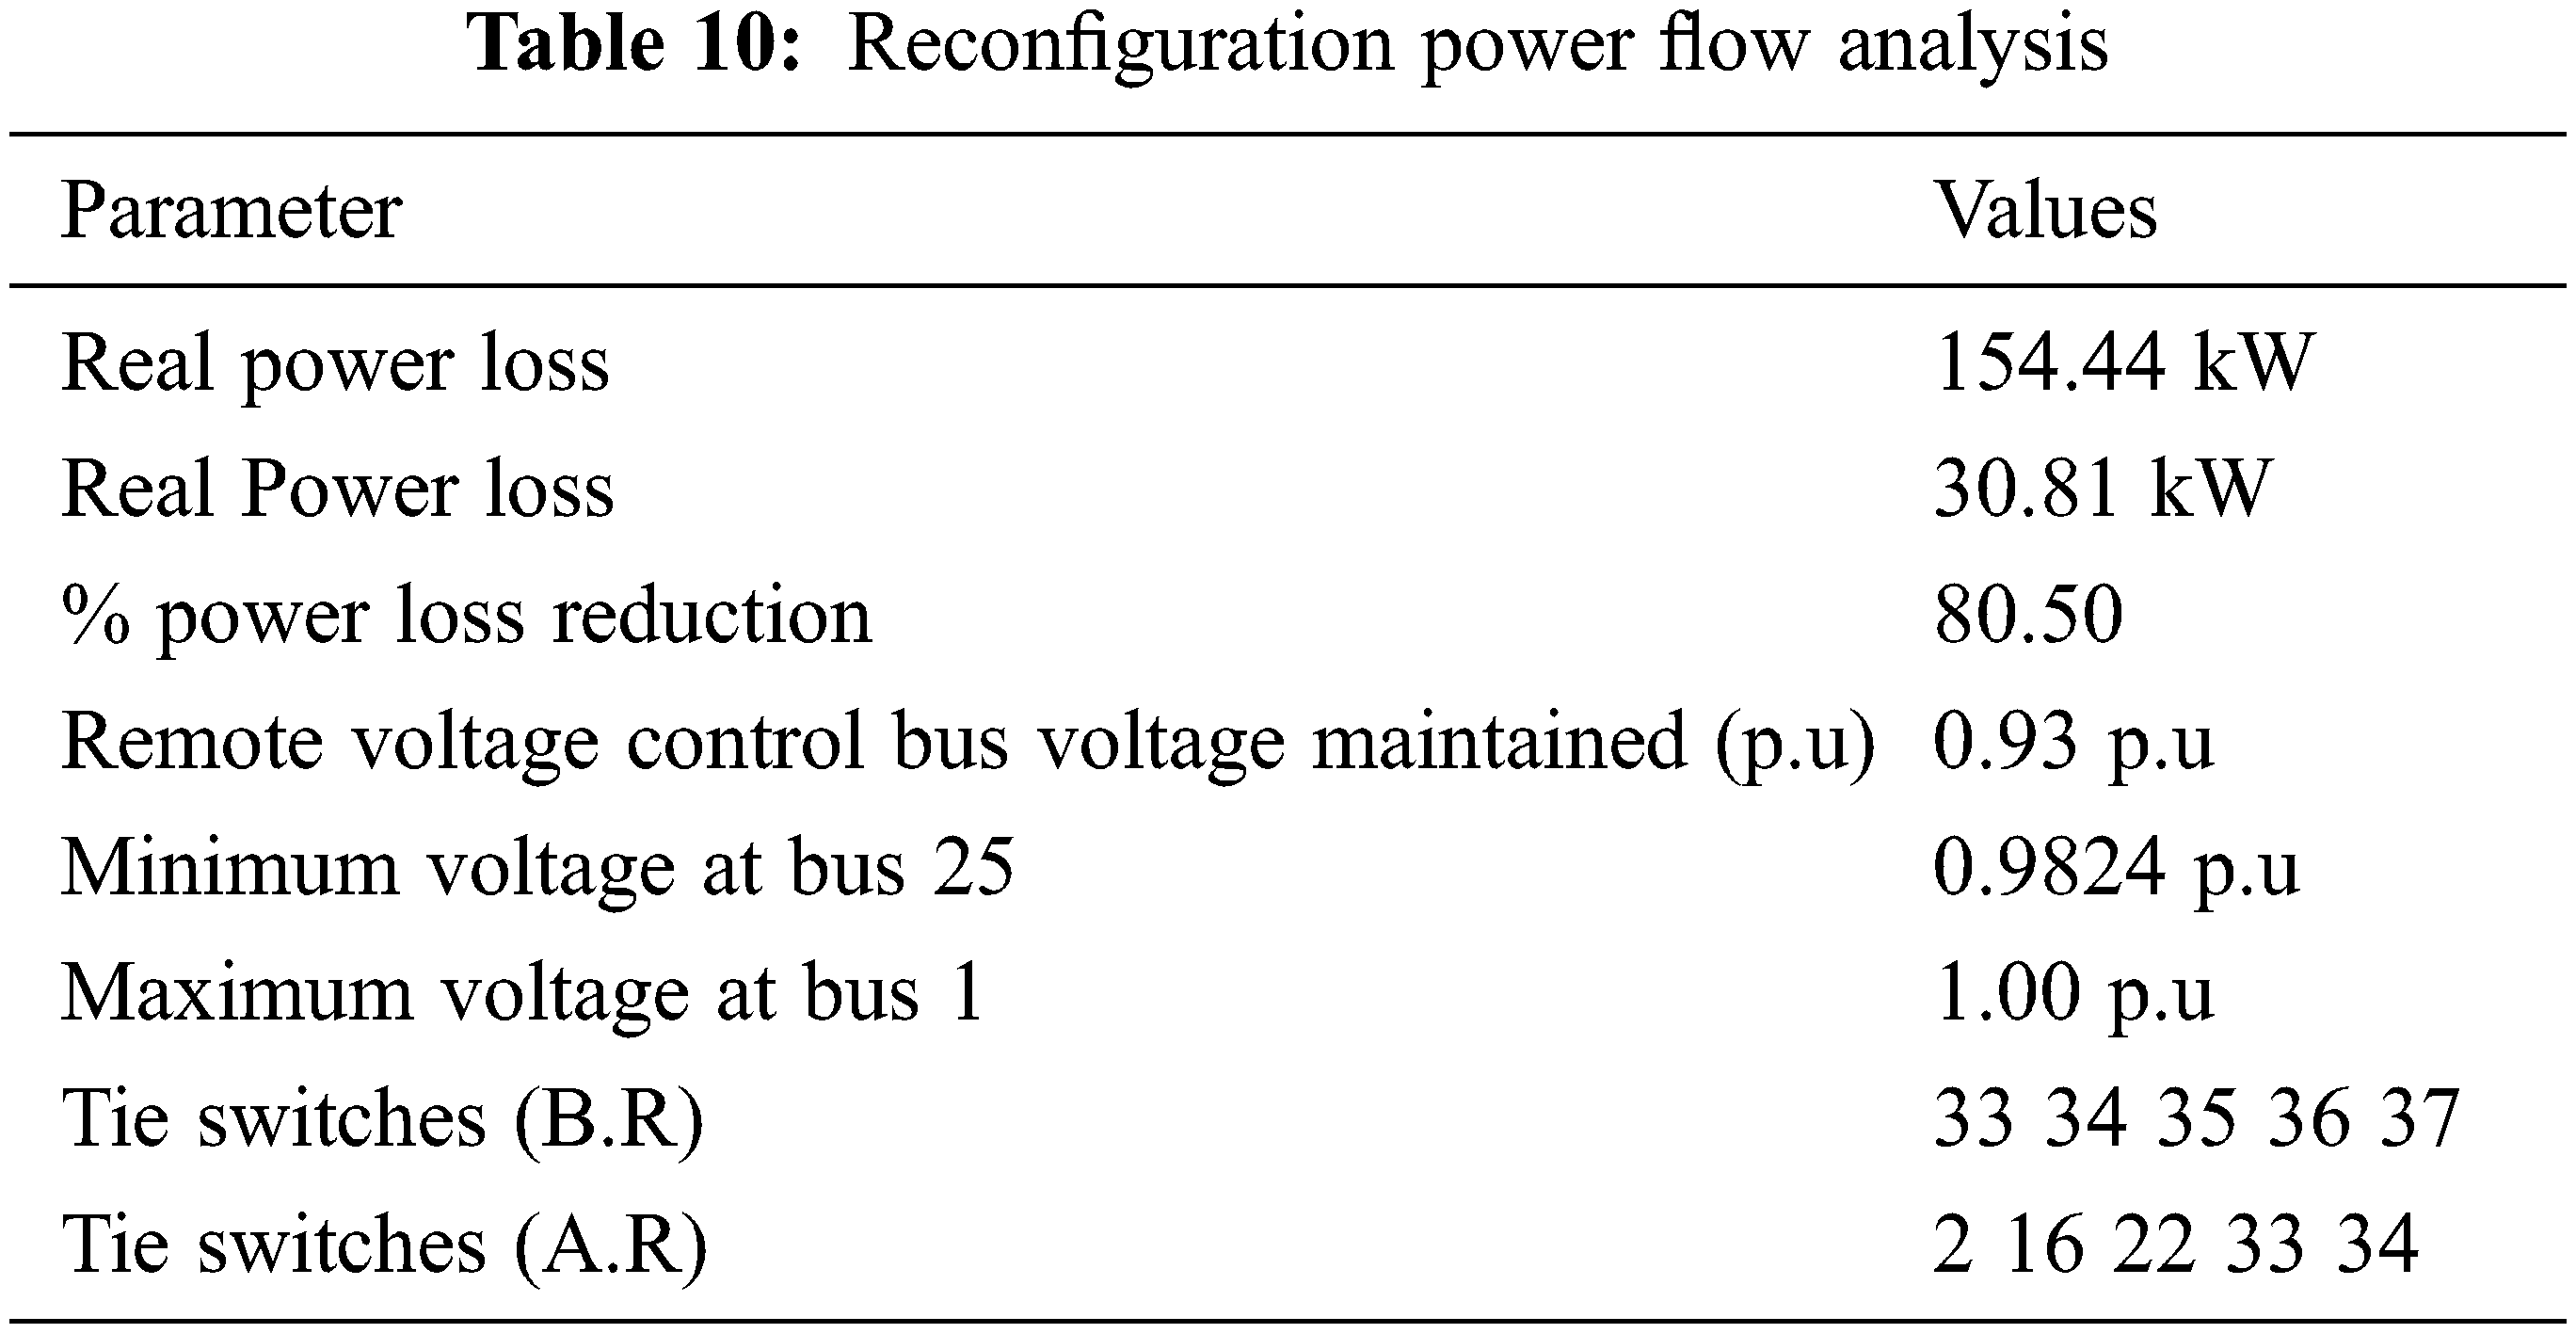
After the reconfiguration process, the power loss in the PQV remote voltage control bus is reduced by 80.50%. It also improved the voltage profile at bus 25. It was achieved with the help of optimal DG placement using genetic algorithm and the proposed modified satin bowerbird algorithm.
The DGs are then assigned to 33 bus distribution networks, which include control and remote voltage buses. According to the sequential method and genetic algorithm, the DGs should be placed at three relevant sites (bus 29, 25, 15) to reduce real power losses. The reconfiguration of the network takes place using the proposed modified satin bower bird algorithm given in Tab. 11
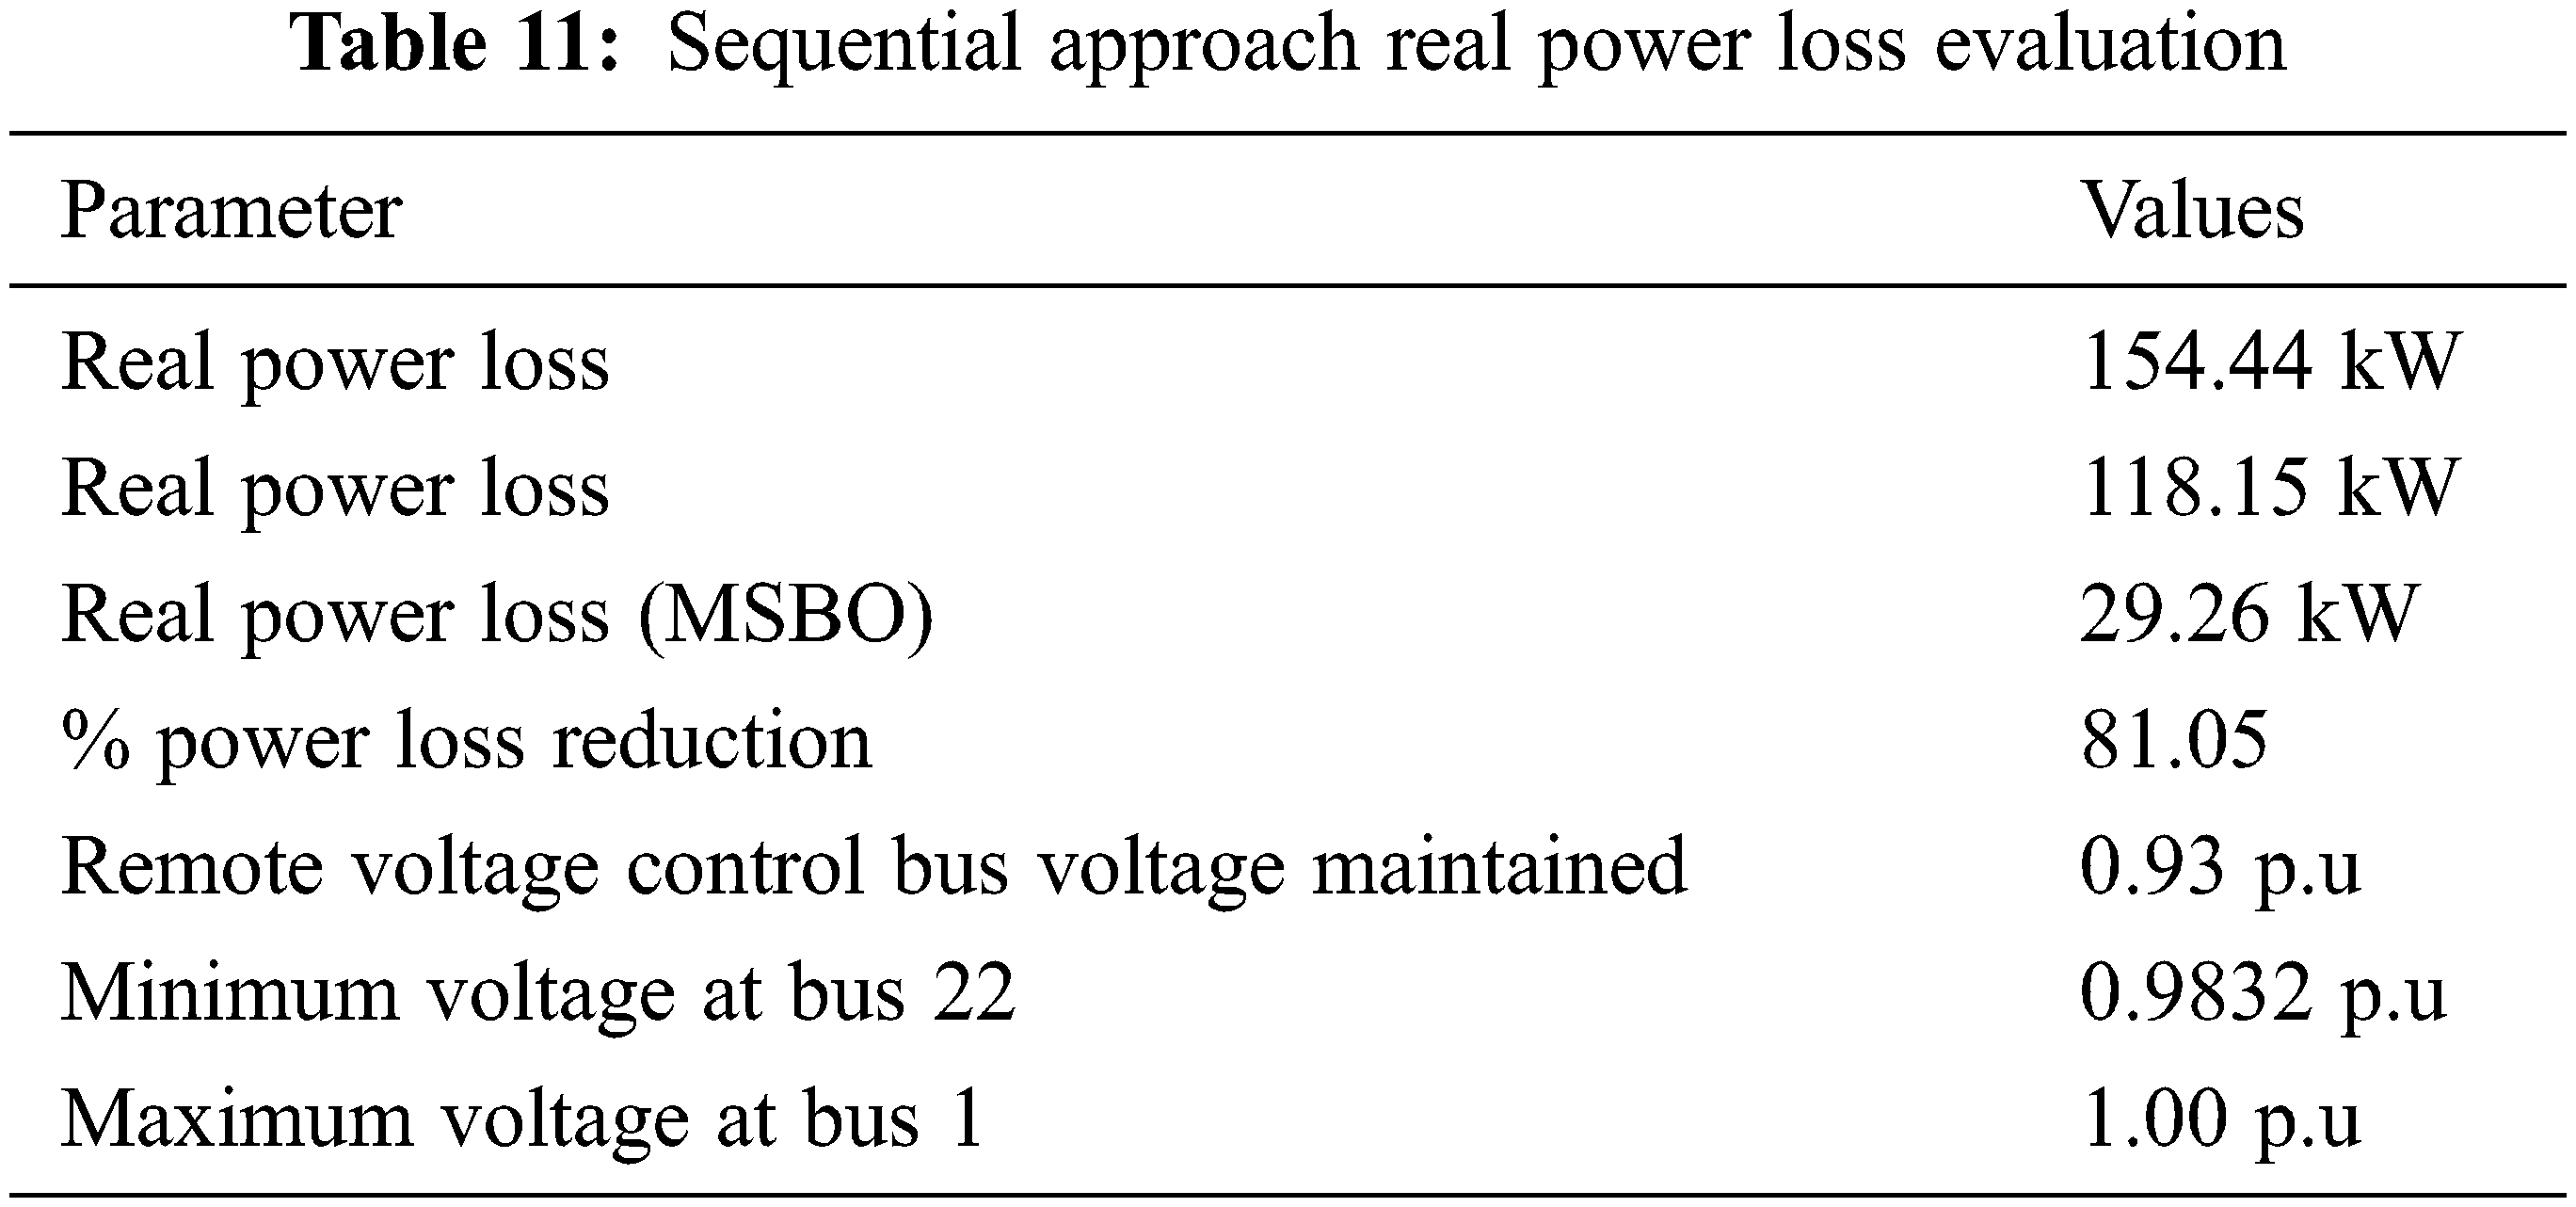
After the reconfiguration process, the power loss in the PQV remote voltage control bus is reduced by 81.05%. It also improved the voltage profile at bus 22. It was achieved with the help of optimal DG placement using genetic algorithm and the proposed modified satin bowerbird algorithm.
According to the results of the aforementioned analysis, the proposed reconfiguration performed well in both DG installation approaches. However, as compared to the non-sequential strategy, it effectively reduced the power loss in sequential strategy.
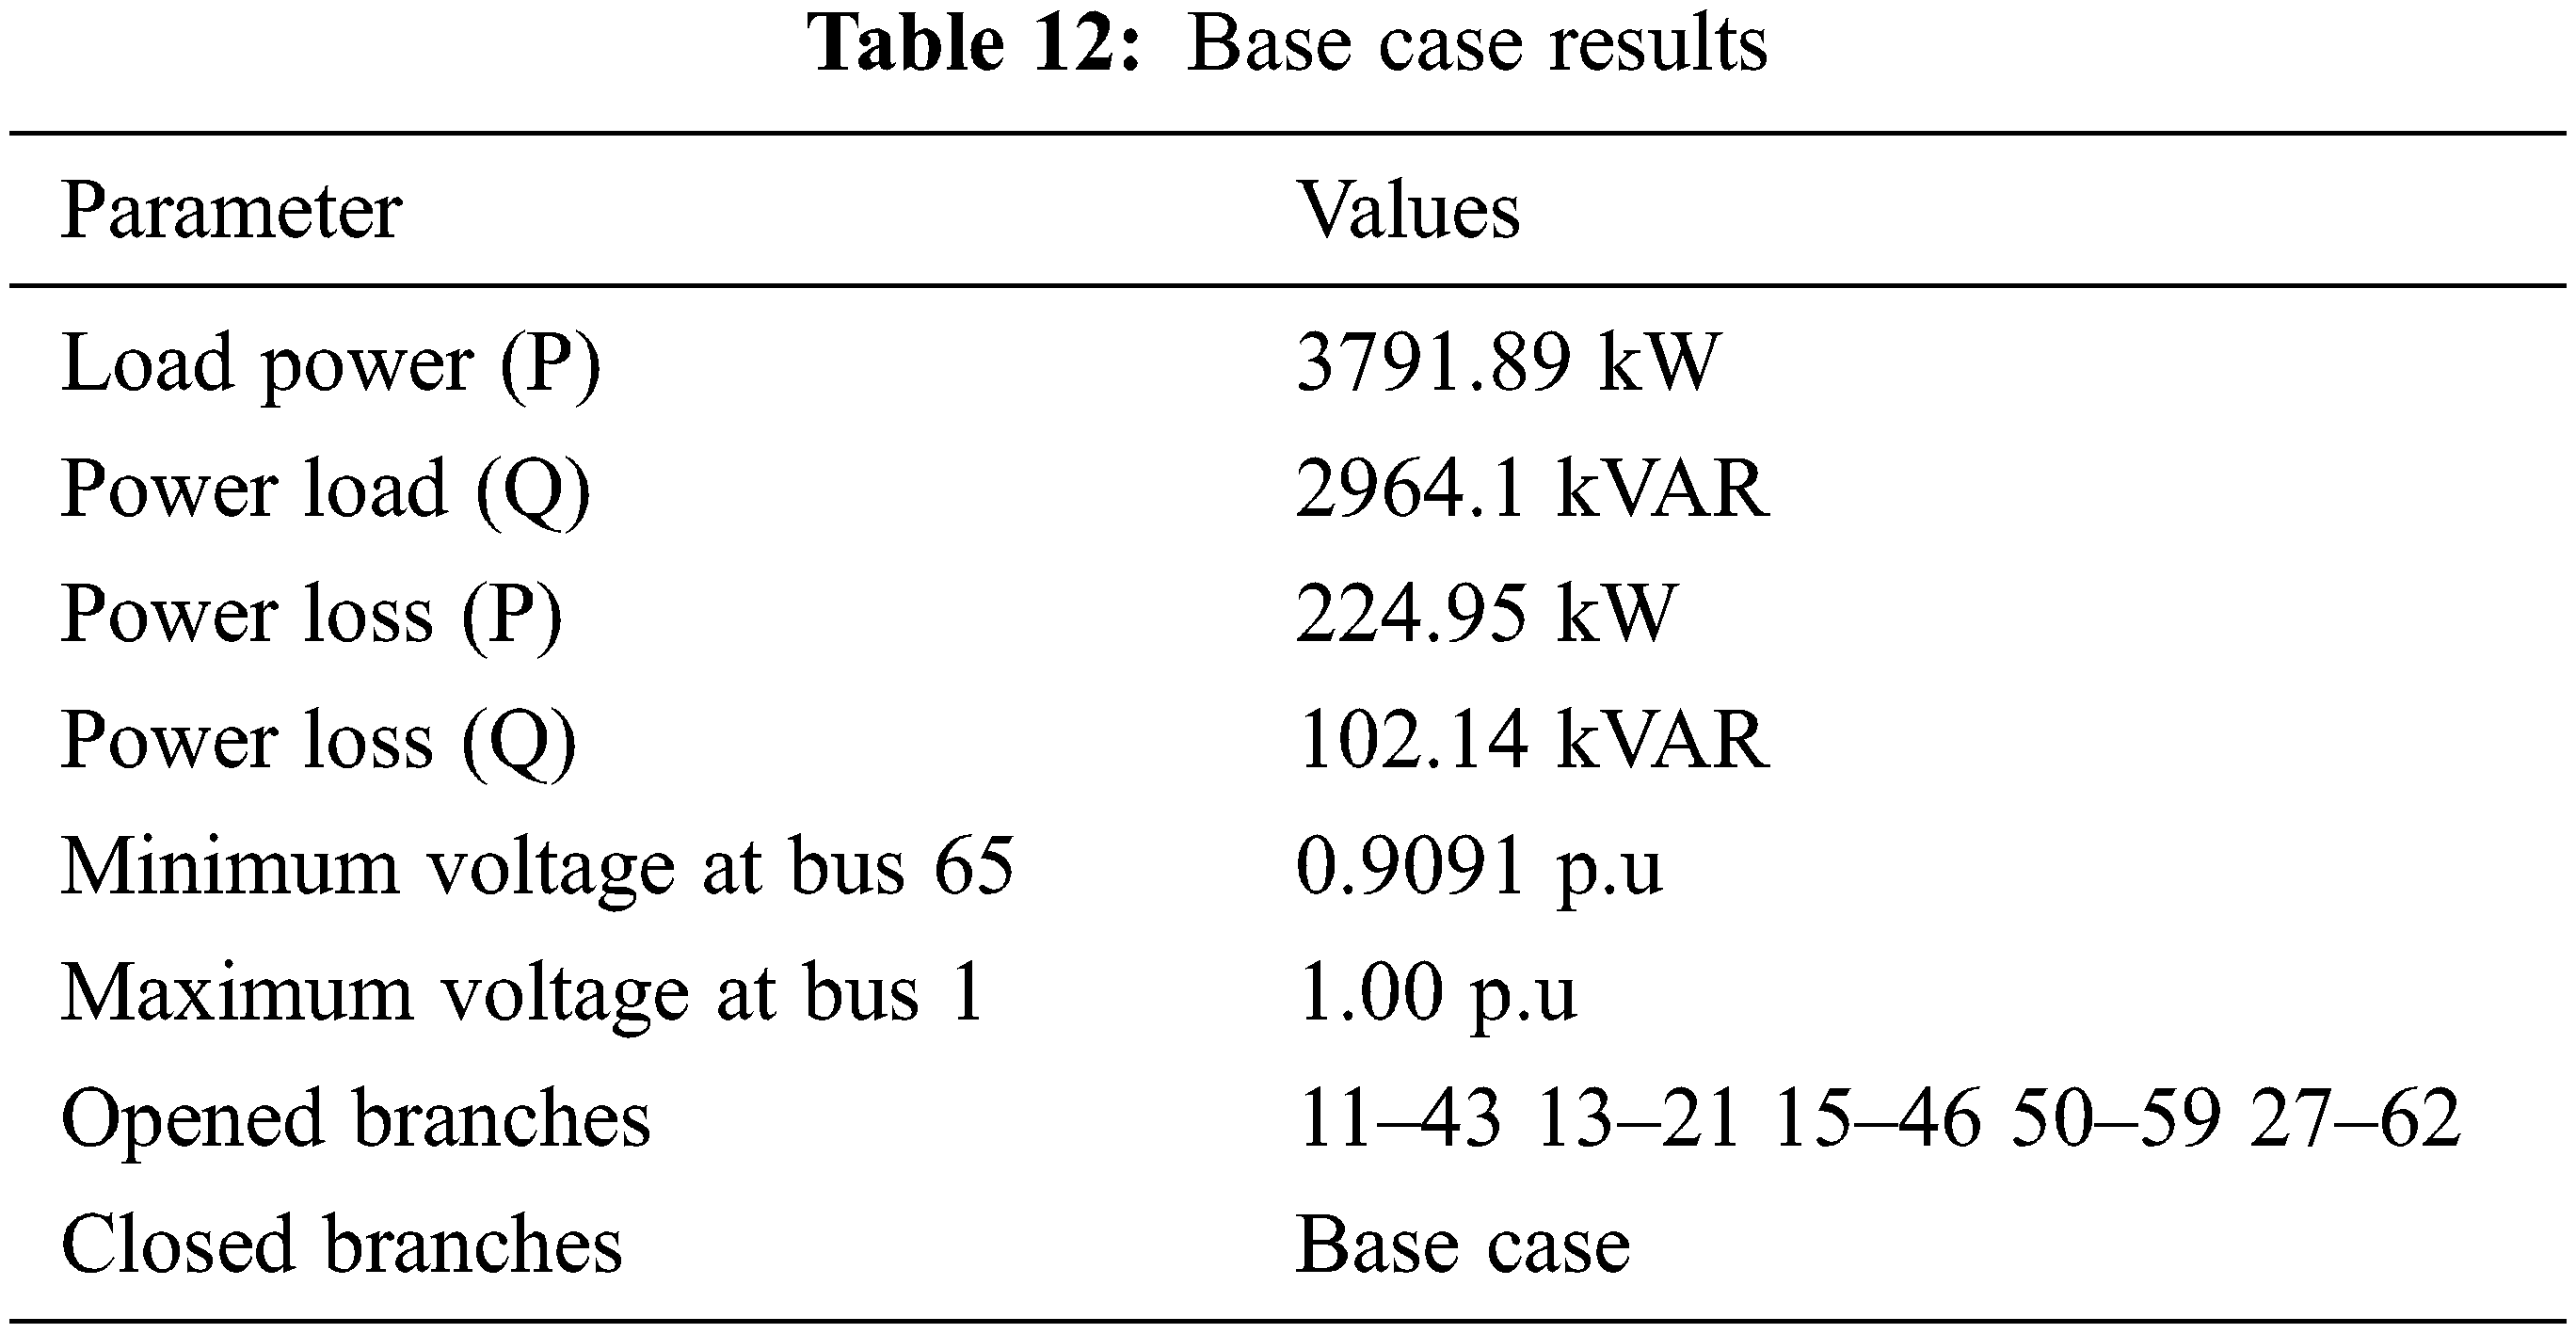
For the second example, Tab. 12 illustrates the load flow outcome of a 69 bus distribution network. When only PQ buses are considered, the real power loss in this network is 224.95 kW. The network's minimum voltage is 0.90911 p.u., which is found at Bus 65.
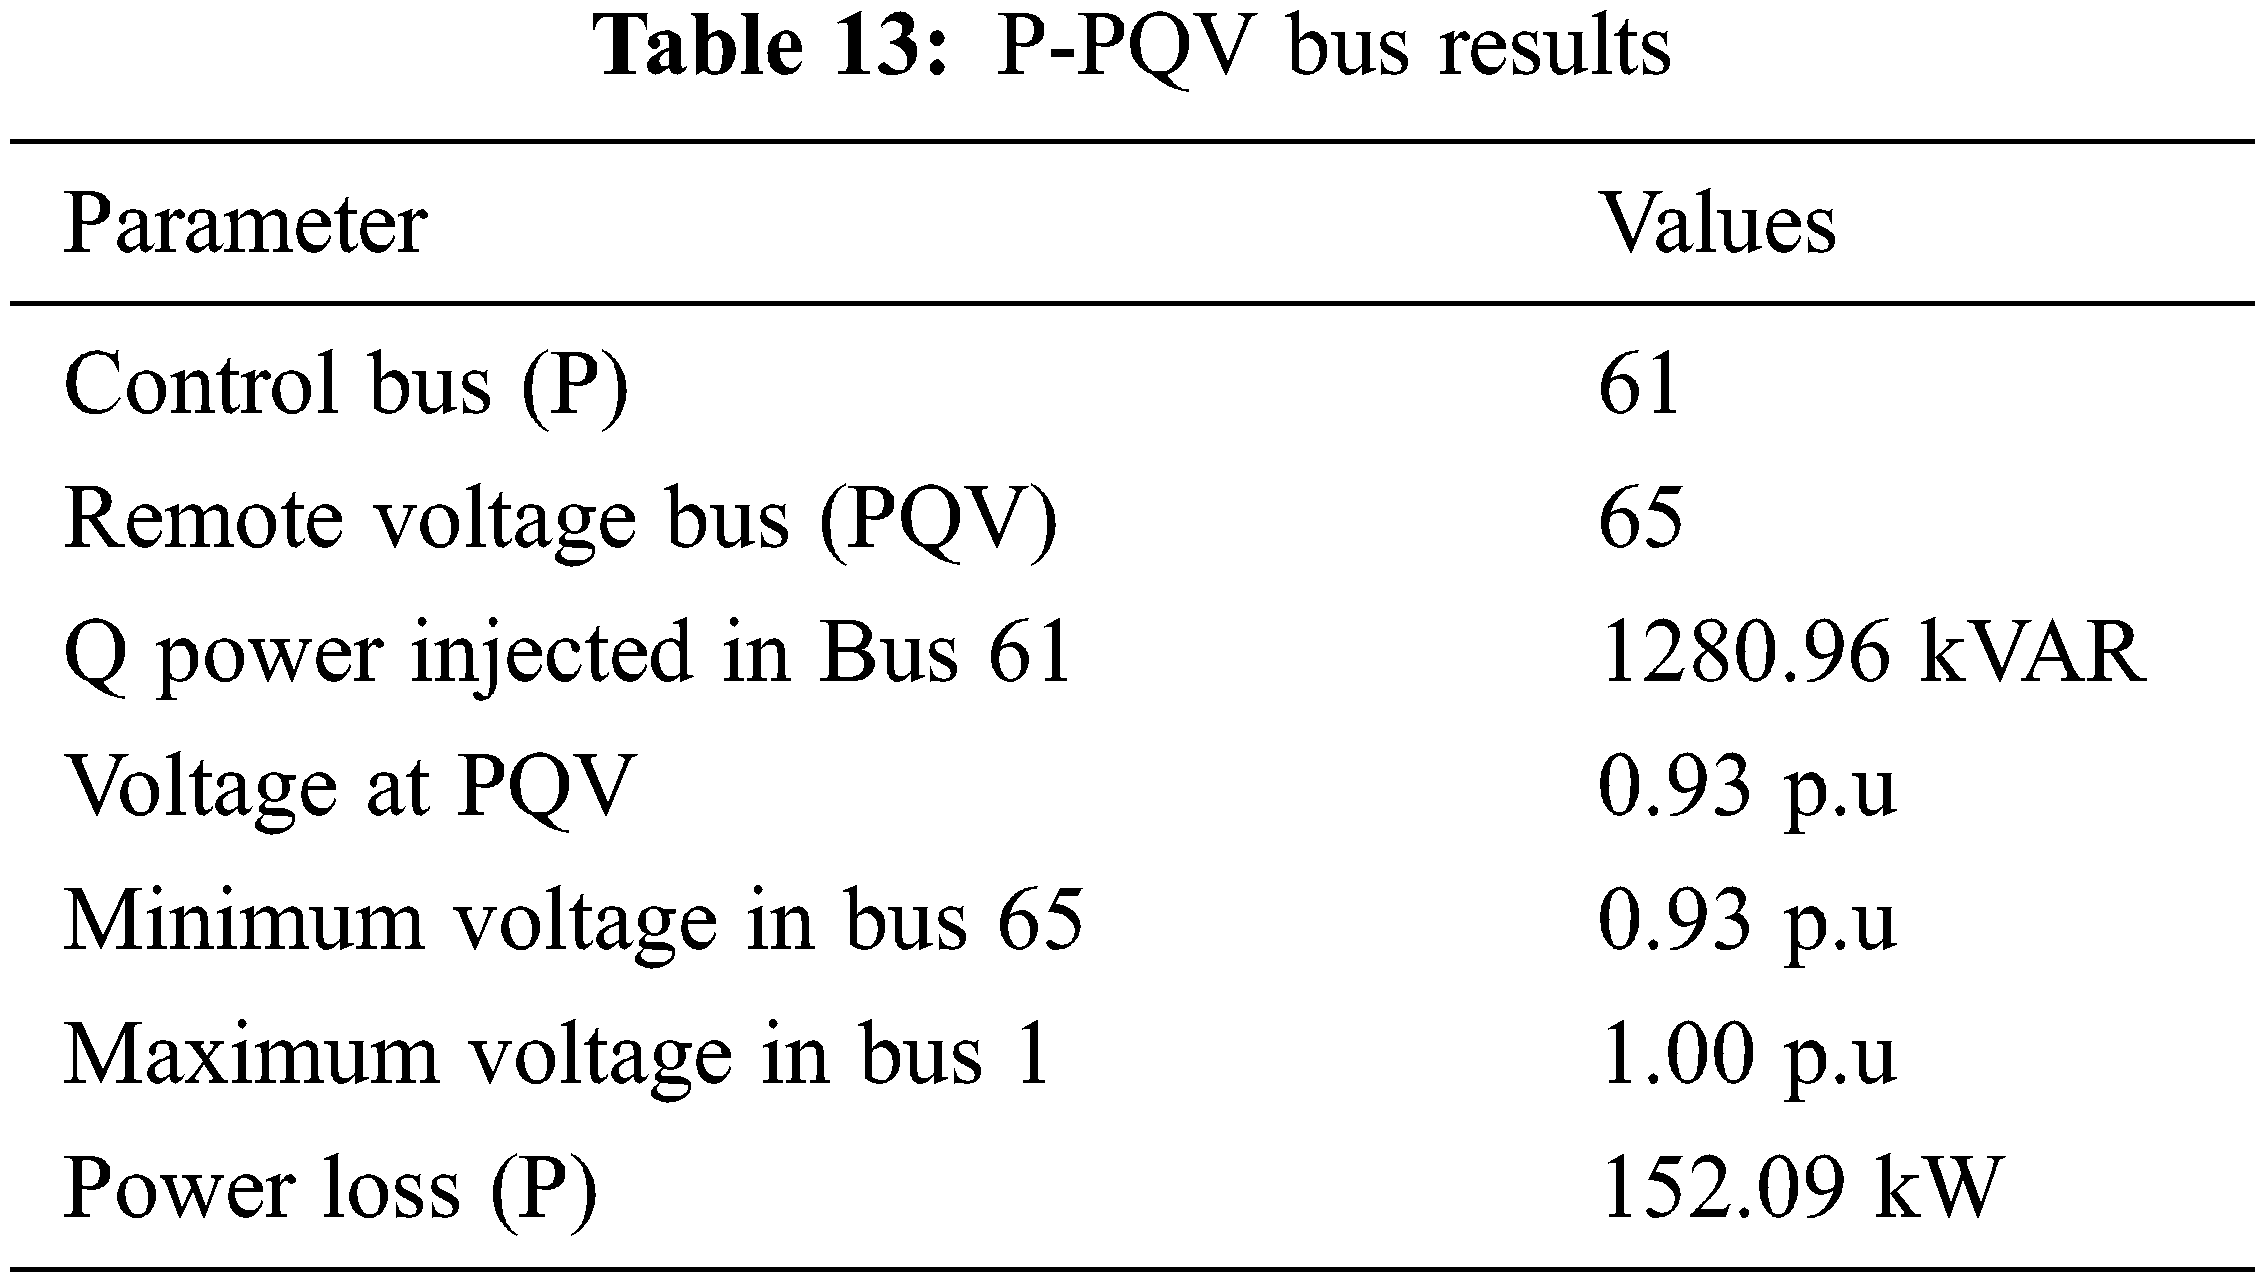
After the introduction of the remote voltage control bus process, the power loss (P) is minimized to 152.09 kW. It is achieved by modifying the basecase 33 system by considering bus 61 as P bus by injecting the power of 1280.966 kVAr and Bus 65 as PQV bus and the voltage to be maintained is shown in Tab. 13.
The DGs are then assigned to 69 bus distribution networks, which include P and PQV buses. According to the non-sequential method and genetic algorithm, the DGs should be placed at three relevant sites (bus 62, 63 61) to reduce real power losses. The reconfiguration of the network takes place using the proposed modified satin bower bird algorithm given in Tab. 14.
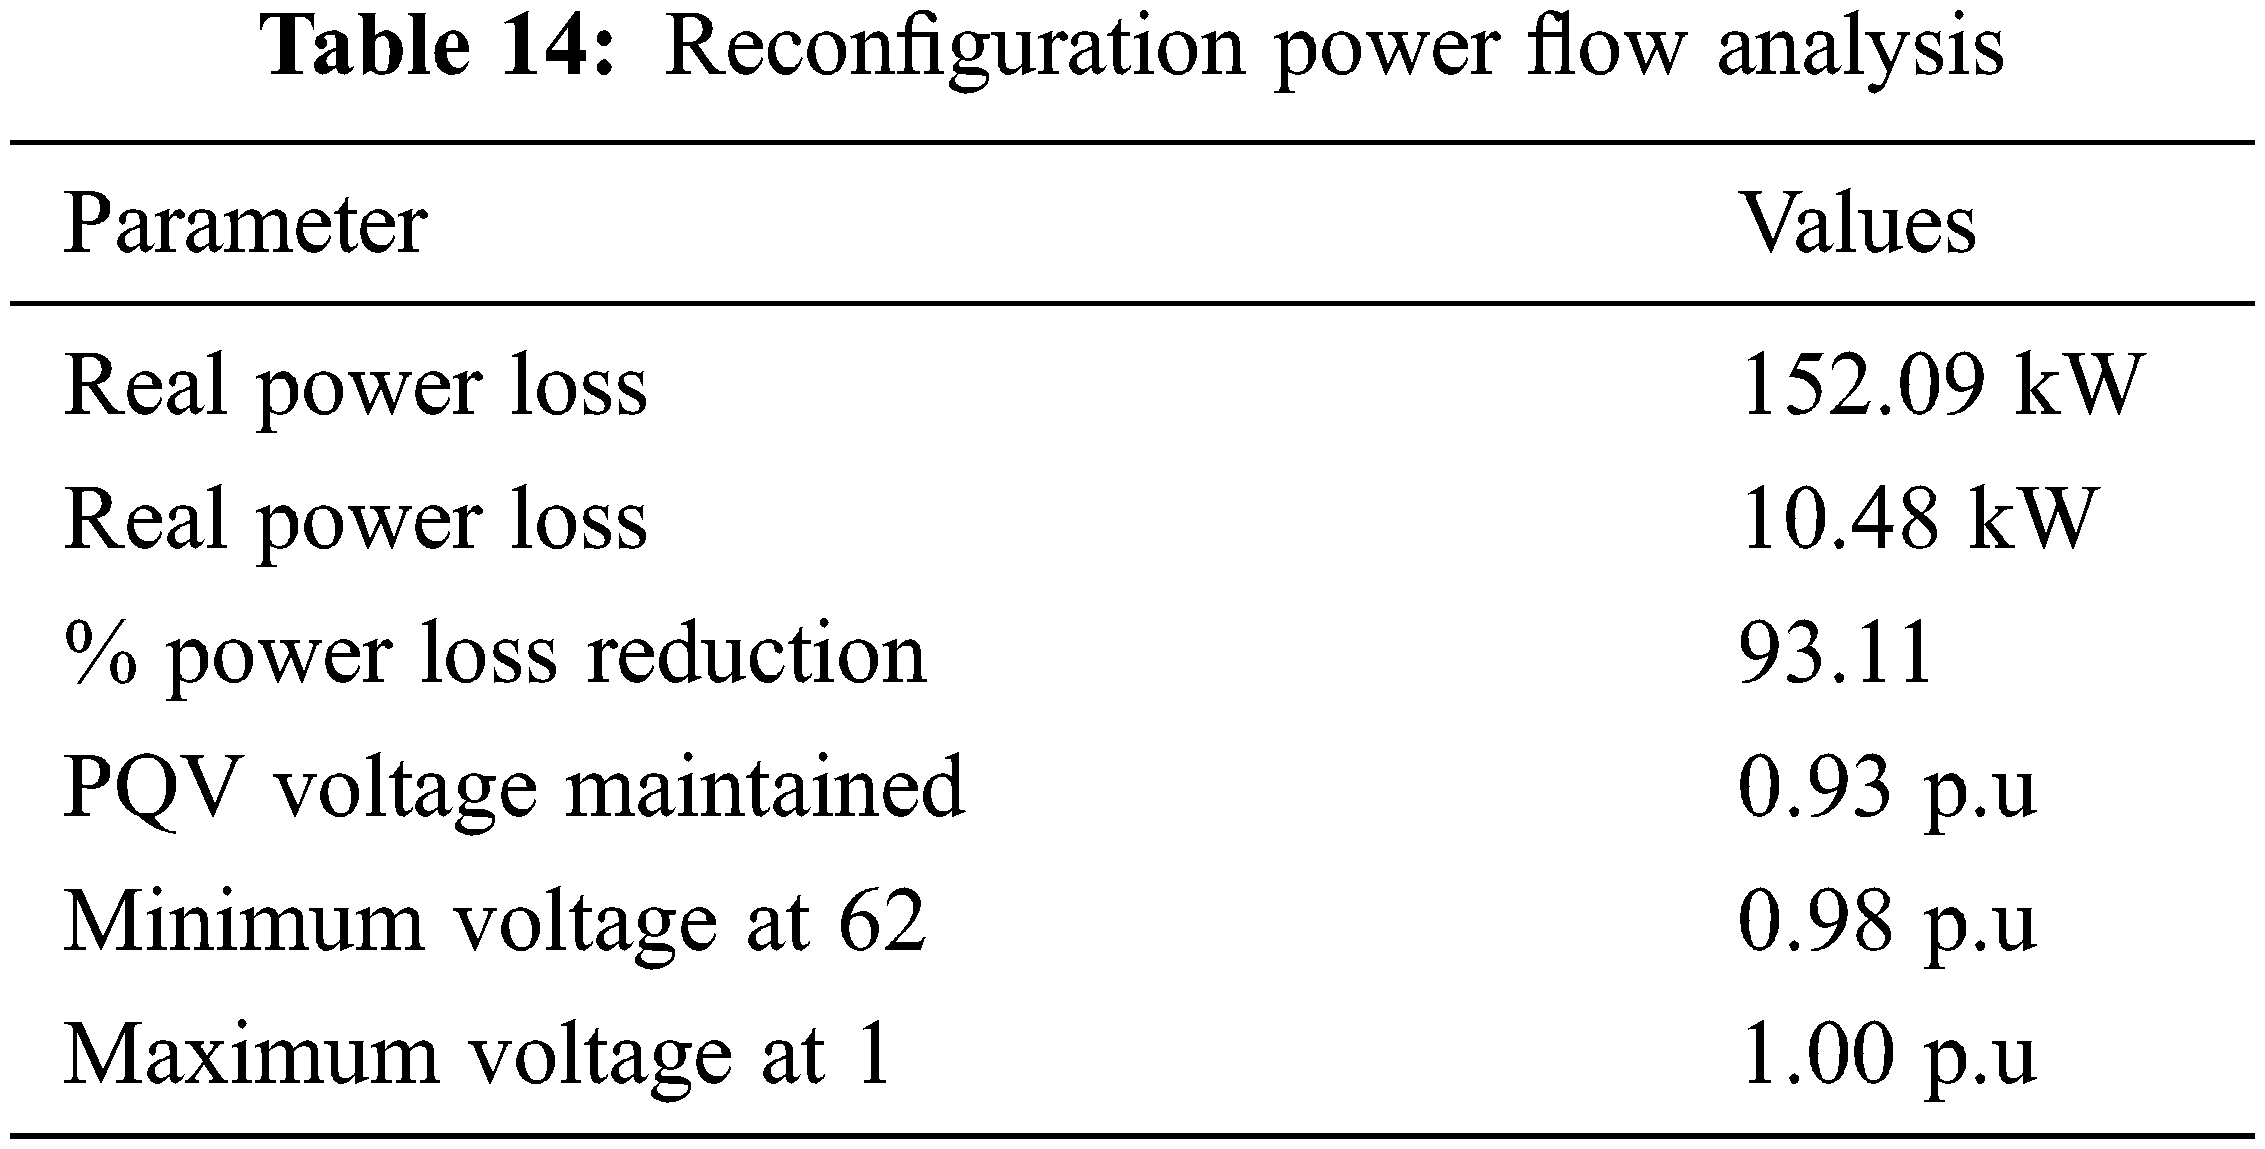
After the reconfiguration process, the power loss in the PQV remote voltage control bus is reduced by 93.11%. It also improved the voltage profile at bus 65. It was achieved with the help of optimal DG placement using genetic algorithm and the proposed modified satin bowerbird algorithm.
The DGs are then assigned to 69 bus distribution networks, which include P and PQV buses. According to the sequential method and genetic algorithm, the DGs should be placed at three relevant sites (bus 62, 16 and 50) to reduce real power losses. The reconfiguration of the network takes place using the proposed modified satin bower bird algorithm given in Tab. 15
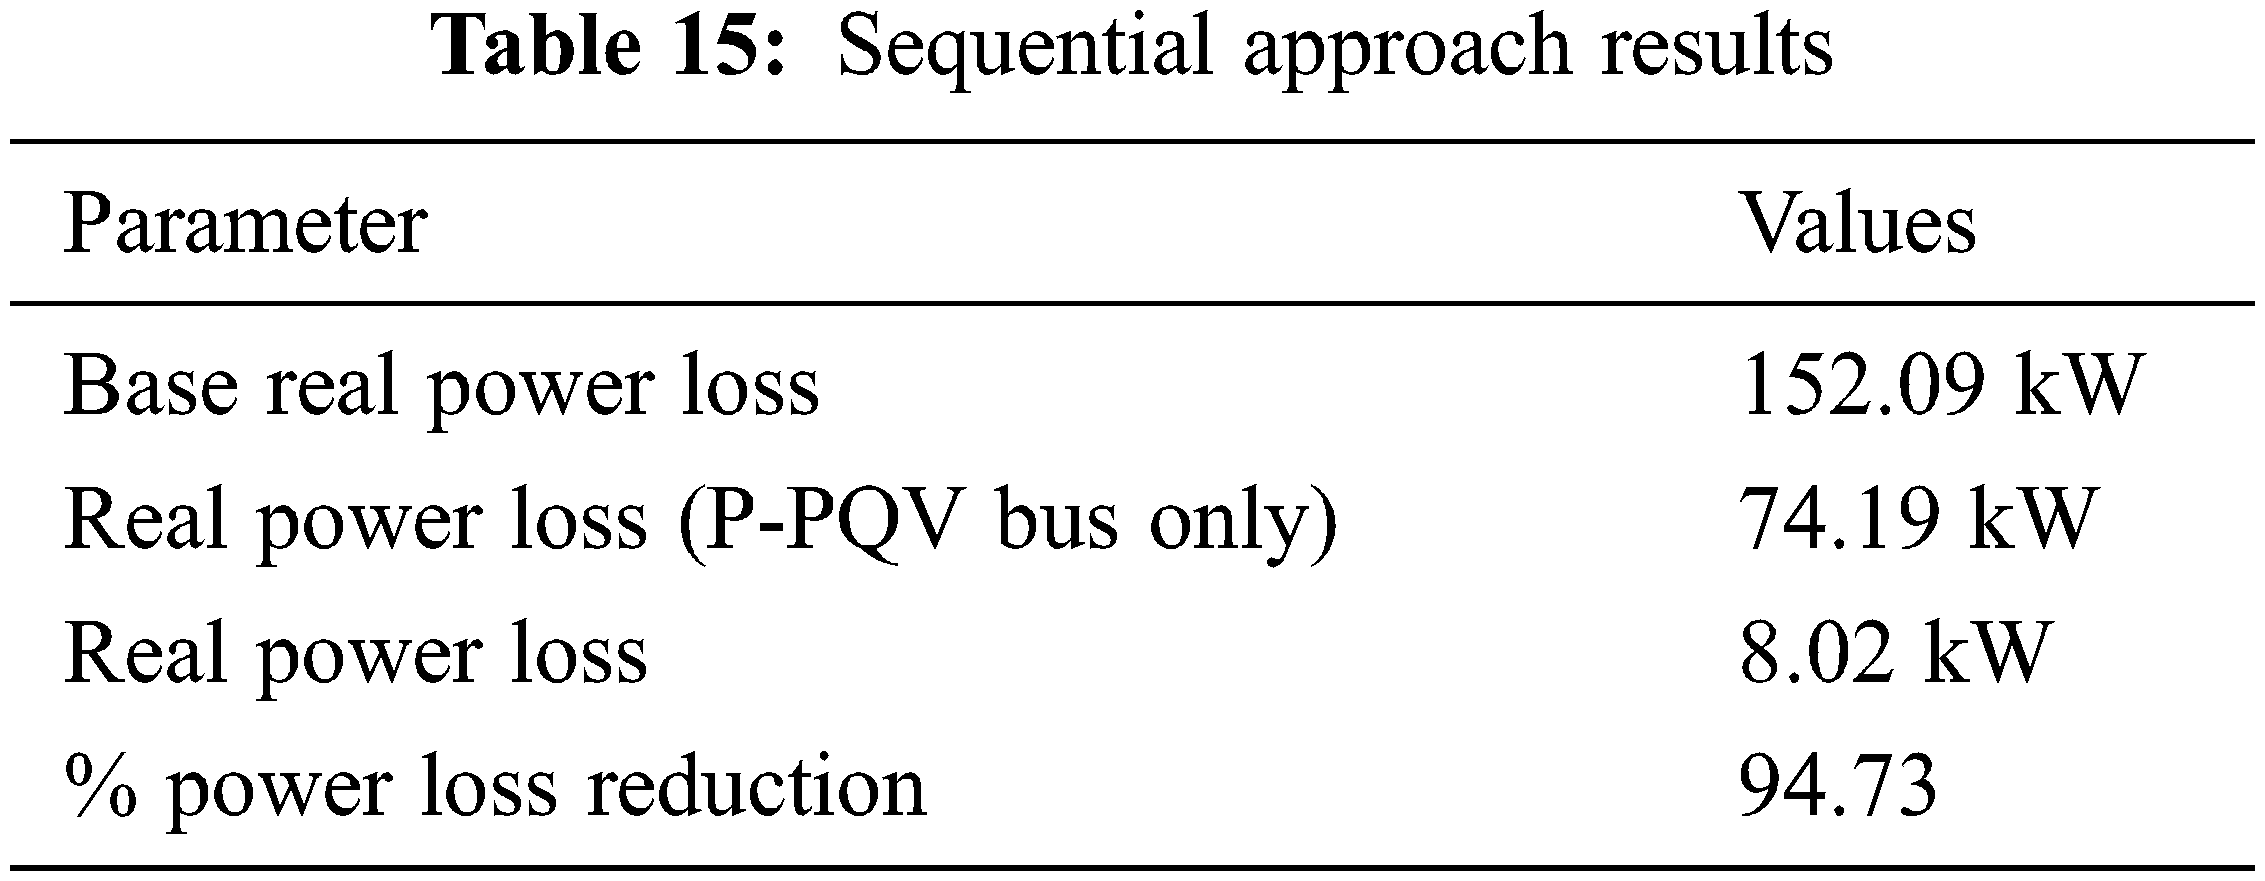
After the reconfiguration process, the power loss in the PQV remote voltage control bus is reduced by 94.73%. It also improved the voltage profile at bus 65. It was achieved with the help of optimal DG placement using genetic algorithm and the proposed modified satin bowerbird algorithm.
According to the results of the aforementioned analysis, the proposed reconfiguration performed well in both DG installation approaches. However, as compared to the non-sequential strategy, it effectively reduced the power loss in sequential strategy.
5.3 Comparison of Reconfiguration Mechanism
Tab. 16 compares the power loss reduction in sequential method for both bus systems based on conventional and proposed reconfiguration mechanisms modified circular and modified satin bower bird optimization.
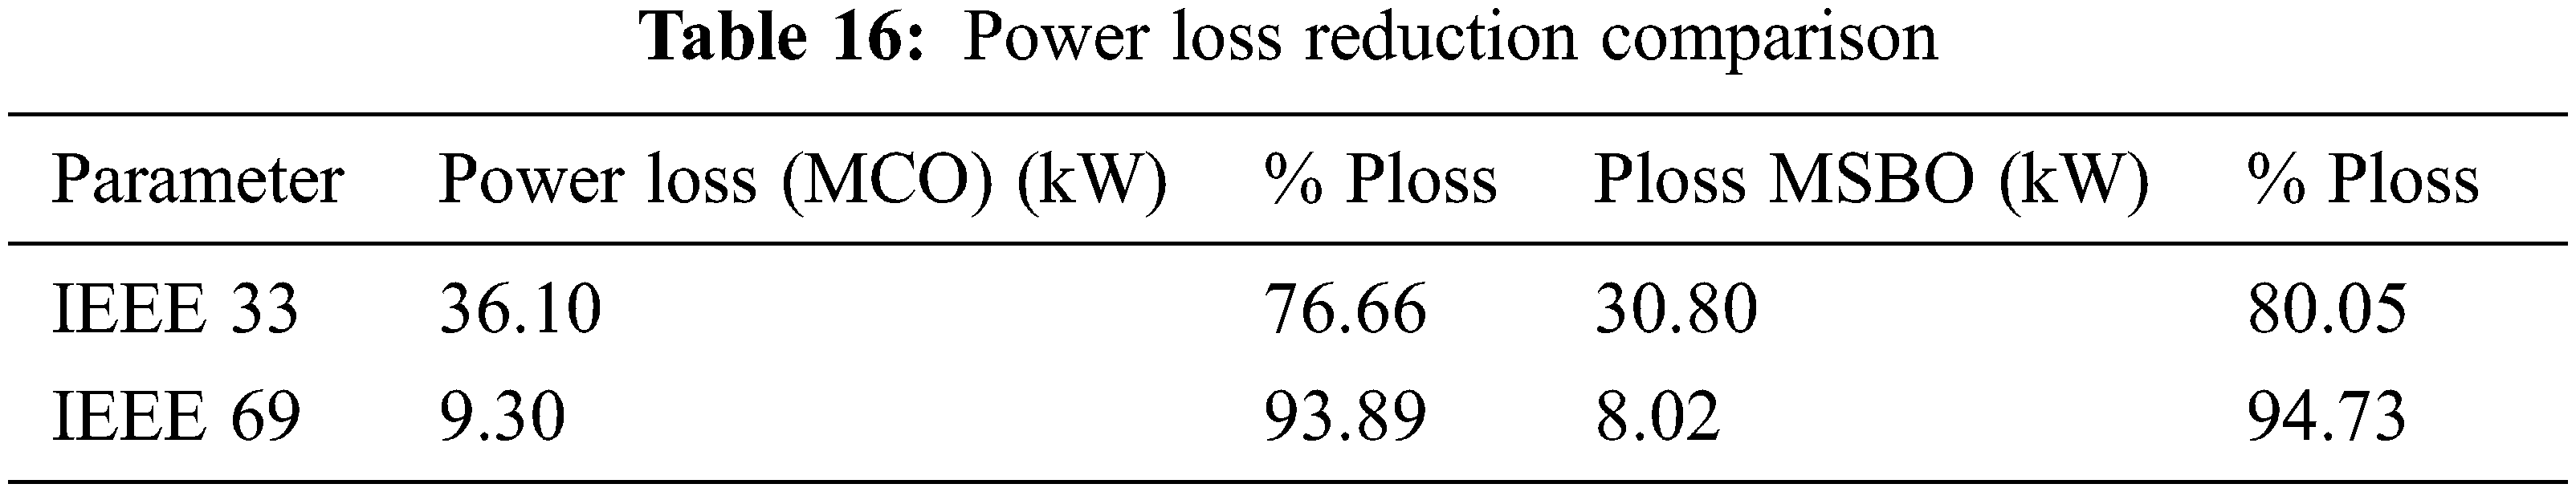
In comparison to the existing modified circular mechanism, the proposed reconfiguration technique, namely modified satin bower bird algorithm, achieved improved power loss for both systems, as shown in Tab. 16.
As a result, for the remote voltage control bus, the proposed network reconfiguration technique is the best.
In this paper, the voltage profile in the IEEE 33 and 69 bus system is improved and power loss reduction is performed with the help of remote voltage control bus and network reconfiguration approach. For this, the genetic algorithm with sequential approach is utilized for the distributed generator placement and its injection power is determined. Then, the network is reconfigured with the help of a modified satin bowerbird algorithm. The proposed modified satin bowerbird algorithm is best as compared to the existing system as follows:
• It reduced the power loss effectively as compared to the basecase and modified circular configuration.
• It processes all the branches at the same time and also checks the radial condition.
• The processing time is minimum as it processes multiple branches at a same time as compared to the modified circular configuration.
In the future, a single optimization approach might be used to optimise voltage profile by performing both DG placement and network reconfiguration.
Funding Statement: The authors received no specific funding for this study.
Conflicts of Interest: The authors declare that they have no conflicts of interest to report regarding the present study.
1. A. Asrari, T. Wu and S. Lotfifard, “The impacts of distributed energy sources on distribution network reconfiguration,” IEEE Transactions on Energy Conversion, vol. 31, no. 2, pp. 606–613, 2016. [Google Scholar]
2. H. Wang, “A robust measurement placement method for active distribution system state estimation considering network reconfiguration,” IEEE Transactions on Smart Grid, vol. 9, no. 3, pp. 2108–2117, 2016. [Google Scholar]
3. T. T. Nguyen, A. V. Truong and T. A. Phung, “A novel method based on adaptive cuckoo search for optimal network reconfiguration and distributed generation allocation in distribution network,” International Journal of Electrical Power and Energy Systems, vol. 78, no. 1, pp. 801–815, 2016. [Google Scholar]
4. A. Khodabakhshian and M. H. Andishgar, “Simultaneous placement and sizing of DGs and shunt capacitors in distribution systems by using IMDE algorithm,” International Journal of Electrical Power and Energy Systems, vol. 82, no. 1, pp. 599–607, 2016. [Google Scholar]
5. F. Abbasi and S. M. Hosseini, “Optimal DG allocation and sizing in presence of storage systems considering network configuration effects in distribution systems,” IET Generation, Transmission and Distribution, vol. 10, no. 3, pp. 617–624, 2016. [Google Scholar]
6. N. K. Meena, A. Swarnkar, N. Gupta and K. R. Niazi, “Multi-objective Taguchi approach for optimal DG integration in distribution systems,” IET Generation, Transmission and Distribution, vol. 11, no. 9, pp. 2418–2428, 2017. [Google Scholar]
7. K. I. Sgouras, A. S. Bouhouras, P. A. Gkaidatzis, D. I. Doukas and D. P. Labridis, “Impact of reverse power flow on the optimal distributed generation placement problem,” IET Generation, Transmission and Distribution, vol. 11, no. 18, pp. 4626–4632, 2017. [Google Scholar]
8. S. F. Santos, D. Z. Fitiwi, M. R. Cruz, C. M. Cabrita and J. P. Catalão, “Impacts of optimal energy storage deployment and network reconfiguration on renewable integration level in distribution systems,” Applied Energy, vol. 185, no. Jan., pp. 44–55, 2017. [Google Scholar]
9. M. Abdelaziz, “Distribution network reconfiguration using a genetic algorithm with varying population size,” Electric Power Systems Research, vol. 142, no. 4, pp. 9–11, 2017. [Google Scholar]
10. T. T. Nguyen, T. T. Nguyen, A. V. Truong, Q. T. Nguyen and T. A. Phung, “Multi-objective electric distribution network reconfiguration solution using runner-root algorithm,” Applied Soft Computing, vol. 52, no. 1, pp. 93–108, 2017. [Google Scholar]
11. S. Ganesh and R. Kanimozhi, “Meta-heuristic technique for network reconfiguration in distribution system with photovoltaic and D-STATCOM,” IET Generation, Transmission and Distribution, vol. 12, no. 20, pp. 4524–4535, 2018. [Google Scholar]
12. M. A. Muhammad, H. Mokhlis, K. Naidu, J. F. Franco and H. A. Illias, “Integrated database approach in multi-objective network reconfiguration for distribution system using discrete optimisation techniques,” IET Generation, Transmission & Distribution, vol. 12, no. 4, pp. 976–986, 2018. [Google Scholar]
13. X. Ji, Q. Liu, Y. Yu, S. Fan and N. Wu, “Distribution network reconfiguration based on vector shift operation,” IET Generation, Transmission & Distribution, vol. 12, no. 13, pp. 3339–3345, 2018. [Google Scholar]
14. S. Quadri, S. Bhowmick and D. Joshi, “A comprehensive technique for optimal allocation of distributed energy resources in radial distribution systems,” Applied Energy, vol. 211, no. 2, pp. 1245–1260, 2018. [Google Scholar]
15. Y. Li, B. Feng, G. Li, J. Qi, D. Zhao et al., “Optimal distributed generation planning in active distribution networks considering integration of energy storage,” Applied Energy, vol. 210, no. 2, pp. 1073–1081, 2018. [Google Scholar]
 | This work is licensed under a Creative Commons Attribution 4.0 International License, which permits unrestricted use, distribution, and reproduction in any medium, provided the original work is properly cited. |