DOI:10.32604/iasc.2023.026134
| Intelligent Automation & Soft Computing DOI:10.32604/iasc.2023.026134 | |
| Article |
DeepWalk Based Influence Maximization (DWIM): Influence Maximization Using Deep Learning
1Department of Information Technology, Delhi Technological University, New Delhi, 110039, India
2Department of Computer Science, University of Delhi, New Delhi, 110007, India
*Corresponding Author: Kapil Sharma. Email: kapil@ieee.org
Received: 16 December 2021; Accepted: 20 March 2022
Abstract: Big Data and artificial intelligence are used to transform businesses. Social networking sites have given a new dimension to online data. Social media platforms help gather massive amounts of data to reach a wide variety of customers using influence maximization technique for innovative ideas, products and services. This paper aims to develop a deep learning method that can identify the influential users in a network. This method combines the various aspects of a user into a single graph. In a social network, the most influential user is the most trusted user. These significant users are used for viral marketing as the seeds to influence other users in the network. The proposed method combines both topical and topological aspects of a user in the network using collaborative filtering. The proposed method is DeepWalk based Influence Maximization (DWIM). The proposed method was able to find k influential nodes with computable time using the algorithm. The experiments are performed to assess the proposed algorithm, and centrality measures are used to compare the results. The results reveal its performance that the proposed method can find k influential nodes in computable time. DWIM can identify influential users, which helps viral marketing, outlier detection, and recommendations for different products and services. After applying the proposed methodology, the set of seed nodes gives maximum influence measured with respect to different centrality measures in an increased computable time.
Keywords: Deep learning; influence maximization; graph embedding; deepwalk
Nowadays, social networking sites (SNS) have given a new dimension to Online Data (Big Data). Companies and business houses direct their efforts to utilize this important data for product awareness, innovation, and designs. An effective product promotion strategy aims at a wide range of audiences with a limited budget. In such a scenario, social networking sites have proven to be powerful marketing platforms like Facebook, Twitter, flicker, etc. Allow web users to make friends worldwide and interact with them. The interactions include sharing thoughts, opinions and experiences on politics, country, products, etc. Moreover, these growing social ties and exchanges among web users on social networking sites make them a powerful information diffusion platform. Various studies in the literature consider SNS as a medium to reach widespread customers for promoting products and services [1]. The emergence of online social networks (OSN) leads to information diffusion analysis, so there are great chances for research to analyze SN and information flow modelling. In a real-world scenario, information flow in networks is studied, aiming to obtain patterns, trends, and models representing the diffusion of knowledge, services, products, etc. Chhabra et al. [2] proposed models regarding the diffusion of new products. One of the examples is the Bass model [Bass, 1969] [3], which used to predict regarding the adoption which was based on the comparative innovator’s population which does not get influenced by others’ decisions and on the other side imitators who use to adopt based on adoptions in the system. Katona et al. (2011) [4] analyzed the online social network dataset to see the effect of word-of-mouth, focusing on how the influence flow process gets affected by the local communication network structure. They showed that the closely-knit communities facilitate a higher influence rate by word-of-mouth. The influential node uses to have higher influential power than the other nodes in the network.
Conversely, they concluded that having a higher degree means having more friends does not have higher influential power in the network. So they concluded that the demographic data does matter with the global network variables for selecting the influencer and the adopters in the network. Similarly, Bhat et al. [5] (2013) analyzed the user’s influential power that falls under different SN communities, i.e., overlapping nodes. They concluded that the highly overlapping nodes are the best influential node in the social network.
1.1 Mathematical Models for Information Diffusion:
Some basic mathematical models to analyze information diffusion in the social network are as follows:
Threshold Models: In a threshold model, a user (node) says x in a network becomes activated (action got adopted) when a specified number of users (node) got activated in x’s neighbourhood, there are a certain number of users (nodes) specified as threshold who got activated in the network only then user(node) x got activated. [Granovetter, 1987] [6] is the one who proposed the linear threshold model.
Cascade Models (Zaremba et al.) [7]; proposed cascade models regarding information diffusion were each activated (who adopts an action) individual of social network has an only chance which is probabilistic to activate neighborhood inactive individual or node in its social network. Independent Cascade (IC) model suggested by Goldenberg et al. (2001) is an example of cascaded models. Initially, there are some finite number of activated nodes in the social network. The information diffusion process keeps on proceeding with time. Each time step x node which becomes activated tries to activate each neighbourhood y inactive node without considering the set of neighbours of x that have been attempted to activate y previously. This process keeps on going, whether x becomes activated, or y becomes activated unless no further contact remains in the process. When there is no activation of the inactive neighbourhood node, the process gets terminated. Kempe et al. (2003) [8] proposed a comprehensive model for linear threshold and the independent cascade models.
1.2 Mining of Opinion Leader (Influential Nodes)
The social networks are potent enough to get exploited and to increase awareness of any brand/service/product in many folds, with the flow of word-of-mouth(WOM) facilitating social contagion. Trusov et al. (2009) [9] enumerate the impact of word-of-mouth references based on the online social network dataset with new members who joined the site. Their study was helpful to reveal that Word-of-mouth referrals enormously facilitated the online social network’s new members. The impact of WOM was high as compared to marketing events and media appearances in many folds. Moreover, some customers or individuals in the social network are potent enough to affect individuals’/customers’. Adoption behavior in the network, their opinion, and adoption behavior matter greatly in the social network. Such customers/individuals are known as the influential nodes in social networks. They are the main focus of the business house, organization, manufacturers of the products, and marketing [Van den Bulte et al.] [10].
Viral marketing utilizes social networks to increase product/service/brand awareness and achieve a higher marketing goal. The marketing goals include increasing product/brand/service sale by introducing a self-replicating viral process similar to that of a similar one to the spread of computer viruses or pathological viruses. Viral marketing programs consist of identifying people/customer/individuals having high social networking potential (size of the social network of customer/ individual and their influencing ability in the network) or network value and to create motivating viral messages for the set of population reachable by the opinion leader so that good number of customers can be activated for the brand. The customers in a social network are having network value which is defined as an increased sale which is expected from that customer who is focused on marketing as compared to the other customers (Domingos, 2005). Domingos et al. (2005) [11] proposed some influencing factors collectively responsible for the network value of a customer positively. The influencing factors are like higher links in the network, interest in brand/service/product, or leadership in the network, so the cascading influence is high.
Kempe et al. (2003) [12] proposed a problem that involved seeding the optimal number of influential nodes for Viral marketing with a limited budget. This strategy consists of motivating the word-of-mouth by providing some perk in term of discounts or by providing free products to the influential nodes/consumers with an assumption for these opinion leaders that they will converse about the brand/product/service with their connected friends in the network which will motivate them to purchase those brand/product/service. The individual/people/customers got seeded with these initial brand/product/services to maximize the adoption of the product/brand/service, but it is not definite.
A survey presented by Sun et al. (2011) [13] summarised existing models to assess the influence where the concept of influence was in terms of basics of social networks such as the nodes’ degree, homophily, centrality (betweenness), and some others. The concept of influence was also explained in the form of actions and interactions of people in a social network. They also concluded how community structures in social networks help explain the influence. Moreover, they presented the basic models for influence maximization like the threshold and the Cascade models, including degree, centrality, and degree discount heuristic.
Goyal et al. (2008) [14] identified influential nodes in SN based on various user actions. Their approach required prior knowledge of the original network graph and log related to the actions of the users with their time stamps. They computed the influence graph and influence cube from available action log data and introduced various thresholds. They presented frequent pattern mining-based algorithm which identifies the leaders, confident leaders, and tribe leaders.
Agarwal et al. (2008) [15] by analyzing the influence of the blog post, proposed a model helpful in identifying the influential bloggers based on 4 properties of the blog like identification, originality, persuasiveness, and activity generation that form the parameters for their proposed model which on their tuning gives different types of influential bloggers. Moreover, their experiments also confirmed that it is not necessary to be an active blogger to become an influential blogger in the blogging community.
The main concern of these studies is to disseminate the product information in large volume [12,16–18] through some influential nodes [19–21]. This is one of the cost-effective e-marketing strategy termed as viral marketing [2,5]. This strategy focuses on identifying a few influential users called seeds. Initially, the products are provided to these seeds so that they can share their experiences with other users on social networks [22]. It exploits seeds’ social relationships and influential power to encourage faster product adoption [23]. However, the main concern of the strategy is to classify k no of users as in Fig. 1 that have maximum influence [6,12,24], but this objective is restricted by high computational cost to explore network and influence function estimation.
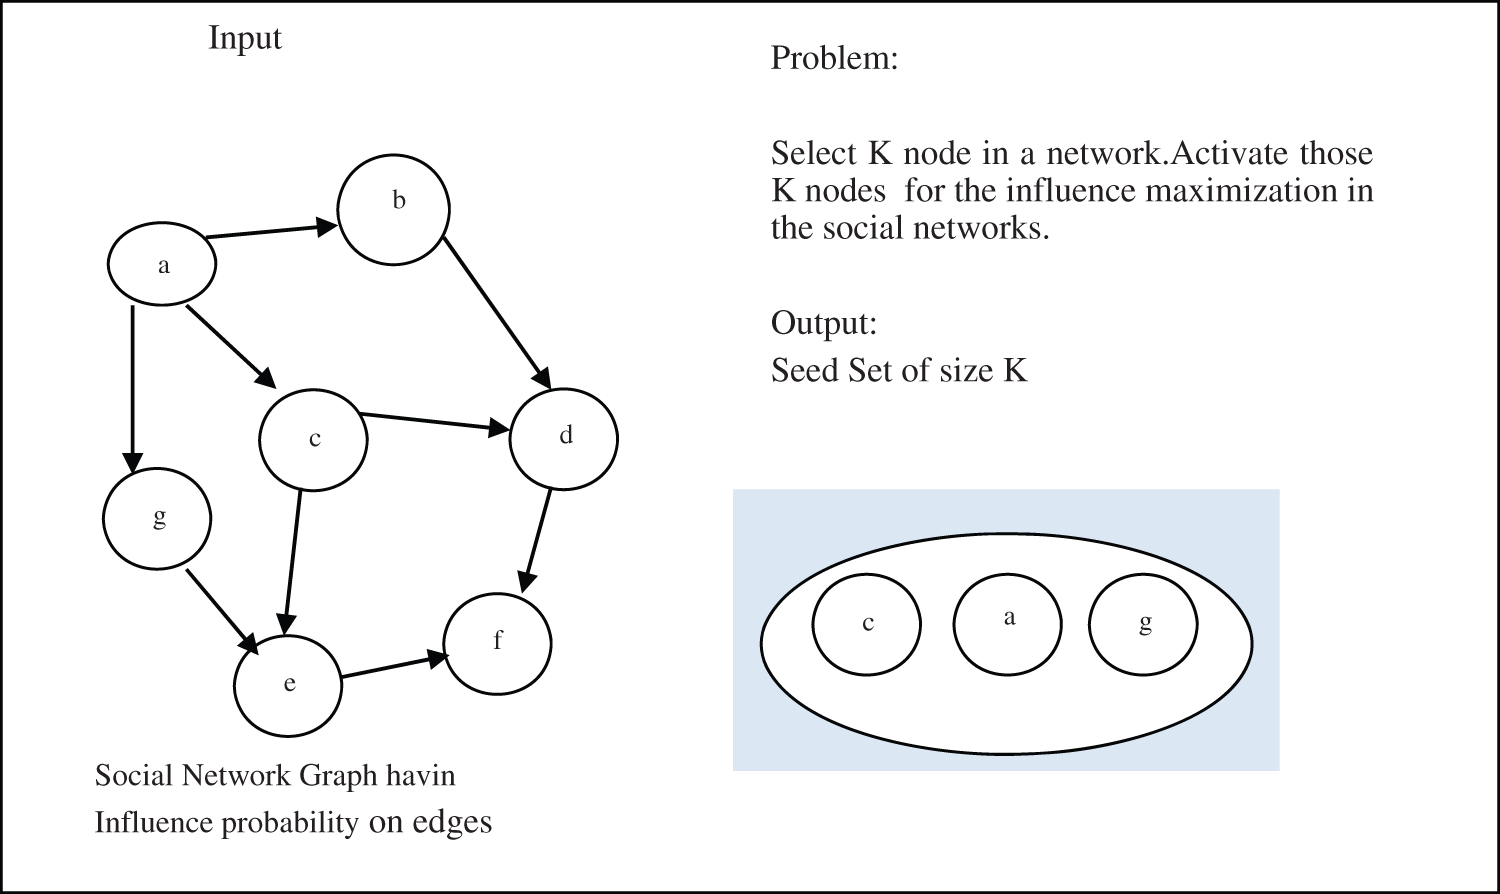
Figure 1: Influence maximization using K seeds
Recent research shows that the techniques and algorithms from Deep Learning such as layered neural networks, autoencoders, convolution graphs, graph embeddings are more promising to deal with social network analysis problems. This paper explores the viability of graph embedding to identify the most influential seeds. Graph embeddings mean transforming each data point in the network to a low-dimensional vector. These embeddings are classified into vertex embedding or graph embedding based on the objective. It can capture the topological behavior of nodes, the relationship between vertices, etc.
The presented work applies the graph embeddings to learn the pattern of social interactions among users and incorporated their interest to identify the most influential nodes that can spread the information in large volume for any product or service promotion.
The paper’s significant contributions are as below:
• It has combined both the topical and topological measures to find k influential social network users using deep learning concept in a computable time.
• The similarity between users and the topological aspects is also considered through which most influential k seed users can be found out for recommendation and product or service promotion.
• The proposed methodology’s result is compared with different centrality measures like degree, PageRank, eigenvector, and closeness centrality. So the k nodes are similar to the nodes given by these centrality measures, and this method also combines the topical features.
• According to the best of our knowledge, this is the first time similarity measures between users are considered to find k influencers using deep learning models with topological measures.
The paper organization is done in different sections. Section 1 introduces the problem dealt with in this paper: finding influential users in the network. After that, in Section 2 previously done work is discussed. In Section 3, the framework is explained based on deep learning concept, and the proposed algorithm DWIM is introduced. Section 4 discusses the experiments, dataset, and results using the proposed strategy using DWIM algorithm. The last section concludes the results which we get through the experiments using the proposed framework on the big data acquired by the social networks.
The influential factor in a social network plays an essential role in disseminating information. The influence of a user can be computed with respect to its centrality in the network which can be measured in various terms. The most prominent measures are:
1. Degree Centrality (DC): It means the number of links or ties that a node has.
2. Betweenness Centrality (BC): It represents the node’s significance to disseminate the information from source to destination.
3. Closeness centrality (CC): It shows how close a node is to all other nodes in the network.
Various variants of classical centrality measures such as Katz centrality [25], Google’s PageRank [26], alpha centrality [27]. Subgraph centrality [28] have been proposed in the literature to identify the most vital nodes. Studies also focused on methods that include the degree of trust and its propagation, game theory, etc. Moreover, it has been observed that users’ activities also influenced their acquaintances [9] moreover, to identify opinion leaders, the user’s actions have been analyzed to learn the frequent pattern [14]. However, not only the network topologies, text mining is also considered for the identification of opinion leaders [29,30]. Studies also focused on topic or domain-specific opinion leaders [31]. Leaders are also discovered by analyzing the community and their actions using a novel frequent pattern mining approach [18]. For efficient marketing, buyers are also ranked based on their past purchase behaviour on eBay [2]. Various heuristic models based on classical Linear Threshold (LT) propagation have been developed [3,8,32,33]. Rating behavior is also integrated into maximizing product adoption [34]. Various existing studies [1,11,35] related to viral marketing focused on influence maximization by a k number of seeds. Bhat et al. [5] proposed a greedy approach based on cascade models [36].
However, this effort provides impressive results but needs in-depth knowledge of the entire network that is time-consuming and unfeasible for many applications. In contrast, the presented work applies graph embedding to exploit the social network.
Reference [37] The paper proposed machine learning model to predict diffrent phases of the Covid like daily cases of corona positive, severity of corona and flattening of curve by analyzing the covid related dataset published by John Hopkins University.
Reference [38] This paper proposed a two-phase X-ray image classifcation called XCOVNet for COVID-19 detection at annn early stage using convolutional neural Networks model.
Reference [39] This paper is using deep learning and image proceeessing for automated bank cheque verification. They used convolutional neural networks.
In literature, graph embedding algorithms have been applied to many real-world applications. These embeddings learn the representations of each node into low dimensional space [40,41]. In the literature, these representations have been aggregated for predictions and recommendations [42,43]. Moreover, embeddings are used to learn user-item relationships in heterogeneous information networks [42,43] merged with text and image [44] and also capture asymmetric similarities for node recommendation [45], and random walks are used for node representation and are applicable to large-scale networks. The next section describes the proposed random walk based method to learn the influence of a node in the network.
This section explains the basic concept of Graph Embedding and studies its viability for influence maximization problems. The main module of the framework is to combine the topological and topical features of the social network user. In this paper, collaborative filtering and the cosine similarity are used to find each social network user’s similar users. After that, the graph embedding is done by randomly walking through the network created using the similarities between any two users. Similarities are used as the probability to activate other neighborhood users.
This section formally explains the Graph Embedding on social network data and its most prominent method i.e., Perozzi et al. [40], Graph embedding is basically to learn a mapping function that represents each word in the corpus to low-dimensional vector equation [Eq. (1)].
The basic concept used in the literature for embedding is Word2vec [46]. It transforms each word of the corpus into embedding vectors. For Instance, consider two sentences: Hi I am here, and Hi I am there. These sentences can be represented as a set of sequence of nodes as in Fig. 2 and construct a vocabulary called corpus V = {Hi, I, am, here, there}.
Now each word in vocabulary is represented as vector of dimension V as in the example Hi = [0,0,1,0,0]; I = [0,0,0,1,0] ; am = [1,0,0,0,0] ; here = [0,1,0,0,0] ; there = [0,0,0,0,1].
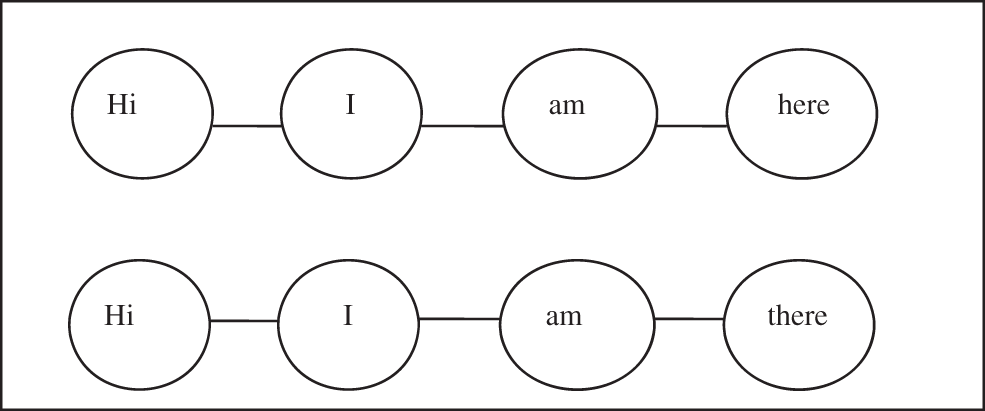
Figure 2: Sequence of words in sentence
The main concern of this representation is to visualize each word with one dimension. In our example, “here” and “there” are closer to each other as compared to “Hi” and “am”. So it is a great form to represent the nodes in low dimensional vectors that depict their relationship with other nodes in the network.
To generate these embedding word2vec uses a skip-gram [34] neural network. The input layer takes one encoded vector of dimension d equal to the words in the dictionary and the hidden layer present its embedding. The output layer predicts the neighborhood words. The output layer uses a softmax classifier to predict the neighborhood words as in Fig. 3. Thus, it transforms each corpus word into embedding vectors with the property that “similar words should occupy close spatial”. The paper utilizes this graph embedding property for identifying the node with maximum influence. The next section discusses its applicability.
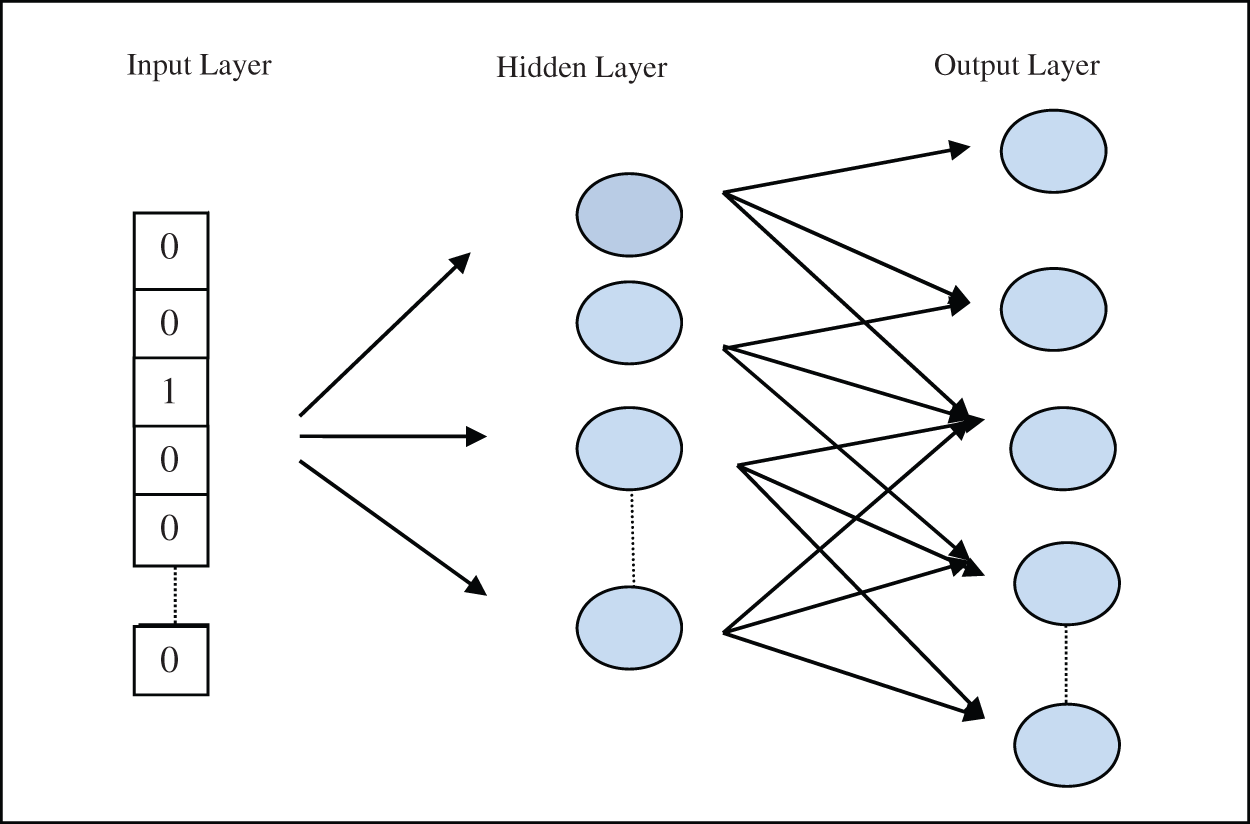
Figure 3: Neural network for skip gram
This section formally explains the applicability of graph embedding to social networkss for estimating nodes’ influence. A social network with nodes connected to other nodes can be represented by a graph G (V, E). V and E represent the nodes in the networks and social interactions among users, respectively.
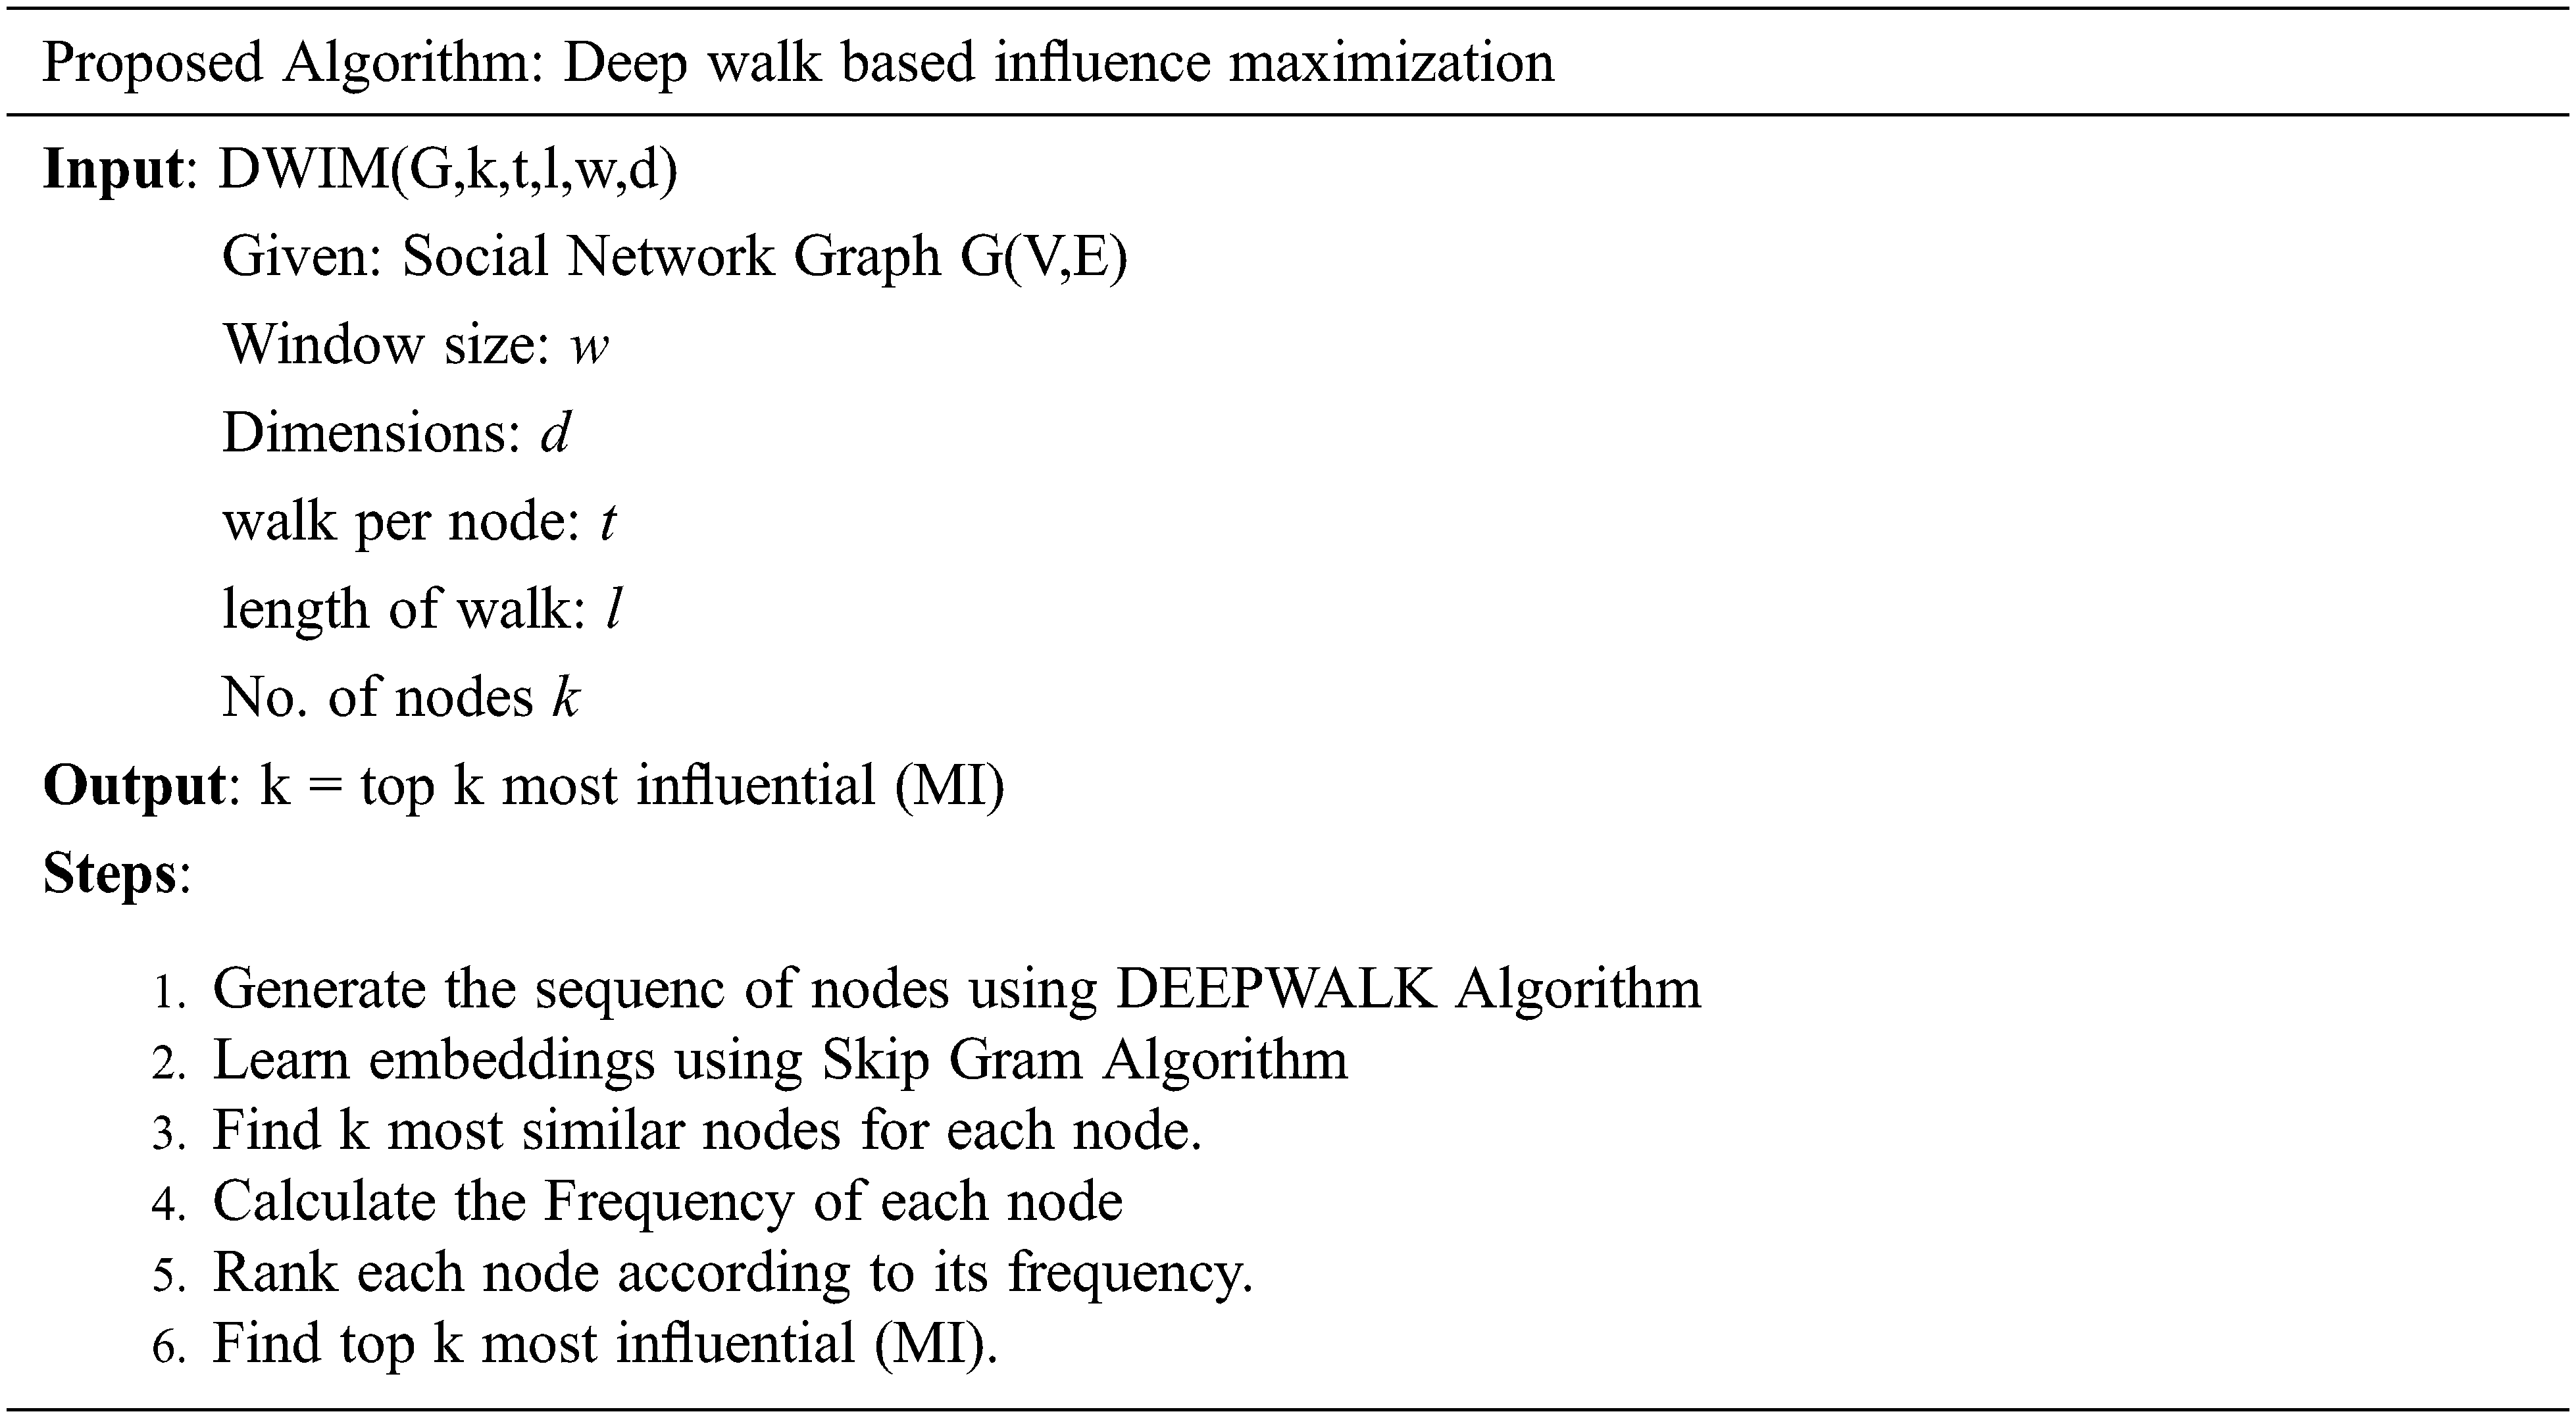
The presented Deepwalk based influence maximization (DWIM) algorithm has two important components, first a DeepWalk algorithm [28] and second skip-gram algotithm [46] to learn the embedding of each node in a social network. After learning the embeddings, the algorithm explores the k most similar nodes of each node and generates a pool of nodes of size
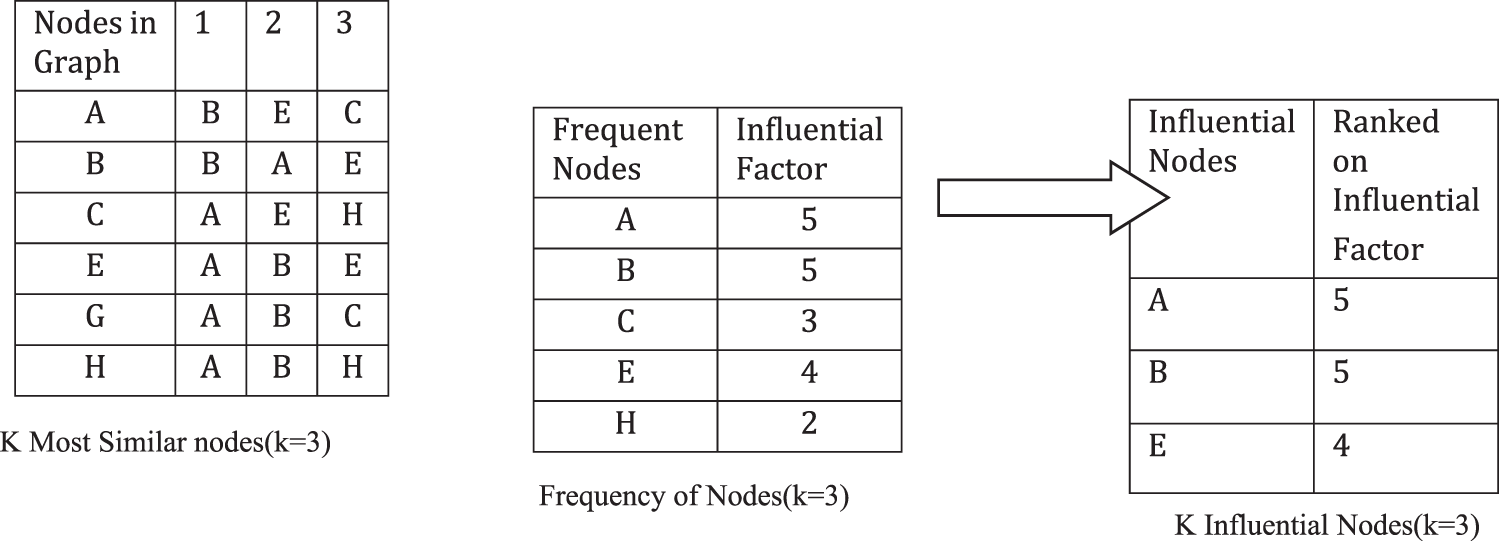
Figure 4: Computing influential factor of a social network
We used Deepwalk algorithm and skip gram algorithm as a part of our proposed algorithm DWIM which are used frequently for graph embedding as follows.
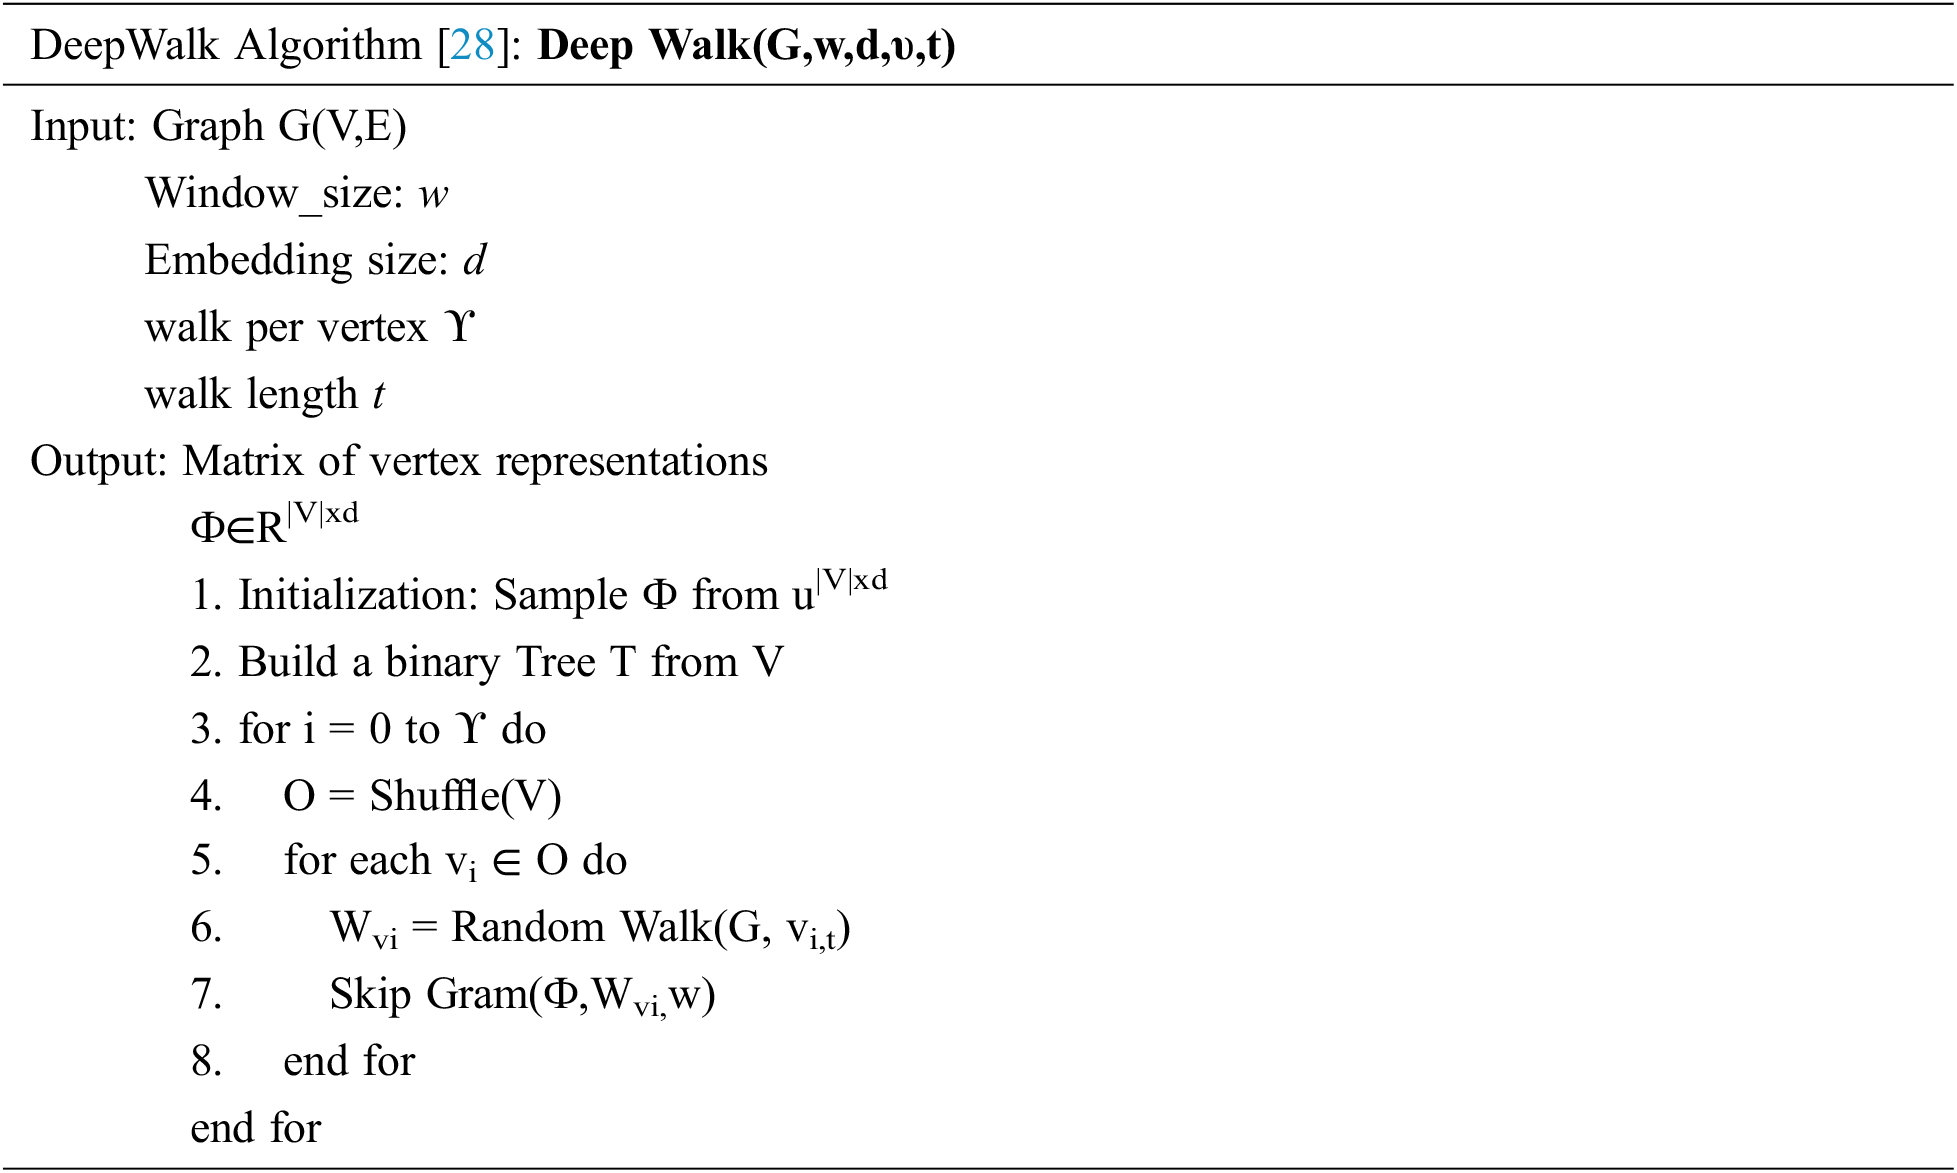
The deepwalk algorithm makes use of randomwalk, here as input the social network graph is given where through randomwalks different paths are traversed are those paths are given to the basic Skip Gram model as an input to learn. Here Skip Gram model is a simple deep learning model. Like the way it is used for the prediction of word and context words it uses the random walks generated on graph as the bag of words.
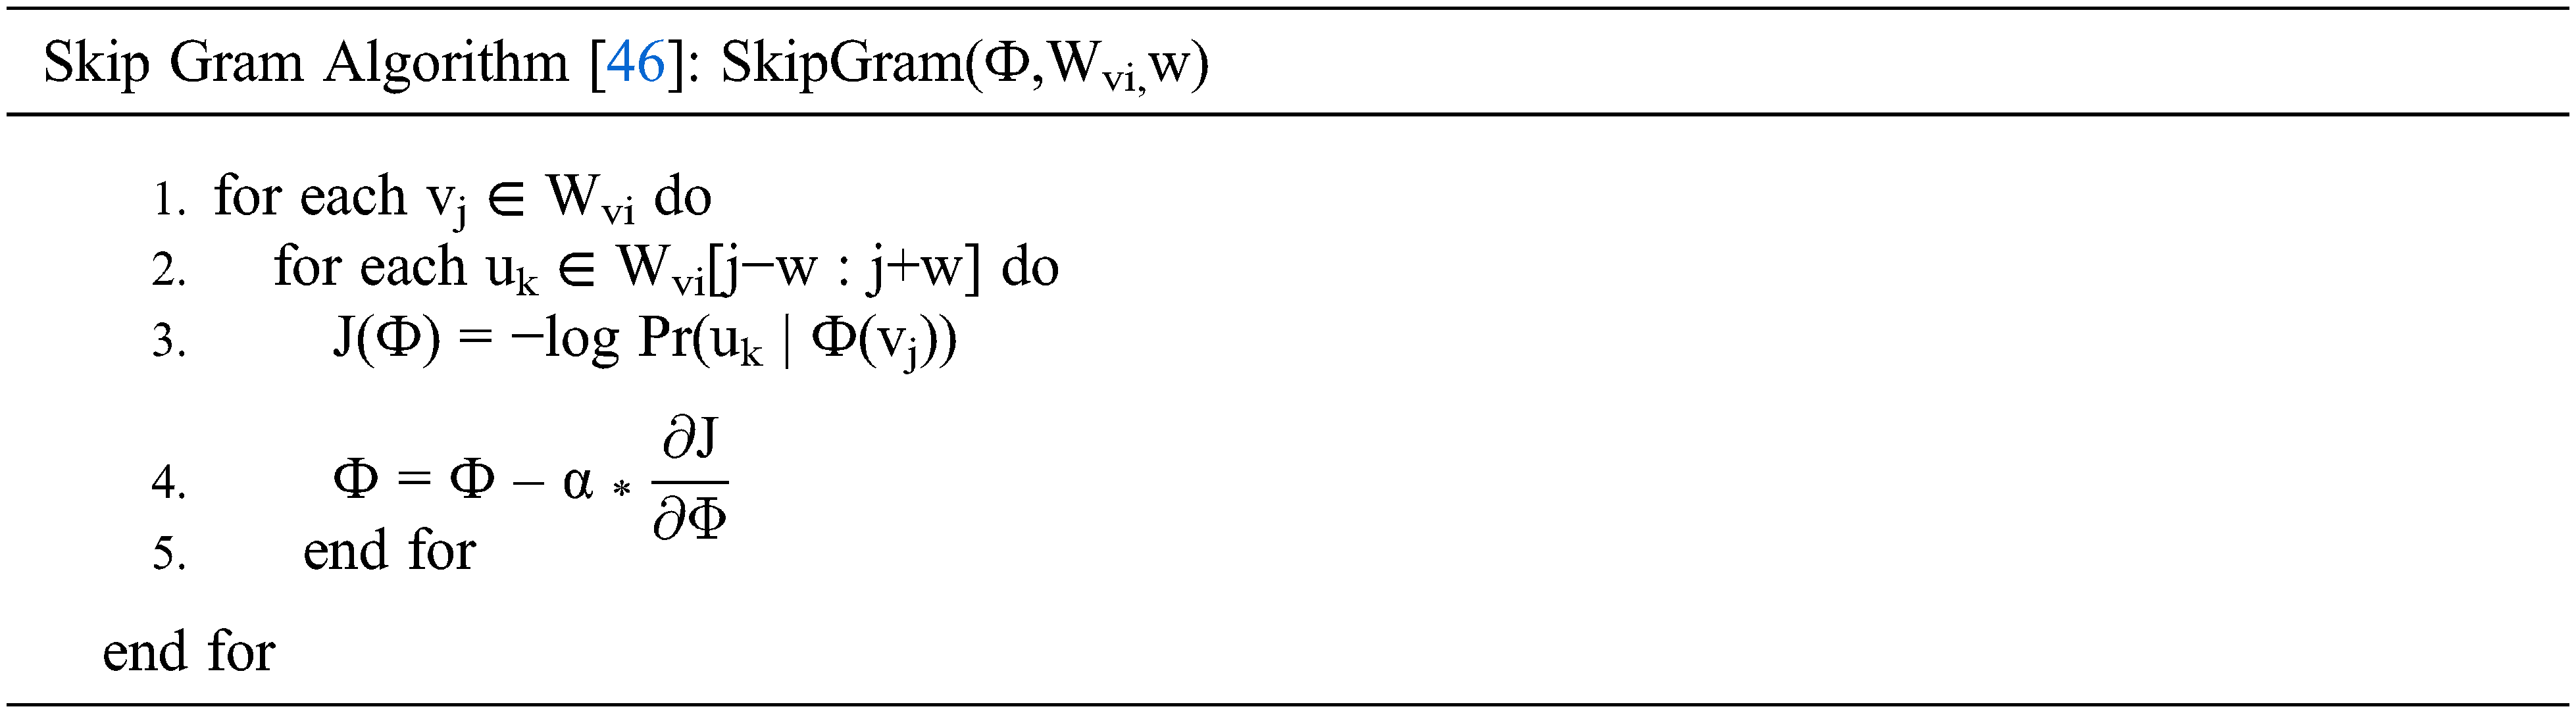
So in our proposed algorithm, we are using deepwalk and skip gram models to find out the most influential k nodes. It is done by predicting most similar nodes of any node. The most similar node to other nodes is the influential node in the social network. To include the similarity between two users, cosine similarity is used under collaborative filtering, which gives user to user similarity and is used as probability to activate other users if two user nodes are most similar. When two users are most similar then the chances to get activated is more. After that, through random walks on the graph, different paths got acquired, and then using Skip Gram we can predict the most similar nodes in the social network.
In the subsequent section, we will discuss how the proposed algorithm is applied on real-world big data of social networks. Different experiments are done and the k influential nodes are compared with the influential nodes generated based on different centrality measures. The centrality measures considered are degree centrality, closeness centrality, page rank, and eigenvector centrality.
The experiments are performed to explore the applicability of the proposed approach. The most influential nodes (MI) identified by the proposed model have been evaluated for the following classical centrality measures.
1. Degree Centrality
2. Closeness Centrality
3. Page Rank
4. Eigenvector Centrality
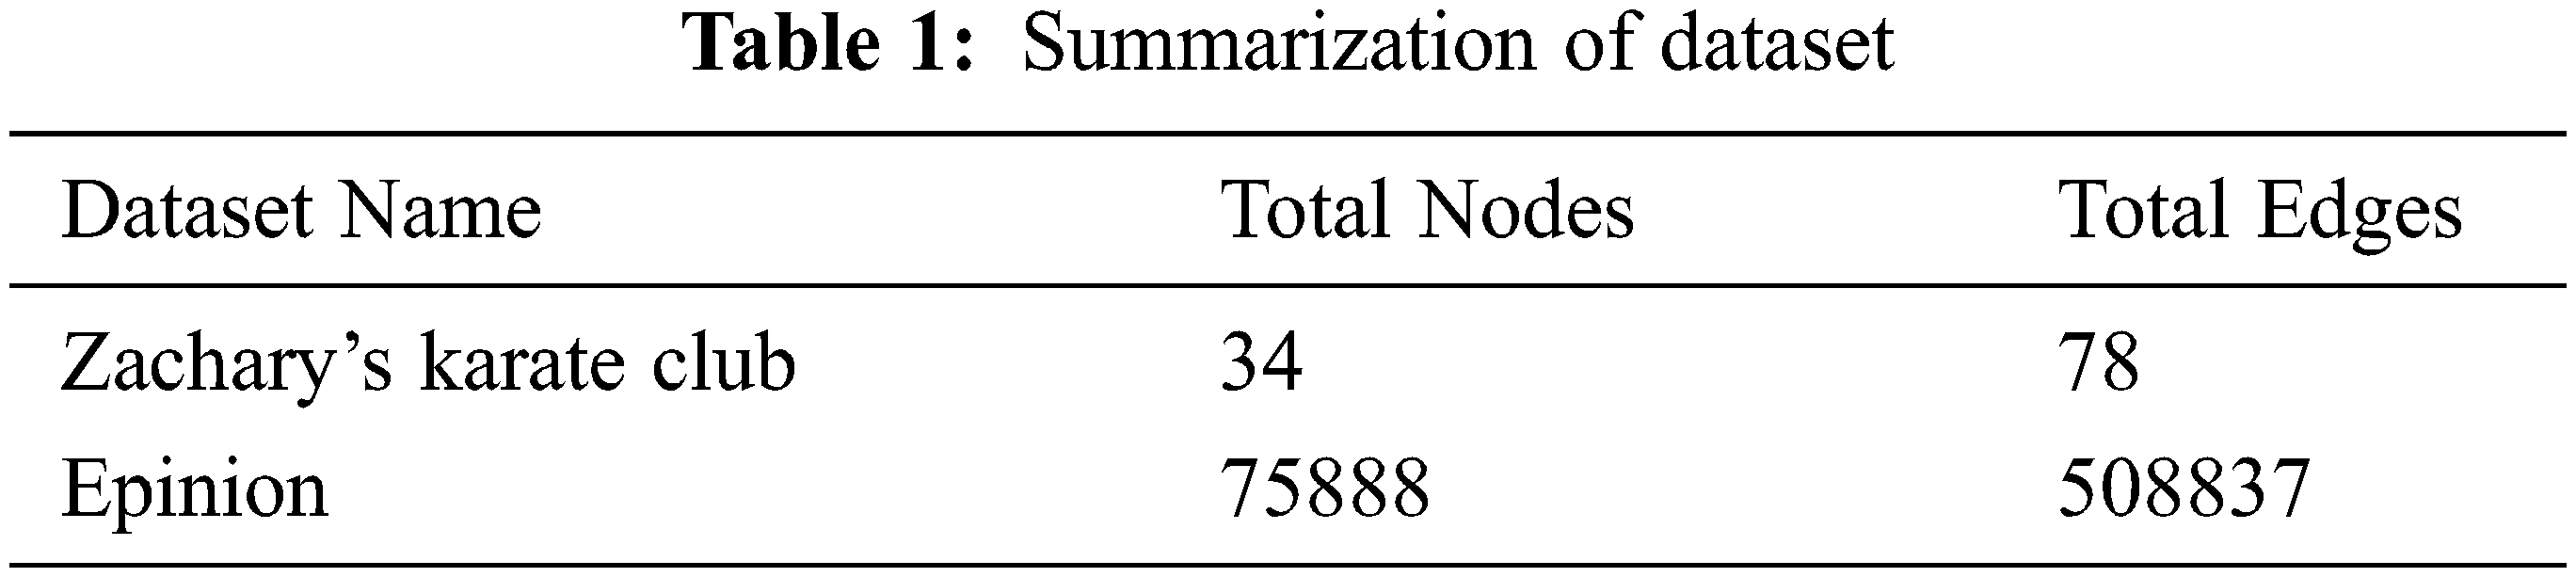
The experiments are conducted on the following two real data sets with varying sizes and densities including:
i) Zachary’s karate club [47]: It is a friendship network of 34 university-based karate club members.
ii) Epinions: It is who-trust-whom of https://Epinions.com. Each vertex is a member of the site, and the link between them represents who trusts whom [48].
These datasets are collected from Stanford Large Network Dataset collections. The features of the datasets are shown in Tab. 1. Experiments are conducted with k = 10 for karate club data set and k = 20 for epinion data set. However the other parameters are same for all experiments such as w = 4, d = 64, t = 10, l = 100.
The performance of the proposed model on given data sets has been evaluated. Tab. 2 shows the results of karate data set. The presented algorithm is applied to extract 10 most influential (MI) nodes. It is observed from that proposed method is able to identify the set of vital nodes with maximum influence measured with respect to Degree Centrality(DC), Closeness Centrality(CC), PageRank(PR) centrality, Eigen Vector Centrality(EC). Fig. 5 depicts all centrality measures of each node ranked by the approach.
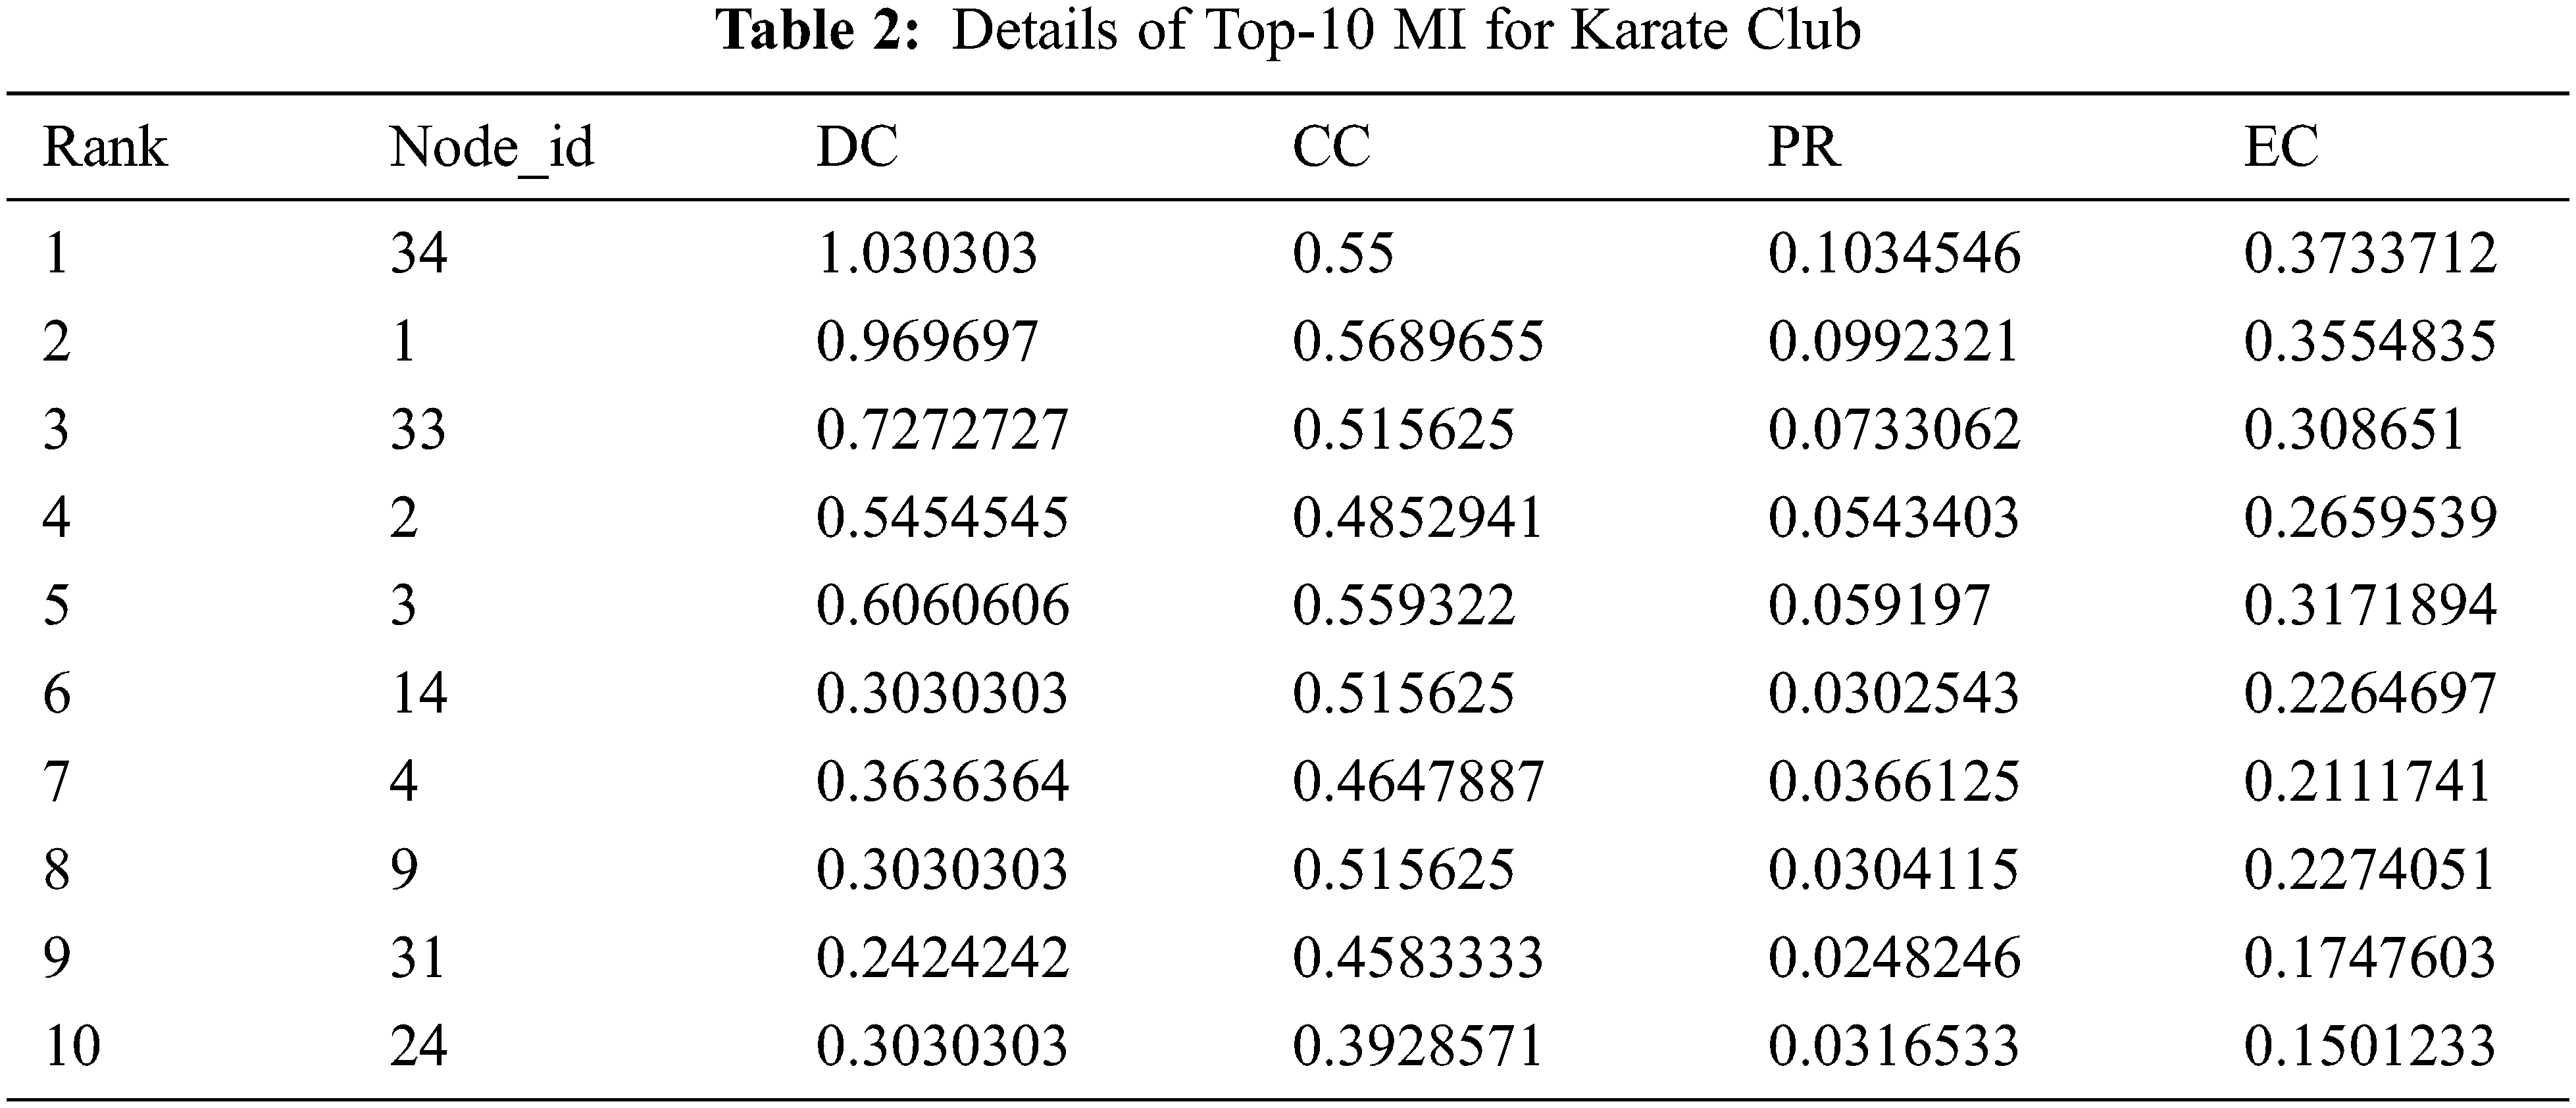
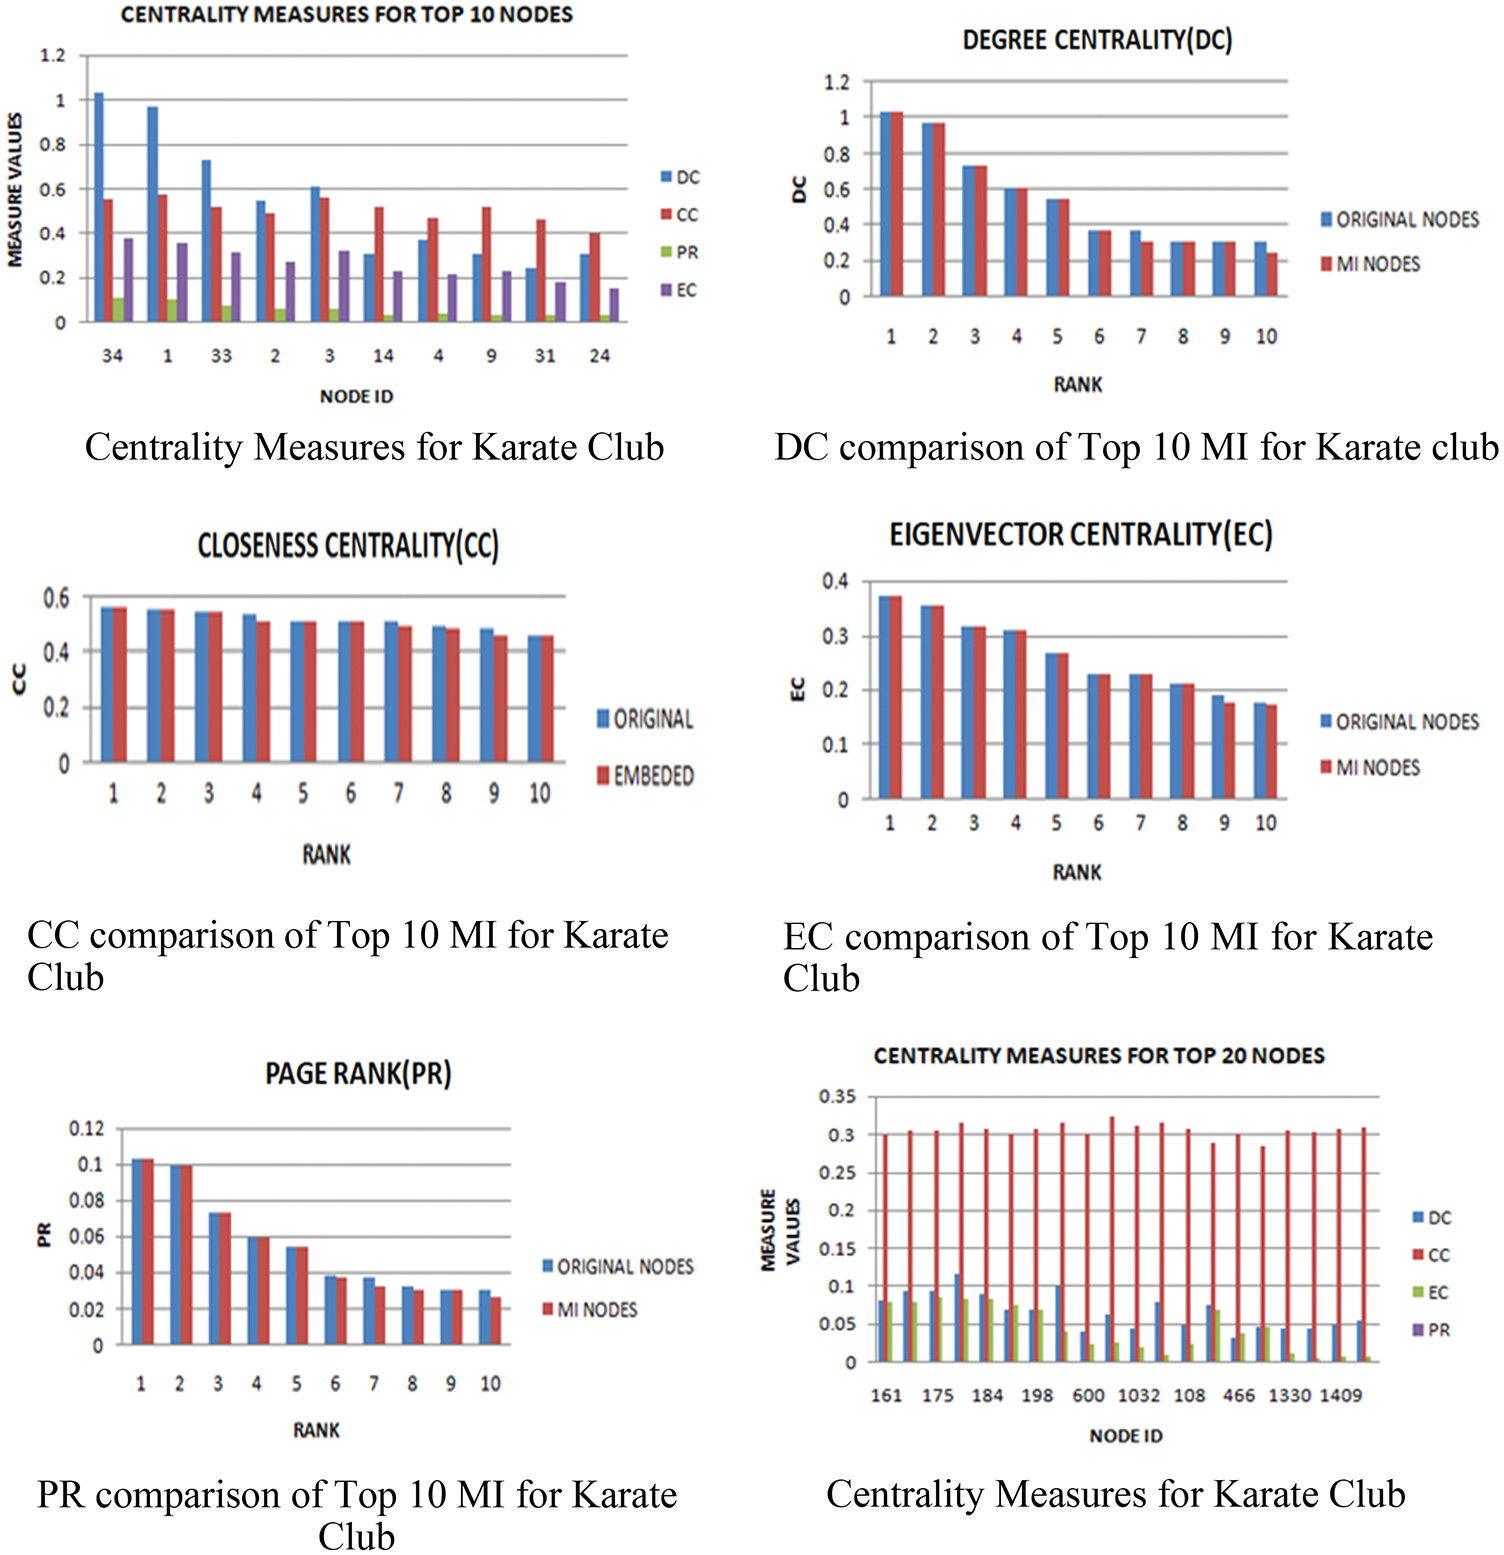
Figure 5: Different centrality measures for karate club
These results are compared with top 20 nodes exist in original network w.r.t. given measures as shown in Fig. 5. It has been observed that the proposed approach has efficiently extracted the nodes with near to best values of centrality measures as present in the graph.
The results of Epinion network is given in Tab. 3. The presented algorithm is applied to extract 20 most frequent nodes. It is observed from Tab. 3 that proposed method is able to identify the set of vital nodes where influence is measured with respect to DC, CC, PR, EC. Fig. 6 depicts the centrality measures of each node ranked by the approach. These results are compared with top 20 nodes exist in original network w.r.t. to given measures. It has been observed that the proposed approach has efficiently extracted the nodes with proportionate to the existing values.
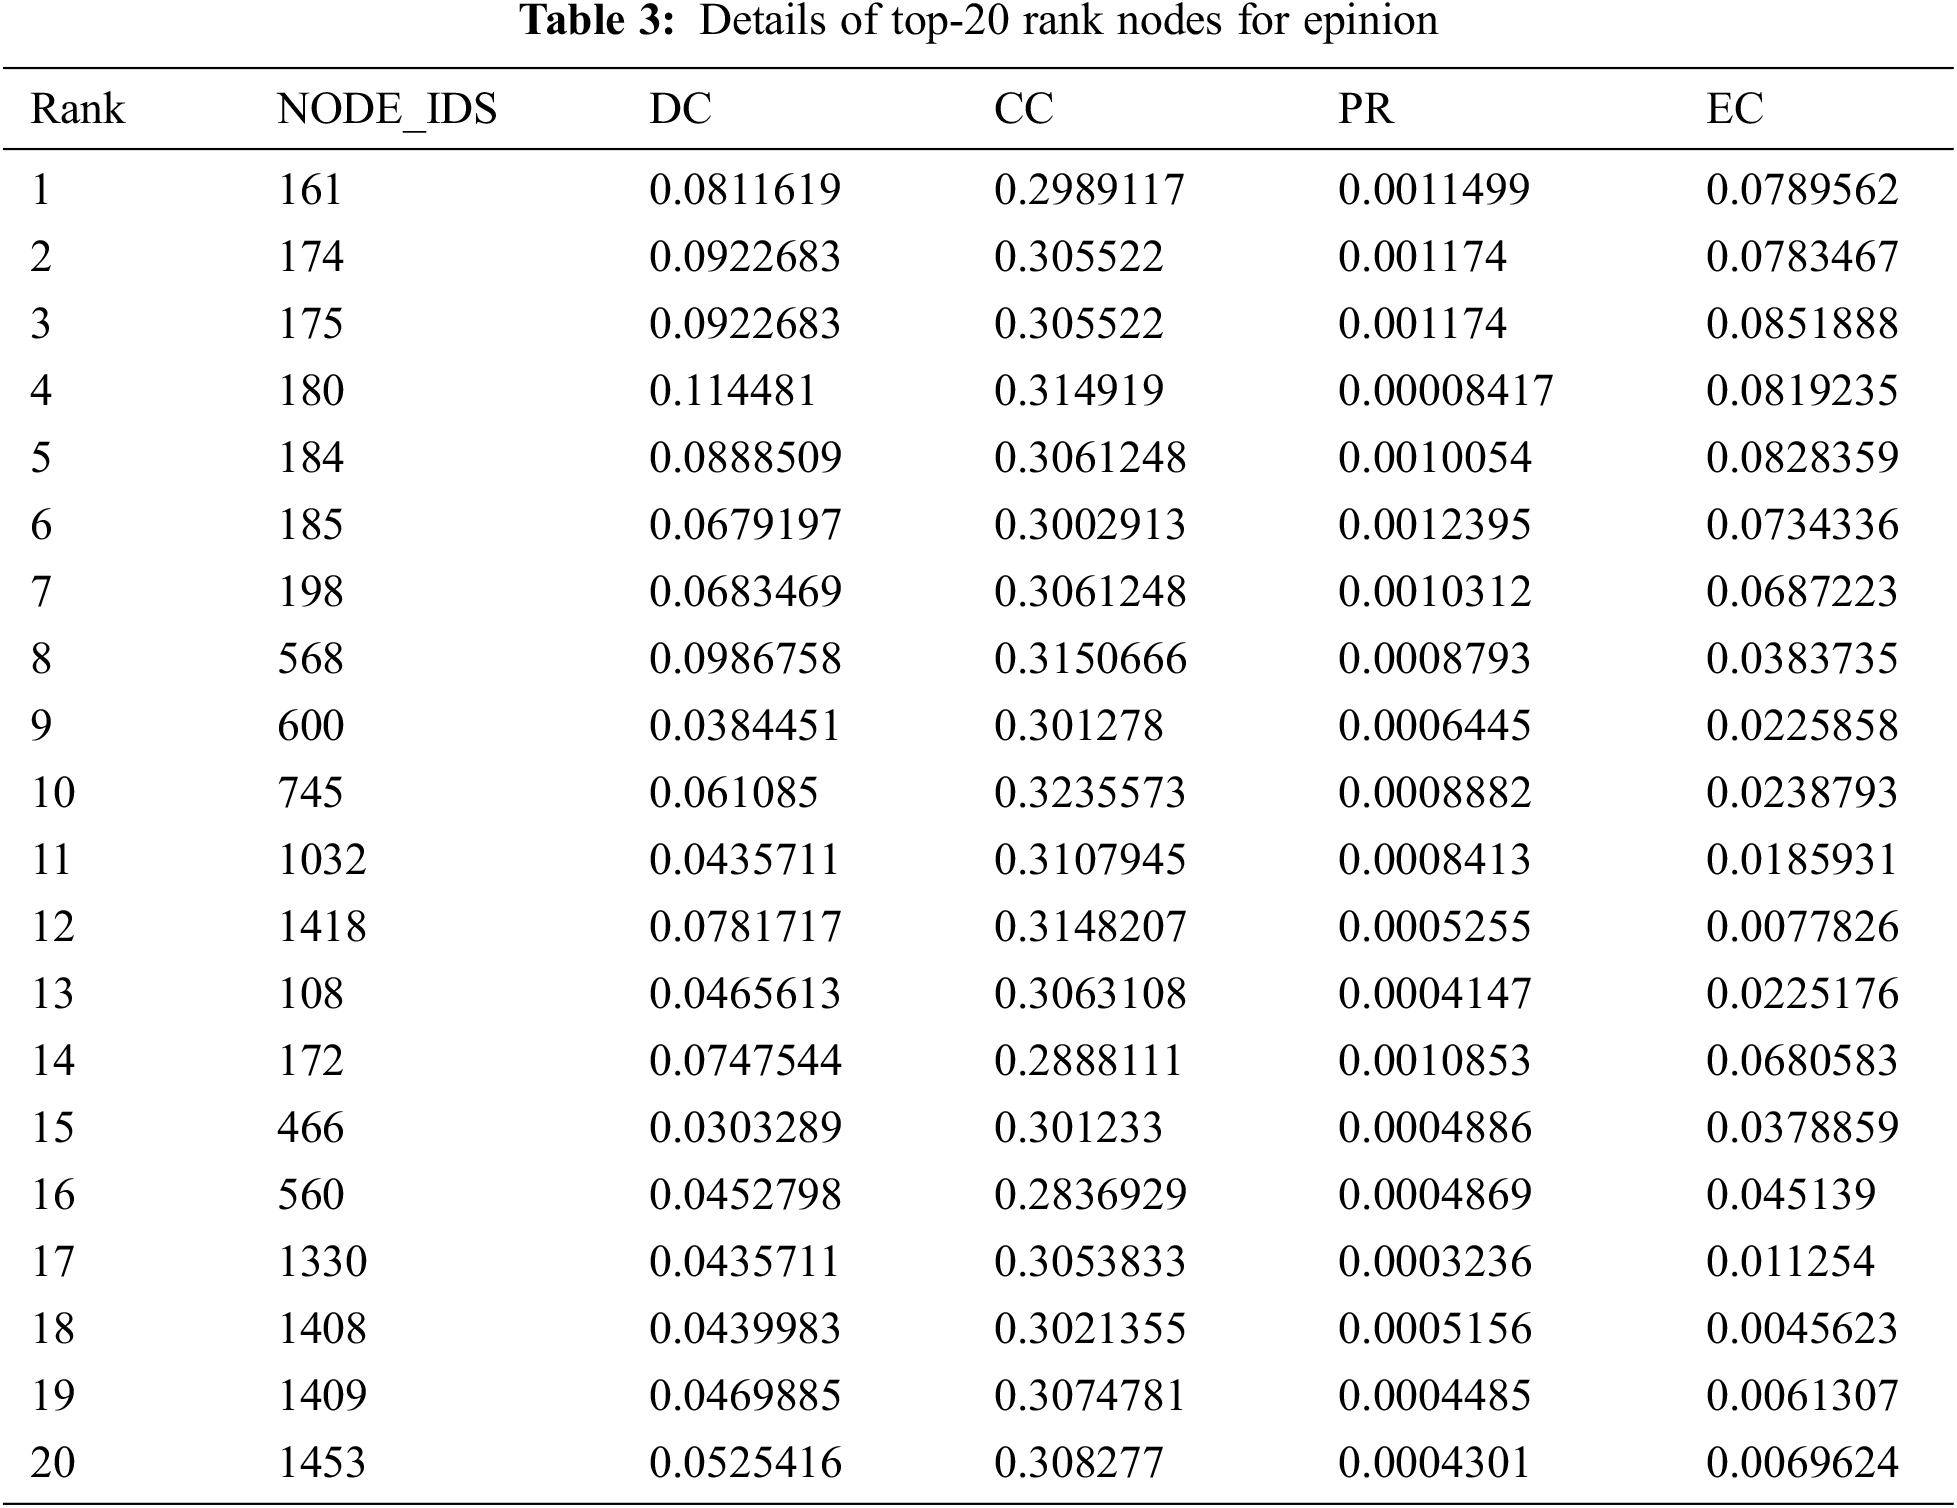
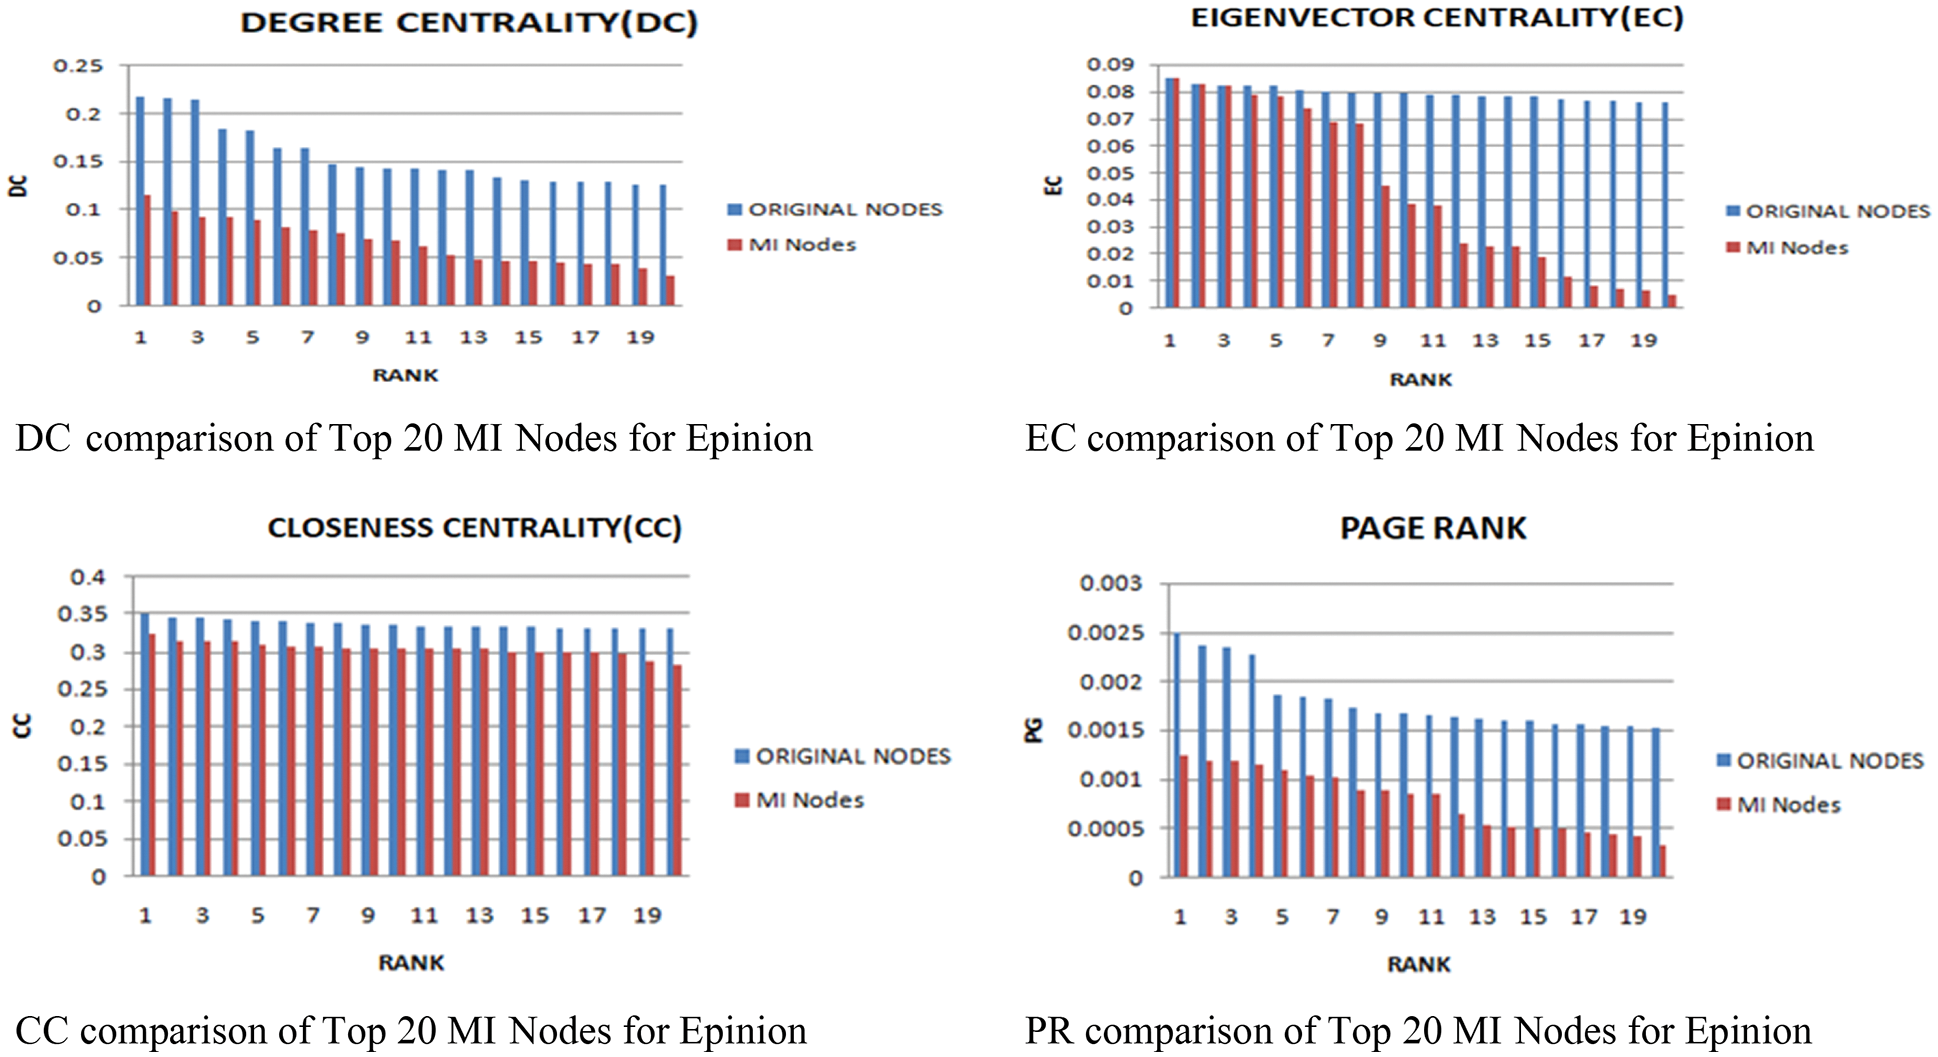
Figure 6: Comparison of centrality for top 20 MI nodes for epinion
The paper presented a Deepwalk based influence maximization (DWIM) algorithm. The paper observes the k frequent nodes identified after embeddings. The experiments are performed on Karate club and Epinions datasets. The performance of the proposed method is top k nodes measured with respect to classical centrality measures of. The results are compared with top k most influential nodes exist in the network with respect to each measure i.e., DC, CC, EC and PR. The results reveal that the presented approach performs efficiently and can extract k influential nodes in computable time. The proposed methodology can be applied on other dataset also related to agriculture, healthcare, politics to find out the influencer who can or who are influencing the social network. The proposed work can also be used for outlier detection.
Acknowledgement: We thank those who have contributed to the article, especially our family and friends for their patience and support.
Funding Statement: The authors received no specific funding for this study.
Conflicts of Interest: The authors declare that they have no conflicts of interest to report regarding the present study.
1. H. Banati and M. Bajaj, “Evolutionary approach for k-Max influence problem,” International Journal of Network and Innovative Computing, vol. 1, no. 1, pp. 163–172, 2013. [Google Scholar]
2. S. Chhabra, R. Mahajanand and S. K. Khatri, “Data mining on social networks for target advertisement in automobile sector,” in 2017 Int. Conf. on. Infocom Technologies and Unmanned Systems: Trends and Future. Directions. ICTUS 2017, Noida, India, vol. 2018-Janua, pp. 166–170, 2018. [Google Scholar]
3. F. M. Bass, “A new product growth for model consumer durables,” Management Science, vol. 50, no. 12 SUPPL., pp. 1825–1832, 2004. [Google Scholar]
4. Z. Katona, P. P. Zubcsekand and M. Sarvary, “Network effects and personal influences: The diffusion of an online social network,” Journal of Marketing Research, vol. 48, no. 3, pp. 425–443, 2011. [Google Scholar]
5. S. Y. Bhat and M. Abulaish, “Overlapping social network communities and viral marketing,” in Proc. 2013 Int. Symp. on Computational Business Intelligence, New Delhi, India, pp. 243–246, 2013. [Google Scholar]
6. M. Granovetter, “Threshold models of collective behavior1 background and description of the models,” 1978 by The University of Chicago, vol. 83, pp. 1420–1443, 1978. [Google Scholar]
7. L. S. Zaremba and W. H. Smoleński, “Optimal portfolio choice under a liability constraint,” Annals Operations Research, vol. 97, no. 1–4, pp. 131–141, 2000. [Google Scholar]
8. D. Kempe and J. Kleinberg, “Maximizing the spread of influence through a social network,” in Proc. of the Ninth ACM SIGKDD Int. Conf. on Knowledge Discovery and Data Mining-KDD ‘03, Washington, DC, USA, pp. 137–146, 2003. [Google Scholar]
9. M. Trusov, A. V. Bodapati and R. E. Bucklin, “Determining influential users in internet social networks,” Journal of Marketing Research, vol. 47, no. 4, pp. 643–658, 2010. [Google Scholar]
10. C. Van den Bulte and S. H. K. Wuyts, “Social networks in marketing,” in MSI Relevant Knowledge Series. Cambridge MA: Marketing Science Institute, 2007. [Google Scholar]
11. P. Domingos and M. Richardson, “Mining the network value of customers,” in Proceedings of seventh ACM SIGKDD international conference on knowledge discovery and data mining, pp. 57–66, 2001. [Google Scholar]
12. D. Kempe, J. Kleinberg and É. Tardos, “Maximizing the spread of influence through a social network,” Theory of Computing, vol. 11, pp. 105–147, 2015. [Google Scholar]
13. J. Sun and J. Tang, “Models and algorithms for social influence analysis,” in WSDM, 2013-Proc. 6th ACM Int. Conf. on. Web Search Data Mining, Rome, Italy, pp. 775–776, 2013. [Google Scholar]
14. A. Goyal, F. Bonchi and L. V. S. Lakshmanan, “Discovering leaders from community actions,” in Int. Conf. on Information and Knowledge Management. Proc., Napa Valley California USA, pp. 499–508, 2008. [Google Scholar]
15. N. Agarwal, H. Liu, L. Tang and P. S. Yu, “Identifying the influential bloggers in a community,” in WSDM’08-Proc. 2008 Int. Conf. on Web Search Data Mining, Palo Alto California USA, pp. 207–217, 2008. [Google Scholar]
16. H. W. Lam and C. Wu, “Finding influential ebay buyers for viral marketing–A conceptual model of buyerrank,” in Proc. Int. Conf. on Advanced. Information. Networking. Applications,. AINA, Bradford, United Kingdom, pp. 778–785, 2009. [Google Scholar]
17. Y. He, “Identifying influential users in social network with review data,” in Data Analysis Project, Machine Learning Department School of Computer Science Carnegie Mellon University, Pittsburgh, PA, Carnegie Mellon University, pp. 1–15, 2021. [Google Scholar]
18. T. Carnes, C. Nagarajan, S. M. Wild and A. Van Zuylen, “Maximizing influence in a competitive social network: A follower’s perspective,” in ACM Int. Conf. Proc. Series, New York, United States, vol. 258, pp. 351–360, 2007. [Google Scholar]
19. C. Te Li, S. De Lin and M. K. Shan, “Finding influential mediators in social networks,” in Proc. 20th Int. Conf. Companion World Wide Web, WWW 2011, Hyderabad, India, pp. 75–76, 2011. [Google Scholar]
20. W. Luo and W. P. Tay, “Identifying multiple infection sources in a network,” in Conf. Record.-Asilomar Conf. Signals, System. Computers, Pacific Grove, CA, USA, pp. 1483–1489, 2012. [Google Scholar]
21. S. Bhagat, A. Goyal and L. V. S. Lakshmanan, “Maximizing product adoption in social networks,” in WSDM 2012-Proc. 5th ACM Int. Conf. Web Search Data Mining, New York, USA, pp. 603–612, 2012. [Google Scholar]
22. A. F. Hirvijärvi, “Viral marketing and content forwarding on social media outlining the key elements behind successful viral content creation,” Ph.D. dissertation, International Business Arcada–University of Applied Sciences, Finland, 2017. [Google Scholar]
23. S. Banerjee, M. Jenamani and D. K. Pratihar, “A survey on influence maximization in a social network, 2018, https://arxiv.org/abs/1808.05502. [Google Scholar]
24. J. Tang, X. Tang and J. Yuan, “Profit maximization for viral marketing in online social networks: Algorithms and analysis,” IEEE Transactions on Knowledge and Data Engineering, vol. 30, no. 6, pp. 1095–1108, 2018. [Google Scholar]
25. L. Katz, “A new status I N D E X D E R I V E D from sociometric,” Psychmetrika, vol. 18, pp. 39–43, 1953. [Google Scholar]
26. A. N. Langville and C. D. Meyer, “Google’s pagerank and beyond: The science of search engine rankings,” Google’s PageRank and Beyond: The Science of Search Engine Rankings, pp. 1–224, 2011. [Google Scholar]
27. K. Stephenson and M. Zelen, “Rethinking centrality: Methods and examples,” Social Networks, vol. 11, no. 1, pp. 1–37, 1989. [Google Scholar]
28. E. Estrada and J. A. Rodríguez-Velázquez, “Spectral measures of bipartivity in complex networks,” Physical Review E-Statistical. Nonlinear, Soft Matter Physics, vol. 72, no. 4, pp. 1–6, 2005. [Google Scholar]
29. N. Ma and Y. Liu, “SuperedgeRank algorithm and its application in identifying opinion leader of online public opinion supernetwork,” Expert System with Applications, vol. 41, no. 4 PART 1, pp. 1357–1368, 2014. [Google Scholar]
30. F. Bodendorf and C. Kaiser, “Detecting opinion leaders and trends in online communities,” in 4th Int. Conf. Digital. Society ICDS 2010, Includes CYBERLAWS 2010 1st Int. Conf. Technical. Legal Aspects of the E-Society, Netherlands Antilles, pp. 124–129, 2010. [Google Scholar]
31. R. Van Der Merwe and G. Van Heerden, “Finding and utilizing opinion leaders: Social networks and the power of relationships,” South African Journal of Business Management, vol. 40, no. 3, pp. 65–76, 2009. [Google Scholar]
32. F. Bonchi, C. Castillo, A. Gionis and A. Jaimes, “Social network analysis and mining for business applications,” ACM Transaction on Intelligent System Technologies, vol. 2, no. 3, pp. 1–37, 2011. [Google Scholar]
33. C. Wang, W. Chen and Y. Wang, “Scalable influence maximization for independent cascade model in large-scale social networks,” Data Mining and Knowledge Discovery, vol. 25, no. 3, pp. 545–576, 2012. [Google Scholar]
34. S. A. Naik and Q. Yu, “Maximizing influence of viral marketing via evolutionary user selection,” in Proc. 2013 IEEE/ACM Int. Conf. on Advanced Social Networks Analysis and Mining, ASONAM 2013, Niagra Falls, Ontario, pp. 1435–1436, 2013. [Google Scholar]
35. J. Leskovec, L. A. Adamic and B. A. Huberman, “The dynamics of viral marketing,” ACM Transactionon the Web, vol. 1, no. 1, pp. 5, 2007. [Google Scholar]
36. H. Kim, K. Beznosov and E. Yoneki, “Finding influential neighbors to maximize information diffusion in twitter,” in WWW 2014 Companion-Proc. 23rd Int. Conf. World Wide Web, Seoul, Republic of Korea, pp. 701–706, 2014. [Google Scholar]
37. P. Agrawal, V. Madaan, A. Roy, R. Kumari and H. Deore, “FOCOMO: Forecasting and monitoring the worldwide spread of COVID-19 using machine learning methods,” Journal of Interdisciplinary. Mathematics, vol. 24, no. 2, pp. 443–466, 2021. [Google Scholar]
38. V. Madaan, “XCOVNet: Chest X-ray image classification for COVID-19 early detection using convolutional neural networks,” New Generration Computing, vol. 39, no. 3–4, pp. 583–597, 2021. [Google Scholar]
39. P. Agrawal, D. Chaudhary and V. Madaan, “Automated bank cheque verification using image,” Multimedia Tools and Applications, vol. 80, no. 4, pp. 5319–5350, 2020. [Google Scholar]
40. B. Perozzi and S. Skiena, “Deeplearing,” in Proc. of the SIGKDD’14 (New York city, New york, USA: ACM; ), New York City, USA, pp. 701–710, 2014. [Google Scholar]
41. H. Chen, B. Perozzi, R. Al-Rfou and S. Skiena, “A tutorial on network embeddings,” 2018. [Online]. Available: https://arxiv.org/abs/1808.02590. [Google Scholar]
42. X. Yu, “Personalized entity recommendation: A heterogeneous information network approach,” in WSDM 2014-Proc. 7th ACM Int. Conf. Web Search and Data Mining, New York, USA, pp. 283–292, 2014. [Google Scholar]
43. H. Zhao, Q. Yao, J. Li, Y. Song and D. L. Lee, “Meta-graph based recommendation fusion over heterogeneous information networks,” in Proc. ACM SIGKDD Int. Conf. on Knowledge Discovery and. Data Mining, Halifax, Nova Scotia, Canada, vol. Part F1296, pp. 635–644, 2017. [Google Scholar]
44. F. Zhang, N. J. Yuan, D. Lian, X. Xie and W. Y. Ma, “Collaborative knowledge base embedding for recommender systems,” in Proc. ACM SIGKDD Int. Conf. Knowledge Discovery and Data Mining, New York, United States, vol. 13-17-Augu, pp. 353–362, 2016. [Google Scholar]
45. C. Zhou, Y. Liu, X. Liu, Z. Liu and J. Gao, “Scalable graph embedding for asymmetric proximity,” in 31st AAAI Conf. on Artificial Intelligence. AAAI 2017, San Francisco, California, USA, vol. 1, pp. 2942–2948, 2017. [Google Scholar]
46. T. Mikolov, K. Chen, G. Corrado and J. Dean, “Efficient estimation of word representations in vector space,” in 1st Int. Conf. Learn. Represent. ICLR 2013-Work. Track Proc., Scottsdale Arizona, pp. 1–12, 2013. [Google Scholar]
47. W. W. Zachary, “An information flow model for conflict and fission in small groups,” Journalof Anthropology Research, vol. 33, no. 4, pp. 452–473, 1977. [Google Scholar]
48. S. Meyffret, “RED : A rich epinions dataset for recommender systems to cite this version : RED : A rich epinions dataset for recommender systems,” Research Report, LIRIS. 2012. ffhal-01010246, 2012. [Google Scholar]
 | This work is licensed under a Creative Commons Attribution 4.0 International License, which permits unrestricted use, distribution, and reproduction in any medium, provided the original work is properly cited. |