DOI:10.32604/iasc.2023.026496
| Intelligent Automation & Soft Computing DOI:10.32604/iasc.2023.026496 | |
| Article |
Effective Energy Management Scheme by IMPC
Department of Electrical and Instrumentation Engineering, Thapar Institute of Engineering & Technology, Patiala, India
*Corresponding Author: Smarajit Ghosh. Email: smarajitg@hotmail.com
Received: 28 December 2021; Accepted: 18 February 2022
Abstract: The primary purpose of the Energy Management Scheme (EMS) is to monitor the energy fluctuations present in the load profile. In this paper, the improved model predictive controller is adopted for the EMS in the power system. Emperor Penguin Optimization (EPO) algorithm optimized Artificial Neural Network (ANN) with Model Predictive Control (MPC) scheme for accurate prediction of load and power forecasting at the time of pre-optimizing EMS is presented. For the power generation, Renewable Energy Sources (RES) such as photo voltaic (PV) and wind turbine (WT) are utilized along with that the fuel cell is also presented in case of failure by the RES. Such a setup is connected with the grid and applies to the household appliances. In improved model predictive control (IMPC), the set of constraints for the power flow in the system is optimized by the ANN, which is trained by EPO. Such a tuning based prediction model is presented in the IMPC technique. The proposed work is implemented in the MATLAB/Simulink platform. The energy management capability of the proposed system is analyzed for different atmospheric conditions. The total system cost, life cycle cost and annualized cost for IMPC are 48%, 45% and 15%, respectively. From the performance analysis, the cost obtained by the proposed method is very low compared to that obtained by the existing techniques.
Keywords: Artificial neural network; emperor penguin optimization; energy management; model predictive control
Nowadays, the RES, such as hydro, wind and PV, have more attention among the peoples because of the reasons like environmental pollution and the rapid depletion of fossil fuel [1]. String research efforts are promoting to seek optimal exploitation of the RES like limited fossil fuels, growing energy demand, and need to reduce carbon dioxide emission in the atmosphere, which offers a distributed potential [2]. In recent decades solar energy is widely used. The reason for choosing PV is that it has no emission cost. Providentially, the utilization of energy from wind and PV has more potential in India because of its suitable climate and location. In this area, most of the electricity is used to meet the specific demand with the help of Diesel Generators (DG). However, the cost for maintaining the DG and the cost of fossil is exceptionally high. Thus, an alternative energy source like wind and PV hybrid combinations provides appropriate options for the power production [3,4].
Hybridization of wind and solar energy implementation in a particular field needs to be energy consumption-less without interruption [5]. Any kind of RESs can be combined to supply for many applications like domestic, industrial. Among various RES, solar and wind systems are widely affected by climatic changes [6]. The integration of more than RESs, such as hybrid form has more significant influence due to these environmental changes [7]. For example, high solar radiation and less wind velocity sunny days and less solar radiation and high-speed wind velocity in winter. Thus, the efficiency of RESs may change throughout the year because of various climatic conditions. Different kinds of RESs can be used in a hybrid energy system. Therefore, it is reliable and more cost-effective than the other single energy system [8].
In recent years, the hybridization of different RESs has been widely considered. Frequency variation and power quality issues may happen in Hybrid RES based standalone grid systems [9]. Harmonics commonly occur at the source side of the system while the presence of connection [10]. Model Predictive Control (MPC) is one of the promising technologies, which processes the control unit by reducing the objective function. The advantages of MPC is the enhanced energy savings, improve steady-state response, enhanced transient response and cost-effective [11]. However, it has some disadvantages and these are installation and maintenance expenses, controller structure limitation, process limitation and operator interface.
The essential contribution is given as follow,
• To fulfil the load, the RES power generators like PV and WT is used along with that the fuel cell is also used during the time of failure in PV and WT (due to climatic change) since the power generation is performed for 1-year time interval.
• The IMPC scheme is developed for regulating the system of power flow, which takes the initial energy flow as a reference and then control the power that is needed for the load every time.
• The set of constraints and objective functions are predicted by the ANN, where the error in the prediction is reduced by the training phase.
• The Emperor penguin optimization (EPO) algorithm is used to train the Artificial Neural Network (ANN) with a Model Predictive Control (MPC) scheme for accurate prediction of load and power forecasting.
• The performance of the proposed method is analyzed in contrast with the ant colony and artificial neural network (ACO-ANN), neural network with back propagation (NN-BP) and MPC technique of energy management.
The paper’s organization shows that the contribution of the hybrid renewable energy system (HRES) and its related works are presented in Section 2. The proposed methodology for describing HRES power flows is covered in Section 3. Then the suggested system simulated results are briefly examined in Section 4, and the conclusion of the proposed system has been made in the conclusion section.
Some recently developed Hybrid RES utilized EMS with some other traditional controllers is also presented as follows.
Comparative analysis of Hybrid RESs was presented by Muh et al. [12] for off-grid applications with the help of climate data of sum, in the North-West region of Cameroon that had been utilized to represent the resource data for Southern Cameroons. Based on the wind turbine, battery, diesel generator, charge controllers, PV module, inverters and micro-hydro turbine, nine hybrid arrangements were deliberated in that task.
A hybrid RESs optimal mapping of locations was discussed by Diemuodeke et al. [13] using the TOPSIS decision making multi-criteria algorithm. By deliberation of storing the power and diesel generator as backup, the hybrid energy systems were recommended for the optimal mapping in wind and PV.
Advanced technology of solar PV and environmental challenges of fossil fuels in fast-tracking hybrid RES was recommended by Ebhota et al. [14]. Then the Energy Materials (EMs) roles were improved on community-scale HRES to develop energy challenges. Furthermore, the combination of HRES into EM was developed.
The smart building optimal cost operation, integrated with a centralized HVAC system, solar power generation, and the storage devices as electrical and thermal had been presented by Bianchini et al. [15]. A demand response program was considered in building participation. The HVAC system was managed optimally by MPC strategy-based solution along with the storage devices in thermal comfort and constraints.
The public grid electrically coupled with a complex residential power system based on the potential economic MPC had been presented by Kuboth et al. [16]. That system consisted of a battery and thermal storage system, a PV production system, a heat pump of air-to-water and a model of the building. The power system was managed by the MPC algorithms through nonlinear global optimization.
Integrating the hybrid energy storage system (HESS) with DC microgrid was based on a Bidirectional Single Inductor Multiple Port (BSIMP) converter that had been presented by Wang et al. [17]. The HESS was formed as the combination of some kinds of energy storages (ESs). The BSIMP converter was utilized for regulating the HESS by the developed MPC based control method. Instantaneously, the bus voltage of the DC microgrid could be maintained under the non-linear load consumption and the generation of renewable energy.
The rapid increase in industrialization and globalization is leading to higher consumption of energy sources, including an increase in electricity requirements. Development of newer EMS definitely needs implantation of a suitable control method to maintain good working of the energy management scheme. Many existing works have dealt with the development of different control schemes for energy management purpose in domestic usage. However, most of them failed inaccurate prediction of load and weather forecasting at the time of pre-optimizing EMS. Similarly, they exhibit design complexity while developing the EMS with separate algorithms for every stage of operation. This has motivated me to create a new control strategy in EMS with the aid of NN concept to make the work easier and efficient than other existing works.
3 Optimal Methodology of HRES Based EMS
In electrical energy production, renewable energies are increasingly operated in hybrid energy storage systems such as PV panels and WT. The vital key for the design is the distribution of the power generation. The optimal controller strategy design for developing an EMS with RES and the utility grid system is discussed in this section. Here, the IMPC scheme is developed for regulating the power to the load profile. Already MPC is used in the field of oil refineries and chemical plant successfully; here, the hope is to manage energy among the load and generation concerning MPC. The IMPC method works by having a set of objective functions and the set of constraints. Those operating constraints and the objective functions are optimized by the artificial neural network (ANN), which requires training and testing for the weight and the bias value to reduce the error factor. Hence the system employs EPO to minimise the error occurs in the ANN that led accurate model prediction.
The resultant EMS by IMPC is utilized for household appliances as well as to the grid. The architecture of the proposed system with the controller design is given in Fig. 1, which consists of RESs and its control system. The power generated from RES is forecasted, then they are up-converted with the help of boost converters. The proposed IMPC scheme controls the EMS based on adequate power output for grid and household applications.
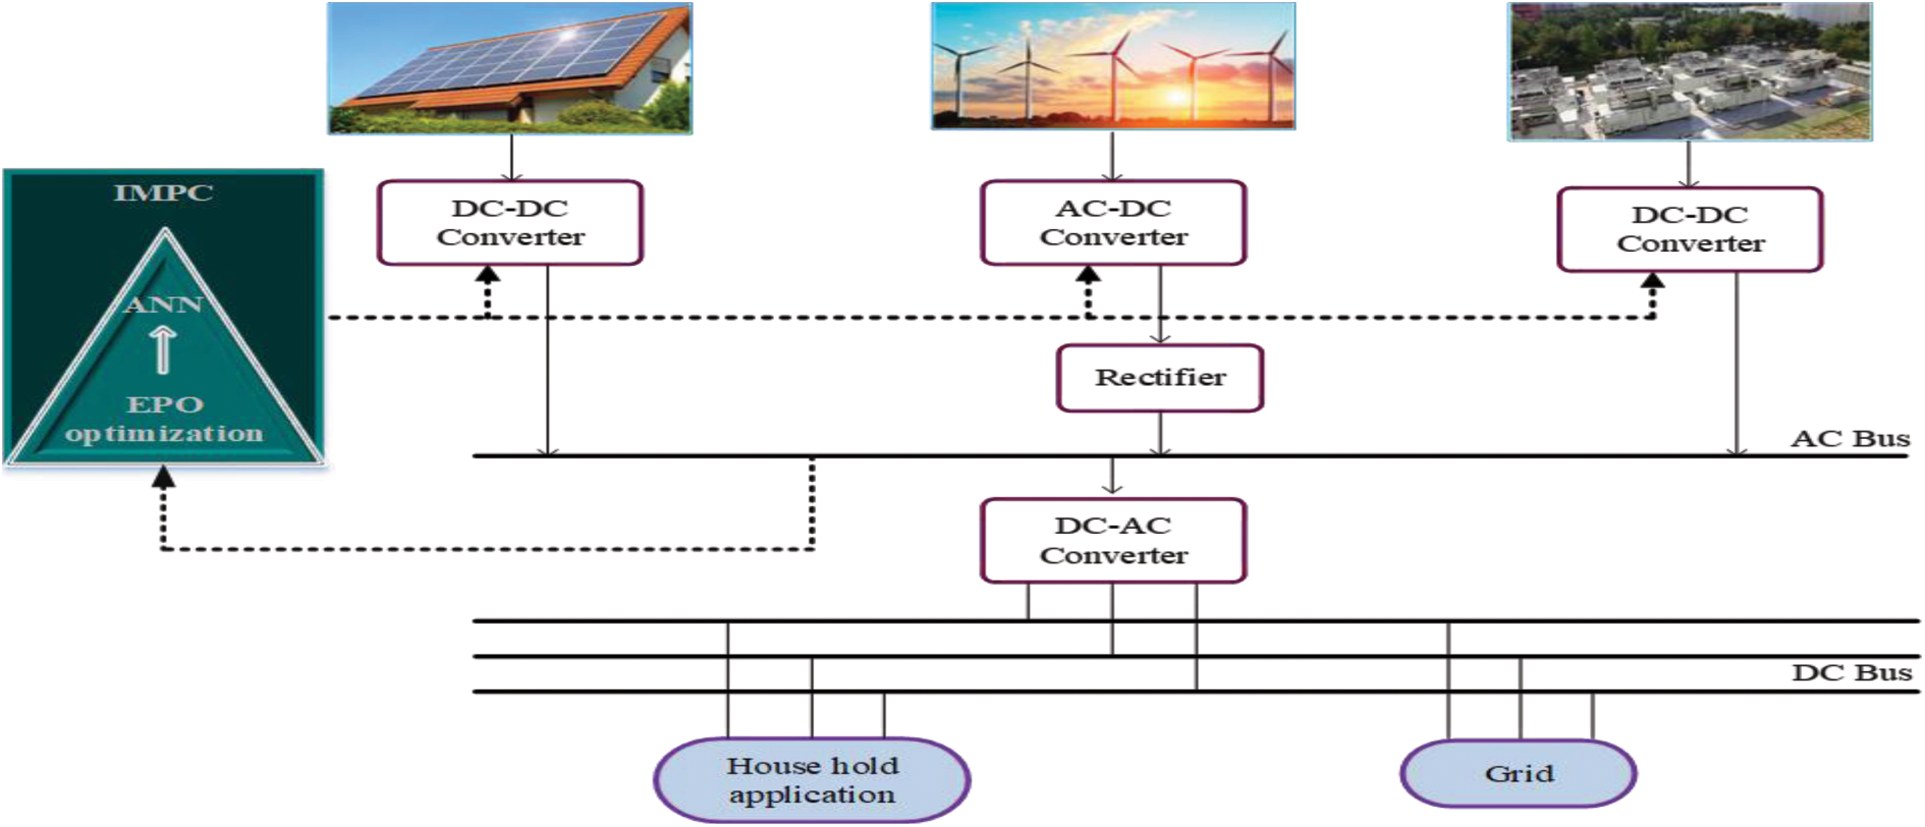
Figure 1: Proposed IMPC design for HRES based EMS system
The proposed RESs system power flow (Phybrid) is determined by Eq. (1).
Here, Ppv is represented as the PV generated power and wind power generation is presented as Pwecs and Pfc is denoted as the fuel cell power. The active power control process derives the system power balance, which depends on the variation of the HRES and required load output power. The system power balance equation is given by Eq. (2).
The generated power is allowed to load with the DC-link (Pdc), which is determined by Eq. (3).
Here, the DC link voltage is denoted as Vdc, Cdc is described as DC-link capacitance and the grid operator power is as Pgrid. When the uncertainty RESs and nonlinear load demand variation is not satisfied, the balance condition of power is disturbed. The system parameters are presented in the following section.
3.1 Solar PV Power Generation System
Solar PV generates electricity from the sunlight by using the PV modules and the induced direct current (DC) is converted into alternating current (AC) using an inverter. The performance of the PV models is attained based on the current-voltage (I–V) curve. Also, the PV system performance is optimized with the help of Maximum Power Point (MPP). According to the latitude regions, the optimum tilt angle is varied [18]. The output of PV array power (Ppv) concerning the PV module current and voltage is determined by Eq. (4).
Here, the PV array rated capacity is denoted as Ysolar concerning the standard test conditions (kW) based output power, fsolar is described as the de-rating factor (%) of PV, the PV array instance radiation of the solar (kWm−2) is denoted as Ginc,
3.2 Wind Power Generation System
A WECS is used for generating the power from wind based on the Permanent Magnet Synchronous Generator (PMSG), which is connected to the grid. The Voltage Source Converters (VSC) of the stator side controls the PMSG electrical torque for achieving the maximum power point tracking (MPPT) and also the regulation of flux by controlling the direct axis current of the generator. The generated power is transferred to the grid with the help of the grid side VSC and the DC-link by stabilizing the nominal voltage value of the DC-link. The grid side VSC is utilized for compensating the reactive power for establishing the unity power factor without injecting reactive power to the grid [19]. In a traditional MPPT algorithm for avoiding the generator fast electrical dynamics, the generated electrical power (Pwecs) is determined by Eq. (5).
The mechanical power (Pmech) is given by Eq. (6).
where Ltrans is described as Laplace transform operator, the efficiency is denoted as ηwecs, the drive train’s time constant as the ratio among shaft’s inertia and friction is τwind that is assumed to be 1.5S while ηwecs is 0.9, air density is denoted as ρ, power coefficient is described as Cpower, λ is described as the tip speed ratio, A is the disk area of rotor and Swind is denoted as the wind speed. The WECS main dynamics are modelled with representing the input disturbance as a first-order filter to the system. The description of the fuel cell model is presented in the following section.
An electrochemical device for exchanging a fuel chemical energy and oxidant directly to the low voltage DC electricity is a fuel cell unit. The proton exchange membrane (PEM) fuel cell is one of the best selections for distributed generation between the fuel cells. Generally, the transformation of an electrochemical reaction is completed with oxygen or air oxidant. The oxidized output is not a portion of the structure of fuel cells, and both products are provided instantaneously. However, electricity generation is kept constant when there are reagents.
Here, the complete model of the PEM fuel cell is modelled from a reduced model and validity was demonstrated and compared the reduced and complete models [20]. The output voltage of fuel cells
Here,
The hybrid system energy source gives an adjustable voltage that is based on their current demand under different ranges. Each source requires a device at the constant voltage for transferring the power output in the DC bus.
Especially, the DC/DC converters require pulse width modulation (PWM) that is interconnected with DC bus and sources. Here, the equivalent model of the converter is given in Fig. 2, which has been modelled by the converters and also the switches of power electronics are described by the sources of voltage and current. The reproduction dynamics of this converter model permits the control system results and interactions of power system higher sample times. Finally, the IMPC for controlling the new EMS is presented in the following section.
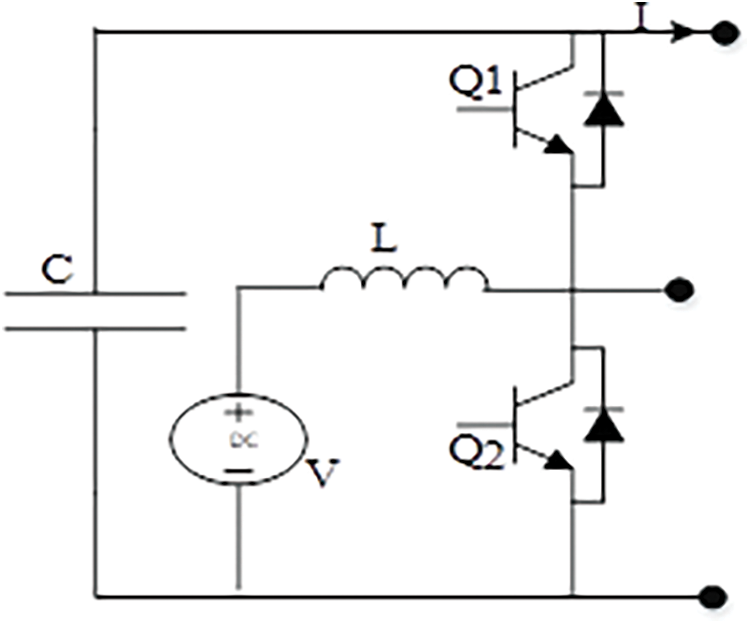
Figure 2: Equivalent circuit model for DC-DC converter
In this work, the IMPC is designed, which is optimized by the ANN-based EPO, as shown in Fig. 3. EPO algorithm optimizes the ANN with MPC scheme for accurate prediction of load for the management. At first, the HRES output is given to the load; if there are any fluctuations in the received power at the grid, then it will be returned to the controller. There as a reference, the energy at the converter is managed to comfort the load.
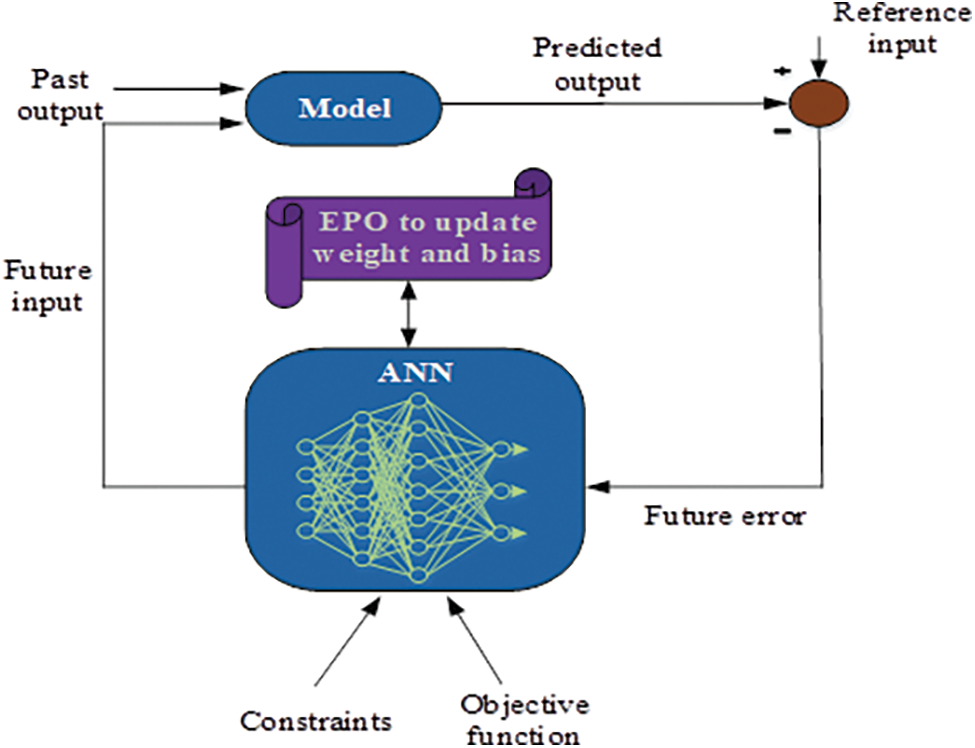
Figure 3: Overview of proposed IMPC
In the MPC, the different optimization resolution problem in each sampling period, as different information is combined in dynamic evolution, this concept is known as receding horizon, illustrated in Fig. 4. In this process, the first control is manually performed through operators, which is a well-known process comprising in area MPC control. At an industrial level, an exact spontaneous approach addresses process control and affected diffusion. The predictor is controlled for determining for every instant t based on the process model and the dynamic process evolution of predictions is [y(t + 1/t), …, y(t + (N/t))]2 in prediction horizon N from information dynamic accessible until that moment [21]. Thus, the cost function of the process is taken as a main objective to retain the output y(t + (k/t)) and a trajectory w(t+k).
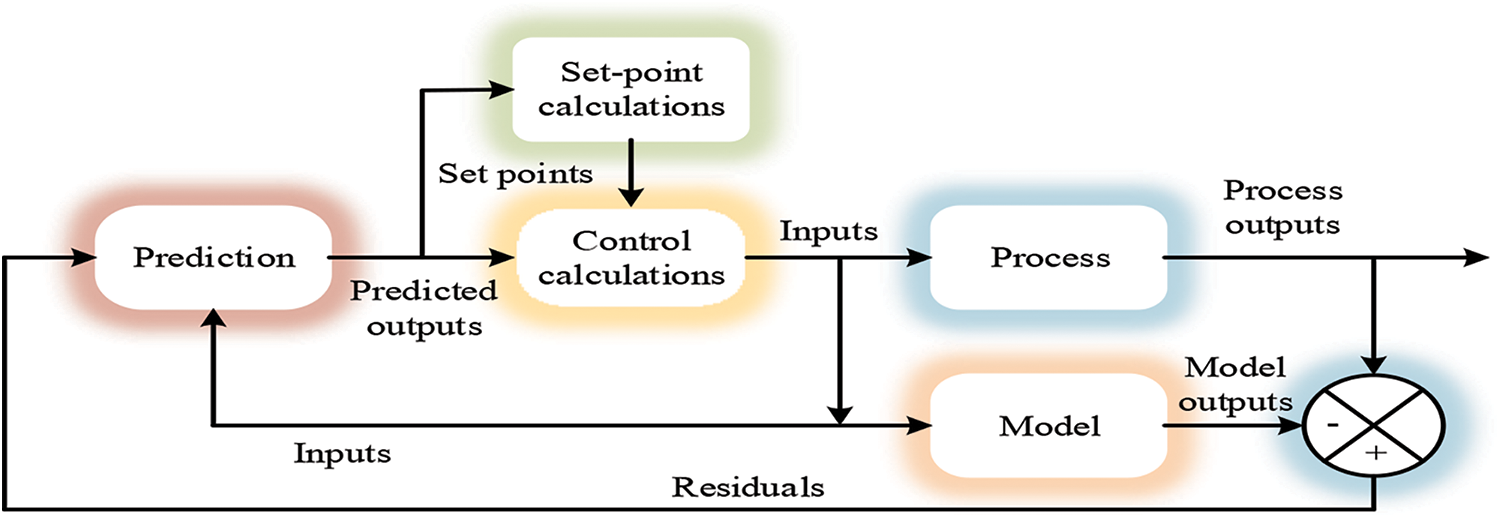
Figure 4: The control structure of the IMPC
Initially, the input process u(t) is and the control signal u(t+1) have to be applied at that moment of the previous instant u(t+(1/t)), which is one not equal to that postulated. The control methodology, analysis describes that in all the implementation, the optimization problem in any predictive control models is understood in each sampling period. In this methodology, it comprises some important components such as optimizer, predictor and objective function, by combining with different variations of these components to obtain some family of predictive controllers. In IMPC, the optimizer for the control of constraints and objective function is set by the ANN. The set of constraints are power limit, load profile etc., and the objectives considered here are demand satisfaction, cost profile. According to the objective function utilized in the given optimization method, the process is modelled by considering different controllers. This can be inferred diversity. The output is determined by Eq. (9).
Here, hi is the sampled values, which is attained by exposing process to an amplitude impulse unit equal to the sampling time interval. Considering the N values as sum is truncated that is described by Eqs. (10) and (11).
The required prediction is described by Eq. (12).
For stable systems, the truncated response is determined by Eq. (13).
Here, gi is the sampled value before step input y, then the variation of actual and reference values is presented by Eq. (14).
The value of y0 taken as 0 without generality loss with the predictor is determined by Eq. (15).
The equations of state space are presented by Eq. (16).
Here, the state is described as x, the system matrices A, B are denoted as input and C is the output. The prediction control model is illustrated by Eq. (17).
This strategy has a favorable position, which additionally helps multivariable frameworks, though permitting for investigating the procedure internal structure. To predict the output parameters, the significant input constraints are generated. The selected parameters include the controllable parameters, uncontrollable parameters and parameters impacting system operations. The uncontrollable parameters like solar normal flux and outside air temperature. The data-driven models of hybrid renewable energy system (HRES) have three zones, the humidity and temperature of these three zones of energy consumption at t + 1. The neural network of multi-layer perceptron (MLP) is working for improving models. The IMPC is used with two hidden layers for the ANN, thus forming four layers as input, hidden layer 1, hidden layer 2 and output layer [22] as shown in Fig. 5. To evaluate the predictive model performance, four metrics are utilized in this model described as follows. These metrics are given to the ANN.
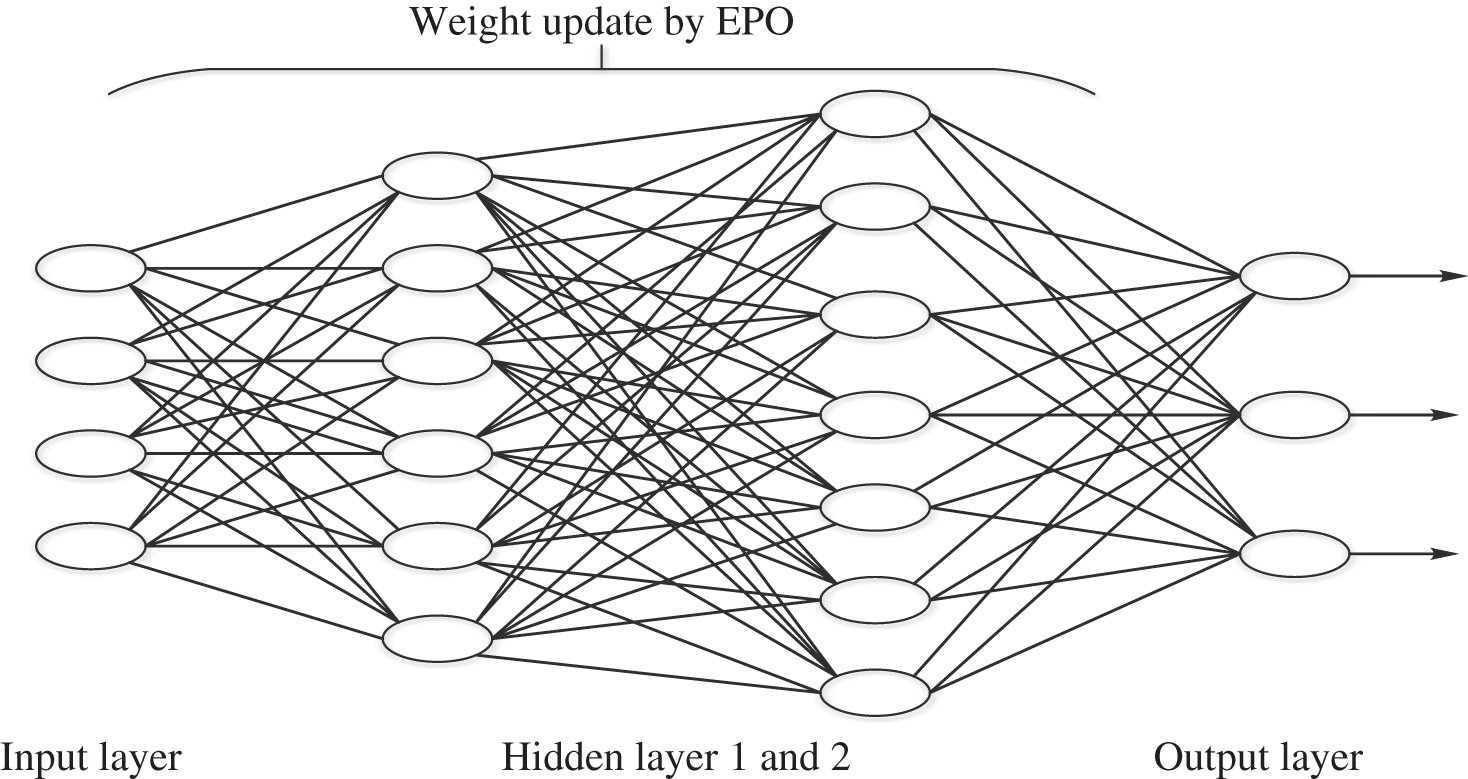
Figure 5: ANN for IMPC with two hidden layers
The mean absolute percentage error (MAPE) is determined by Eq. (18), which is computes the power fluctuation error present in the system.
The standard deviation of absolute percentage error (Sd_APE) is evaluated by Eq. (19), computes the MPC controller standard deviation error.
The maximum absolute error (MAX) is estimated by Eq. (20), which is used to find the maximum error, which is present in the load profile.
The minimum absolute error (MIN) given by Eq. (21) is used to find the minimum error present in the load profile.
In the hidden layer, for training the neural networks, the number of nodes is randomly set from 3 to 25. To initialize the weights of connecting input, output and hidden nodes, the normal distribution of standard with deviation 1 and mean 0 is presented. In the next section discussed the established predictive models based MLP are the optimization process utilized.
Here an optimization algorithm named EPO algorithm is proposed for optimizing the ANN parameters for improving the performance of the proposed system. The algorithm inhibits the huddling behavior of emperor penguins (EP) [23]. The EP move towards the high temperature profile region on the search space. Here the temperature search of the EP is noted as the weight of the ANN with reduced error. Number of EPs are move in the ANN by taking the initial output of the ANN to search the weight and bias value. The fitness function is the minimization of error in the neural network and is given by Eq. (22).
The total population for the search of the low error rate by EP is 2 N. Initially the boundary limit for the EP to move on the search space is given by Eq. (23).
where, ϕ is the weight factor between the hidden layers and Ψ is the current output of the neural network. The complex term is given by Eq. (24).
Here, iγ is the imaginary term to generate the potential having γ as vector and F is the analytical function. Then the error rate searched by the EP is given by Eq. (25).
where, s is the ongoing iteration. E′ is the current search by EP, which is calculated based on the previous search value. E is the previous search that is obtained at the previous iteration. P is the error rate if the error rate at the previous stage is within 0.5, then the accurate prediction is needed else the maximum error is obtained on the previous stage.
where, Z is the force that makes the EP to move towards the low error rate value and the current position of the EP is given by Po(s). Opt is the optimal error rate and Lil is the parameter that is used to avoid the collision between the EP and are given by Eq. (28).
where, Cil = rand() and M is a constant which is set to 2. The function R() can be given by Eq. (29).
Then the relocation of the EP is set that is the movement of EP by calculating the error rate. The movement of it is given by Eq. (30).
where, Po(s + 1) is the position of EP in the subsequent iterations. The pseudocode for the EPO that relies on the search for the exploration and exploitation properties is given below:

A linear dynamic model developed by empirical data is used in most industrial applications, even though the process itself is often nonlinear. Due to the difficulty in developing a generic nonlinear model from empirical data, the linear models have been used, and the computational expense is often involved in using nonlinear models. For developing a nonlinear dynamic model from empirical data, and EPO optimized ANN-based technique is presented in this paper. It shows that these models are utilized in the MPC method. In several applications, this nonlinear IMPC based approach has been successfully implemented. The proposed method performance is described in Section 3.
Here, the proposed IMPC is utilized as an energy management system. The proposed method was implemented in an Intel Core i5 processor through 8 GB RAM based hardware with MATLAB/Simulink platform with the 2016a version. The proposed system performances are compared with recently developed existing works, such as ACO-ANN, BP-NN and MPC. The load forecasted performance is compared with actual load, forecasted load with ACO-ANN and predicted load with NN-BP. The proposed controller for total harmonic distortion (THD) is compared with the existing NN-BP and MPC controller. The performance comparison is performed utilizing power parameters of the proposed control scheme. The energy management capability of the proposed system is analyzed for different atmospheric conditions as case studies. The detailed working procedure of the proposed control method and the resultant energy management system will be presented.
The MATLAB/Simulink for the proposed architecture has been shown in Fig. 6. The PV, wind and fuel cell are modelled on the corresponding blocks in Fig. 6. For the control of harmonic produced by the DC-DC converter, the FW diode is used along with the three power generator blocks. For the controlled delivery of the power to the load, the 3-level bridge is used. The next scope to this block is the three-phase output power generated by the generators. In this setup, if the power generator fails, then the connection with the fuel cell supply the load. The state of charge is also analyzed and is transmitted to the fuel cell when the other generators are not able to meet the load. On the whole, the designed Simulink setup delivers power from the power generator to the load through the grid connection. Finally, the results are evaluated, and the power balance between the generated power and the load demand is obtained in this system.
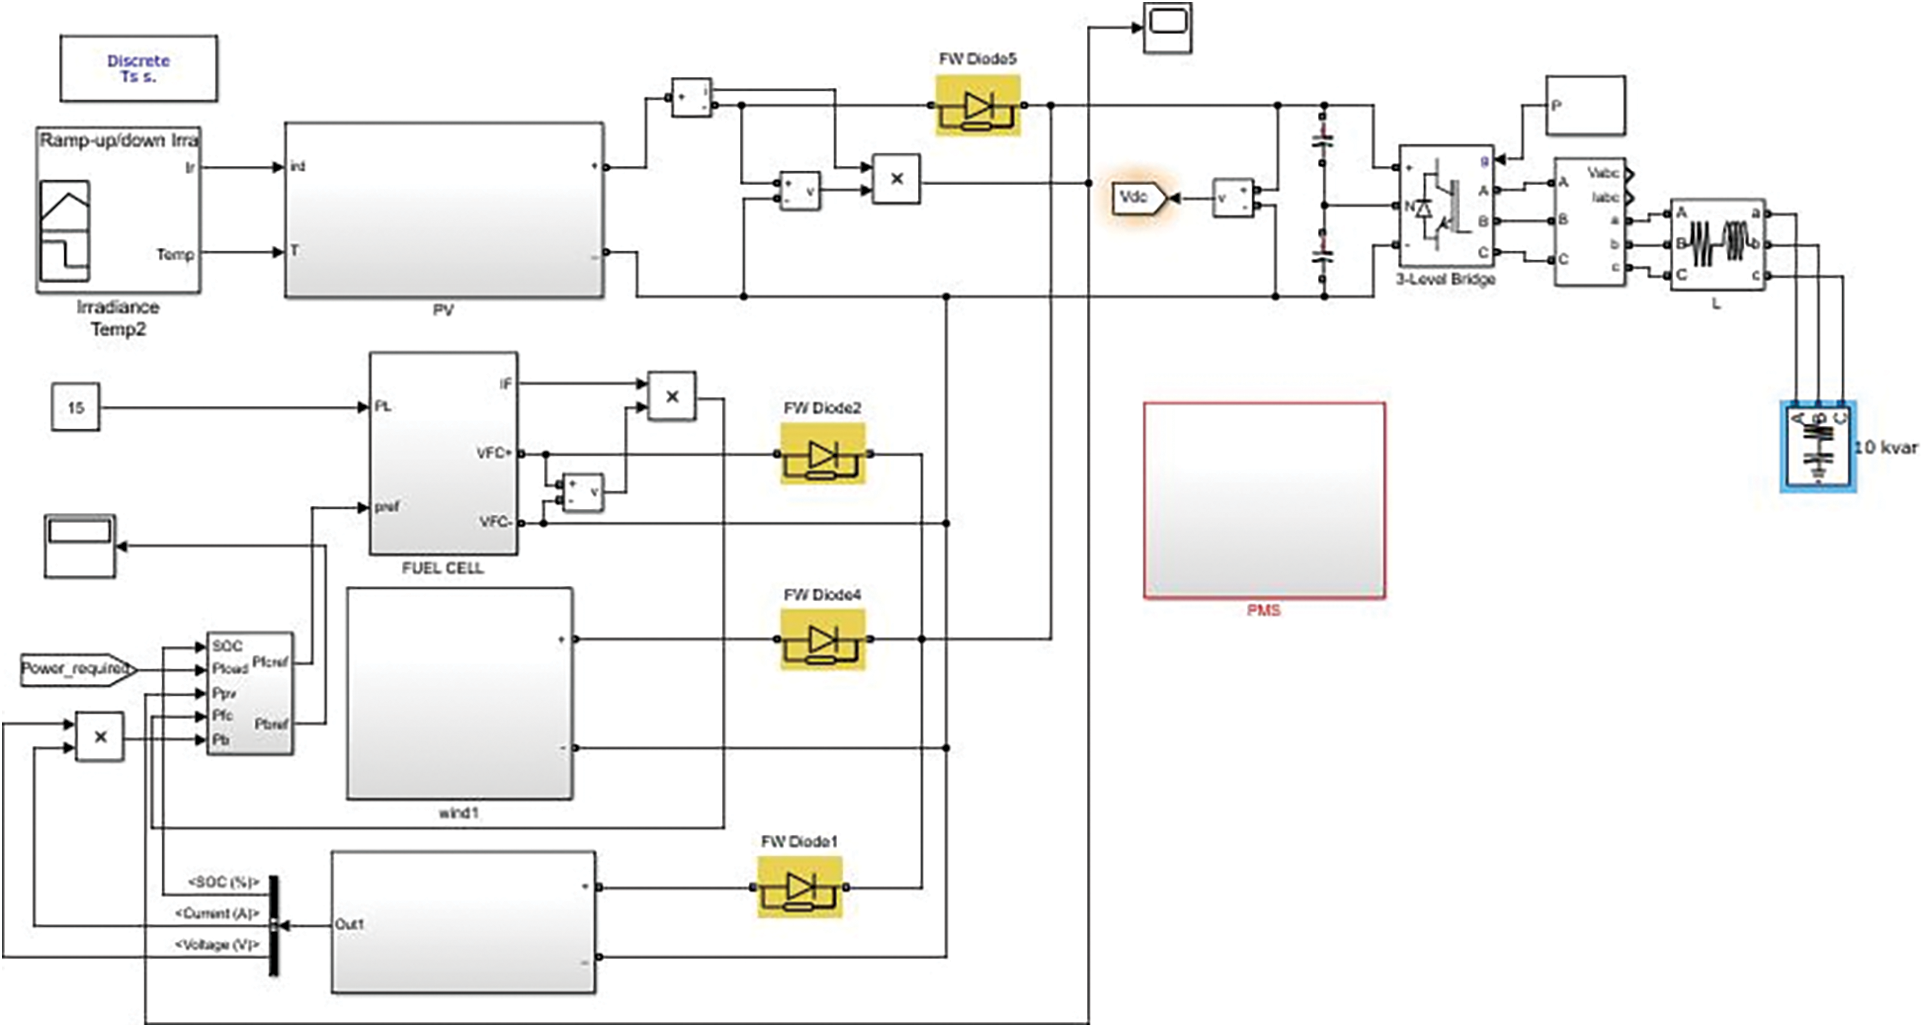
Figure 6: Simulation diagram of the proposed model
The simulation results of energy for a 12-h performance are shown in Fig. 7. It shows the generated power in kW, load consumption power, high generation power of fuel cell and balanced storage power between the generated and demand power. The results are obtained in various conditions for 12-h. The first graph in Fig. 7 indicates the generated power graph by the PV and wind generator, the second graph represents the load profile; the third one represents the amount of power that is balanced in the storage system for future use and the last graph represents the power generated by the fuel cell.
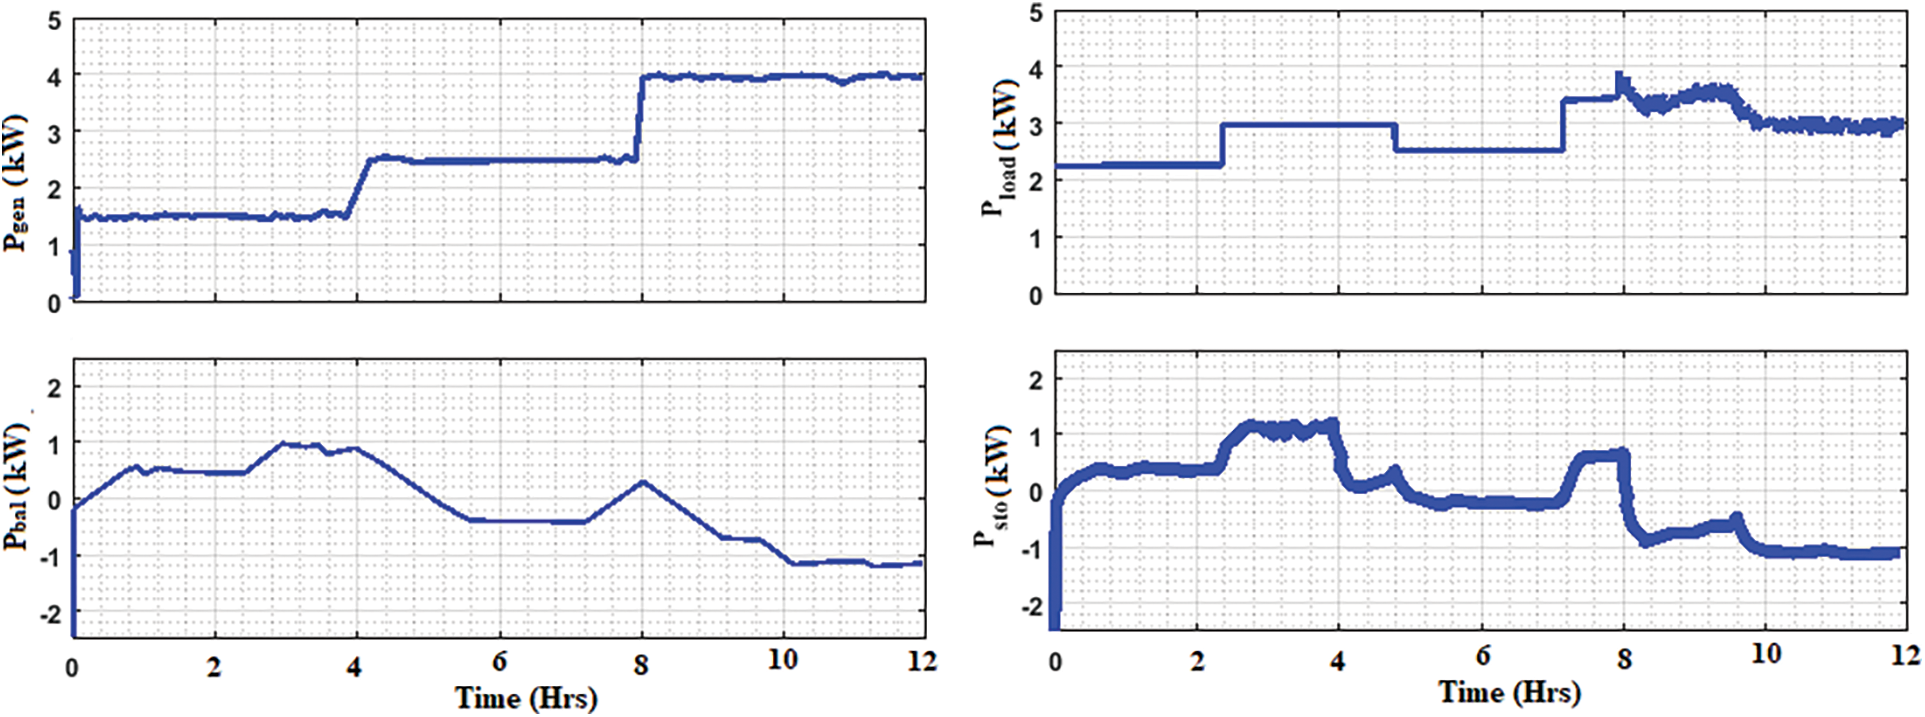
Figure 7: Simulation results of energy transmitted for 12 h: Power generation, load consumptions, fuel cell generated power, and balanced storage system
The self-energy storage system has also been displayed in Fig. 7, and it is related to the variation in the generated power and consumed load power. The storage system maintains the state of charge in it by sending the signal to the fuel cell when the power is indeed to the load. If the generated power is lower than the load utilization, the storage system will be discharged. At the same time, the power grid input power is filled based on the power deficit, because all load demand cannot satisfy the discharging power.
Fig. 8 shows the simulation results of the energy routed for 12 hrs in different conditions. It shows that the high generation power, load utilization power, drop out of fuel cell power and the balanced storage power. The generated power is increased in this condition. Demand utilization values are also shown in this result. Besides, reduced fuel cell power is also shown in this performance. Finally, the balanced storage power is also displayed in these results.
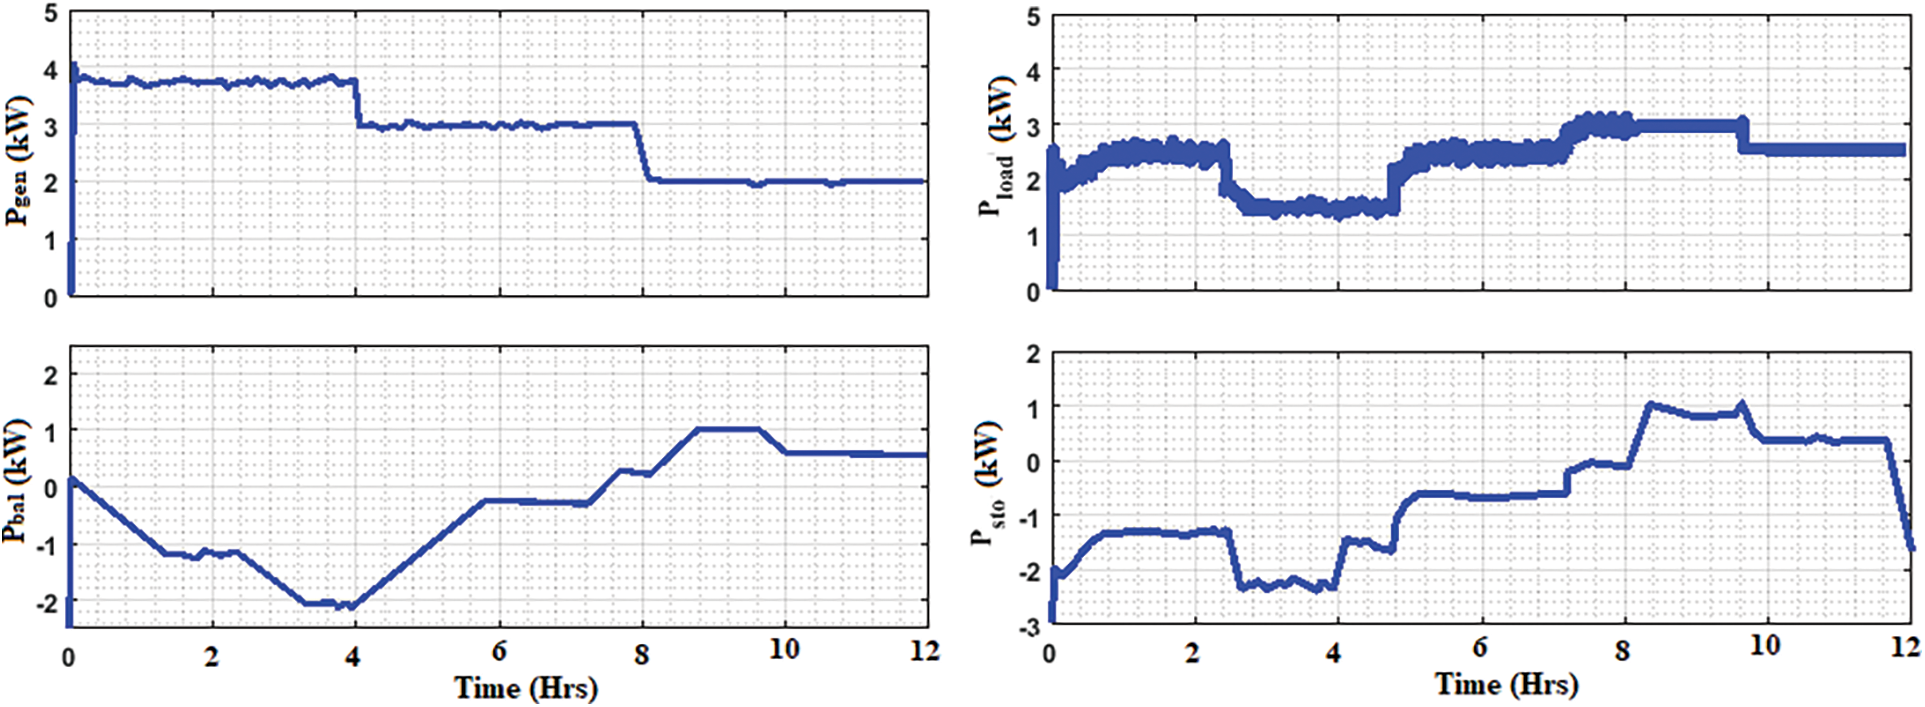
Figure 8: Simulation results of energy routed for 12 h: High power generation, load consumptions, low power generation of the fuel cell, and low balanced storage system
Fig. 9 shows the comparison of load power and load demand in different state. The power values are given for 24-h. On one condition, the load demand is constant; that is, constant load demand is there for 24 h. The generated power reaches the load demand in less time duration. 7 kW constant load demand is reached during the 1 h time period. Next, for another condition, different load demand has been fixed in 24 h. Here also the generated power meets the demand at different load demand.
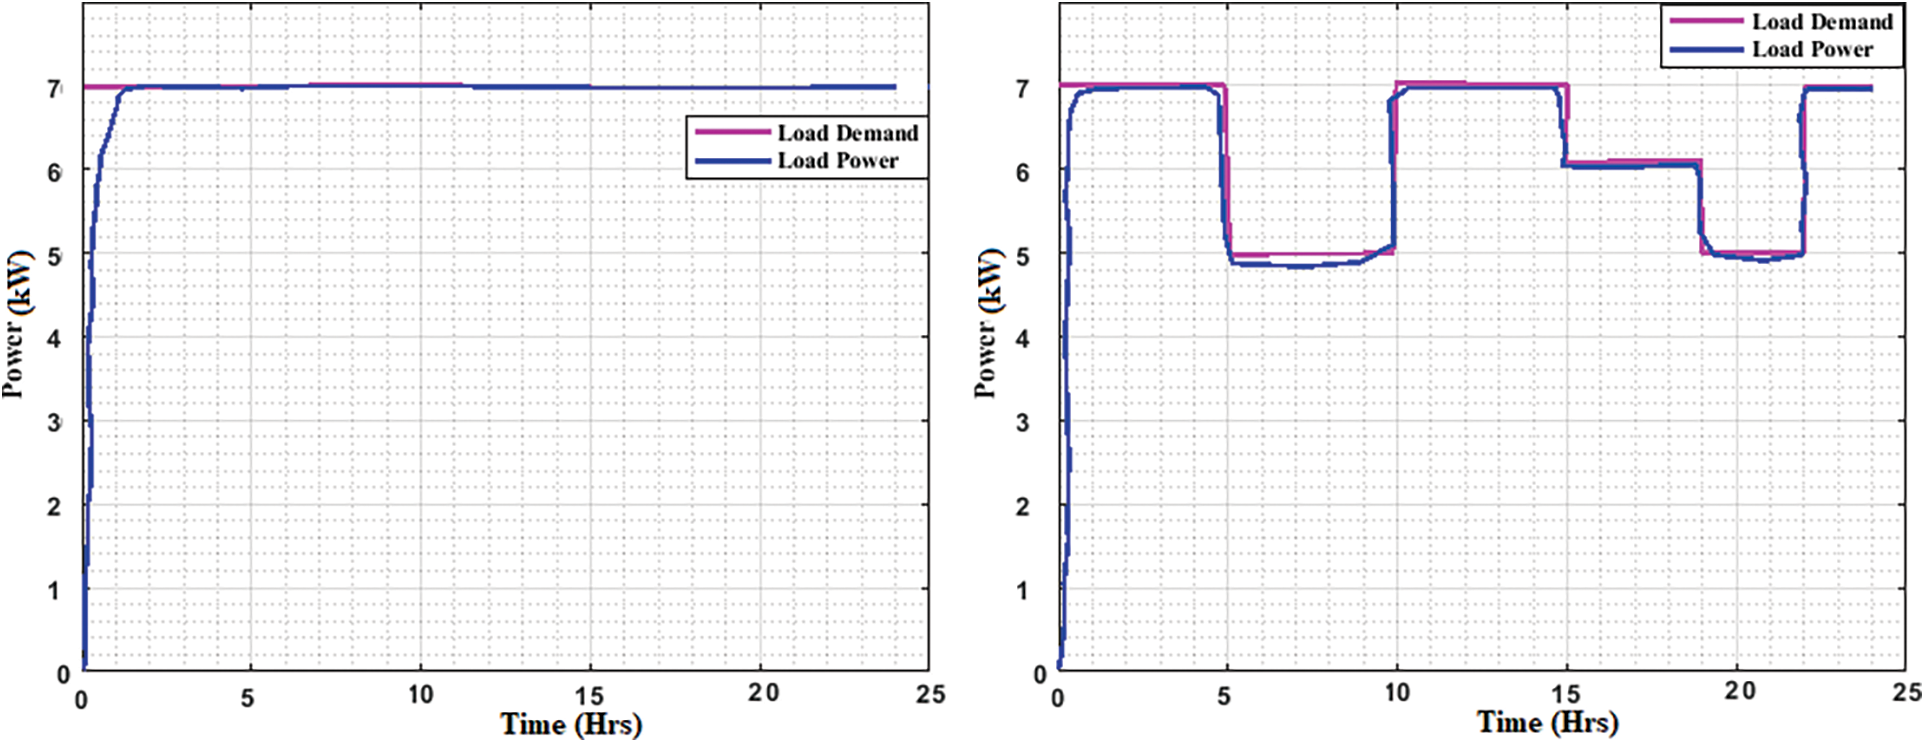
Figure 9: Load power and load demand comparison at different conditions
Fig. 10 shows the comparative analysis of load forecasted with the proposed system. The performance of the proposed model is compared with actual load, load forecasted of ACO-ANN and NN-BP. High forecasted load power value is shown in Fig. 10. Compared with existing approaches, the proposed model forecasted the load easily. Compared to the actual load, the proposed model gets the performance of second-most level. Compared to the NN-BP approach, the proposed model obtains better results. The forecasted load values are obtained in kW for 24 h. Existing approaches NN-BP obtains lowermost value for the forecasted load.
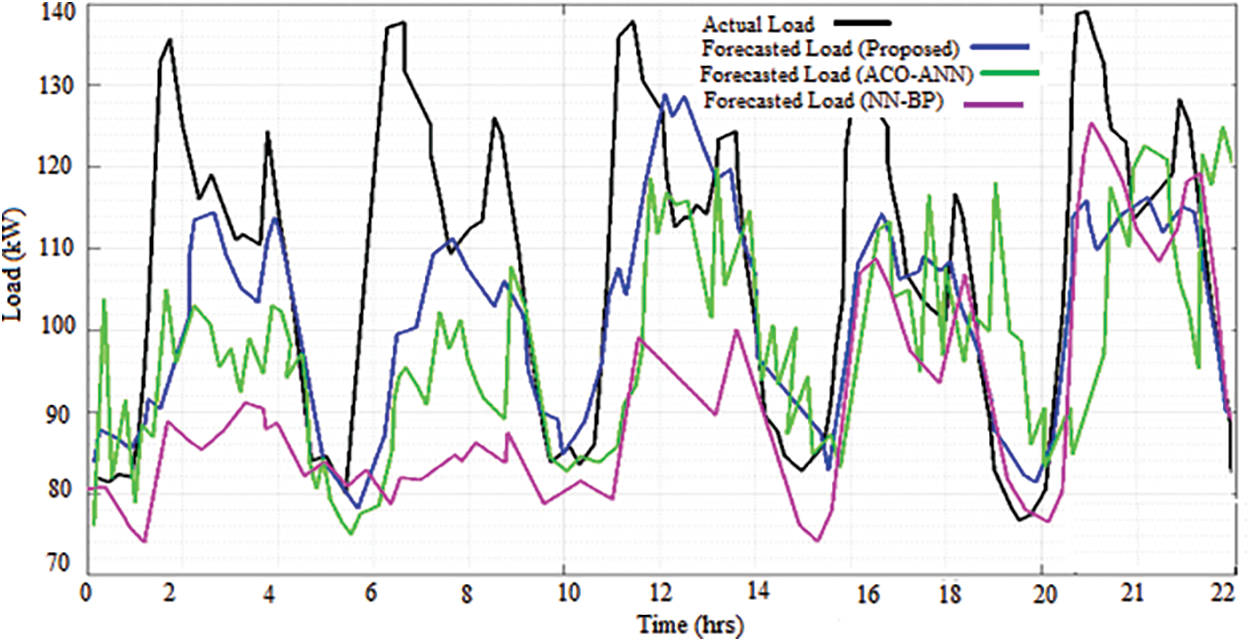
Figure 10: Comparison analysis of load forecasted with proposed system
Fig. 11 shows the comparison of power values one year from Jan-18 to Dec-18. For 1st year, the approximate power generated by the PV, wind, the demanded load from the grid side, and the fuel cells balanced power generation to equalize the load is shown in Fig. 11. Comparison of generating power of PV and wind in kW, balanced power of fuel cell in kW, required grid power in kW and the total power are shown in Fig. 11. The blue lines represent the PV generated power in kW; green line represented the FC balance power in kW; sky blue line represents the total power (kW); red line represents the wind generated power (kW) and violet line represents required grid power (kW). The total and required grid power is varied in each month. The highest rate of total and the required power is indicating oct-18. At Jan-18, the total power is lower than the demand, therefore the discharging is placed, and hence the balanced power gets discharged. Compared to Jan-18, Apr-18 has low demand and high total power, and then the balanced power stored or charged. Furthermore, Dec-18 also has a lower demand than the total power, so the remaining power is charged. Based on the analysis, the proposed system gives better outcomes for all time variations. Finally, the proposed system concludes with its performance from analysing different weather and load demand conditions.
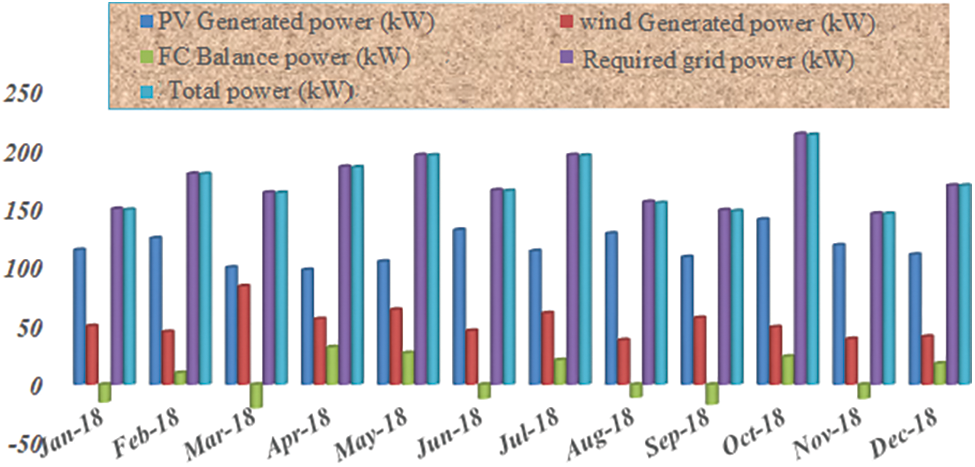
Figure 11: Comparison of power values for one year from Jan-18 to Dec-18
Cost reduction is the primary requirement in the power system to manage energy. The cost analysis brings the average specificity of the energy management system in terms of power utilization by the load. Fig. 12 displays the computational cost analysis of IMPC, which was performed concerning total system cost, life cycle cost and annualized cost by comparing with ACO-ANN, BB-NN, MPC and IMPC. The performance analysis shows that the total system cost, life cycle cost and annualized cost obtained by IMPC are better compared to other methods. The highest cost using method is ACO-ANN method. The IMPC is most benefit and cost-effective method compared to other comparative methods because of neural network optimized EPO, which removes the noise present in the system and give the perfect output. This is the reason for reducing the cost in the proposed IMPC method.
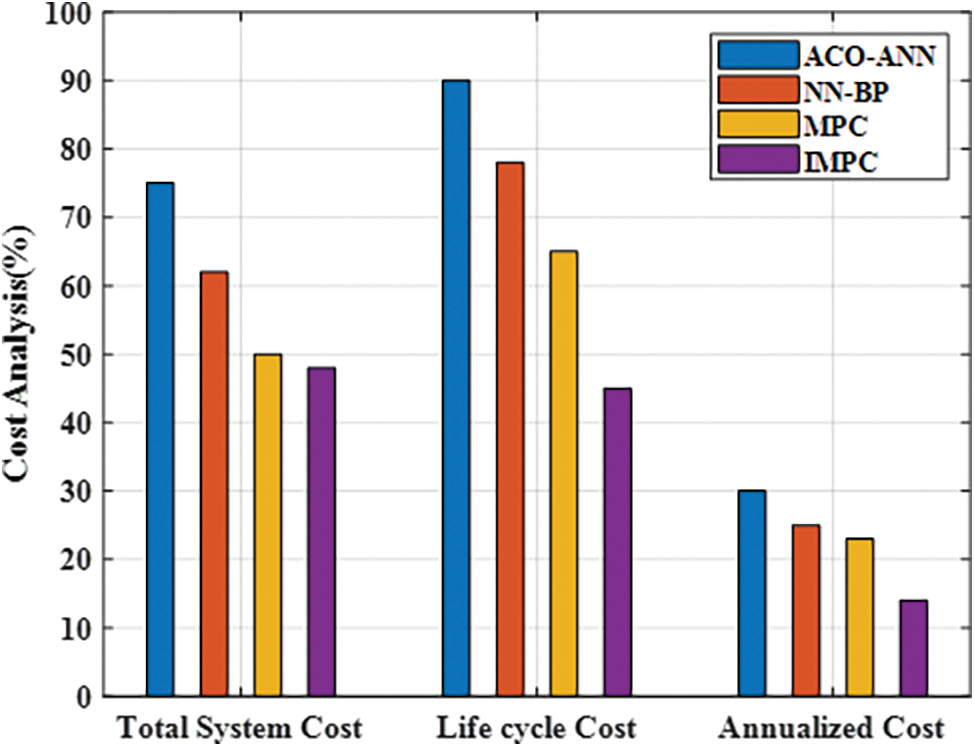
Figure 12: Analysis of computational cost
Tab. 1 shows the comparison of total harmonic distortion (THD). The reduction of harmonics using the proposed controller is better than that using the NN-BP and MPC controllers. The THD value for the existing NN-BP controller is 18.19% and MPC controller is 16.11%. Hence the THD value becomes lower when the proposed controller has been used.
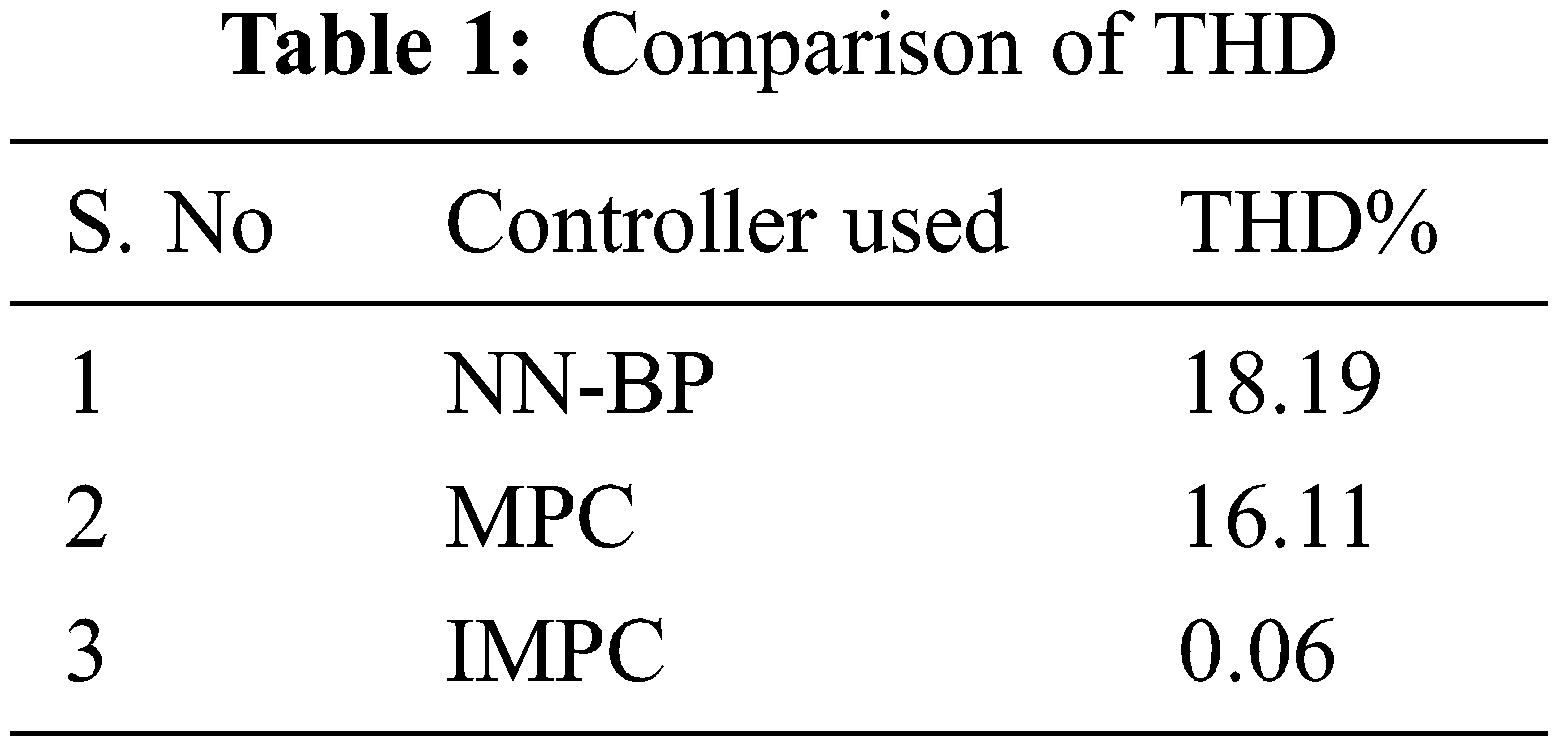
An improved model predictive control (IMPC) scheme has been developed for the prediction of accurate load and weather forecasting data of RES with EMS in this work. The proposed IMPC is working based on the combination of MPC controller and EPO optimization algorithm, which optimizes the bias and weight of ANN. Further, this optimized ANN is used to tune the MPC prediction model. The design of the proposed EMS structure consists of PV, wind and fuel cells along with household appliances and grid system. The weather and forecast data are generated from RES for processing the performance of the proposed EMS. There are some converters like AC-DC and DC-AC, and these are used in the conversion process of one form to another form of signal. The MATLAB/Simulink platform has been utilized for the implementation of the proposed system, and the outcomes are validated with some traditional techniques based on the different atmospheric conditions. Computational cost analysis of IMPC is performed concerning total system cost, life cycle cost and annualized cost by comparing with ACO-ANN, BB-NN, MPC and IMPC. The performance analysis shows that IMPC consumes less cost than comparative methods. The THD obtained by the proposed controller is 0.06%, which is better when compared with the existing NN-BP and MPC controllers. However, this system is only applicable for household appliances (moderate power). In future, the work will be implemented for heavy duty industries carrying high power where the power fluctuation limitation is necessarily needed.
Funding Statement: The author received no specific funding for this study.
Conflicts of Interest: The author declare that they have no conflicts of interest to report regarding the present study.
1. S. Das and A. K. Akella, “Power flow control of PV-wind-battery hybrid renewable energy systems for stand-alone application,” International Journal of Renewable Energy Research, vol. 8, no. 1, pp. 36–43, 2018. [Google Scholar]
2. L. Bartolucci, S. Cordiner, V. Mulone, V. Rocco and J. L. Rossi, “Hybrid renewable energy systems for renewable integration in microgrids: Influence of sizing on performance,” International Journal of Renewable Energy Research, vol. 152, pp. 744–758, 2018. [Google Scholar]
3. S. S. Singh and E. Fernandez, “Modeling, size optimization and sensitivity analysis of a remote hybrid renewable energy system,” International Journal of Energy, vol. 143, pp. 719–731, 2018. [Google Scholar]
4. A. M. Abdullah, H. Rezak, A. Elbloye, M. K. Hussan and A. F. Mohamed, “Grey wolf optimizer-based fractional MPPT for thermoelectric generator,” Intelligent Automation & Soft Computing, vol. 29, no. 3, pp. 729–740, 2021. [Google Scholar]
5. M. Bagheri, N. Shirzadi, E. Bazdar and C. A. Kennedy, “Optimal planning of hybrid renewable energy infrastructure for urban sustainability: Green vancouver,” International Journal of Renewable Sustainable Energy Review, vol. 95, pp. 254–264, 2018. [Google Scholar]
6. L. Bartolucci, S. Cordiner, V. Mulone and S. Pasquale, “Fuel cell based hybrid renewable energy systems for off-grid telecom stations: Data analysis and system optimization,” International Journal of Applied Energy, vol. 252, pp. 113386, 2019. [Google Scholar]
7. M. Faccio, M. Gamberi, M. Bortolini and M. Nedaei, “State-of-art review of the optimization methods to design the configuration of hybrid renewable energy systems (HRESs),” Frontiers in Energy, vol. 12, no. 4, pp. 591–622, 2018. [Google Scholar]
8. F. A. Khan, N. Pal and S. H. Saeed, “Review of solar photovoltaic and wind hybrid energy systems for sizing strategies optimization techniques and cost analysis methodologies,” International Journal of Renewable Sustainable Energy Review, vol. 92, pp. 937–947, 2018. [Google Scholar]
9. M. Edwin and S. J. Sekhar, “Techno-economic evaluation of milk chilling unit retrofitted with hybrid renewable energy system in coastal province,” Energy, vol. 151, pp. 66–78, 2018. [Google Scholar]
10. J. S. Kim, R. D. Boardman and S. M. Bragg-Sitton, “Dynamic performance analysis of a high-temperature steam electrolysis plant integrated within nuclear-renewable hybrid energy systems,” Applied Energy, vol. 228, pp. 2090–2110, 2018. [Google Scholar]
11. G. Serale, M. Fiorentini, A. Capozzoli, D. Bernardini and A. Bemporad, “Model predictive control (MPC) for enhancing building and HVAC system energy efficiency: Problem formulation, applications and opportunities,” Energies, vol. 11, no. 3, pp. 631, 2018. [Google Scholar]
12. E. Muh and F. Tabet, “Comparative analysis of hybrid renewable energy systems for off-grid applications in southern cameroons,” Renewable Energy, vol. 135, pp. 41–54, 2019. [Google Scholar]
13. E. O. Diemuodeke, A. Addo, C. O. C. Oko, Y. Mulugetta and M. M. Ojapah, “Optimal mapping of hybrid renewable energy systems for locations using multi-criteria decision-making algorithm,” Renewable Energy, vol. 134, pp. 461–477, 2019. [Google Scholar]
14. W. S. Ebhota and T. C. Jen, “Fossil fuels environmental challenges and the role of solar photovoltaic technology advances in fast tracking hybrid renewable energy system,” International Journal of Precision Engineering and Manufacturing-Green Technology, vol. 7, no. 1, pp. 97–117, 2020. [Google Scholar]
15. G. Bianchini, M. Casini, D. Pepe, A. Vicino and G. G. Zanvettor, “An integrated model predictive control approach for optimal HVAC and energy storage operation in large-scale buildings,” Applied Energy, vol. 240, pp. 327–340, 2019. [Google Scholar]
16. S. Kuboth, F. Heberle, A. König-Haagen and D. Brüggemann, “Economic model predictive control of combined thermal and electric residential building energy systems,” Applied Energy, vol. 240, pp. 372–385, 2019. [Google Scholar]
17. B. Wang, L. Xian, U. Manandhar, J. Ye, X. Zhang et al., “Hybrid energy storage system using bidirectional single-inductor multiple-port converter with model predictive control in DC microgrids,” Electric Power Systems Research, vol. 173, pp. 38–47, 2019. [Google Scholar]
18. H. Golmohamadi, R. Keypour, B. Bak-Jensen and J. R. Pillai, “Optimization of household energy consumption towards day-ahead retail electricity price in home energy management systems,” Sustainable Cities and Society, vol. 47, pp. 101468, 2019. [Google Scholar]
19. N. E. Koltsaklis, M. Giannakakis and M. C. Georgiadis, “Optimal energy planning and scheduling of microgrids,” Chemical Engineering Research and Design, vol. 131, pp. 318–332, 2018. [Google Scholar]
20. N. E. Koltsaklis, G. M. Kopanos and M. C. Georgiadis, “Design and operational planning of energy networks based on combined heat and power units,” Industrial & Engineering Chemistry Research, vol. 53, no. 44, pp. 16905–16923, 2014. [Google Scholar]
21. Q. Lu, S. Lü, Y. Leng and Z. Zhang, “Optimal household energy management based on smart residential energy hub considering uncertain behaviors,” Energy, vol. 195, pp. 117052, 2020. [Google Scholar]
22. X. Luo, Y. Liu, J. Liu and X. Liu, “Energy scheduling for a three-level integrated energy system based on energy hub models: A hierarchical stackelberg game approach,” Sustainable Cities and Society, vol. 52, pp. 101814, 2020. [Google Scholar]
23. S. Harifi, M. Khalilian, J. Mohammadzadeh and S. Ebrahimnejad, “Emperor penguins colony: A new metaheuristic algorithm for optimization,” Evolutionary Intelligence, vol. 12, no. 2, pp. 211–222, 2019. [Google Scholar]
 | This work is licensed under a Creative Commons Attribution 4.0 International License, which permits unrestricted use, distribution, and reproduction in any medium, provided the original work is properly cited. |