DOI:10.32604/iasc.2023.027449
| Intelligent Automation & Soft Computing DOI:10.32604/iasc.2023.027449 | |
| Article |
Multi-Objective Optimization with Artificial Neural Network Based Robust Paddy Yield Prediction Model
1Department of Computer Science, Alagappa University, Karaikudi, 630003, India
2Department of Computer Science, Dr. Umayal Ramanathan College for Women, Karaikudi, 630003, India
*Corresponding Author: S. Muthukumaran. Email: muthumphil11@gmail.com
Received: 18 January 2022; Accepted: 21 February 2022
Abstract: Agriculture plays a vital role in the food production process that occupies nearly one-third of the total surface of the earth. Rice is propagated from the seeds of paddy and it is a stable food almost used by fifty percent of the total world population. The extensive growth of the human population alarms us to ensure food security and the country should take proper food steps to improve the yield of food grains. This paper concentrates on improving the yield of paddy by predicting the factors that influence the growth of paddy with the help of Evolutionary Computation Techniques. Most of the researchers used to relay on historical records of meteorological parameters to predict the yield of paddy. There is a lack in analyzing the day to day impact of meteorological parameters such as direction of wind, relative humidity, Instant Wind Speed in paddy cultivation. The real time meteorological data collected and analysis the impact of weather parameters from the day of paddy sowing to till the last day of paddy harvesting with regular time series. A Robust Optimized Artificial Neural Network (ROANN) Algorithm with Genetic Algorithm (GA) and Multi Objective Particle Swarm Optimization Algorithm (MOPSO) proposed to predict the factors that to be concentrated by farmers to improve the paddy yield in cultivation. A real time paddy data collected from farmers of Tamilnadu and the meteorological parameters were matched with the cropping pattern of the farmers to construct the database. The input parameters were optimized either by using GA or MOPSO optimization algorithms to reconstruct the database. Reconstructed database optimized by using Artificial Neural Network Back Propagation Algorithm. The reason for improving the growth of paddy was identified using the output of the Neural Network. Performance metrics such as Accuracy, Error Rate etc were used to measure the performance of the proposed algorithm. Comparative analysis made between ANN with GA and ANN with MOPSO to identify the recommendations for improving the paddy yield.
Keywords: ANN; back propagation algorithm; genetic algorithm; multi objective particle swarm optimization algorithm
Paddy (Oryza Sativa Linn) is one of the major food crops that serve as major food products to more than 50 percent of the human population [1]. Paddy is an annual crop that is believed to be cereal with monocot grain and it is cultivated in countries where there is low labor cost and heavy rainfall. In India Rice is cultivated in 43.99 million hectares and approximately produces 120 million tons with an average of 1855 kg/hectare for an annual year. In the financial year, 2021 India has produced 296.65 million tons of food grains and thereby the agricultural sector contributes 19.48 lakh crore to the Gross Value Added (GVA). To improve the income of the farmer in the upcoming years, the agricultural sector should develop new techniques in terms of irrigation, warehousing, and cultivation techniques [2]. The main objective of the study is to forecast the yield of paddy to ensure food security. The extensive growth of the human population in developing countries like India gives rise to a great demand for food production. The global rise in population, changes in the global climatic environment, decrease in the geographical area of cultivated land, and rising of price for food products has a significant impact on global food security [3]. Paddy crop yield forecasting helps in increasing food security by predicting the amount of paddy harvested in advance before the harvest takes place. The early prediction of paddy yield helps in the reduction of risk associated with production, processing, transport, and consumption of food [4].
Computational Intelligence is the branch of Artificial Intelligence that aims to design computer programs to learn themselves a complex real world problem as the human does. Using traditional programming methods to solve complex problem will arise problems such as complexity and uncertainty. Imitating the human intelligence to solve the reasoning problem is the root idea for developing the evolutionary algorithms. Developing an automated model to solve real world problem through computational intelligence can be achieved using fuzzy logic, evolutionary computation and neural network approaches [5]. The fuzzy logic is used to understand the real world problem like human does by natural language processing and converts the problem into a binary form. Evolutionary Algorithms are metaheuristic optimization algorithms that work on the basis of survival of the fittest theory. The EA algorithm first select the population and do reproduction and produce the next generation population by selecting the best parameters on the basis of theory of natural selection. The Neural Network approach just imitates the human brain, the input was fed through neurons and the information was processed and feedback was given as output to axons. Learning from the output of the algorithm was achieved by cognitive analysis and helps in making predictions. Making decision on the acquired knowledge was done by probabilistic theory [6].
This paper uses three evolutionary algorithms such as Genetic Algorithm, Multi Objective Particle Swarm Optimization Algorithm and Artificial Neural Network Algorithm. The first two algorithms are used to select the optimized input from the paddy dataset and third algorithm is used to predict the reason for improving the yield by constructing an Artificial Neural Network. The factors which influence crop production such as soil fertility, water level, the moisture content in the atmosphere were measured with the help of sensors and feed as input to the Evolutionary Algorithms [7]. The algorithm after processing the input data gives an output which is called as models and it helps to predict the yield of the crop in advance before the actual harvest takes place. While implementing computation intelligence in real life has some limitations such as the insufficient quantity of data for training the model, impurities present in the dataset, using more attributes that will reduce the performance of the classifier and increase the computational cost. Using more attributes to train the model will also cause over fitting that will fail to generalize the outcome of the computational learning models. The novelty of this research was, it accurately collected the day to day meteorological data from the Meteorological departments which use highly advanced sensors, weather and direction of wind measuring devices. The exact rainfall during the crop production season was accurately measured using the rain gauge devices situated at the geographical location of the study. The impact of the weather parameters were accurately analyzed in this study. The main objective of this study is to increase the performance of Artificial Neural Network by optimizing the input parameters feed to the input layers, reducing the computational time, increasing the accuracy of the results and to identify the factors responsible for improving the yield of paddy.
Amaratunga et al. [8] used ANN to predict the relationship between climatic variables and the yield of paddy in Sri Lanka. They improved the performance of the ANN using three algorithms namely Lenenberq-Marquardt, Bayesian Regularization, and Scaled Conjugated Gradient Algorithm. The author proves that the NN trained using the Levenberq-Marquert method predicts the yield of paddy more accurately than the remaining algorithms while measuring the performance using correlation coefficient and mean squared error method. Wang et al. [9] designed a crop yield prediction model for crops such as paddy, cholam, cumbu, ragi, maize, redgram, and chilies. The author collects data from various districts of Tamilnadu from 2000–2006 and first, they used k-means clustering algorithm and partitioned the dataset into four clusters. Frequent pattern mining is algorithm is implemented on each cluster and association rules were generated for support 0.3 and confidence 0.7. Accuracy of each generated rule was measured.
Ekanayake et al. [10] designed a machine learning model that predicts the impact in paddy cultivation. The author studies the correlation of parameters such as maximum and minimum temperature, humidity, and wind speed using regression techniques such as power, multiple, stepwise forward selection, and stepwise backward elimination methods. The authors then used random forest classifier to identify the cropping patterns and measured the performance using performance metrics. Verma et al. [11] proposed a stack based ensemble model to predict conjunctivitis disease using time series dataset. The author collects 8 years of data from the Health Department of Hong Kong. The dataset contains details related to a disease that causes a dint of inflation in the eye blood vessels. The author uses NN to train the conjunctive dataset and forecast the disease.
Mustafa Hilal et al. [12] proposed an optimal functional based NN that was implemented on financial data and predict the reason for financial crisis. The author uses Cat Swarm Optimization algorithm to select the most significant attributes for the polish dataset. NN was then implemented on the selected attributes and financial crisis is easily identified. Elsoragaby et al. [13] use Multi Objective Genetic Algorithm to measure the energy resources consumed by the rice crop in wetland cultivation. The authors conducted real time study in 62 farms and identified the various factors to minimize the emission of greenhouse gases. The authors suggest minimizing the use of chemical pesticides and fuel consumption and recommend maximizing the use of human resources and wetland paddy cultivation to improve the yield.
Arif et al. [14] used GA to study the soil moisture content in paddy cultivation done by dry, flooded, and moderate irrigation procedures. The study finds that the moderate irrigation method gives high yield when compared to the remaining two irrigation methods. The emission of greenhouse gases is high in dry and flood irrigation methods. However, the moderate irrigation method is ecofriendly which produces lowest greenhouse emitting gases such as N2O, CH4. Ayan et al. [15] used GA as the feature selection method and construct convolutional neural network (CNN) to classify 40 types of pests that attack paddy crops. The author used 7 types of CNN Architecture (VGG-16, VGG-19, etc) and measure the performance of the CNN in classifying the pest images. The author finds that Inception-V3 architecture performs best with an accuracy of 18.81 while compared to the rest of the architecture used.
GAs are heuristic algorithms that work as same as the working of a chromosome in human cells. It was developed by John Holland in 1960 which follows the principle of natural selection where the species which is capable of adapting to the changing environment can only survive. The chromosomes are the building blocks of the GA which are represented as a binary string. Several chromosomes collectively form a population where it contains collection of coded binary strings. At the initial stage, all the input variables are taken as a population and a fitness function is applied to the input variables and the scores of all the input variables are noted [16]. A selection process like Roulette Wheel, Tournament, and Rank Based selection methods was used to select the best variable as a parent variable and allowed to mutate to transfer their chromosomes to produce a child variable. The new population generated by the mutation of the parent variable is then used as a new population and new parents were chosen from the generated population and are allowed to mutate to form another group of population [17,18]. This process continues until an optimum solution based on the probabilistic value is reached for the given problem is obtained. This research uses Roulette Wheel selection method to select the best variable as the cross over variable. Let f1, f2, f3… be the fitness value generated by individual chromosomes in the selected population. Then the probability of a variable to be selected in the wheel area having high fitness value is given by the following Eq.
Let c1, c2 be a child variable in the population belonging to the parent p1 and p2 respectively. Let the gene present in the chromosome of the input variable be denoted by gi, x is a cross over factor, then the cross over function used to mutate and reproduce a child by the two parent chromosomes is given by the following Eq.
The transmission of parents from one population to another generation is calculated by the mutation probability and it is calculated by the following Eq.
Particle Swarm Optimization Algorithm works on the principle of birds following a technique to find the food. Birds use a technique called flocking to find the food near to them by following a bird that is close to the bird [19]. If a bird flies to find food it changes its position using flying with a suitable velocity. It also gives feedback to his group about the way to reach the food very quickly. The other birds in the group follow the signal given by the previous bird and update their food searching method [20]. This same principle is applied in this PSO algorithm to select the best variable from the input list. This method assumes each input variable as a particle and each particle has a fitness value calculated using an objective function. The velocity of the input variable is modified by the best fitness value and the process continues until the optimum variable is identified from the given variable list. The velocity of the input variables is updated using the following.
Here the ωVi denotes the inertia effect,
ANN work in the same principle of a human brain. The information is transferred in human cells using neurons which are the building blocks of the human brain. The neuron sends the information to its neighbor neuron and that neuron passes the information to the next neuron and the information finally reaches the brain. This principle is used in this ANN algorithm where the input variables are given as input to neurons present in the input layer of the ANN. The weights for each input variable are multiplied with the activation function and the computed values are forwarded to the hidden layer present in the ANN. The hidden layer receives the output of the input layer and computes weights for each neuron and the information is forwarded to the output layer. If the desired output is not reached, the weight, bias, and epoch value are adjusted and the information is sent back to the input layer and the process continues until the desired output is reached. The transfer function used to forward the input variable to the hidden layer is calculated using the following.
The weights of each variable in the hidden layer are calculated using the following Eq. (8):
The error value for each input variable is calculated using the following Eq. (9):
The bias for each input variable present in the input layer is calculated using the following Eq. (10):
The weight and bias in the output layer are adjusted and fed back to the input layer of the ANN using the following Eq. (11):
The Softmax function used to predict the target class having multiple values such as C43, Delux Ponni, and Ponmani is calculated using
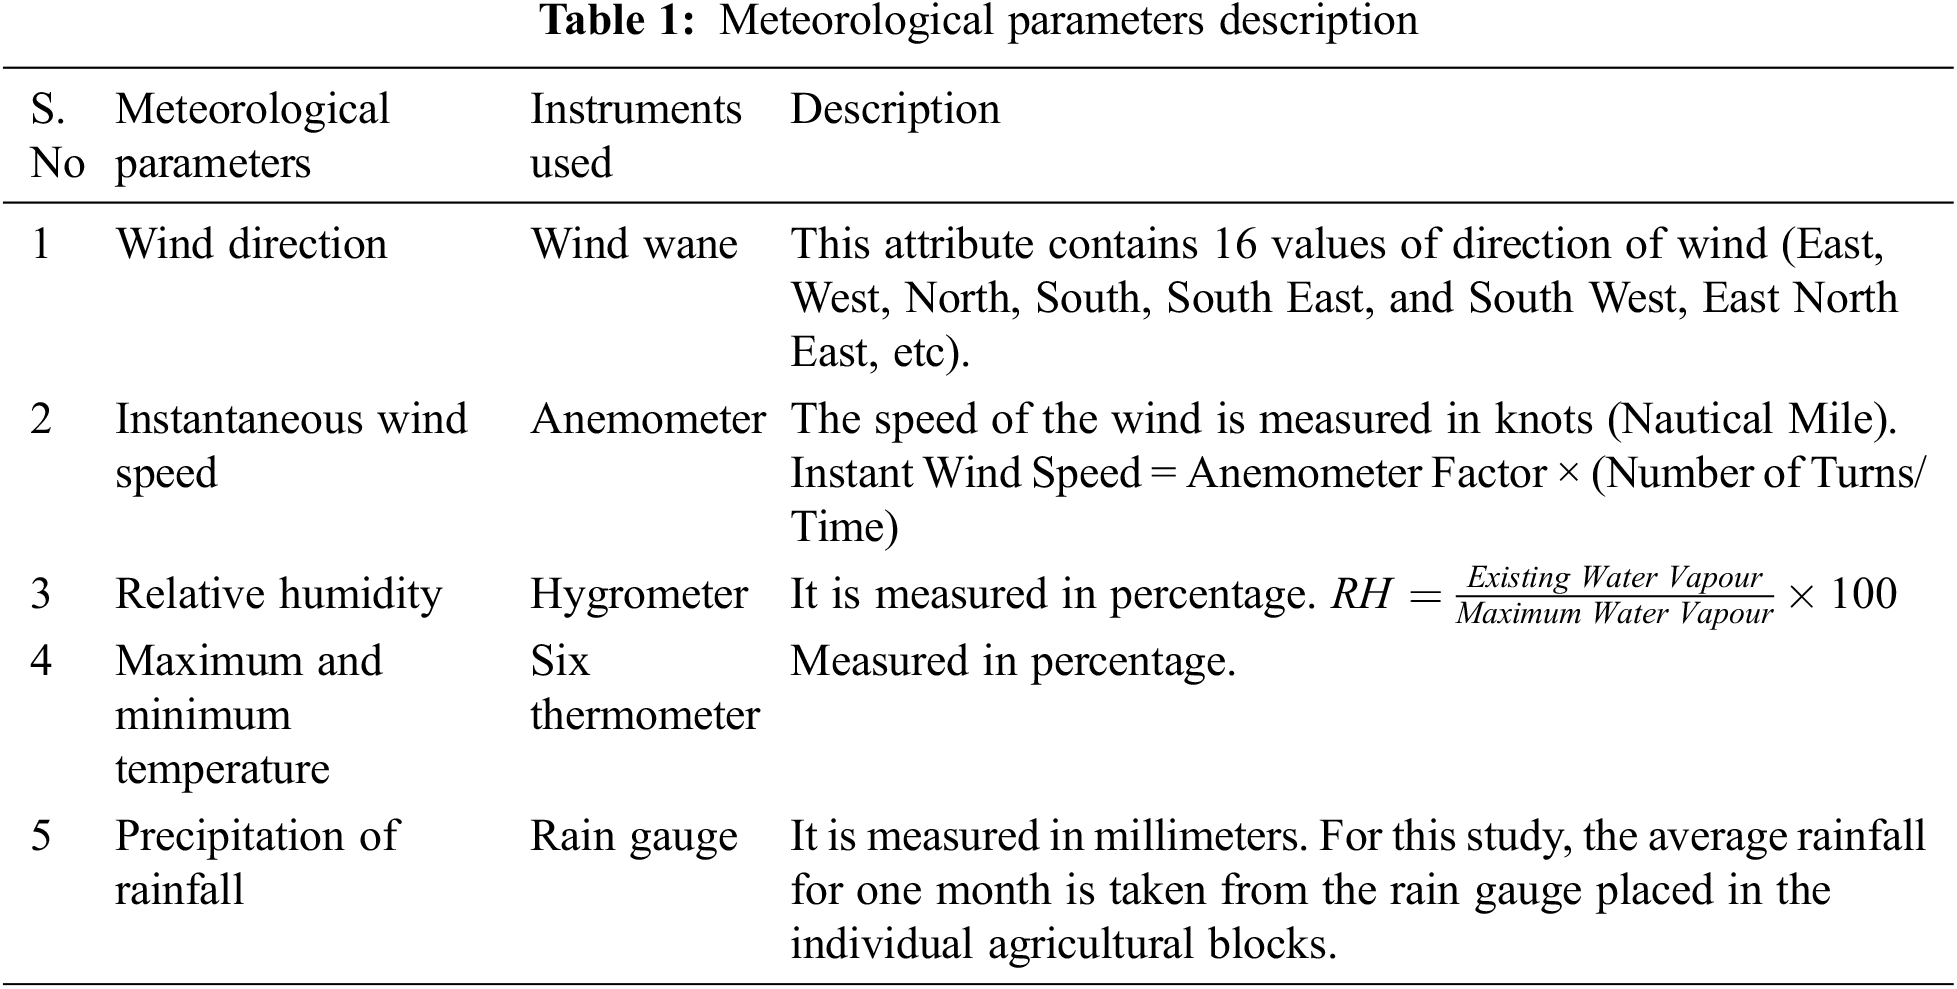
The data needed for this study is collected from the Cuddalore, and Kallakurichi districts of Tamilnadu situated in India. Totally 2789 farmers’ details were collected from the agricultural blocks Kallakurichi, Sangarapuram, Chinna Salem, Panruti, Kurinjipadi, and Cuddalore. The period of paddy cultivation took place in the season Late Thaladi from September 15 to January 30 in 2018. The dataset contains a totally of 45 attributes namely Land Preparation done with manure in tones, Hectares of land in which paddy is cultivated, variety of paddy (CO_43, delux_ponni, ponmani) used in cultivation, types of soil (alluvial and clay) in which the farmer cultivate the paddy, types of nursery management practiced by farmers (Dry nursery and Wet nursery), fertilizers used for improving the fertility of the soil, various pest control measures taken by the farmers were recorded by personal interview of the farmers. The meteorological parameters such as Monthly Rainfall, Maximum and Minimum Temperature of a month, Relative Humidity, Instant Wind Speed, Direction of Wind were taken from the dataset collected from Regional Meteorological Centre situated in Chennai. The meteorological parameters were calculated monthly-wise from the day of sowing until the period of harvest and the instruments used for recording the value was given below in Tab. 1.
The framework used to select the optimum input parameters from the collected paddy dataset is given below in Fig. 1.
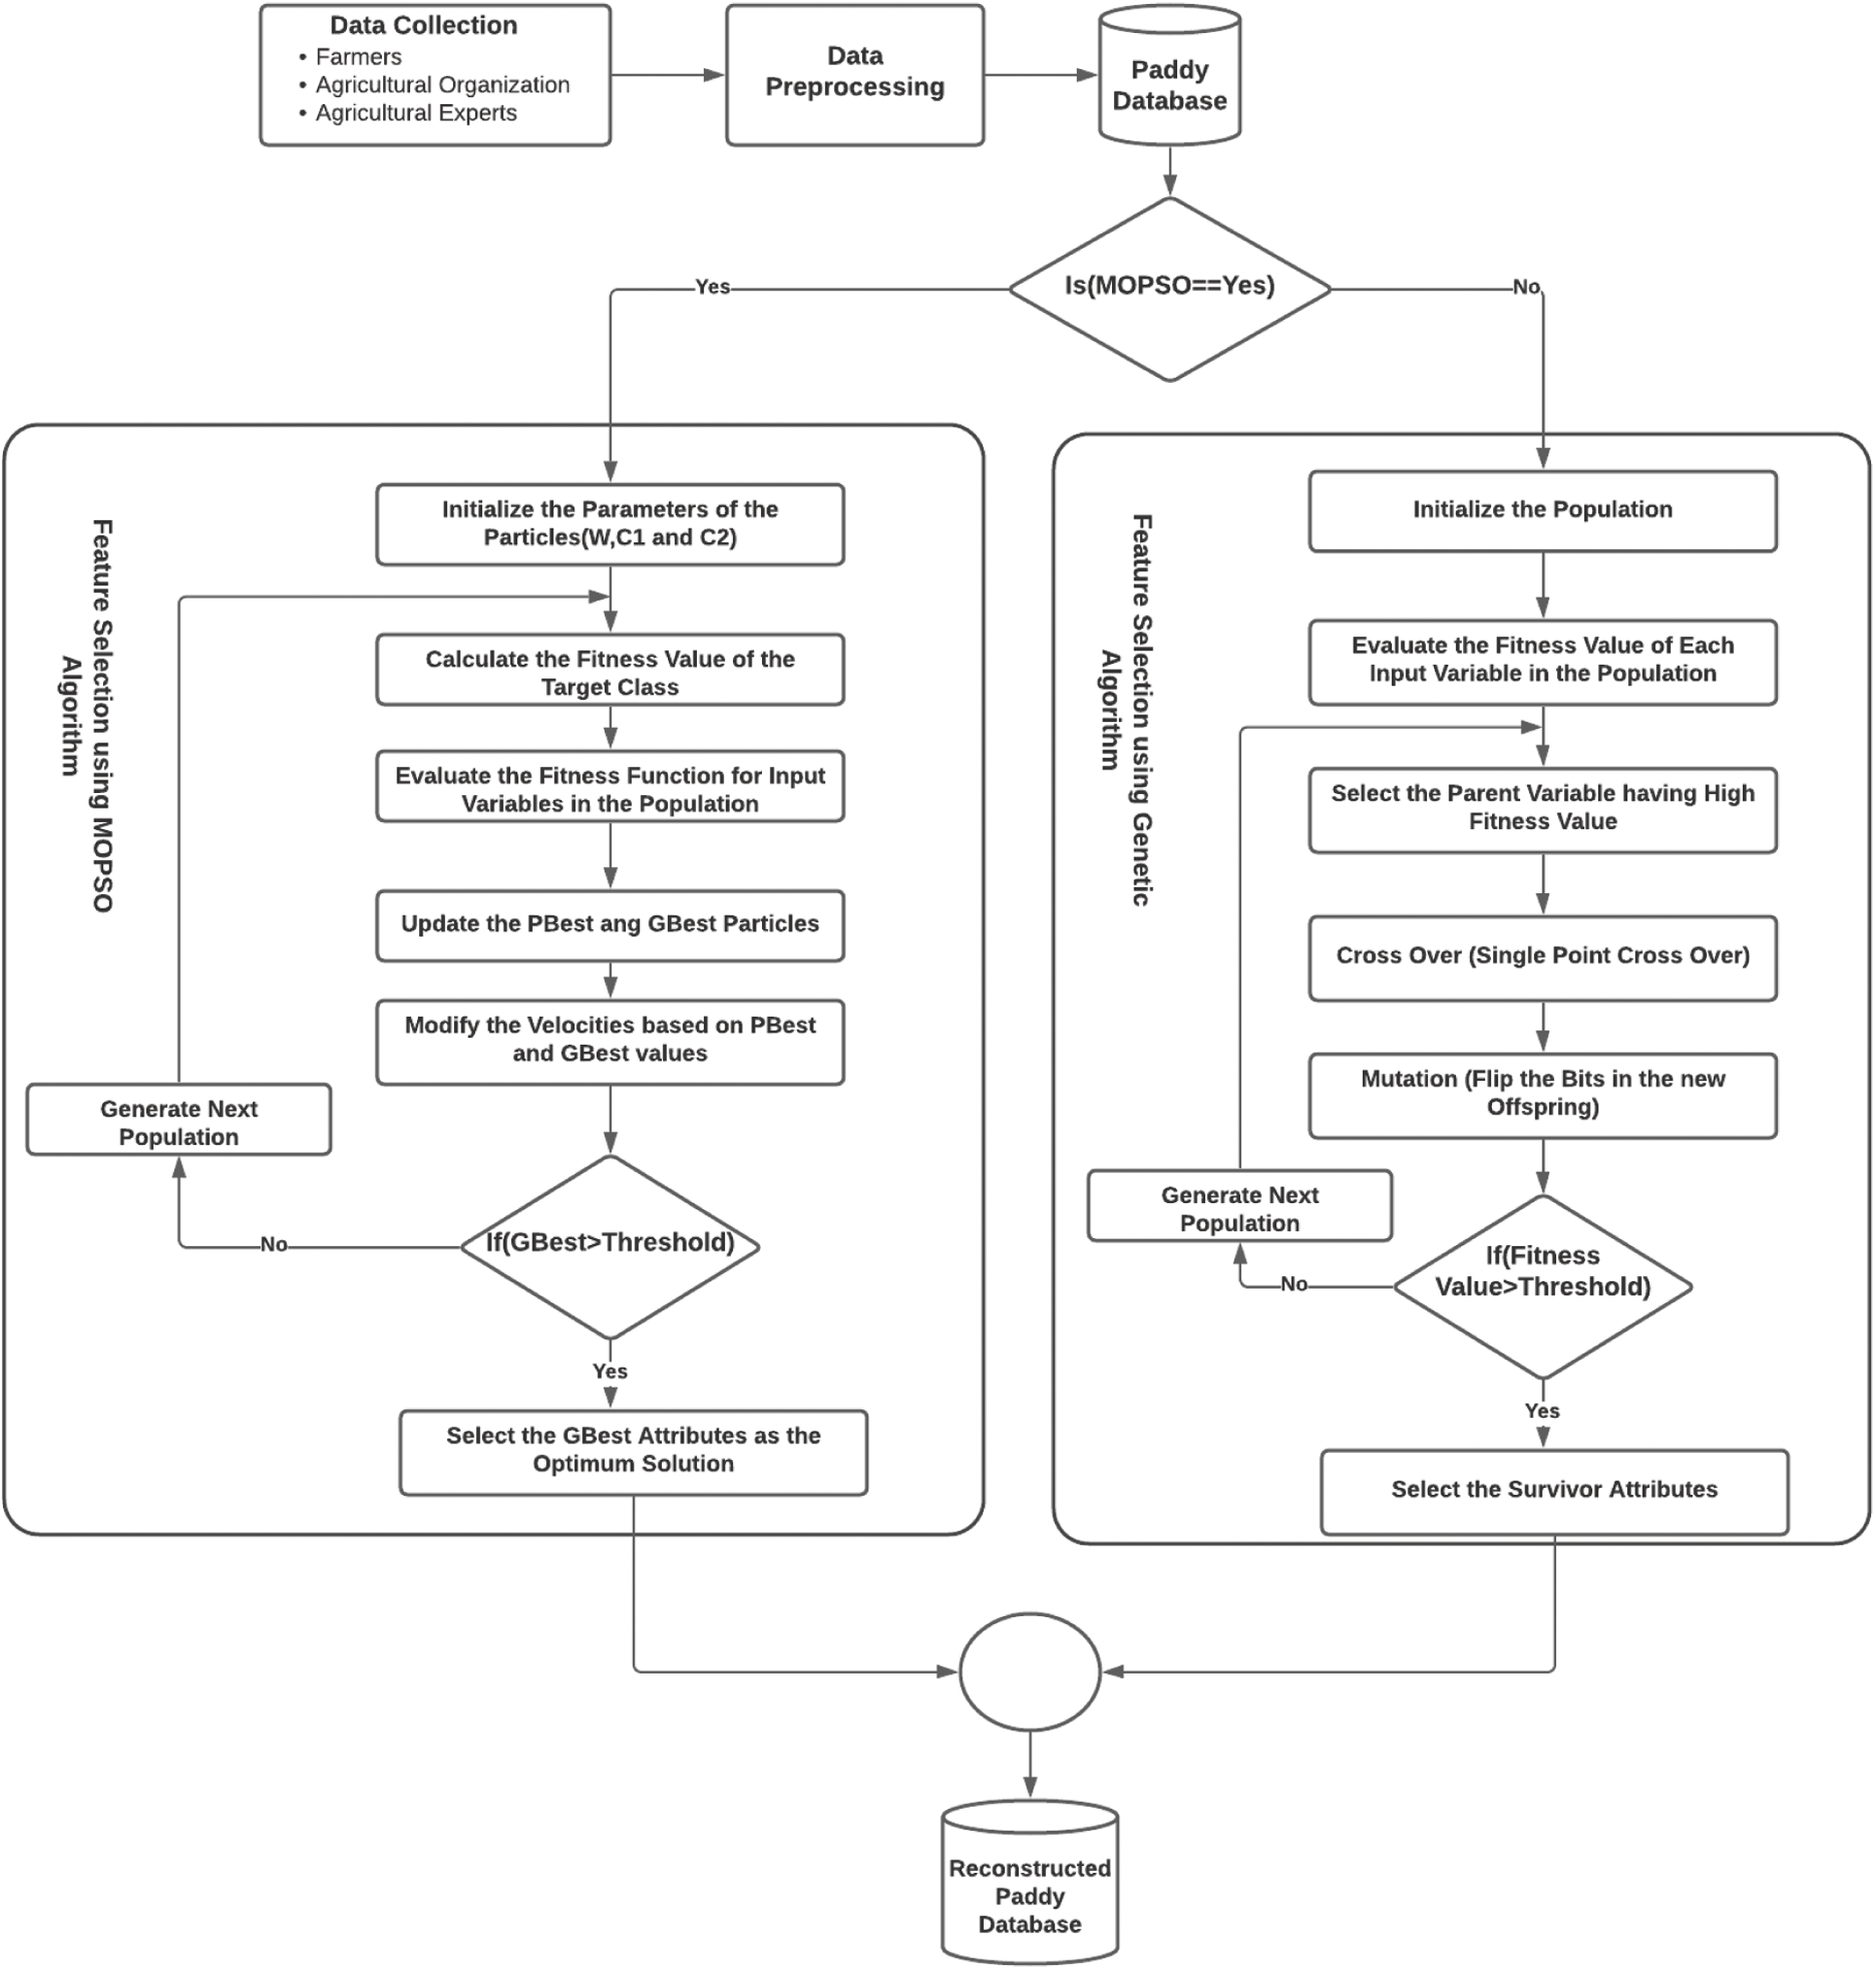
Figure 1: Proposed framework for optimizing the input parameters using genetic algorithm, MOPSO algorithm
This proposed framework has two module first is the input optimization module which used two optimization algorithms namely Genetic Algorithm and Multi Objective Particle Swarm Optimization Algorithm to select the most influencing attributes in the paddy dataset. If the user selects the Feature Selection Technique as Genetic Algorithm then the algorithm will initialize the number of population in the dataset and fitness value is calculated for each input variable. The variable having highest fitness value is chosen as the parent and allowed to reproduce to produce the children. The population from the children is created and same process is continued until the best input variables are chosen. The database is reconstructed using the survival children variable and the dimensionality of the paddy dataset is reduced with the Genetic Algorithm.
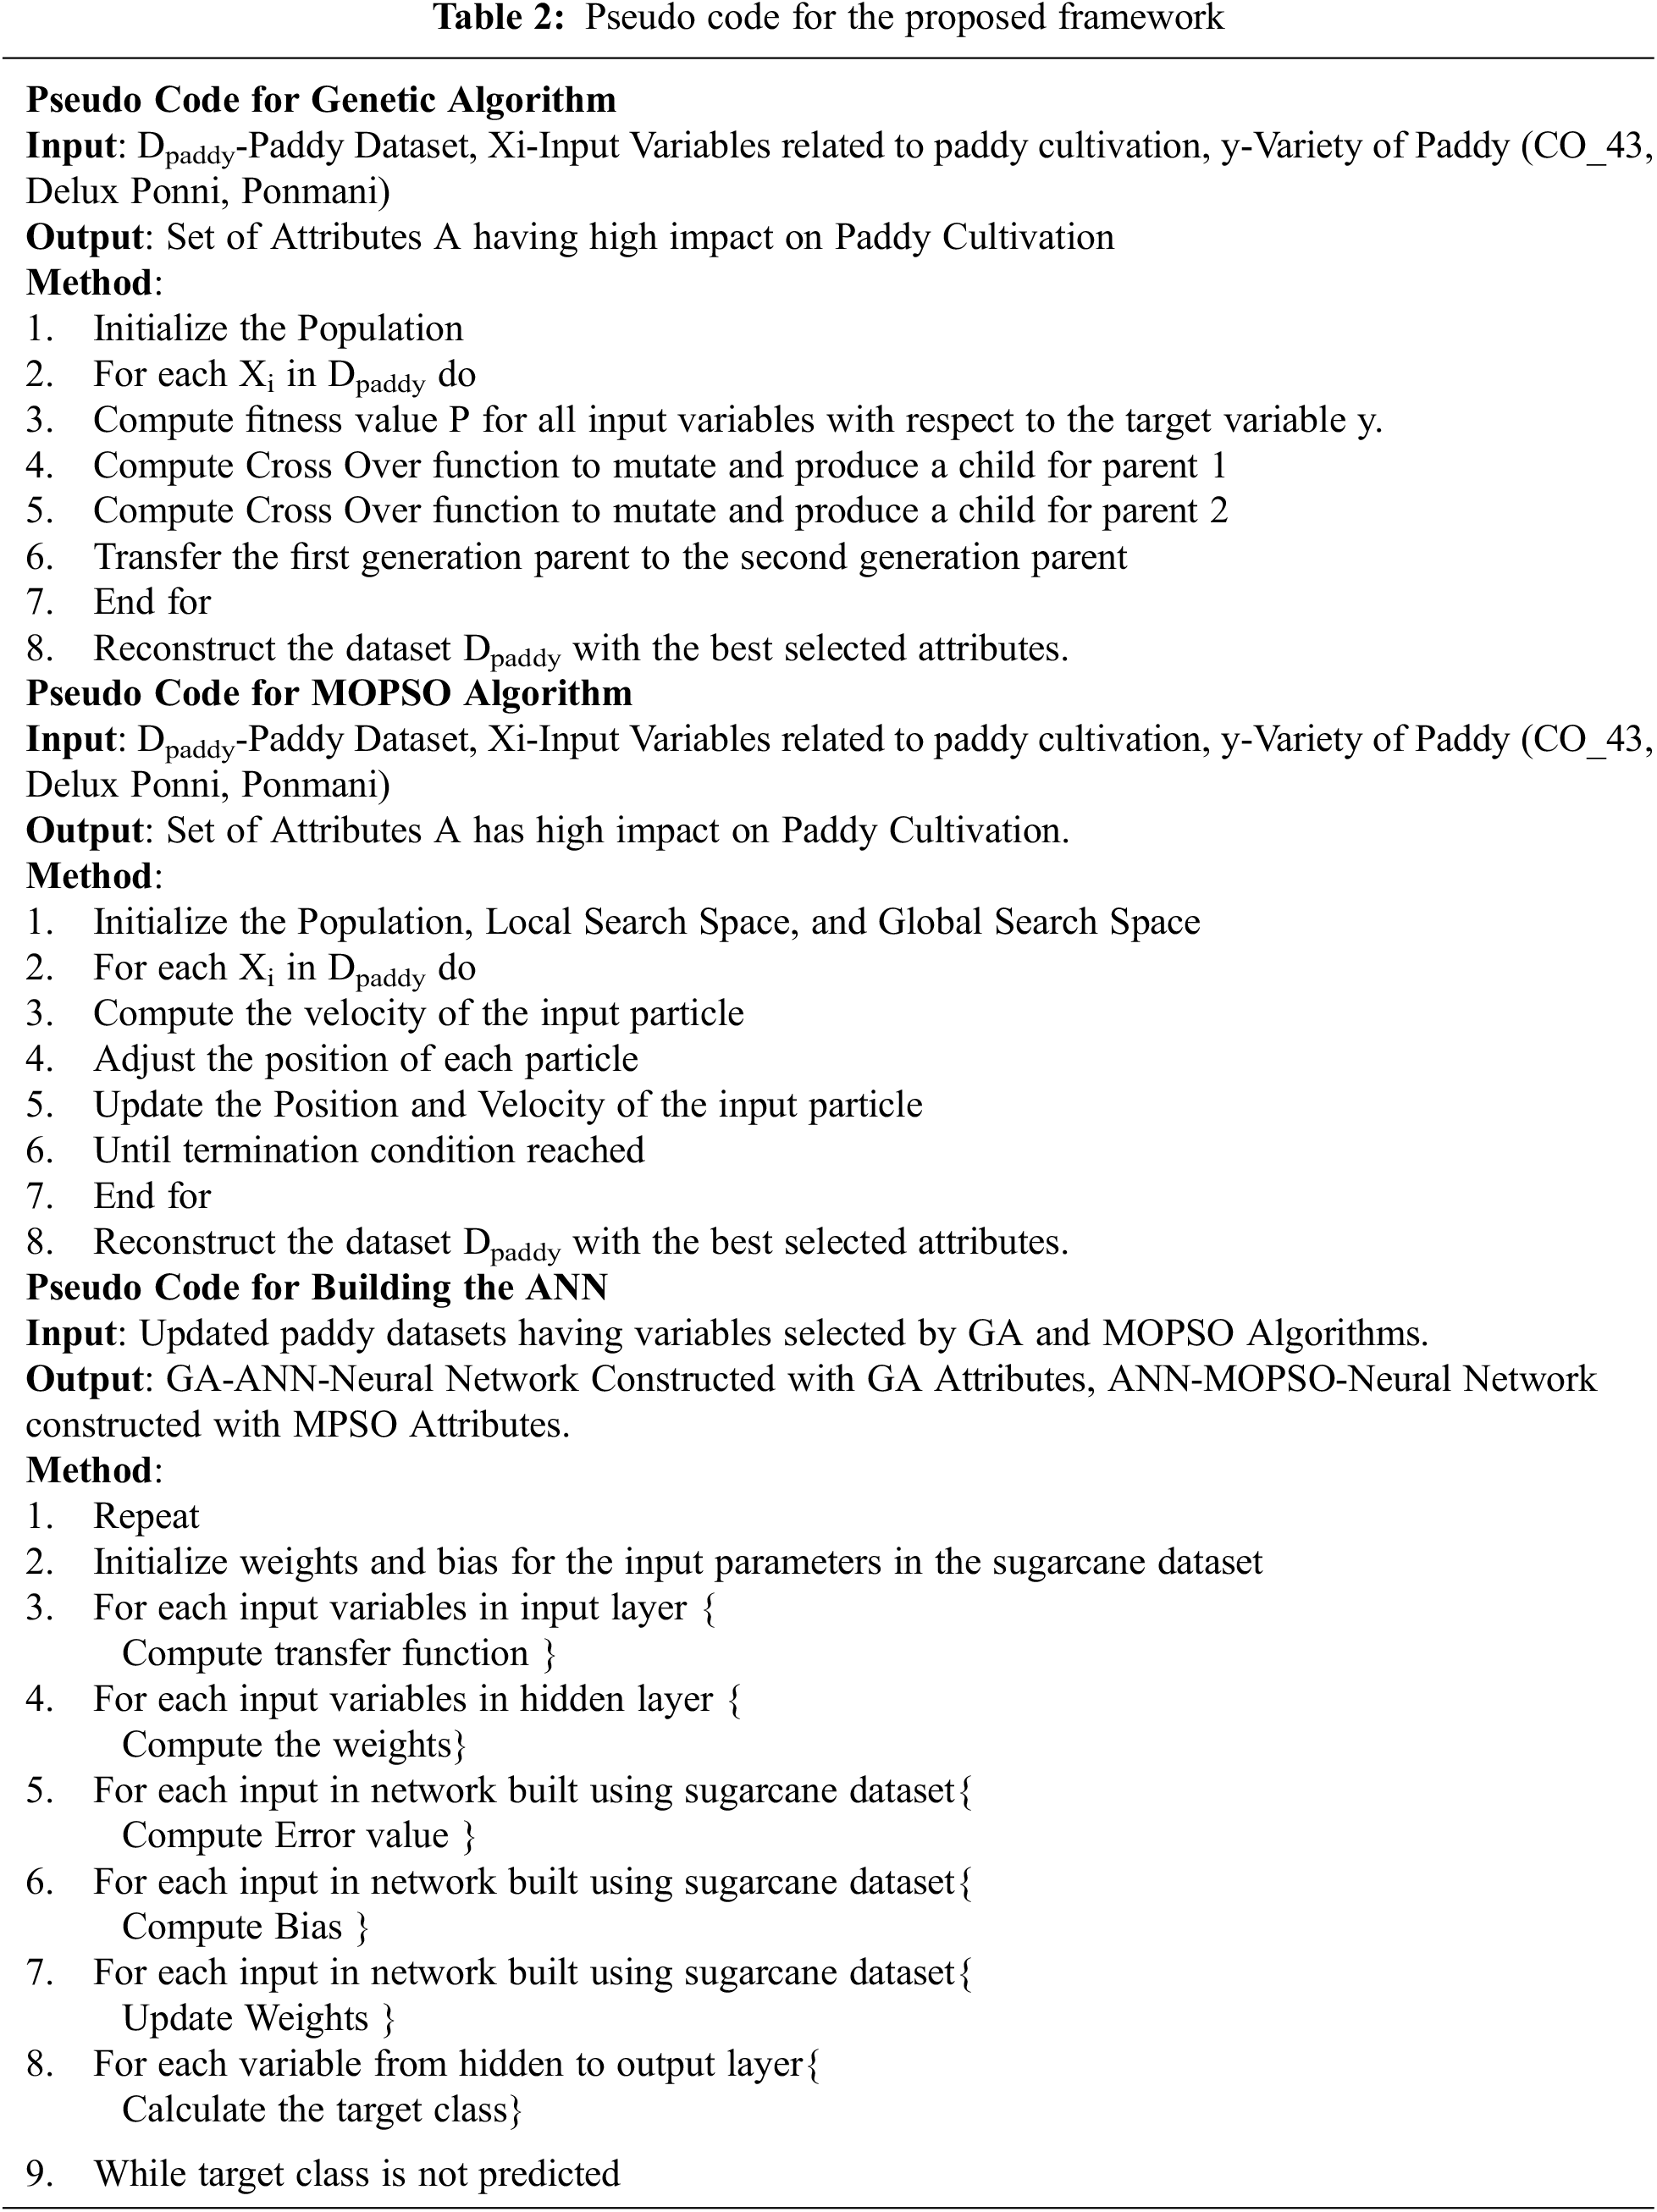
If the user wants to select the Feature Selection technique as Multi Objective Particle Swarm Optimization technique to identify the influencing parameters from the paddy dataset. Then the MOPSO first initialize input particles from the dataset and calculate the fitness value with respect to the target variable. The position and velocity of the input particle is updated with the help of the calculated fitness value. This process continues until the best optimum particle is selected as the final output. The second module in the proposed ROANN algorithm is the construction of the Artificial Neural Network using the reduced dataset and identifying the highly influencing attributes for improving the paddy yield. The number of inputs in the hidden layer, bias and number of epochs were initialized firstly. Since the output attributes contains three value namely CO-43, Delux Ponni and Ponmani softmax function is used by the output layer as the activation function. The proposed ROANN used categorical cross entropy to compile the model. The architecture of the proposed ROANN for constructing the neural network was given in Fig. 2. The Pseudo Code for the proposed framework for COVID-19 disease prediction using ANN is given below in Tab. 2.
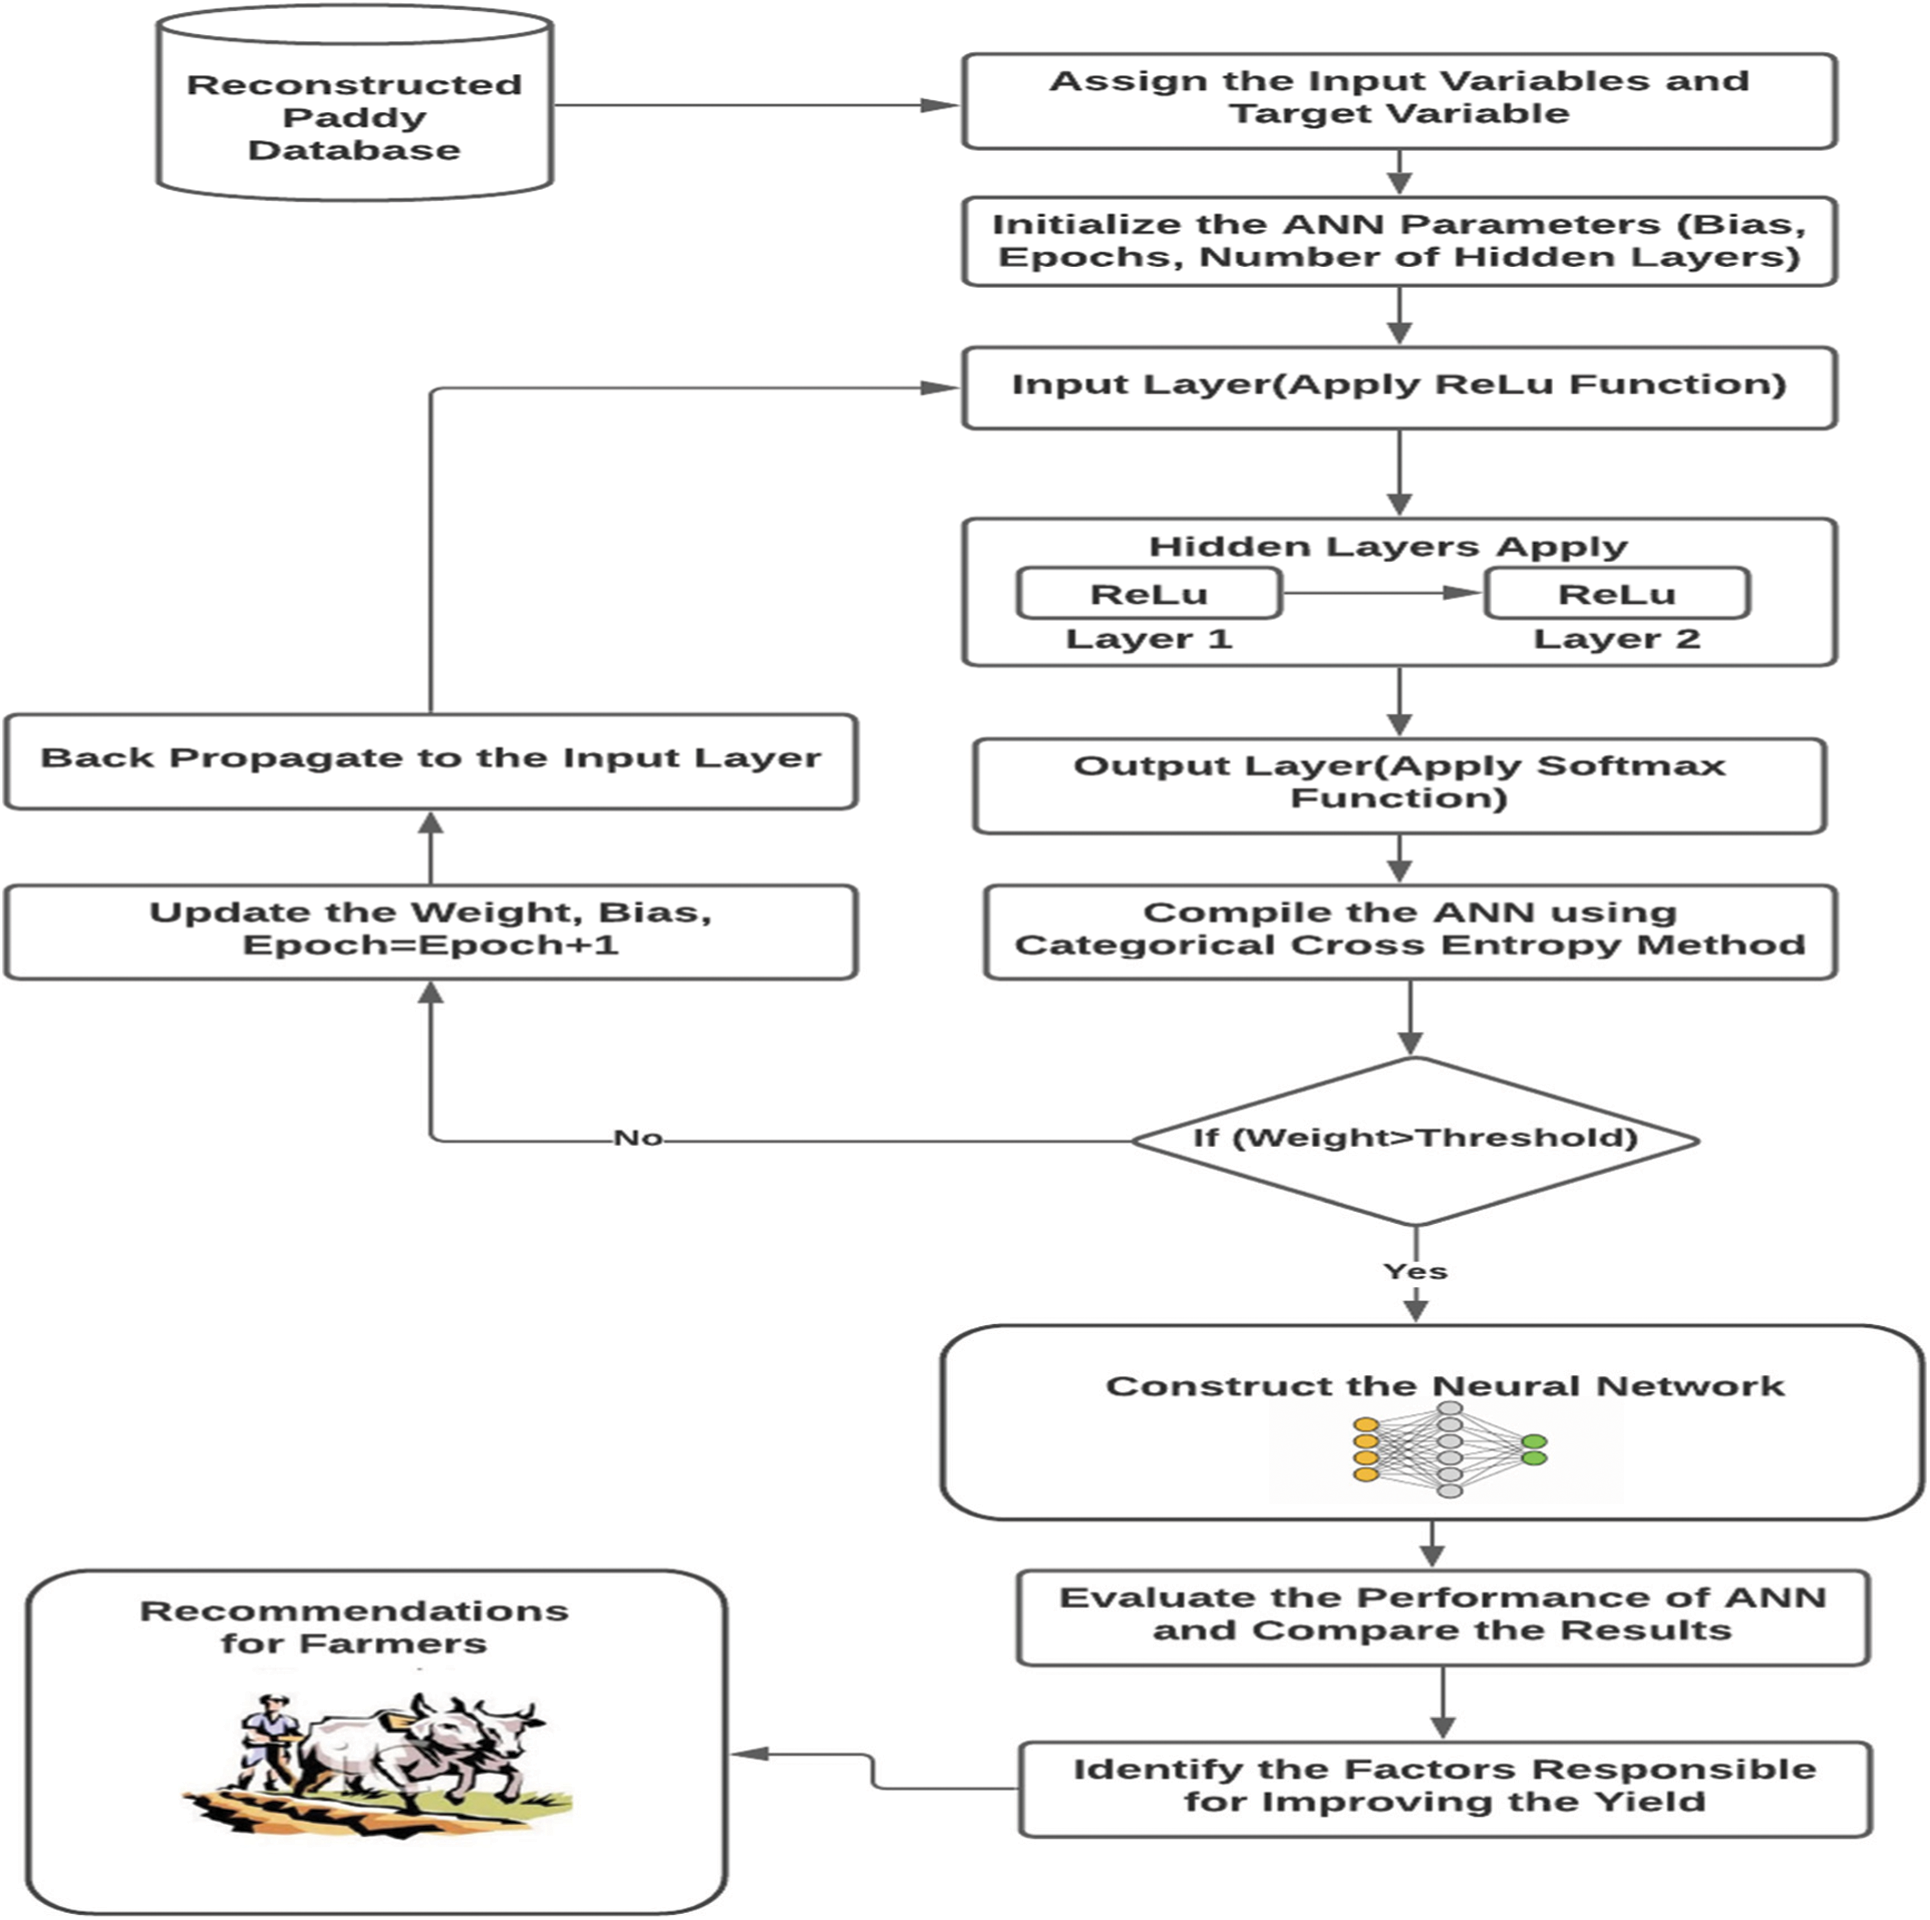
Figure 2: Proposed framework for robust optimized artificial neural network (ROANN) algorithm
5.1 Results of Optimization Using Genetic Algorithm
The GA was implemented in Python 3.8 with Anaconda Navigator as the IDE and Spyder as code editor. The GA was implemented with the help of genetic_selection library. The GeneticSelectionCV method is imported from the genetic_selection library. LinearRegression is used as the estimator and it was imported from sklearn.linear_model library. The population was set to 300 and 40 new generations were created for the whole process. Maximum features used to select from the dataset were set as 10, crossover probability was set as 0.5, mutation probability was set to 0.2. Accuracy is used as the fitness function to calculate the fitness value, crossover independent probability, and the mutation independent probability was set as 0.05 respectively. The process uses 10 fold cross validation on the training data to obtain the maximum accuracy. The optimum input variables selected by the GA are given below in Fig. 3.
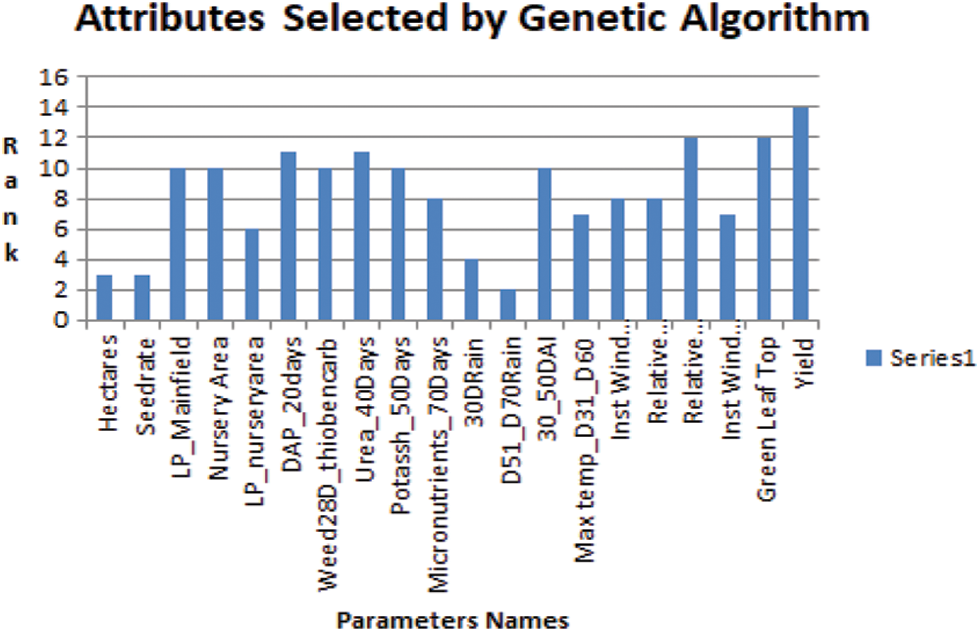
Figure 3: Input variables selected by genetic algorithm
5.2 Results of Optimization Using MOPSO Algorithm
The MOPSO algorithm is implemented in Scratch using Python 3.8. The fitness value for each input particle, Crowding_distance for each input particle, and the Cost used to travel from one particle to another particle were calculated using the user defined function.
A class named Space is defined and in it, there were user defined functions for calculating the PBest, GBest values. The parent selection and mutation were also implemented by the user defined function. The search space of the global population used to select the parent particle, space used for mutation, space used for cross over for each population is given in Fig. 4. The best particles selected as the final output for MOPSO algorithm is each population is given below in Fig. 5.
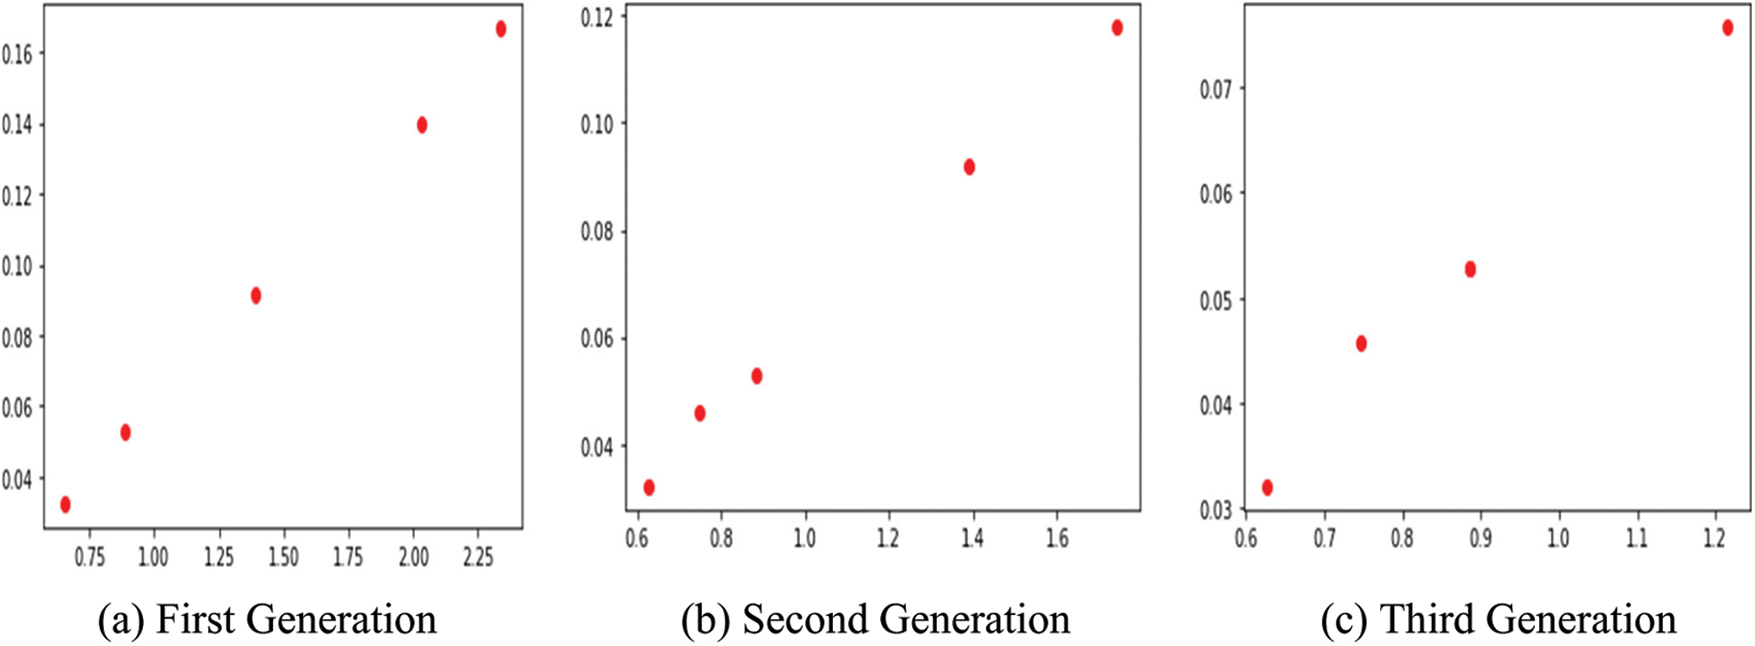
Figure 4: GBest particles in search space for different iterations
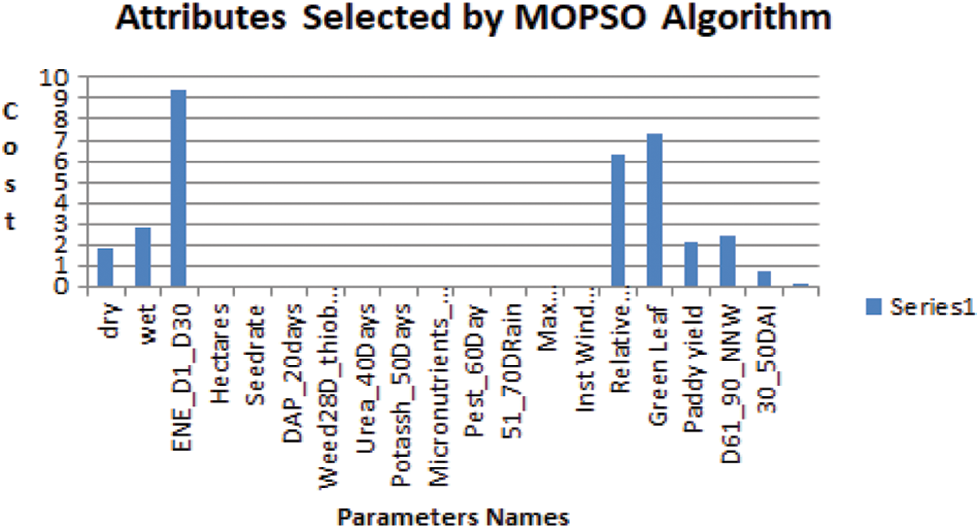
Figure 5: Input variables selected by MOPSO algorithm
The neural network was constructed using Tensorflow 2.3.0 version and Keras library present in Python 3.8 version. The Neural Network was constructed using two hidden layers. The dataset is partitioned into 80:20 for training and testing phase. The parameters used by the Back Propagation algorithm were the number of neurons in the input layer is set to 60, the input layer also has 20 variables as input and relu is used as an activation function. For hidden layer the number of input neurons is set to 15, relu is used as an activation function and number of hidden layer is set to 2. The three variety of paddy namely CO-43, Delux Ponni and Ponmani were given as target variable to the output layer and softmax function is used as an activation function. The model is compiled with learning rate 0.01, Categorical CrossEntropy is used as a loss function and the performance of the Neural Network built is measured using accuracy. The number of records in the training set for constructing the neural network is 2231 and the number of records in the testing set for evaluating the performance of the neural network is 558. The neural network constructed with the proposed ROANN algorithm with the parameters of genetic algorithm was given in Fig. 6.
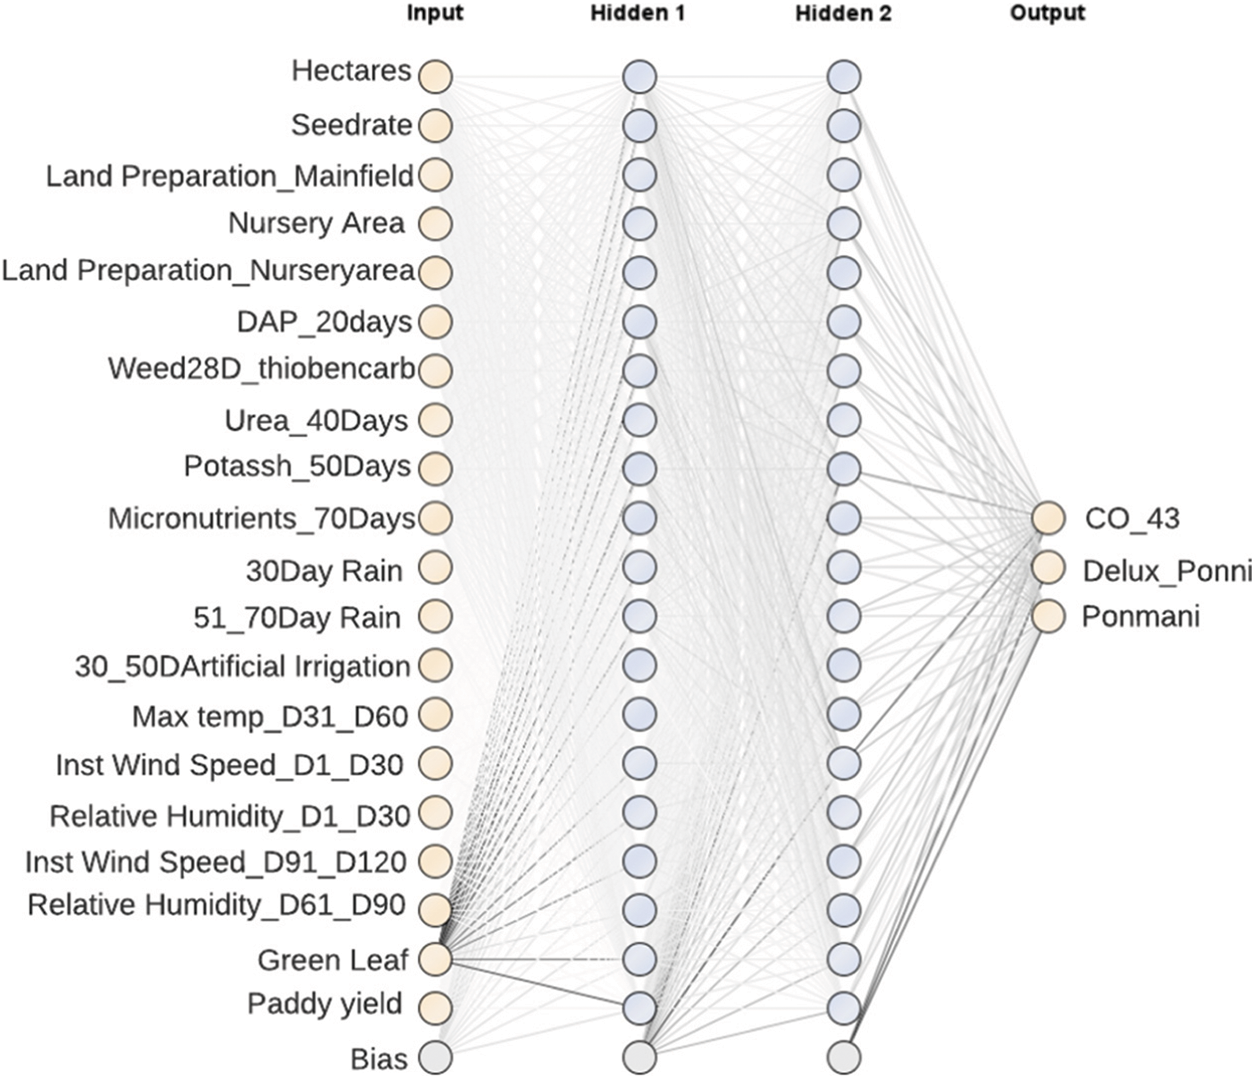
Figure 6: ANN constructed for genetic algorithm
The neural network constructed with the proposed ROANN algorithm with the parameters of MOPSO algorithm is given below in Fig. 7.
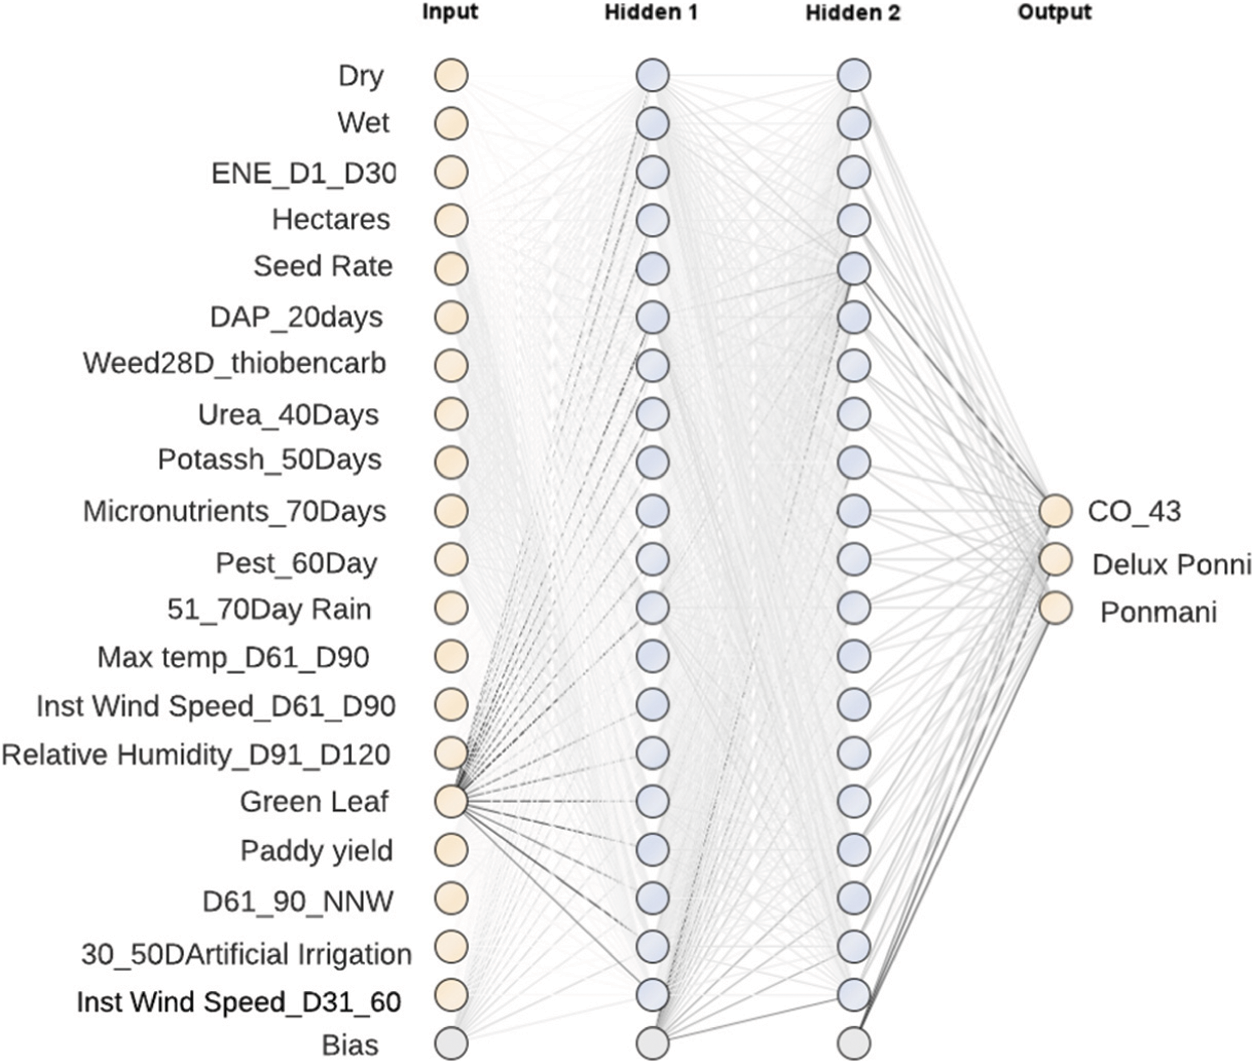
Figure 7: ANN constructed for MOPSO algorithm
The Target class predicted for each algorithm was given in the confusion matrix shown in Fig. 8.
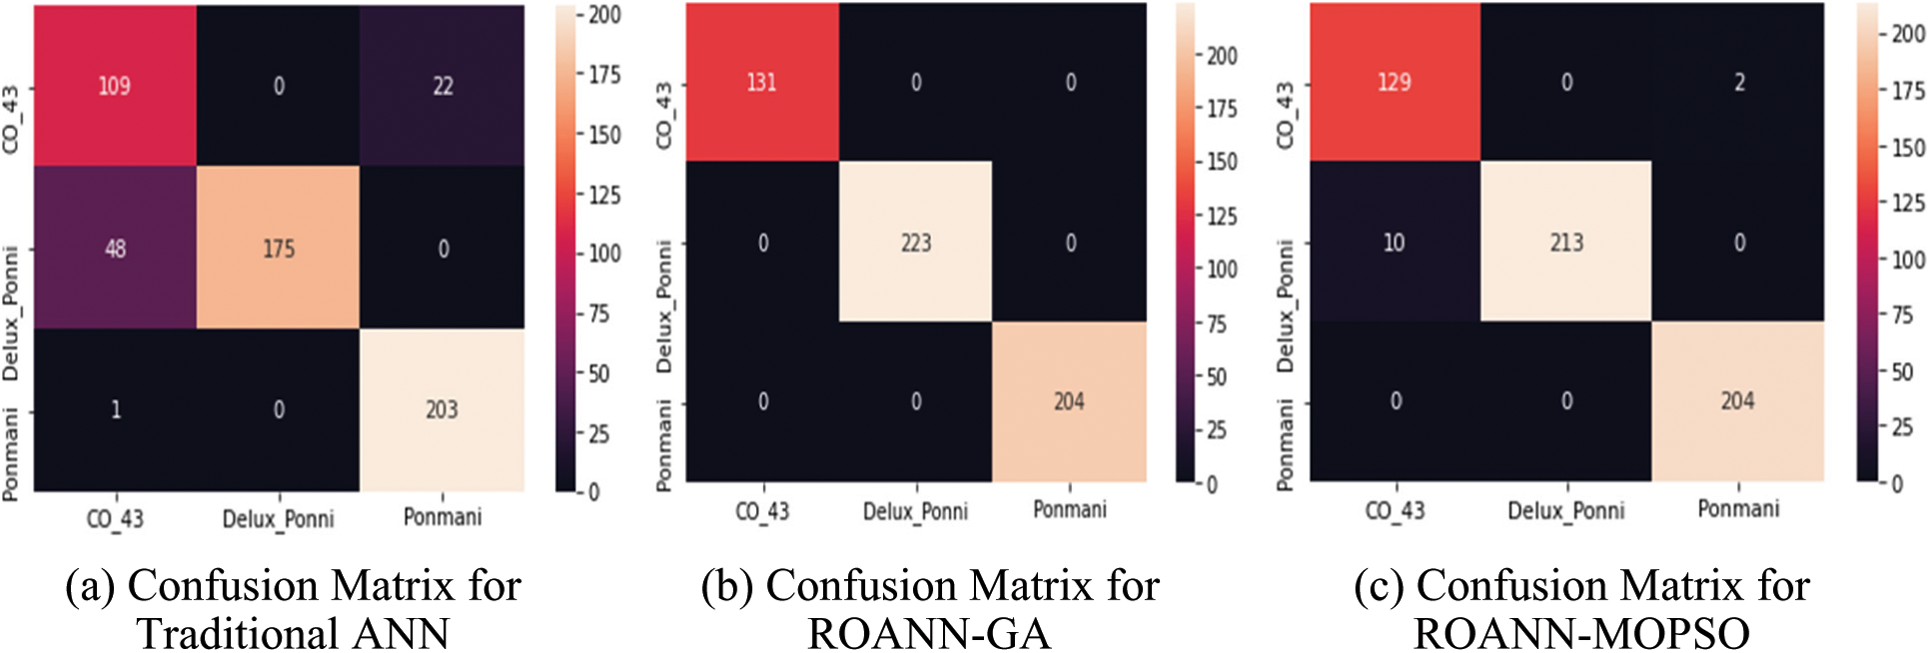
Figure 8: Confusion matrix for three constructed neural network
Performance of the Neural Network constructed using the Robust Optimized Artificial Neural Network Algorithm was measured using the performance metrics and it is given below in Tab. 3.
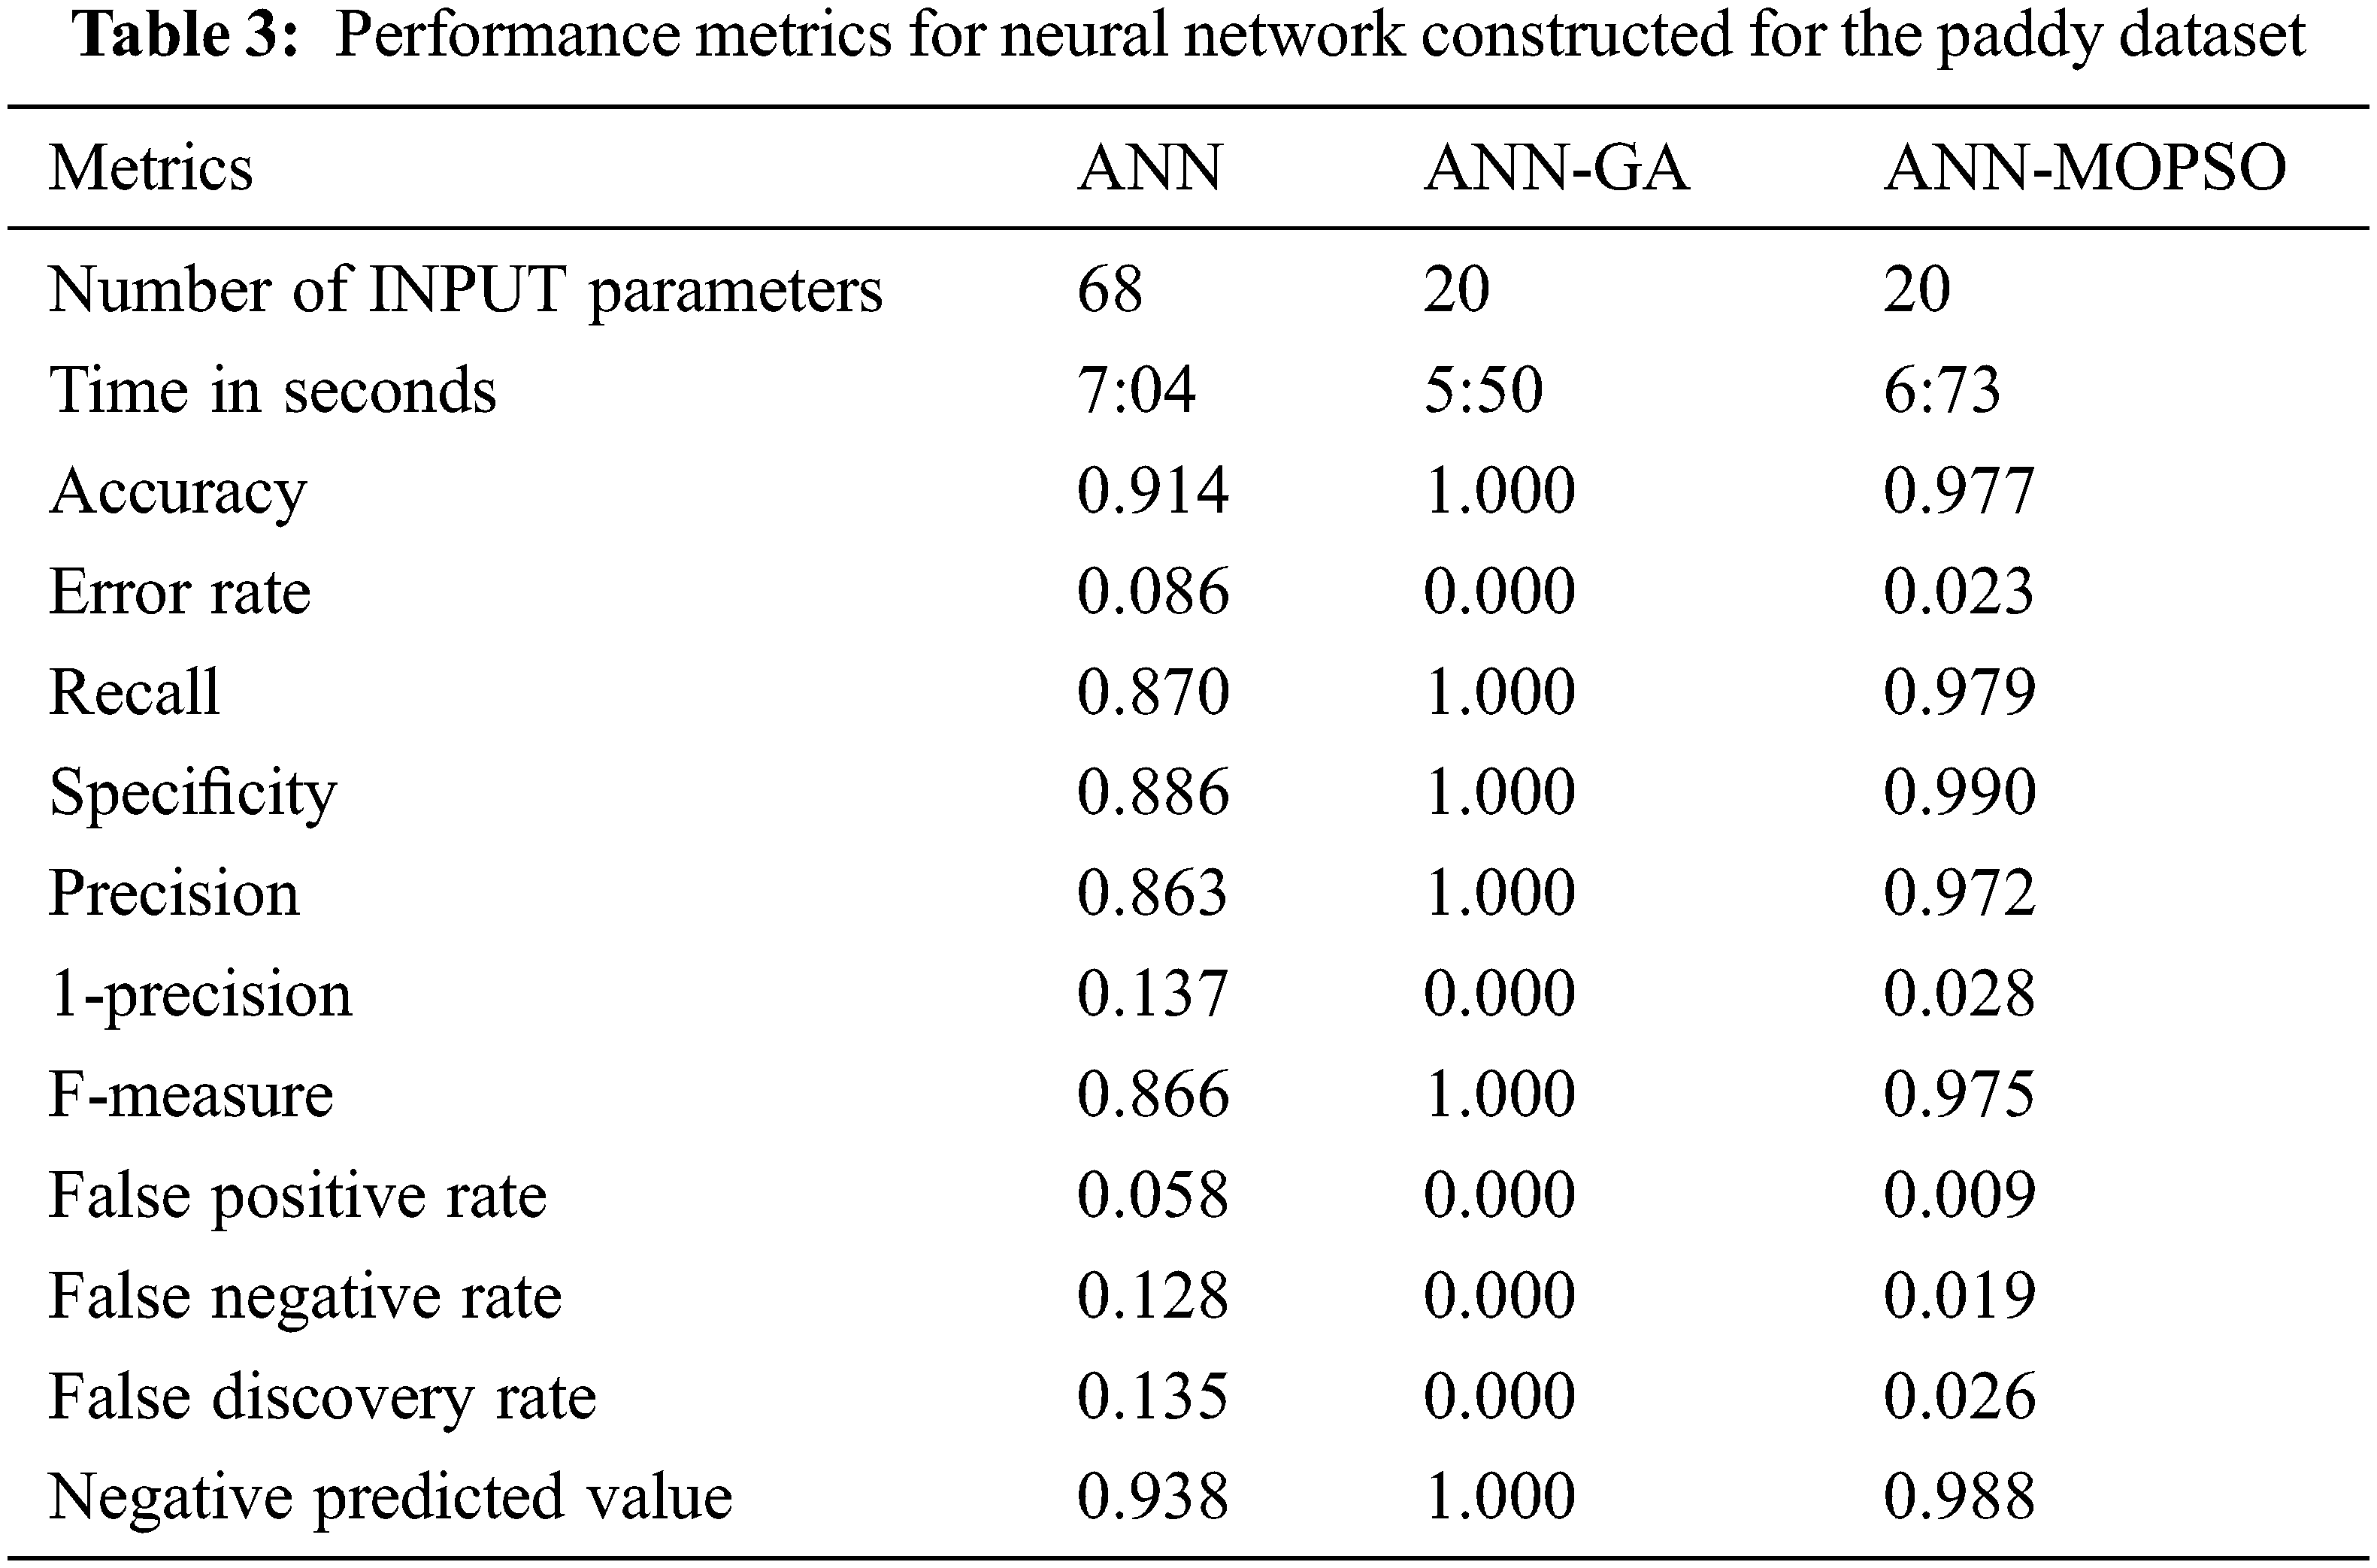
From the table, it is clear that the performance of the ANN was improved while optimizing the input parameters with the optimizing techniques. Among the two optimizing techniques used, the neural network constructed using genetic algorithm gives its best result with maximum of 100 percent accuracy. Next the MOPSO optimizing technique gives 97.7 percent accuracy when compared to the traditional neural network which gives only 91.4 percent accuracy for classifying the paddy dataset. The optimizing techniques also reduce the computation time used to construct the neural network for the paddy dataset. The genetic algorithm technique helps to construct the neural network faster when compared to the remaining methods. The novelty of the proposed ROANN was, it is designed to study the inner process of the neural network constructed. Since ANN is a combination of more logistic regression lines, the decision boundary of the paddy dataset is measured using the logistic regression technique. The input variable Hectares and Yield was selected as an influencing attributes by both GA and MOPSO techniques. Hence it is taken to identify the decision boundary of the ROANN. The decision boundary of the paddy dataset classified by the ROANN is given below in Fig. 9.
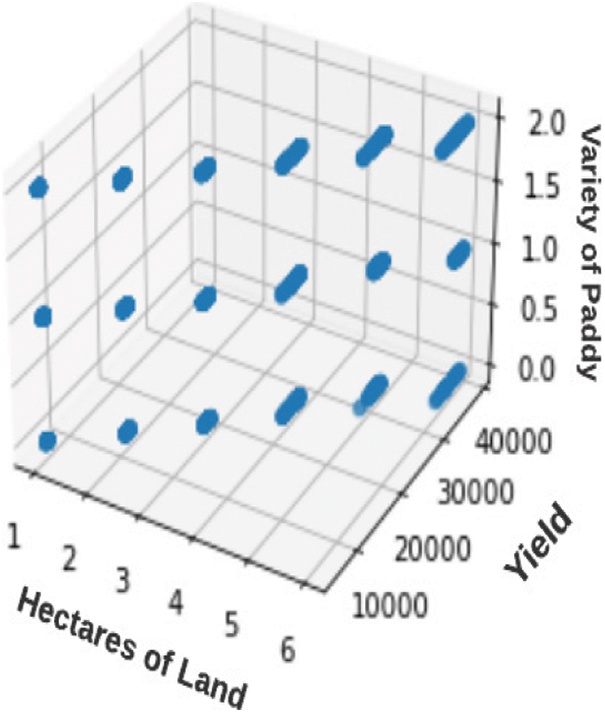
Figure 9: Decision boundary of ROANN
From Fig. 10, it is clear that the logistic regression line separates the hectares and paddy yield dataset linearly and the predicted values are linearly plotted across the regression line. The target class predicted by the ROANN is plotted by surface plot method shown in Fig. 11 and it is clear that the proposed algorithm correctly predicts all the target class since all the data points were correctly plotted at the center of the surface plot and the data points are converged upwards in the center.
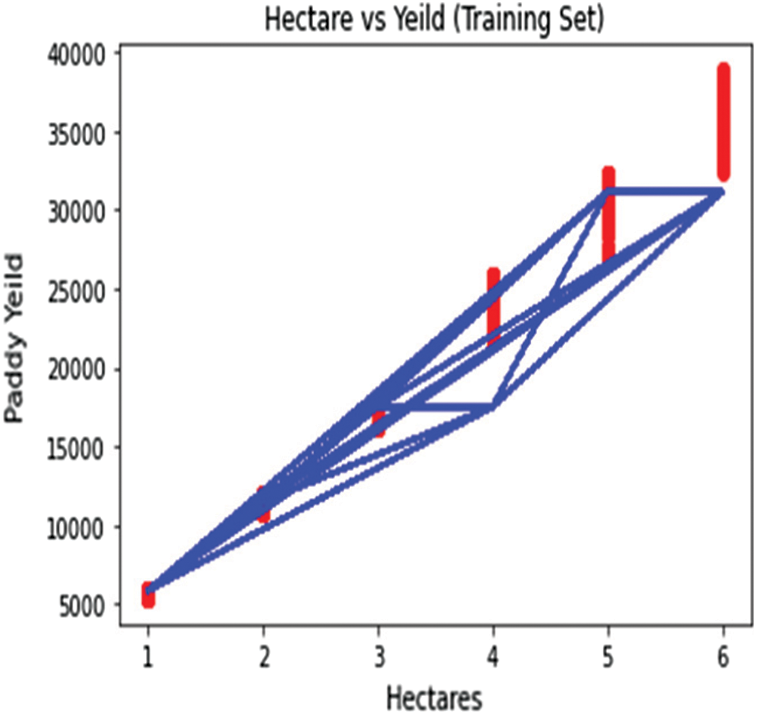
Figure 10: Logistic regression line used to plot the paddy dataset ROANN algorithm
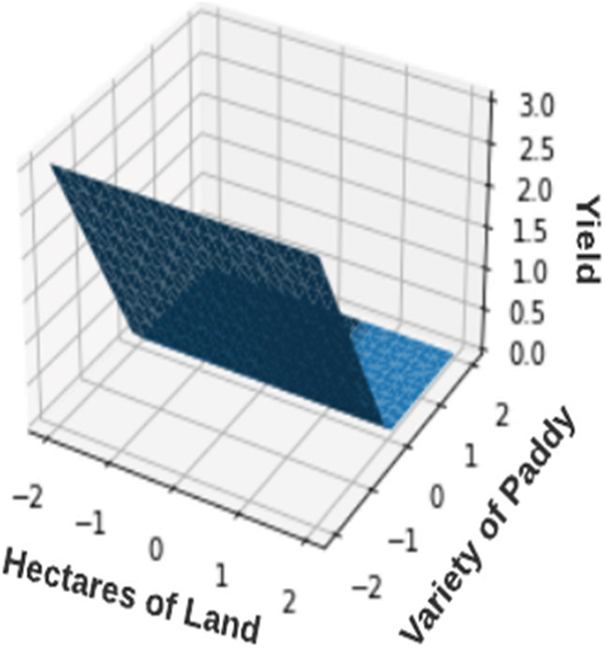
Figure 11: Surface plot of the target class predicted by ROANN
6 Recommendations for Paddy Cultivation
The results obtained from the three NNs are consolidated and the results show that the growth of paddy for all varieties is good when the Minimum temperature during 31 to 60 days is less than 17°C, and from 61 to 90 days the minimum temperature is within 15.25°C to 16°C. The maximum temperature should not be exceeding to 32°C. The paddy crop grows better when the Instant Wind Speed is less than 5 nautical miles per hour during 31 to 60 days. The direction of wind should be in East and North_East for 1 to 30 days and the direction of the wind is in West direction for 31 to 60 days then the paddy crop grows faster. The Land preparation is done with organic manure before the cultivation starts to play a vital role in the yield of paddy. The nutrition management such as application of DAP during the 20th day, application of Urea during the 40th day, and the application of Potash during the 50th day improves the yield of paddy. Green Leaf Top obtained after harvesting of the paddy also plays a vital role in paddy cultivation, since the Green Leaf Top is fed as cattle feed and thereby increasing the revenue for the paddy growers. Taking proper pest control measures during the 60th day controls the pest and thereby increases the paddy yield. If the amount of rainfall during the 51 to 70 days should not be less than 166 mm then all the variety of paddy gives good yield. It was proved that the Ponmani variety grows best in clay soil and delux_ponni grows best in alluvial soil. The CO_43 gives a moderate result in both clay and alluvial soil.
The proposed ROANN Algorithm efficiently predicts the factors to be concentrated by the paddy growers to improve the yield. The Optimization techniques used in this paper namely GA and MOPSO also correctly identify the input parameters from the given real time paddy dataset. The NN constructed using the two optimized datasets efficiently predicts the parameters responsible for improving the paddy cultivation. The proposed algorithm also correlates the various meteorological parameters that have impact on the yield of paddy. This research finds that the performance of the NN was improved by optimizing the input variables using GA. By tuning the parameters of the NN with various hidden layers and learning rates the proposed algorithm gives the best result with maximum accuracy and minimum error rate. The extracted knowledge through this study will assist the paddy growers to take decisions related to cropping pattern of paddy. In the Future the proposed algorithm will be implemented for variety of crops such as sugarcane, groundnut, etc.
Funding Statement: This article has been written with the financial support of RUSA-Phase 2.0 grant sanctioned vide Letter No.F.24-51/2014-U, Policy (TNMulti-Gen), Dep. of Edn. Govt. of India, Dt.09.10.2018.
Conflicts of Interest: The authors declare that they have no conflicts of interest to report regarding the present study.
1. G. Mahajan, T. S. Bharaj and J. Timsina, “Yield and water productivity of rice as affected by time of transplanting in punjab, India,” Agricultural Water Management, vol. 96, no. 3, pp. 525–532, 2009. [Google Scholar]
2. R. Hassan, M. Marimuthu and S. K. Johl, “Ethnic diversity on boards and market performance: An empirical investigation in Malaysia,” Journal of Computational and Theoretical Nanoscience, vol. 21, no. 5, pp. 1099–1103, 2015. [Google Scholar]
3. P. De and B. Ghosh, “Productivity, efficiency and technological change in Indian ports,” International Journal of Maritime Economics, vol. 4, no. 4, pp. 348–368, 2002. [Google Scholar]
4. J. Cao, Z. Zhang, F. Tao, L. Zhang, Y. Luo et al., “Integrating multi-source data for rice yield prediction across China using machine learning and deep learning approaches,” Agricultural and Forest Meteorology, vol. 297, pp. 108275, 2021, https://doi.org/10.1016/j.agrformet.2020.108275. [Google Scholar]
5. A. O. Onojeghuo, G. A. Blackburn, Q. Wang, P. M. Atkinson, D. Kindred et al., “Mapping paddy rice fields by applying machine learning algorithms to multi-temporal sentinel-1A and landsat data,” International Journal of Remote Sensing, vol. 39, no. 4, pp. 1042–1067, 2018. [Google Scholar]
6. Y. Wang, S. Zang and Y. Tian, “Mapping paddy rice with the random forest algorithm using MODIS and SMAP time series,” Chaos, Solitons & Fractals, vol. 140, pp. 110116, 2020, https://doi.org/10.1016/j.chaos.2020.110116. [Google Scholar]
7. R. Ben Ayed and M. Hanana, “Artificial intelligence to improve the food and agriculture sector,” Journal of Food Quality, vol. 2021, pp. 1–7, 2021, https://doi.org/10.1155/2021/5584754. [Google Scholar]
8. V. Amaratunga, L. Wickramasinghe, A. Perera, J. Jayasinghe and U. Rathnayake, “Artificial neural network to estimate the paddy yield prediction using climatic data,” Mathematical Problems in Engineering, vol. 2020, pp. 1–11, 2020. [Google Scholar]
9. E. Wang, C. J. Smith, W. J. Bond and K. Verburg, “Estimations of vapour pressure deficit and crop water demand in APSIM and their implications for prediction of crop yield, water use and deep drainage,” Australian Journal of Agricultural Research, vol. 55, no. 12, pp. 1227, 2004. [Google Scholar]
10. P. Ekanayake, W. Rankothge, R. Weliwatta and J. W. Jayasinghe, “Machine learning modelling of the relationship between weather and paddy yield in Sri Lanka,” Journal of Mathematics, vol. 2021, pp. 1–14, 2021. [Google Scholar]
11. S. Verma, N. Sharma, A. Singh, A. Alharbi, W. Alosaimi et al., “An intelligent forecasting model for disease prediction using stack ensembling approach,” Computers, Materials & Continua, vol. 70, no. 3, pp. 6041–6055, 2022. [Google Scholar]
12. A. Mustafa Hilal, H. Alsolai, F. N. Al-Wesabi, M. Abdullah Al-Hagery, M. Ahmed Hamza et al., “Artificial intelligence based optimal functional link neural network for financial data science,” Computers, Materials & Continua, vol. 70, no. 3, pp. 6289–6304, 2022. [Google Scholar]
13. S. Elsoragaby, A. Yahya, M. R. Mahadi, N. W. Nawi, M. Mairghany et al., “Applying multi-objective genetic algorithm (MOGA) to optimize the energy inputs and greenhouse gas emissions (GHG) in wetland rice production,” Energy Reports, vol. 6, pp. 2988–2998, 2020. [Google Scholar]
14. C. Arif, B. I. Setiawan, M. Mizoguchi and B. D. A. Nugroho, “Genetic algorithms optimization for water management in irrigated paddy fields,” IOP Conference Series Earth and Environmental Science, vol. 335, no. 1, pp. 012002, 2019. [Google Scholar]
15. E. Ayan, H. Erbay and F. Varçın, “Crop pest classification with a genetic algorithm-based weighted ensemble of deep convolutional neural networks,” Computers and Electronics in Agriculture, vol. 179, pp. 105809, 2020. [Google Scholar]
16. T. S. M and J. B, “Adaptive lemuria: A progressive future crop prediction algorithm using data mining,” Sustainable Computing: Informatics and Systems, vol. 31, pp. 100577, 2021, https://doi.org/10.1016/j.suscom.2021.100577. [Google Scholar]
17. D. C. H. Nguyen, H. R. Maier, G. C. Dandy and J. C. Ascough, “Framework for computationally efficient optimal crop and water allocation using ant colony optimization,” Environmental Modelling & Software, vol. 76, pp. 37–53, 2016. [Google Scholar]
18. N. Pholdee, S. Bureerat and W. Nuantong, “Kriging surrogate-based genetic algorithm optimization for blade design of a horizontal AxisWind turbine,” Computer Modeling in Engineering & Sciences, vol. 126, no. 1, pp. 261–273, 2021. [Google Scholar]
19. I. Gholaminezhad, A. Jamali and H. Assimi, “Multi-objective reliability-based robust design optimization of robot gripper mechanism with probabilistically uncertain parameters,” Neural Computing and Applications, vol. 28, no. S1, pp. 659–670, 2017. [Google Scholar]
20. Z. Hu, J. Yang, H. Cui, H. Sun and L. Wei, “Multi-objective particle swarm optimization algorithm based on leader combination of decomposition and dominance,” Journal of Intelligent & Fuzzy Systems, vol. 33, no. 3, pp. 1577–1588, 2017. [Google Scholar]
 | This work is licensed under a Creative Commons Attribution 4.0 International License, which permits unrestricted use, distribution, and reproduction in any medium, provided the original work is properly cited. |