DOI:10.32604/iasc.2023.027579
| Intelligent Automation & Soft Computing DOI:10.32604/iasc.2023.027579 | |
| Article |
P-ROCK: A Sustainable Clustering Algorithm for Large Categorical Datasets
1Department of Computer Science and Engineering, College of Applied Studies and Community Services, King Saud University, Riyadh, 11533, Saudi Arabia
2Department of Computer Science, CHRIST (Deemed to be University), Bangalore, 560029, India
3Department of Computer Engineering and Applications, GLA University, Mathura, UP, India
4Department of Computer Application, Manipal University Jaipur, Rajasthan, 303007, India
5Information Systems Department, Imam Mohammad Ibn Saud Islamic University (IMSIU), Riyadh, 11432, Saudi Arabia
*Corresponding Author: Abdul Khader Jilani Saudagar. Email: aksaudagar@imamu.edu.sa
Received: 20 January 2022; Accepted: 02 March 2022
Abstract: Data clustering is crucial when it comes to data processing and analytics. The new clustering method overcomes the challenge of evaluating and extracting data from big data. Numerical or categorical data can be grouped. Existing clustering methods favor numerical data clustering and ignore categorical data clustering. Until recently, the only way to cluster categorical data was to convert it to a numeric representation and then cluster it using current numeric clustering methods. However, these algorithms could not use the concept of categorical data for clustering. Following that, suggestions for expanding traditional categorical data processing methods were made. In addition to expansions, several new clustering methods and extensions have been proposed in recent years. ROCK is an adaptable and straightforward algorithm for calculating the similarity between data sets to cluster them. This paper aims to modify the algorithm by creating a parameterized version that takes specific algorithm parameters as input and outputs satisfactory cluster structures. The parameterized ROCK algorithm is the name given to the modified algorithm (P-ROCK). The proposed modification makes the original algorithm more flexible by using user-defined parameters. A detailed hypothesis was developed later validated with experimental results on real-world datasets using our proposed P-ROCK algorithm. A comparison with the original ROCK algorithm is also provided. Experiment results show that the proposed algorithm is on par with the original ROCK algorithm with an accuracy of 97.9%. The proposed P-ROCK algorithm has improved the runtime and is more flexible and scalable.
Keywords: ROCK; K-means algorithm; clustering approaches; unsupervised learning; K-histogram
To group comparable data points in a cluster, data points are clustered. Numerical points are easier to cluster because several clustering methods have previously been established in this manner. There is a substantial challenge when the data has clustered numeric properties and is categorical. Categorical data must be translated into numerical data because minimal research in this field [1] represented a new promise in the research of categorical data clustering.
Recent research has concentrated on resurrecting traditional simple clustering algorithms with modifications to improve their efficiency. This serves two purposes. Traditional algorithms’ scalability and ease of implementation can be preserved for starters. Second, the investment required to develop a new algorithm is significantly higher than that required to modify an existing one.
As massive data warehouses store massive amounts of data, clustering has become increasingly important in today’s world. Various clustering methods have been developed over the years to cluster this massive amount of data. Clustering categorical and numerical data, on the other hand, is an entirely different challenge. Categorical data values exist on a nominal scale. Each one represents a conceptually distinct notion, they cannot be meaningfully sorted, and they cannot be handled or manipulated the same way numbers can. Blood types A, B, AB, and O, for example, indicate a person’s blood type. Rocks can be classified as igneous, metamorphic, or sedimentary. Computing the similarity between data points does not require a distance similarity metric. Over the years, many clustering approaches have been created, and some of them are detailed in the following sub-section.
The several clustering is listed in the below sub-sections.
One of the earliest attempts in this direction was the application of the widely used K-means algorithm [2] to categorical data. The authors of [3] referred to the K-modes technique because it determines the central tendency of a group of categorical variables rather than the mean or median. This K-means version worked well with categorical data by utilizing a primary matching dissimilarity method. Finally, the clustering process is updated using a frequency-based method rather than the mean value, resulting in a lower cost function. Choose a K-initial mode value and assign the item with the lowest mode value to the cluster as a starting point for clustering. Each item’s dissimilarity metric is then compared to the current model. Then comes the comparison. If the object’s mode value is in a different cluster than the current one, reallocate the item to a new one. The procedure is repeated until no further changes are required. However, one issue is that it selects the initial cluster centers at random for each subsequent run, resulting in non-repeatable clustering results.
The k-means algorithm was also extended in the form of a K-Histogram [4], which required the replacement of means with the histogram to cluster categorical data efficiently. In this direction, the k-means algorithm was modified by replacing mean with histogram and applying a new similarity measure between categorical data and histogram. After the ‘k’ value is initialized and the cost functions are calculated, the object is assigned to a cluster whose histogram is similar. After each assignment is completed, histograms are updated, and the process is repeated until no further changes are observed.
2.1.3 Fuzzy K-Means Variations
In fuzzy c-means clustering, data items can belong to multiple clusters depending on their degree of cluster membership [5]. Data points on the outskirts of a cluster are less significant than those in the center. Fuzzy k-modes [6] are an extension of Fuzzy c-means clustering that alters the similarity measure between centroids and data points in addition to utilizing the hard mode [7]. Fuzzy c-means extensions for k-representative and k-populations are also available [8].
The QROCK [9] and MROCK [10] are direct variations of the ROCK algorithm [11].
The Q-ROCK [12] is a quicker version of the ROCK [13] algorithm. The methodology is similar to the ROCK algorithm but with certain proposed modifications discussed below.
• It computes clusters by determining the connected components of the graph.
• It drastically reduces the computation of the algorithm.
• It does not believe in the prior knowledge of the desired number of clusters
• Also detects outliers
• Defines a new weighted goodness measure
• Avoids explicit computation of links, thereby substantially improving computational efforts.
• Computes a correspondence between the values of the number of clusters, k, and the threshold θ; selection of k and θ in conformance with this correspondence makes the termination criteria equivalent.
The M-Rock [14] algorithm improves the computing time of the ROCK [15] algorithm by introducing a new goodness measure and criterion function, the former for computing intra similarity between identities and the latter for effective cluster merging. Depending on the dataset, it selects the best intra similarity measure from Modified Sorensen Dice coefficient, Modified Traversky, and Modified second Kulczynski. The approach is similar to that of ROCK. M-ROCK outperformed ROCK in terms of results.
This section first presents a detailed overview of the ROCK algorithm with its methodology and further shows our proposed modification. Our proposal includes fine-tuning parameters of the algorithm as our modification. Analysis of the same is also provided for better evaluation of the proposed modifications.
The ROCK algorithm in [16] was one of the first categorical clustering algorithms, and it was very effective at handling categorical data without the use of any additional methods. The concept of links was used to determine the similarity between data points, distinguishing them from the other category clustering methods. In previously suggested methods, distance metrics were used as a similarity measure for dividing the database, but they were ineffective for the category and Boolean characteristics. The method’s use of links mitigates the disadvantages of using distance metrics or the Jaccard coefficient to handle categorical data. The algorithm considers two data points to be “neighbors” if their similarity based on any similarity measure exceeds a certain threshold. The number of ‘links’ between the locations corresponds to the number of neighbors. The algorithms construct superior clusters by merging clusters with the most connections. Unlike distance or other similarity measures, which only include local information about the points, the link idea includes global information about other points, making the method more resilient. The greater the number of connections between two locations, the more likely they are in the same cluster.
Two points,
where 0 ≥ θ ≥ 1.
It means similarity 0 reflects no links between the data points and vice versa. The algorithm presents a new criterion function on links and maximizes this criterion for best results. The criterion function aims to maximize the links between two points pq and pq lying in the same cluster but to minimize the links between the same points pq and pq If they lie in different clusters. The criterion function E1 is as follows.
where Ci denotes cluster
It then merges the clusters based on the links using a goodness measure till no further merging is possible or no links remain. The goodness measure is calculated as:
The steps involved in the ROCK algorithm
• Step 1: Consider all the data points as separate clusters.
• Step 2: Repeat steps 3 to 5 until no more clusters can be merged or links remain.
• Step 3: Compute links between the clusters.
• Step 4: Compute the goodness measure.
• Step 5: Merge the best two clusters.
The parameters involved in the ROCK algorithm are discussed below.
a. The threshold for neighborhood decision: Two points are considered neighbors if there is a considerable similarity between them. This similarity is further dependent on a given threshold whose value ranges from 0 to 1. Variations in the value of the threshold can bring about changes in the result of the ROCK algorithm.
b. Value of
c. Value of h(θ): If the equation of goodness measure is closely observed, it is noticed that in the denominator, the powers of used entities are a function of f(θ) or indirectly function of θ. Thus, representing this through a new function h(θ), the formula for good measure can be rewritten as:
where h(θ) can be varied according to f(θ).
After observing the method’s parameters, the algorithm can be converted into a parameterized version with all parameters being user-defined and input. After that, the user-defined parameters can be calculated. Using domain knowledge and data properties. Given below are the steps of the proposed Parameterized-ROCK (P-ROCK) algorithm.
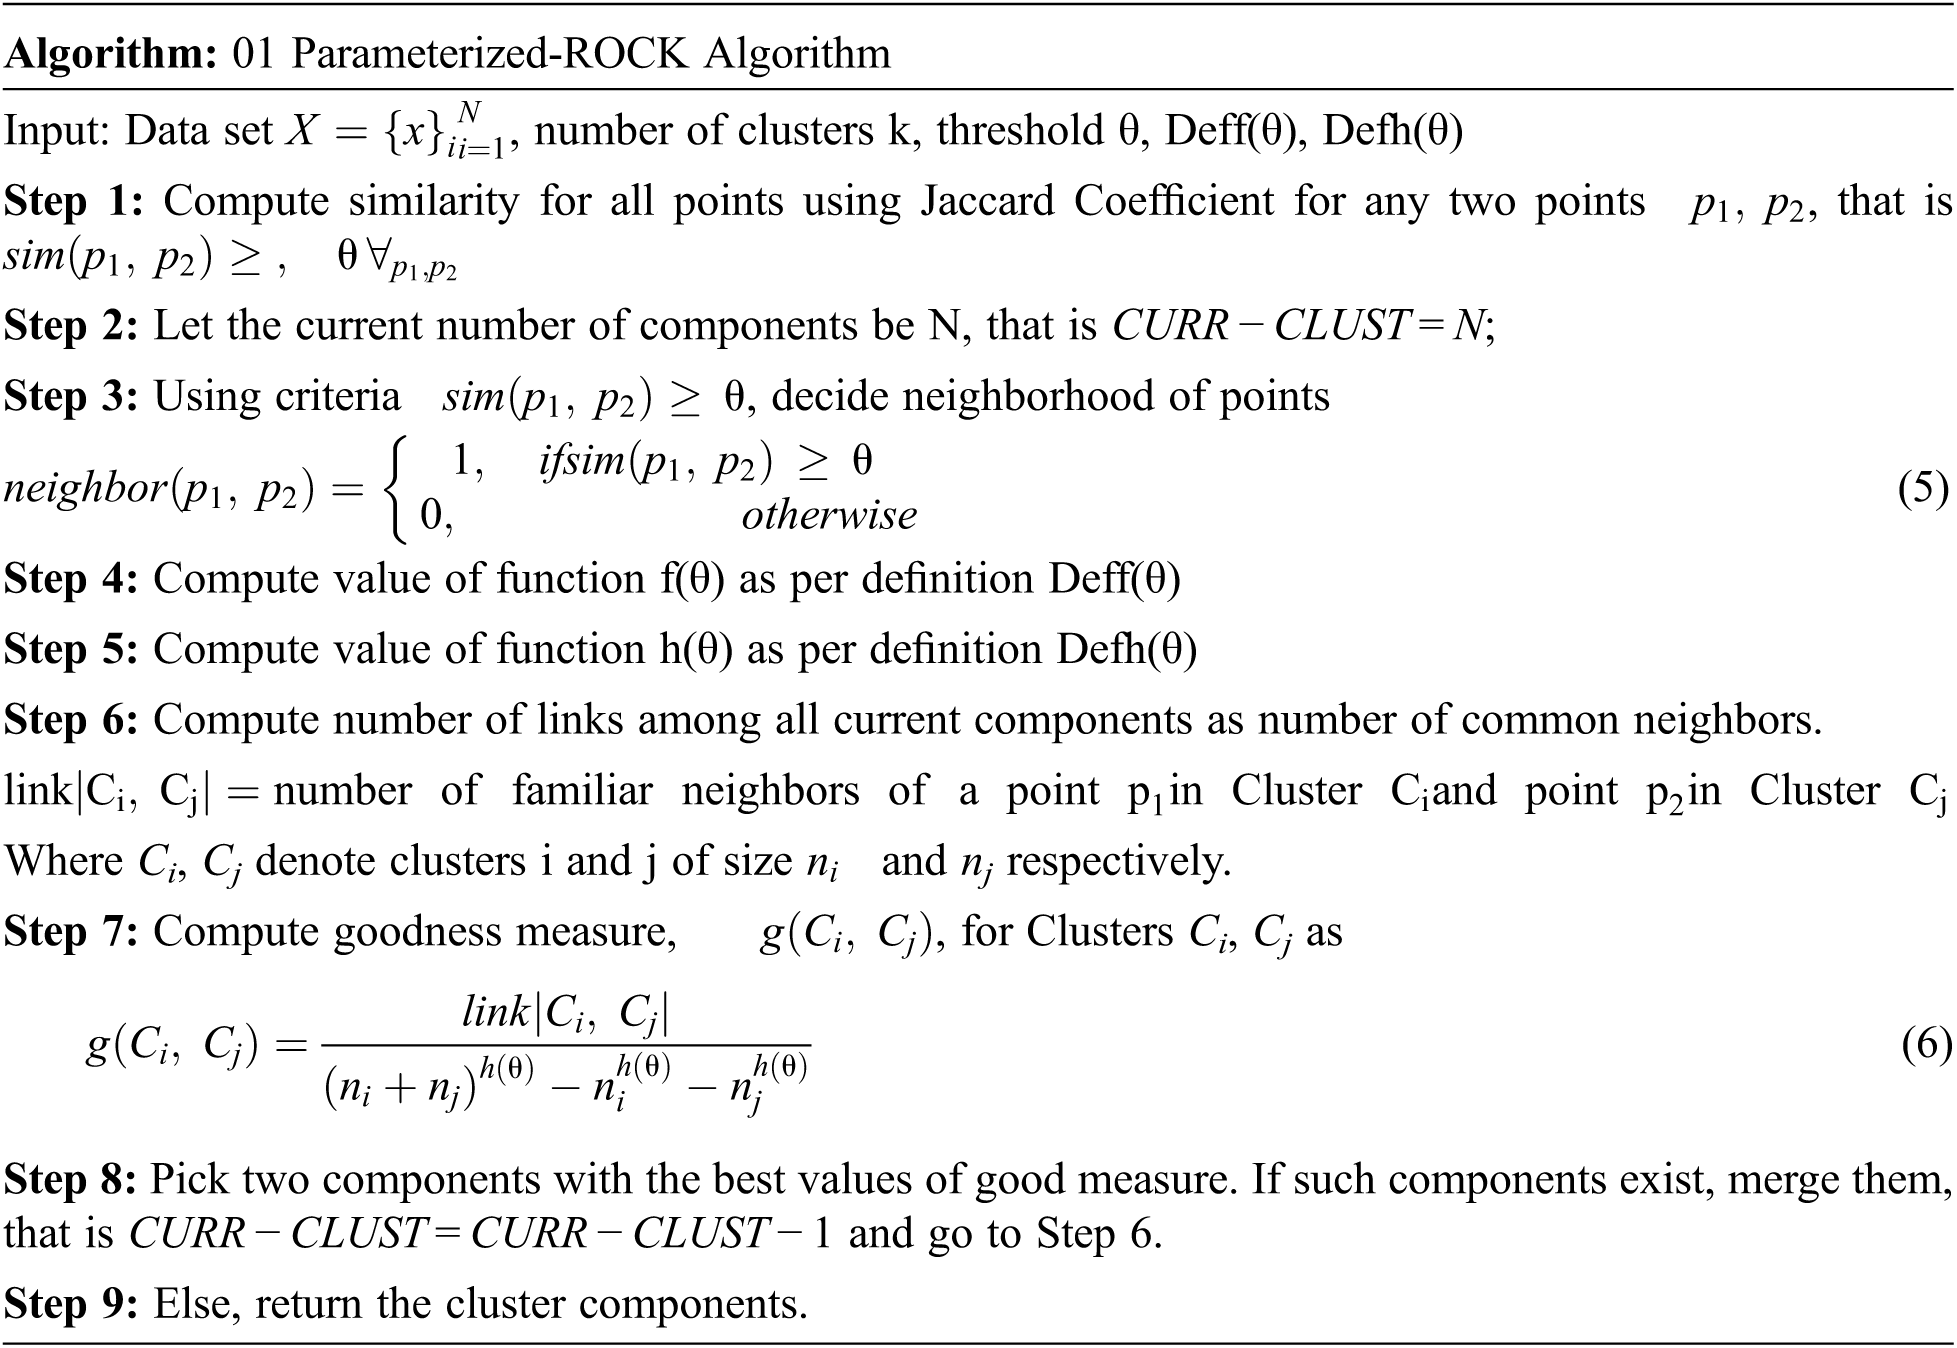
The proposed algorithm requires Definition of functions f(θ) and h(θ) as input. From the implementation point of view, this can be done through subroutine calls that take (as input) steps 4 and 5. The initial values of links can be directly computed as link = neighbor *neighbor. At a time, only two clusters are merged, thus reducing the value of CURR − CLUST by 1 in each iteration.
In this section, a few hypotheses will be formed regarding the effect of parameters on runtime and the clustering quality of the ROCK algorithm. Further implementation results of the proposed Parameterized ROCK algorithm can justify the statements of hypotheses.
The first hypothesis has been adopted directly from [17]. We have chosen the hypothesis based on cluster parameters. The value of θ affecting the number of neighbors and overall cluster quality. The hypothesis shows the effect of θ and threshold value on the number of clusters. In the third hypothesis, we have shown that the algorithm stops running f(θ) values are increased and require more time. This can be explained by fewer links among the components, causing very few components that will be mergeable. A formal hypothesis regarding the effect of threshold parameter θ over P-ROCK.
HYPOTHESIS 1: “Increasing the threshold value should decrease the runtime of the algorithm and degrade the cluster quality”
Besides this effect of θ, it can also be safely assumed that θ deduced from one dataset cannot be applied to another dataset. It implies θ needs to be learned for each data or be provided by a domain expert.
HYPOTHESIS 2: “There can be no universal value of f (θ); it is dependent on characteristics of data”
The constraint mentioned in [18] for f(θ) require that f(θ) should be 0 at θ = 1 and f(θ) should be 1 at θ = 0. Keeping this constraint, many definitions of f(θ) can be formulated. It is expected that the effect of the definition of f (θ) is negligible over the algorithm’s performance if the constraint is obeyed.
HYPOTHESIS 3: “Definition of f(θ) should not affect the performance of ROCK if the constraint ‘f(θ) should be 0 at θ = 1 and f(θ) should be 1 at θ = 0’ is satisfied.”
The extra parameter h(θ) introduced for P-ROCK needs a detailed analysis. Putting the limiting values of
Therefore, a good measure is
Since goodness measure cannot be a negative value,
Which makes,
Resulting,
The other extreme situation where both clusters to be merged might have
where,
This makes,
Taking log both sides,
This makes,
Resulting,
A hypothesis can thus be formed as:
HYPOTHESIS 4: “If constraint h(θ) > 1 is followed, the definition of h(θ) should not affect the cluster quality.”
As mentioned in [19], the expression for good measure depends only on the number of links between two components. The other parts of the expression are just for normalization purposes. Therefore, these factors can be removed to reduce the computations involved in the algorithm.
A hypothesis can therefore be framed as:
HYPOTHESIS 5: “Only the threshold parameter can affect the quality of output and will not be affected by goodness measure if goodness measure depends on link.”
Experiments are designed and conducted to verify the hypotheses discussed in the last section. The later sections discuss the results of the experiments.
Experiments on the proposed P-ROCK algorithm have been performed on MATLAB, an easy and efficient platform for mathematical computations. Two real-life datasets have been taken for the experiments: The small soybean dataset and the Congressional Votes dataset. A brief description of the datasets has been given below.
The working of ROCK algorithm on soybean dataset is as shown in Tab. 1.
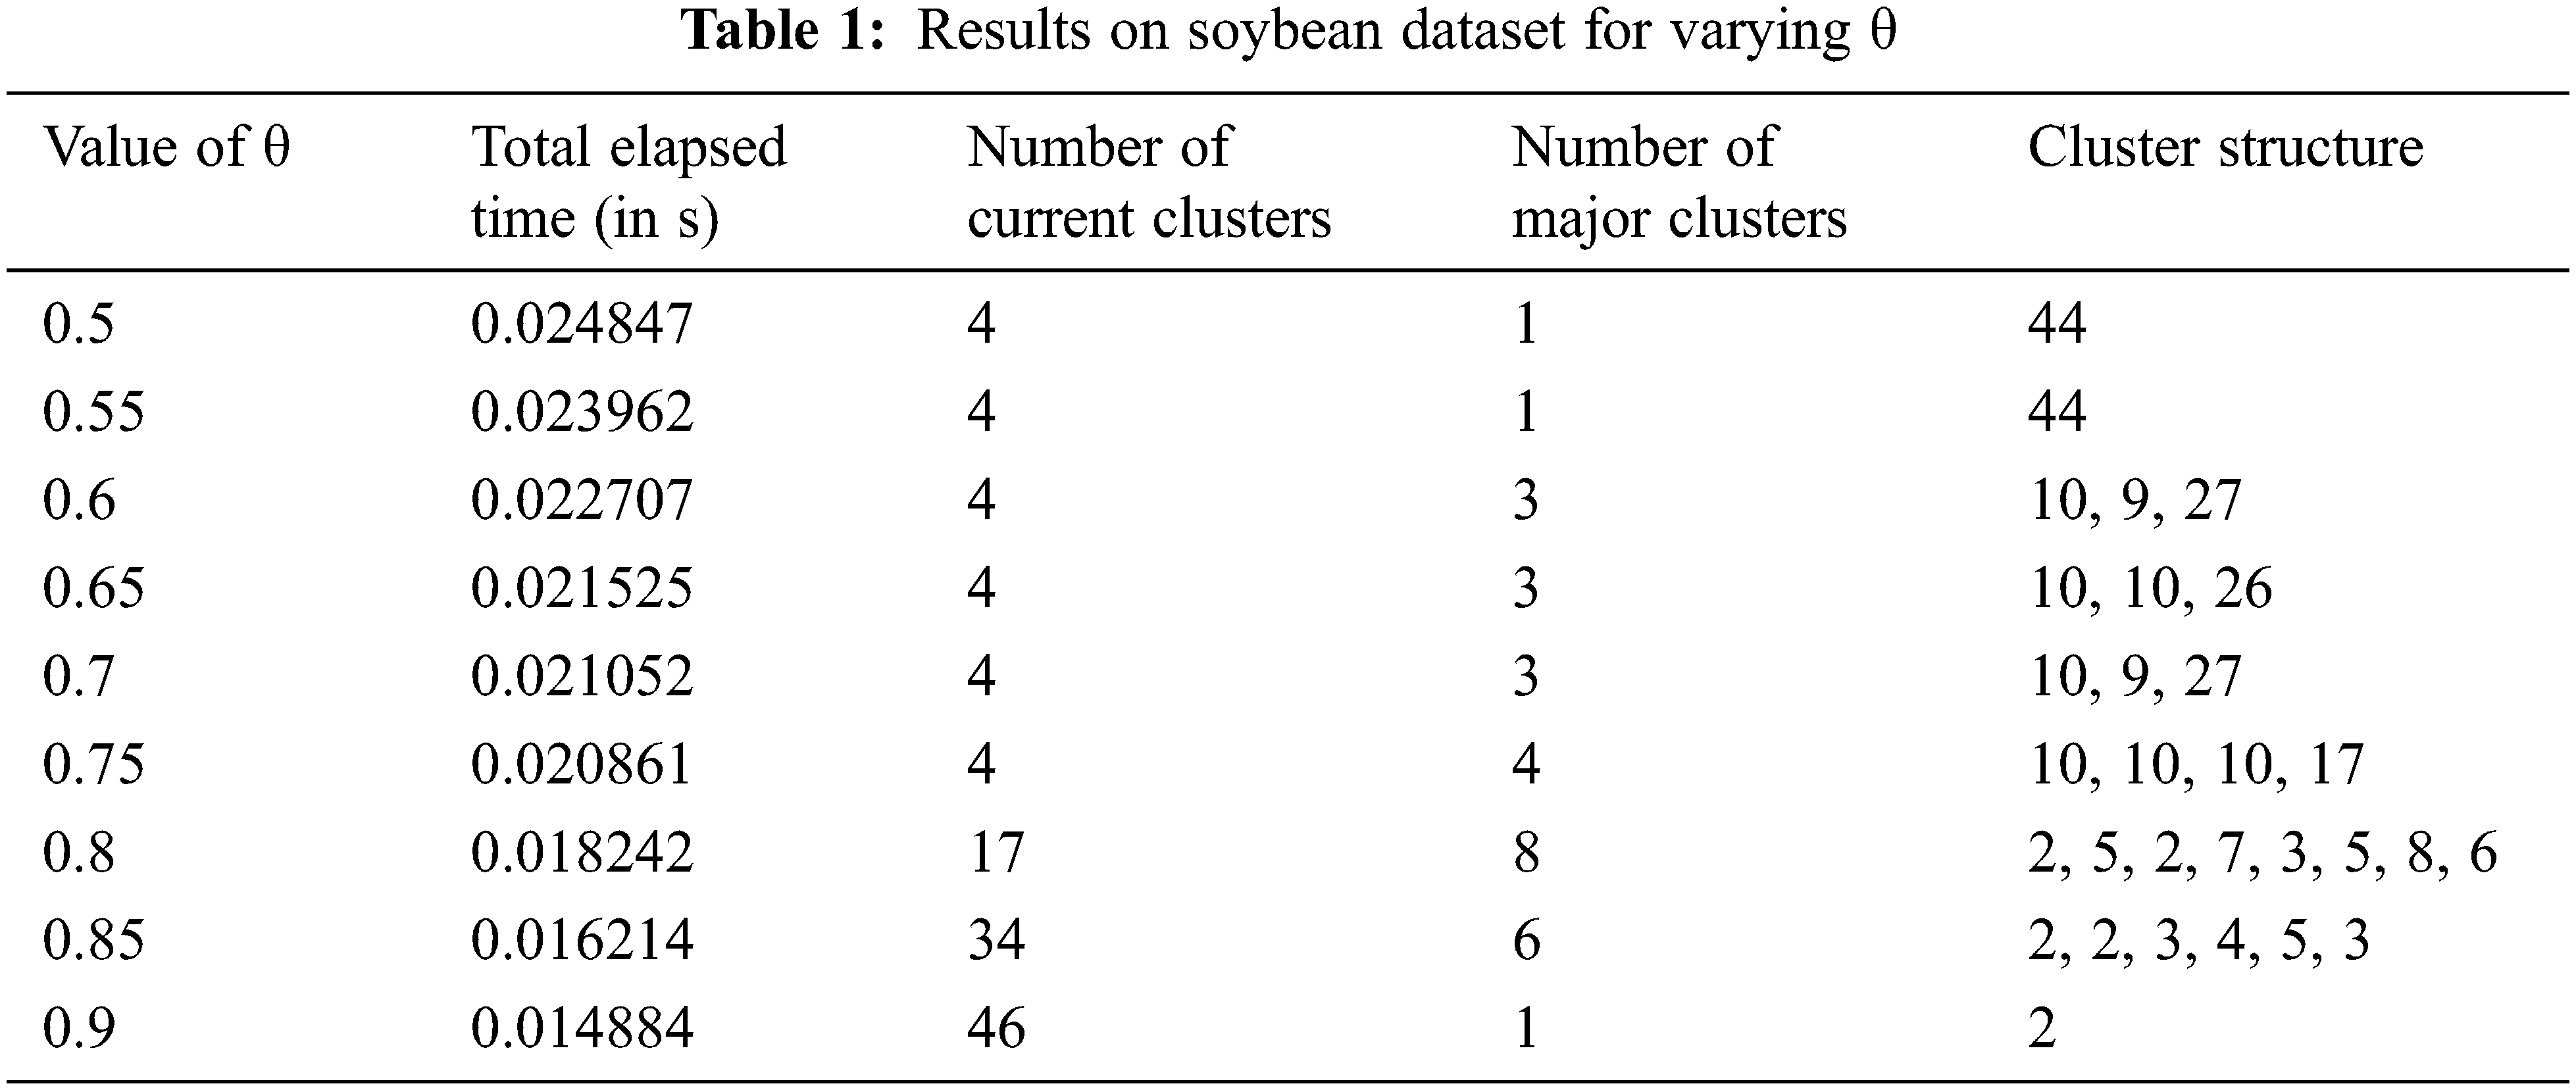
Fig. 1 shows the plot of execution time for increasing values of θ using the proposed P-ROCK algorithm on Soybean small dataset. As the value increases, the number of iterations reduces.
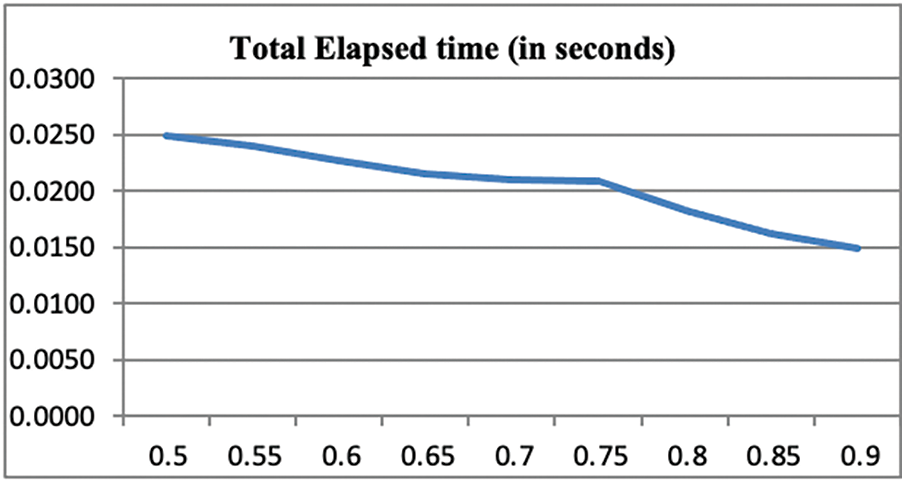
Figure 1: Plot of execution time for increasing θ on Soybean dataset
Tab. 2 records the three values, i.e., runtime, current cluster, number of significant clusters, and Cluster Structure of the significant clusters observed for the Congressional Votes dataset. Increasing values of θ result in decreasing runtime of the algorithm and increasing the number of current and significant clusters. The increasing number of current clusters represents that the merging of clusters has stopped sooner. The algorithm takes maximum time in the merging step. Therefore, if efficient merging does not occur, the number of current clusters will increase, decreasing the runtime. The best cluster structure obtained is 0.7 and 0.75 and the significant clusters is of size 188 and 162 with four small clusters.
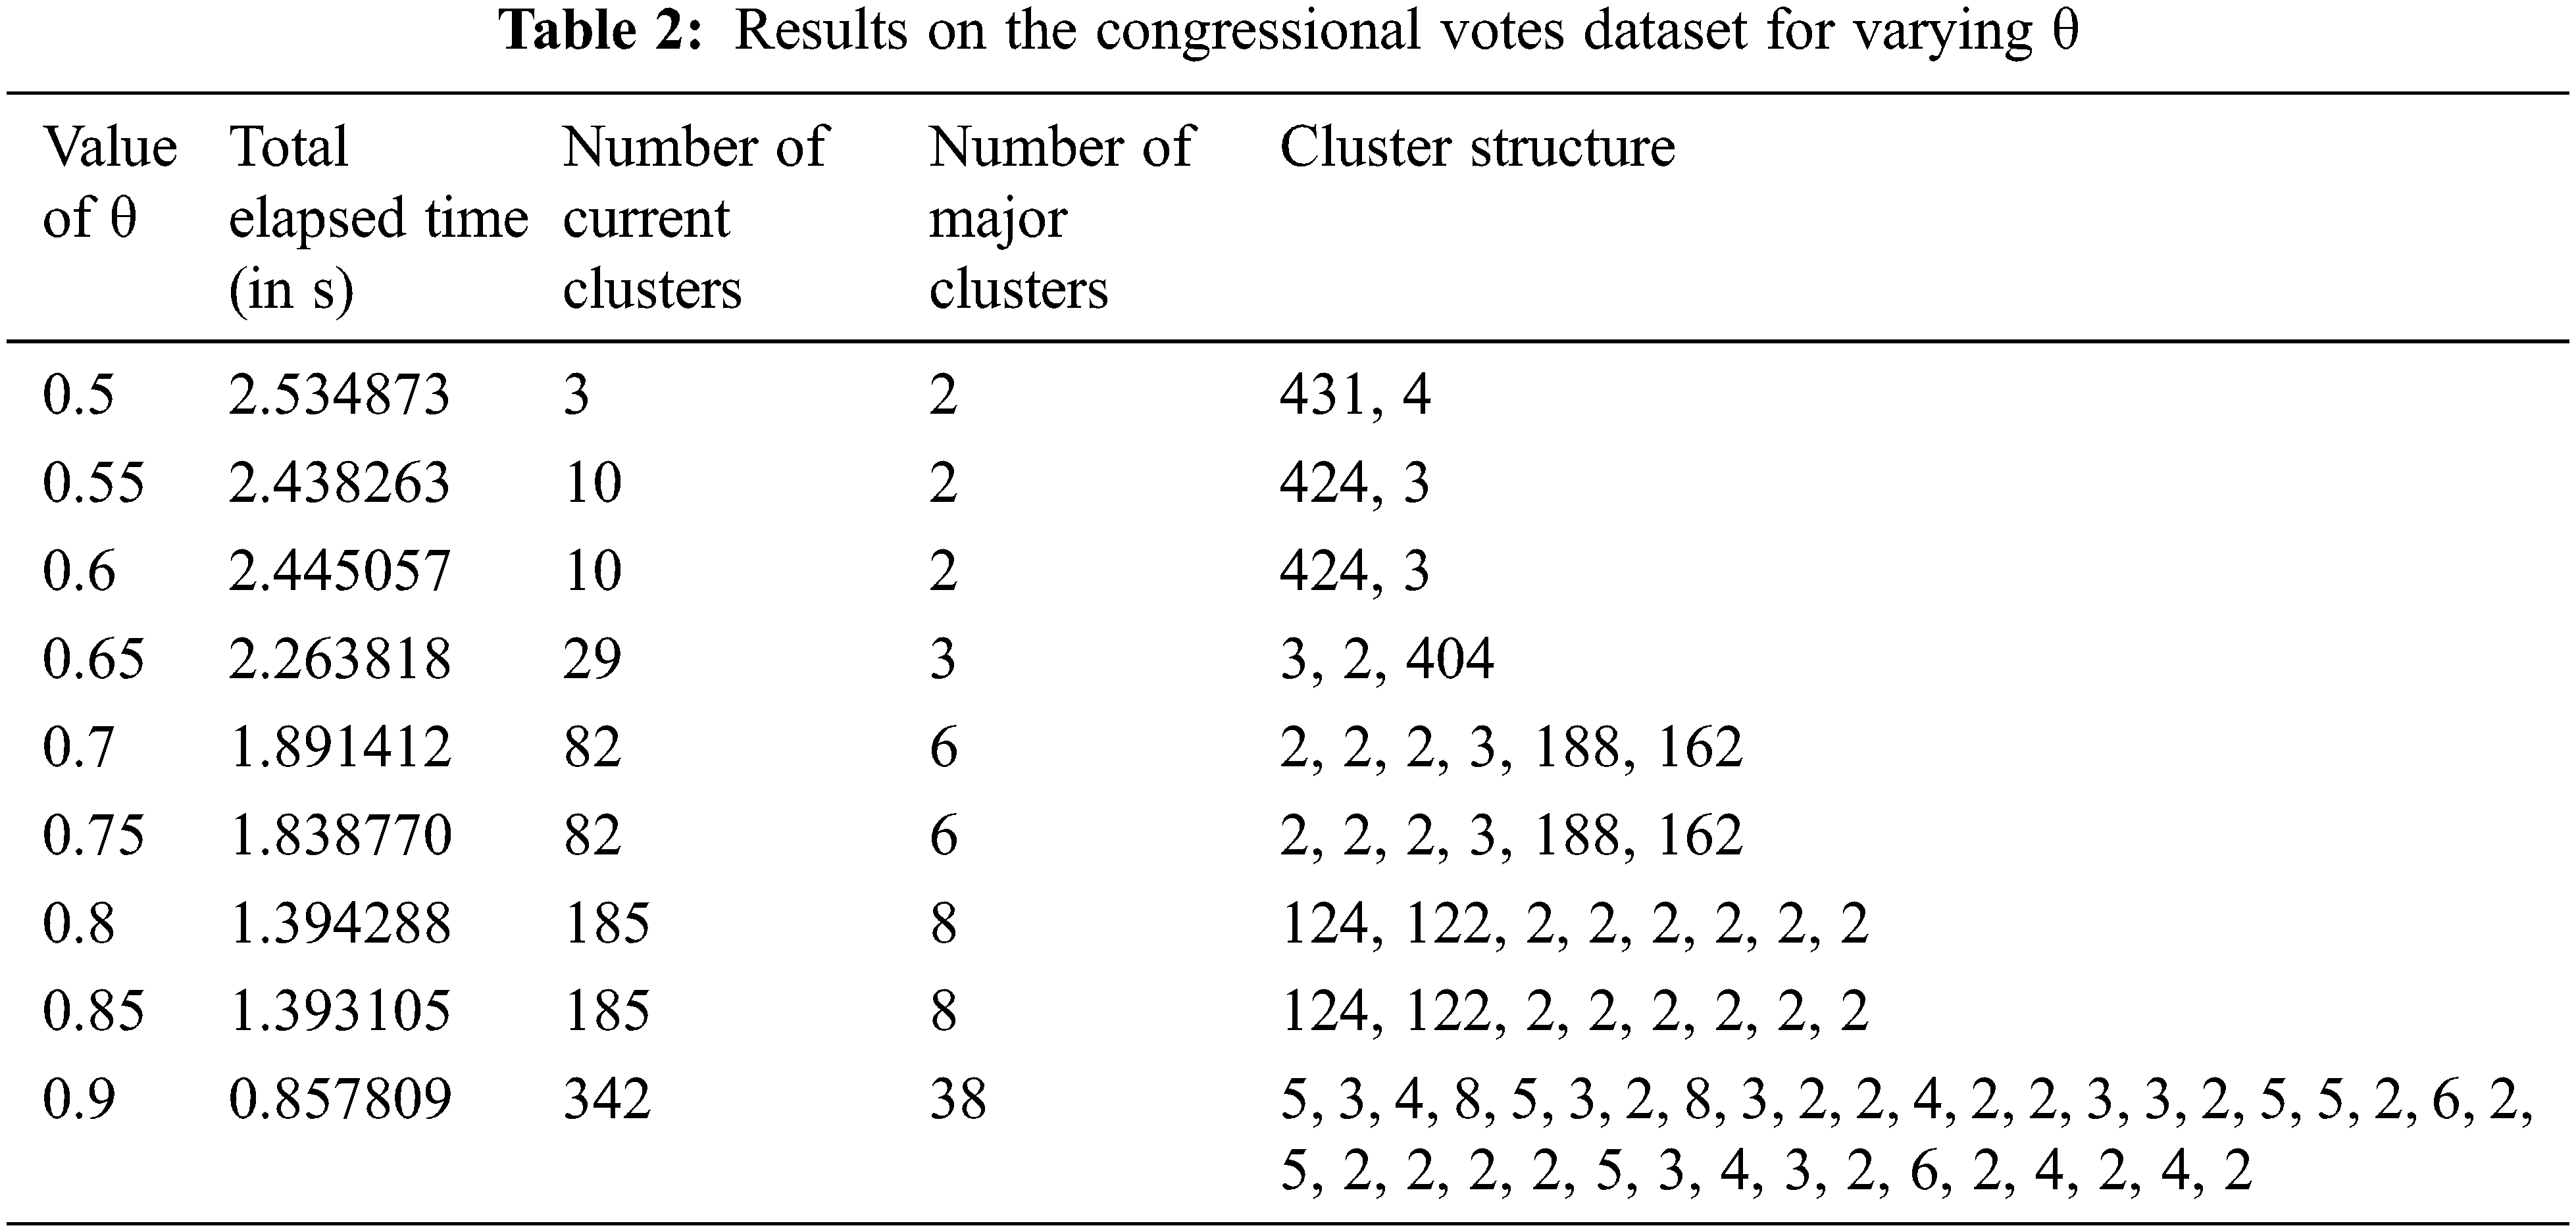
Fig. 2 shows the plot of execution time for increasing values of θ using the proposed P-ROCK algorithm on Congressional Votes dataset. The plot shows a declining slope of runtime with increasing values of θ due to the reduction in the number of iterations.
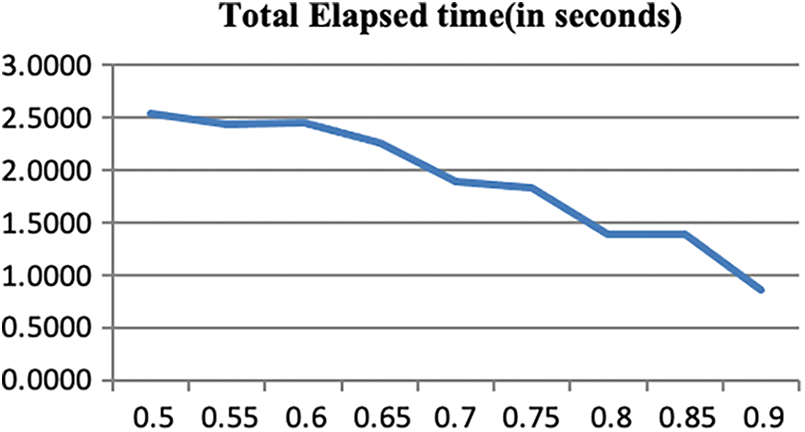
Figure 2: Plot of execution time for increasing θ on Congressional Votes dataset
We observed the values of θ for which obtained cluster structure is most accurate and keeping all other parameters constant. A changing definition of f(θ) can provide insight into its impact on the algorithm’s performance. The definitions used for f(θ), other than the standard ROCK algorithm [20], in our experiments are as follows.
1) f(θ) = 1 − θ
2) f(θ) = 1 − log2(1 + θ)
3) f(θ) = 1 + log2(1 + θ)
4) f(θ) = 1 + θ
5) f(θ) = 1
6) f(θ) = 0
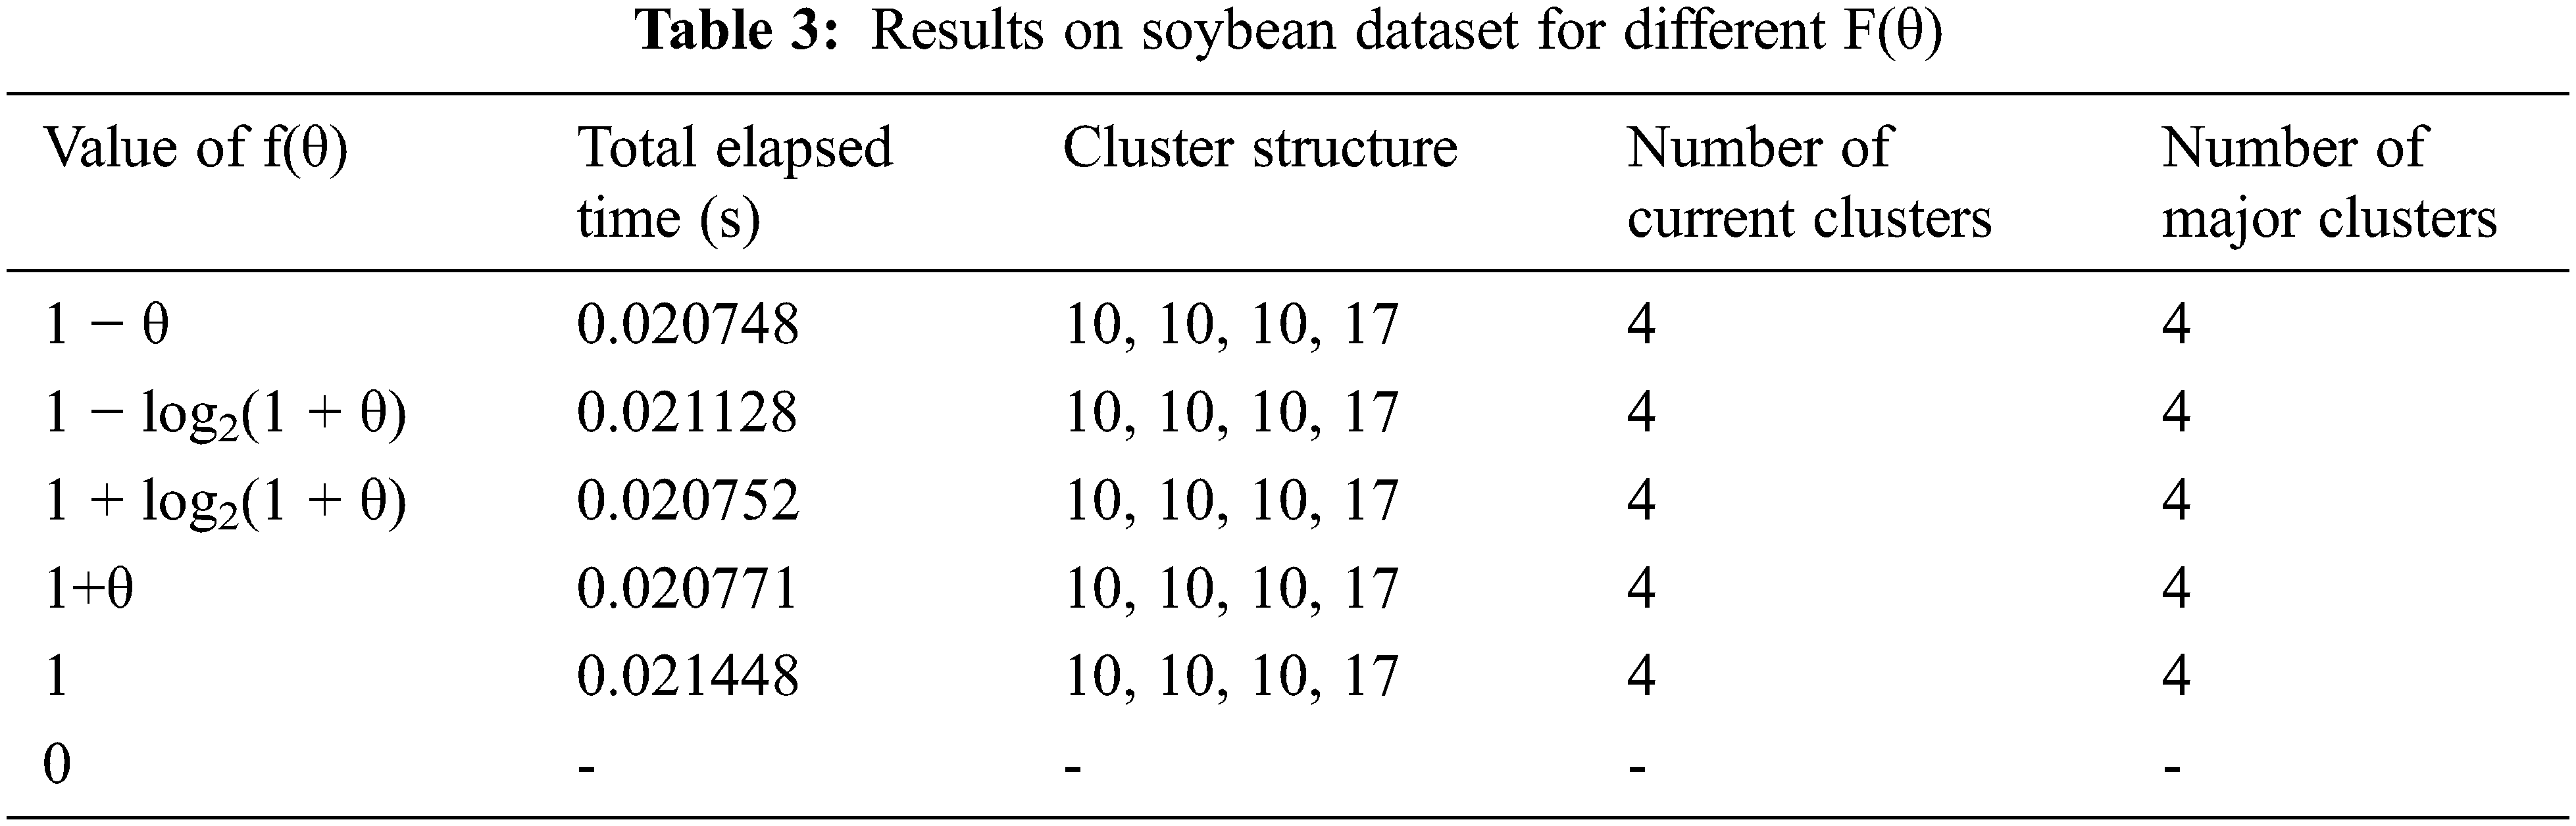
The first three definitions have been designed according to the constraint mentioned in [21] as f(θ) should be 0 at θ=1 and f(θ) should be 1 at θ=0. The following three definitions are designed to test the erroneous f(() formulation like larger values than 1 or some constant value. Values recorded for the experiment are again relevant to the cost of time incurred to achieve certain cluster quality. Since f(θ) decides the number of neighbors to be considered for computation of good measure, it is expected to affect cluster quality. There should be no direct impact on runtime. The particular case of (θ) = 0 would eventually result from an error of “Division by zero” in the formula of good measure, halting the execution before results are produced. For the Soybean dataset, at θ = 0.75, it was observed that practically, there is no effect on runtime. Moreover, even the cluster quality did not vary, against the hypothesis. Tab. 3 shows the recorded values.
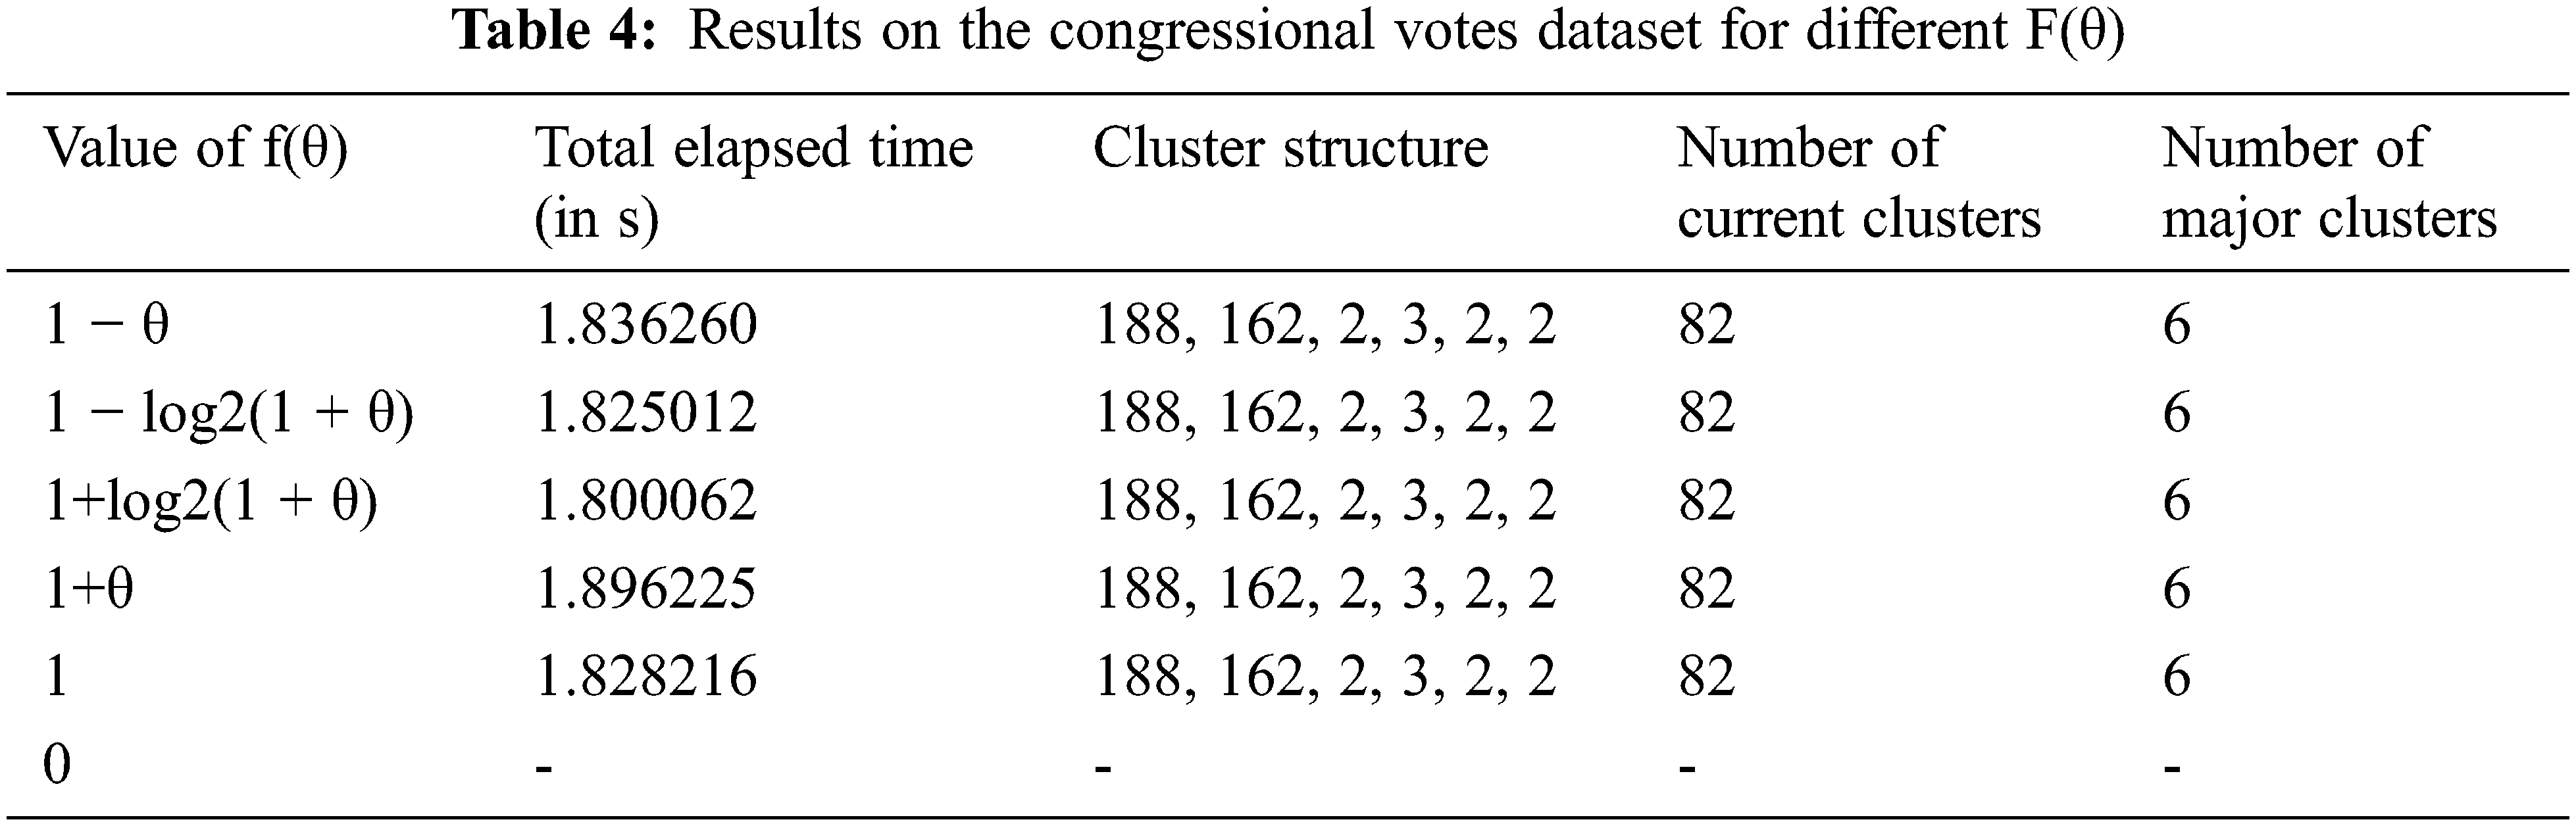
Tab. 4 shows the records of the results on the Congressional votes dataset for θ=0.75. Different values of f(θ) seem to have a negligible difference in the overall results. Except for f(θ)=0, all the results show all achieve the optimum values for the Congressional Votes dataset by the proposed P-ROCK algorithm.
Definition of h(θ) decides the extent of the impact of (θ) over goodness measure. It implies that h(θ) will directly affect the quality of clusters produced. The definitions used for f(θ), other than the standard ROCK algorithm, in our experiments are as follows.
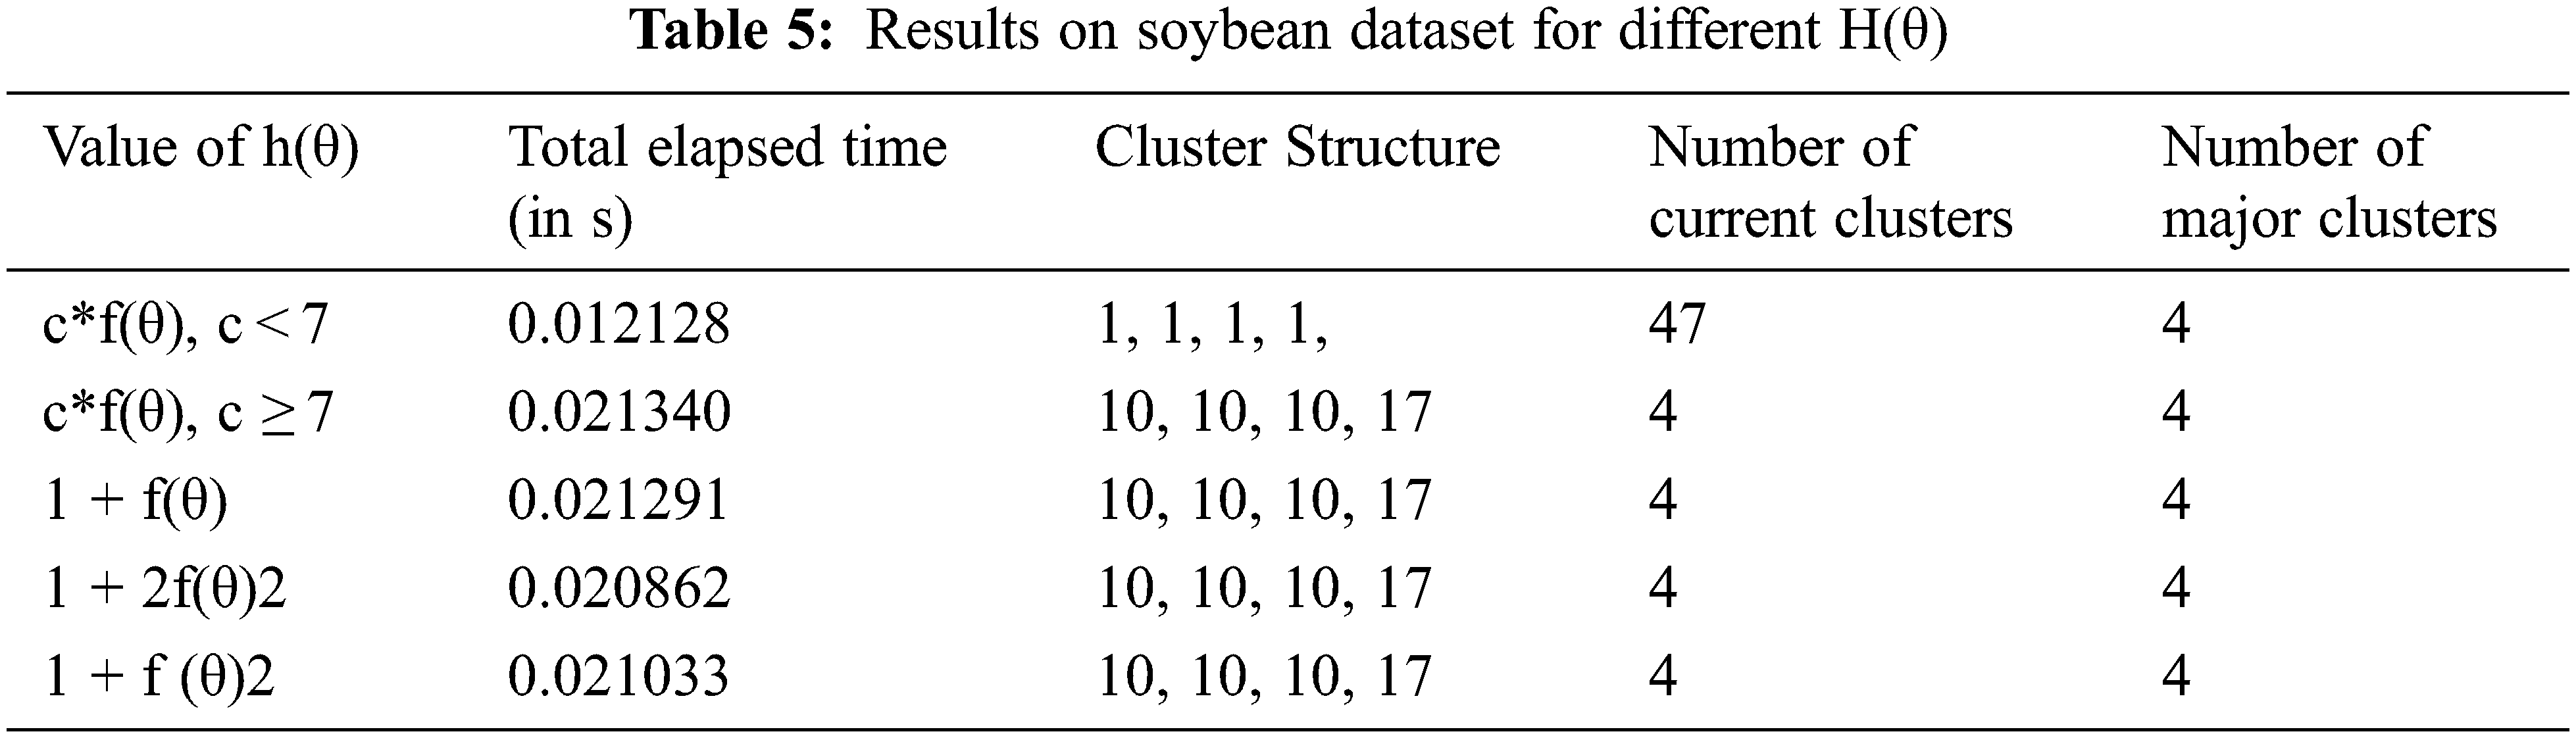
h (θ) = c*f(θ), h(θ) = 1 + f(θ), h(θ) = 1 + 1 + 2f(θ)2, h(θ) 1 + 2f(θ), c in c*f(θ) is a constant which generates optimum structure of clusters in Soybean dataset for values of c ≥7. For values less than 7, the merging of clusters does not occur. The reason for dependence on the value of c exists, concerning HYPOTHESIS 4, that the resultant h (θ) should be greater than 1. The experimental results for different h(θ) are tabulated in Tab. 5. The results show that there is a negligible difference in total elapsed time. The last four values of h (θ) follow the constraint discussed in HYPOTHESIS 4, and therefore, the cluster quality is the best.
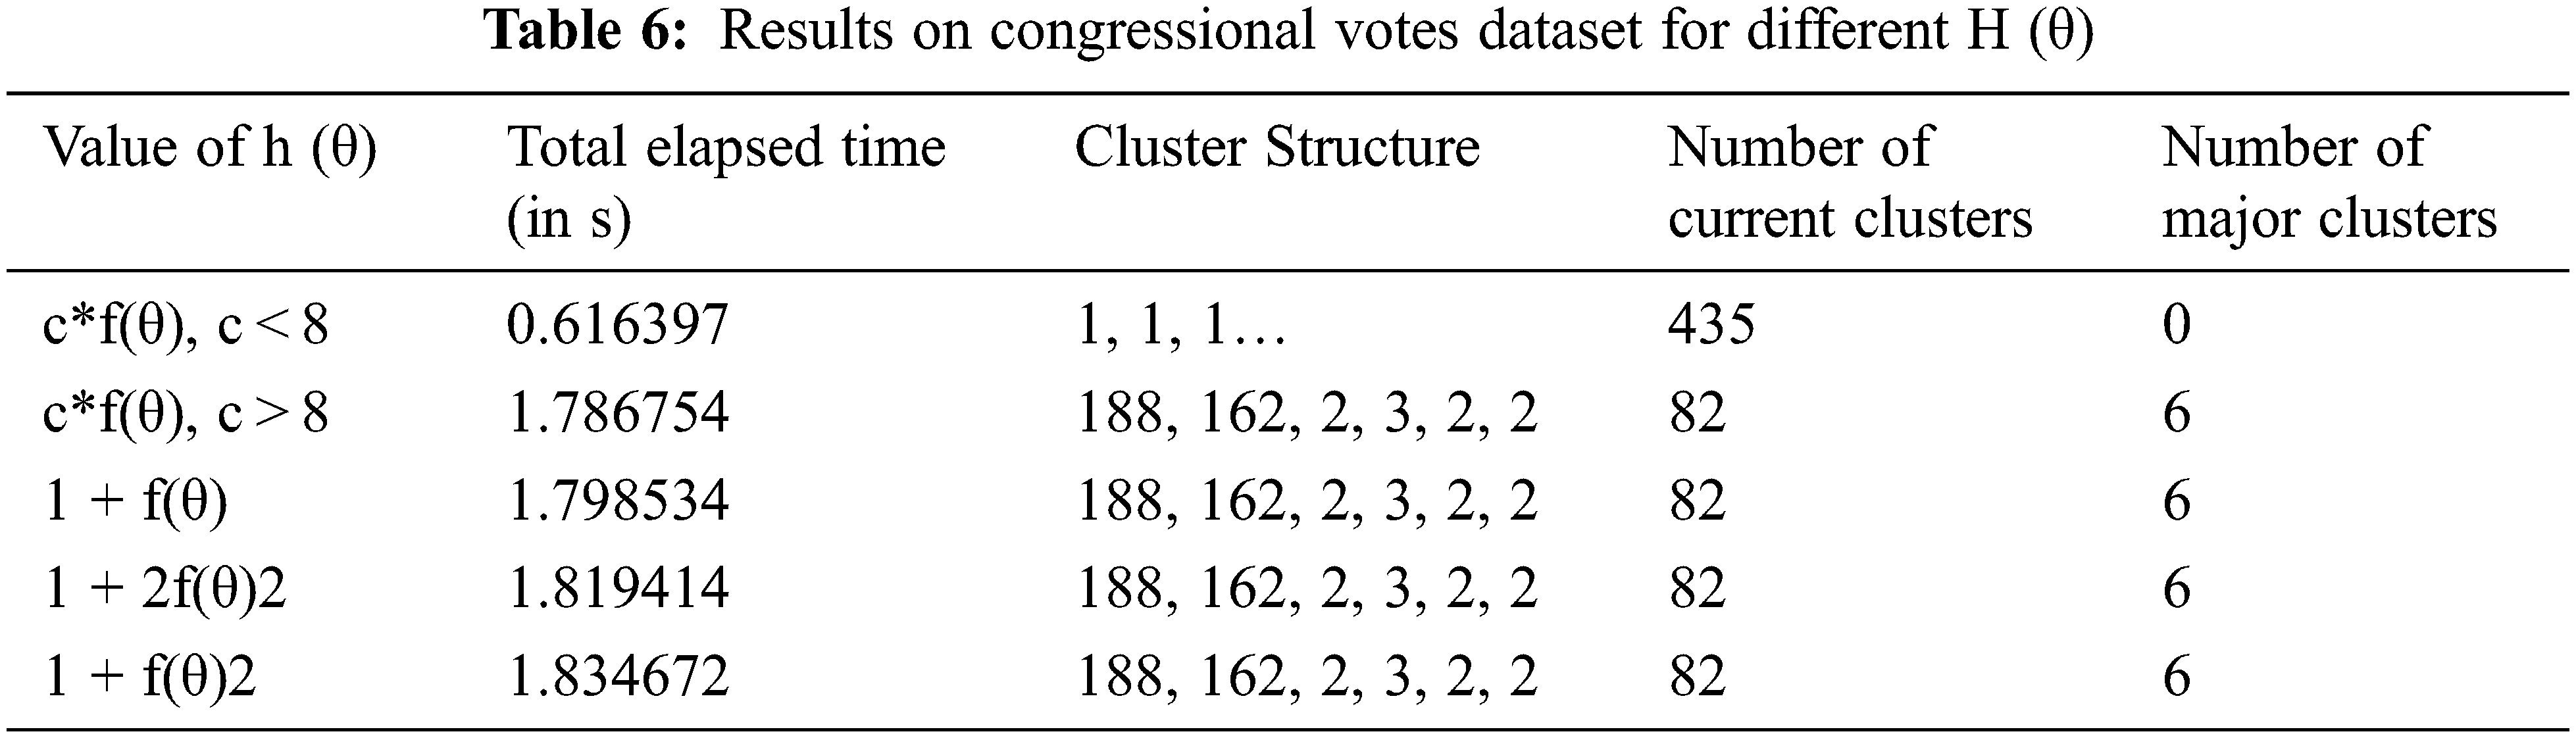
Tab. 6 shows the tabulated results of experiments performed on the Congressional Votes dataset for different h(θ) at θ=0.75. For the first function h(θ) = c*f(θ), no values of c < 8 could produce better result. Rest all the results are the best that can be achieved, exhibiting no impact of changing definitions of h(θ).
4.5 Experimental for Goodness Measure
Reference [22] defined the Goodness measure as a criterion for measuring the “goodness” of clusters with high-quality clustering obtained for the highest values of good measure. HYPOTHESIS 5 discusses the impact of links and other factors in the expression for good measure function.
The impact of other factors on the clustering results of the real-life datasets can be observed through Tab. 7. Experiments for good measure have also been performed on the Mushroom dataset [23]. This dataset gives details about the physical characteristics a mushroom possesses with all attributes of categorical nature. The attributes can be size, shape, odor, and color. A data record contains all the physical characteristics and a poisonous or edible label for each mushroom. With the total number of 8124 records, the number of poisonous and edible mushrooms in the dataset is 3916 and 4208. The threshold values for the Soybean Small, Congressional Votes, and Mushroom Datasets are kept fixed at 0.75, 0.75, and 0.7, respectively.
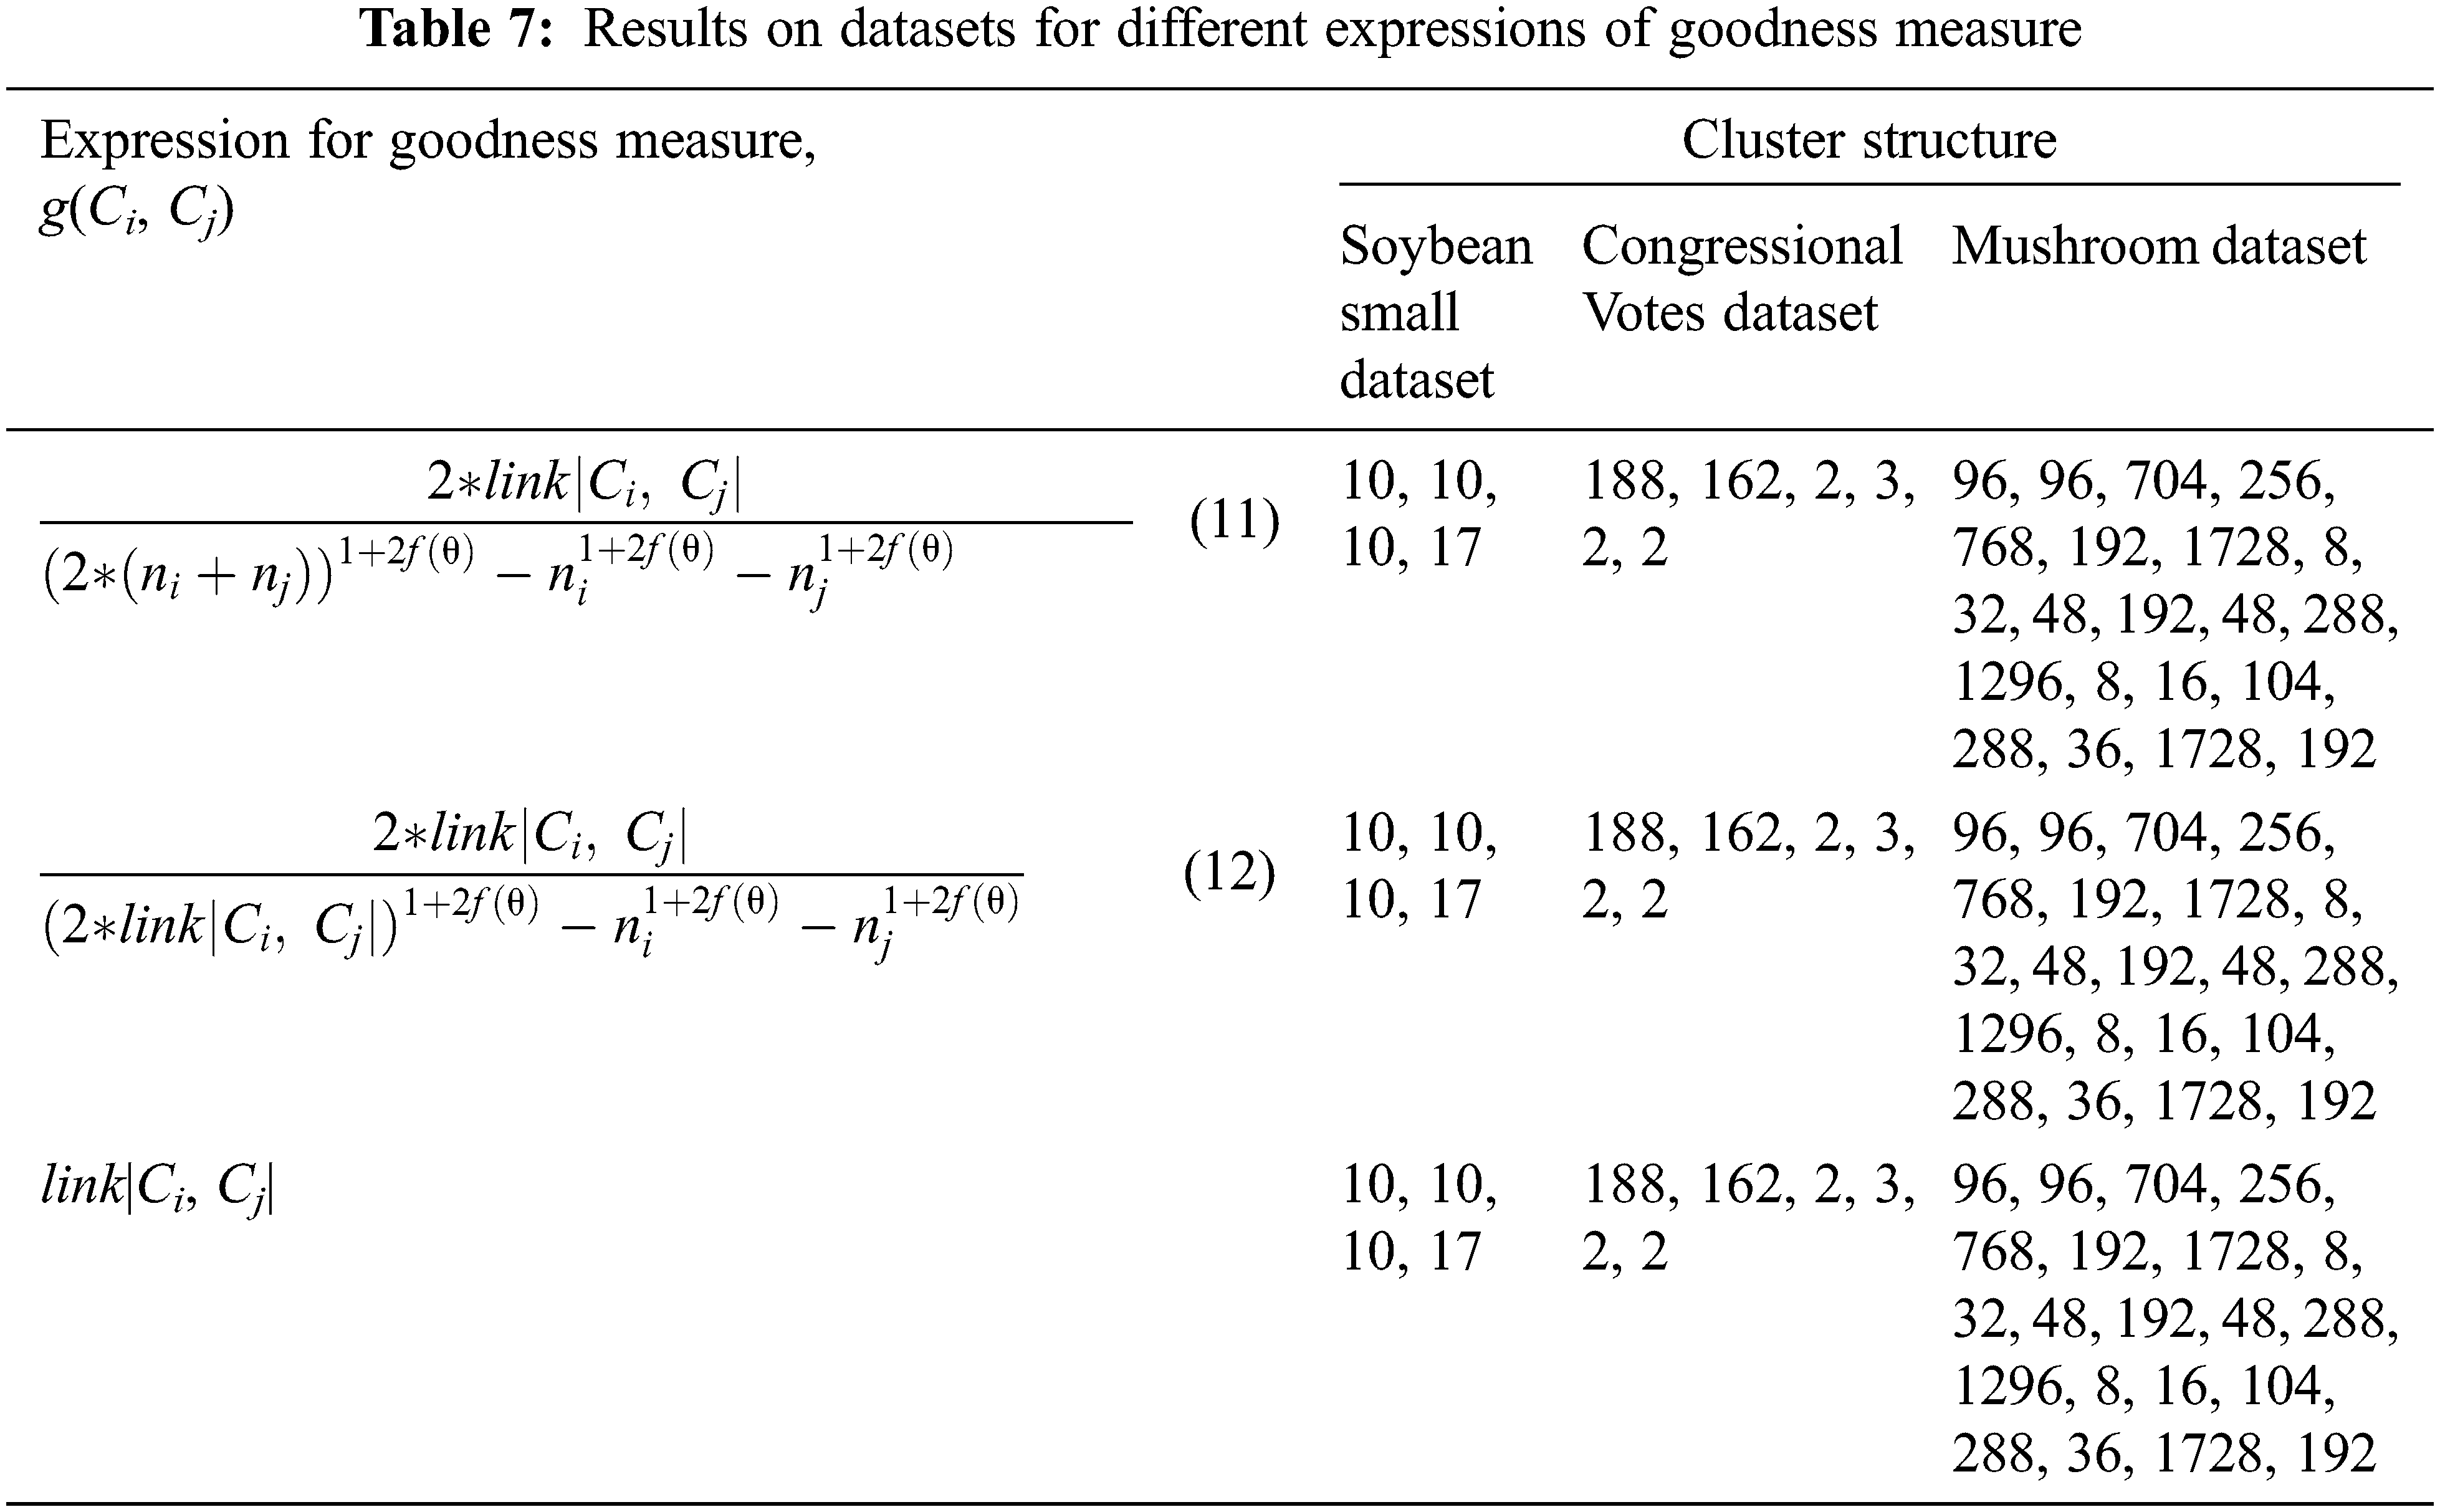
The results obtained are the best clustering results for each real-life dataset, proving HYPOTHESIS 5.
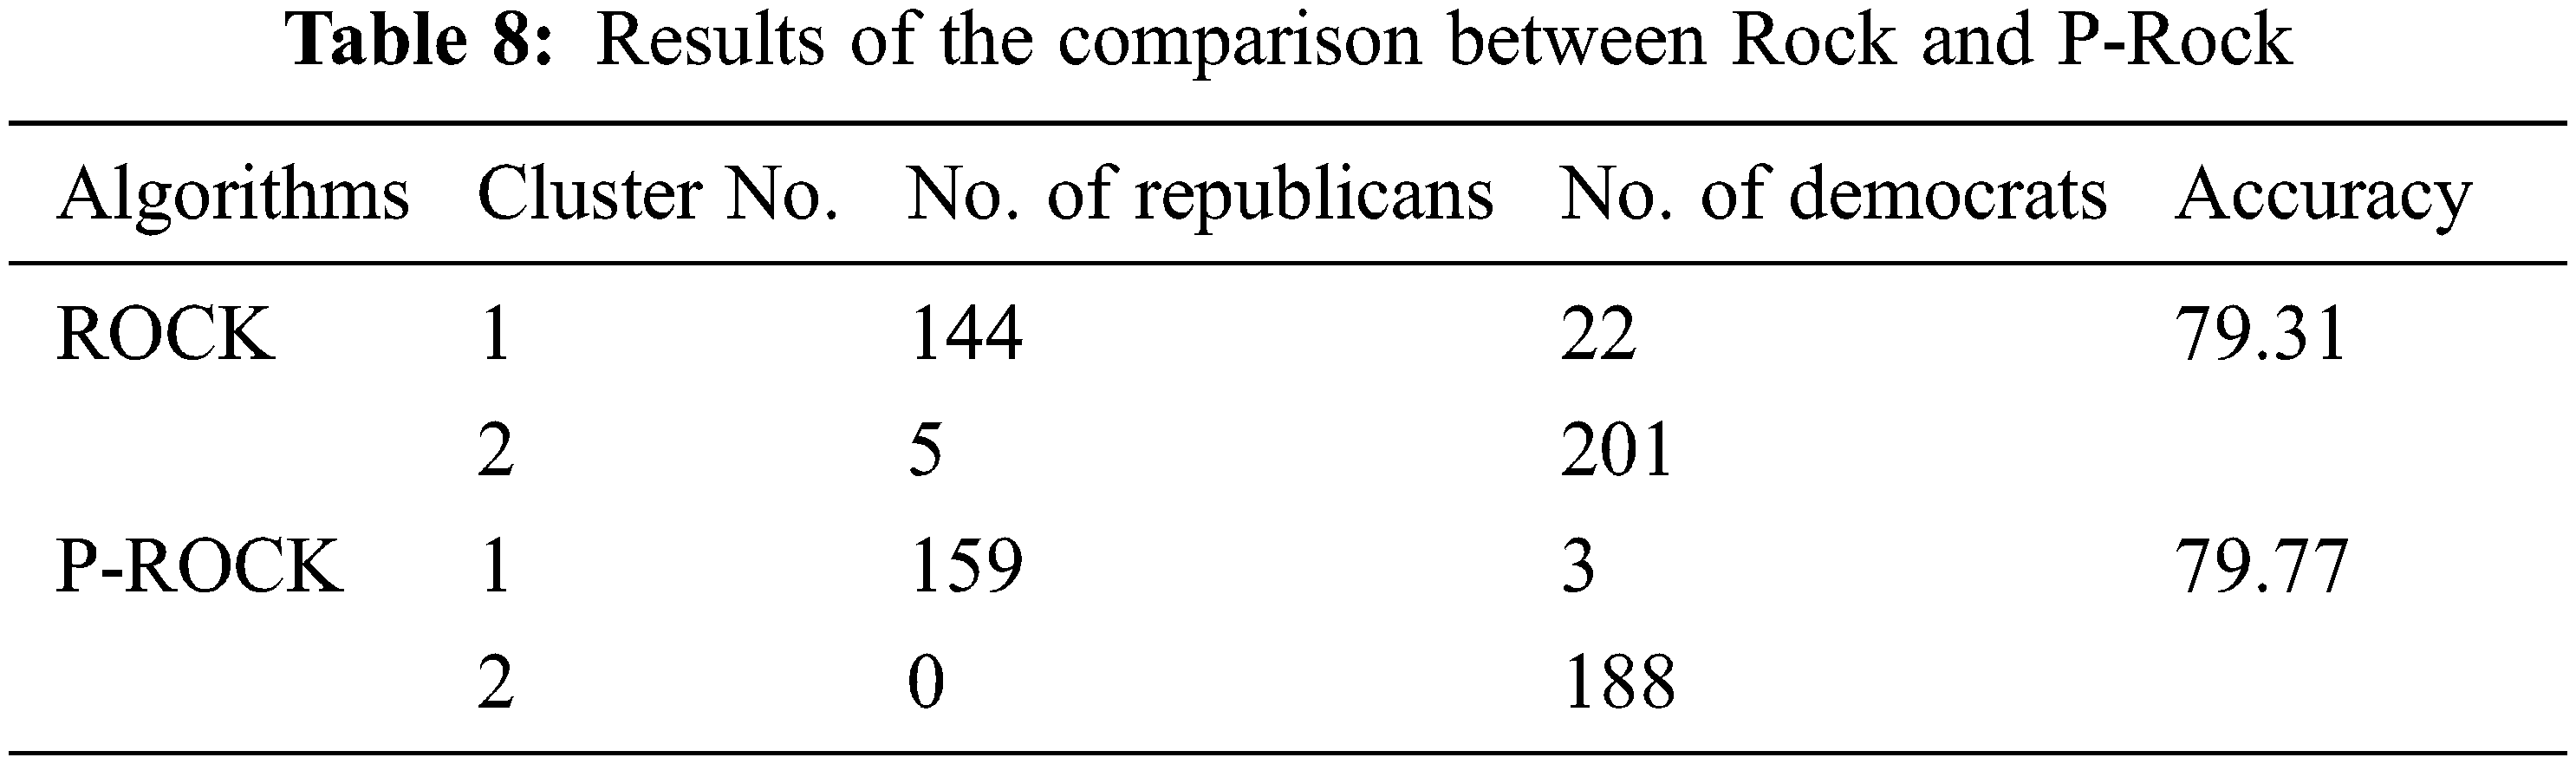
The proposed algorithm PROCK is a modification of ROCK [24]; hence, both performances should be compared. Taking the results published in [25,26] for the Congressional Votes dataset, Tab. 8 shows the cluster structures obtained by ROCK and P-ROCK. The number of members in the two major clusters and their class is recorded. Accuracy can be obtained from this information using.
In a scientific report of the ROCK algorithm [27], the researchers present the results of a sensitivity analysis conducted to determine the impact of input factors on rock mass classification. A new research study provides [28] a new point cloud segmentation technique employed in the boulder detecting application. The approach is built with features from the Point Cloud Library (PCL), and it is compared to other PCL methods.
The significant modifications are done in the original ROCK algorithm, and the conclusions from the experimental results are listed below.
1. A new parameter h(θ) indicating the function used as an exponential factor in goodness measure is identified.
2. All ROCK algorithm parameters are combined as user-defined inputs to the algorithm, except for the similarity and good measure formulas.
3. The parameterized version of the ROCK algorithm, P-ROCK, is proposed.
4. Hypotheses are verified through experimental results.
5. Increasing the threshold value above the optimal decreases the algorithm’s runtime and produces many small clusters. Decreasing the threshold value below the optimal increases runtime and produces few significant clusters.
6. There can be no universal value of θ; it depends on data characteristics. The optimal value of θ needs to be learned separately or be provided by an expert.
7. Definition of f(θ) does not affect the performance of ROCK if the constraint ‘f(θ) should be 0 at θ = 1 and f(θ) should be 1 at θ=0’ is satisfied.
8. If constraint h (θ)>1 is followed, the definition of h(θ) does not affect the cluster quality.
9. Except for link and threshold, no other parameter controls the quality of output of the algorithm.
The significant time in the ROCK and the proposed P-ROCK algorithm is spent merging the clusters. At every iteration, only two components are merged. Hence, iterations increase if a more significant number of mergeable components occur. This indicates higher runtime. Whether the components are mergeable depends on the average number of neighbors per data point. Threshold θ decides the number of neighbors. Since more components are merged, very few clusters are produced that are too big. Thus, a constant decrease in runtime is observed with the increased threshold.
Very few research works are headed in the direction of handling categorical data. Most of the proposals are extensions to the traditional algorithms handling categorical data because they are simplistic. The limitations of the existing algorithms have already been addressed, making it easier to focus just on the concept of improving them. Our work extends the ROCK algorithm to provide a parameterized version of the ROCK algorithm (P-ROCK). ROCK algorithm has been taken because of its scalability and simplicity. The overall steps of the algorithm, right from the computation of neighbors to links to merging, are simple. The runtime and accuracy of the algorithm make it scalable enough to be used for efficient clustering of categorical data. Providing flexibility to the algorithm is the aim of the paper. The same is achieved through our proposed modification of user-defined parameters as inputs, making it more flexible according to user needs. The parameters taken into account are the threshold (θ), f(θ) and h(θ). By testing the algorithm for various values and definitions of the parameters, a specific hypothesis outlining the impact of these parameters on the algorithm has been formulated. Experimental results on real-life datasets prove our hypotheses. The proposed P-ROCK algorithm with the original ROCK algorithm also provides a better insight into the proposal. The proposed modifications do not compromise the accuracy and runtime of the original ROCK algorithm.
Acknowledgement: Researchers supporting project number (RSP2022R498), King Saud University, Riyadh, Saudi Arabia.
Funding Statement: Researchers supporting project number (RSP2022R498), King Saud University, Riyadh, Saudi Arabia.
Conflicts of Interest: The authors declare that they have no conflicts of interest to report regarding the present study.
1. Y. Yang, H. Xu, Y. He and Z. Yin, “Stability analysis of earth-rock dam slopes based on big data fuzzy ant colony clustering,” in 2019 IEEE 3rd Information Technology, Networking, Electronic and Automation Control Conf. (ITNEC), Chengdu, China, pp. 2153–2156, 2019. [Google Scholar]
2. H. Jia and Y. Cheung, “Subspace clustering of categorical and numerical data with an unknown number of clusters,” IEEE Transactions on Neural Networks and Learning Systems, vol. 29, no. 8, pp. 3308–3325, 2018. [Google Scholar]
3. W. Cao, S. Wu, Z. Yu and H. Wong, “Exploring correlations among tasks, clusters, and features for multitasking clustering,” IEEE Transactions on Neural Networks and Learning Systems, vol. 30, no. 2, pp. 355–368, 2019. [Google Scholar]
4. H. Damgacioglu, E. Celik and N. Celik, “Intra-cluster distance minimization in DNA methylation analysis using an advanced tabu-based iterative k-medoids clustering algorithm (T-CLUST),” IEEE/ACM Transactions on Computational Biology and Bioinformatics, vol. 17, no. 4, pp. 1241–1252, 2020. [Google Scholar]
5. J. Liang, J. Yang, M. Cheng, P. L. Rosin and L. Wang, “Simultaneous subspace clustering and cluster number estimating based on triplet relationship,” IEEE Transactions on Image Processing, vol. 28, no. 8, pp. 3973–3985, 2019. [Google Scholar]
6. L. Kangping, C. Xin, G. Xinxin, W. Fei, L. Xiaoxing et al., “Meta-heuristic optimization-based two-stage residential load pattern clustering approach considering intra-cluster compactness and inter-cluster separation,” IEEE Transactions on Industry Applications, vol. 56, no. 4, pp. 3375–3384, 2020. [Google Scholar]
7. J. P. Dietrich, S. Bocquet, T. Schrabback, D. Applegate, H. Hoekstra et al., “Sunyaev–zel’dovich effect and x-ray scaling relations from weak lensing mass calibration of 32 south pole telescope selected galaxy clusters,” Monthly Notices of the Royal Astronomical Society, vol. 483, no. 3, pp. 2871–2906, 2018. [Google Scholar]
8. Z. Bu, H. Li, J. Cao, Z. Wang and G. Gao, “Dynamic cluster formation game for attributed graph clustering,” IEEE Transactions on Cybernetics, vol. 49, no. 1, pp. 328–341, 2019. [Google Scholar]
9. Q. Li, S. Yue, Y. Wang, M. Ding and J. Li, “A new cluster validity index based on the adjustment of within cluster distance,” IEEE Access, vol. 8, pp. 202872–202885, 2020. [Google Scholar]
10. J. Wang, C. Zhu, Y. Zhou, X. Zhu, Y. Wang et al., “From partition-based clustering to density-based clustering: Fast find clusters with diverse shapes and densities in spatial databases,” IEEE Access, vol. 6, pp. 1718–1729, 2018. [Google Scholar]
11. Y. Chen, Z. Zhang, X. Song, J. Liu, M. Hou et al., “Coherent clustering method based on weighted clustering of multi-indicator panel data,” IEEE Access, vol. 7, pp. 43462–43472, 2019. [Google Scholar]
12. C. Fahy, S. Yang and M. Gongora, “Ant colony stream clustering: A fast density clustering algorithm for dynamic data streams,” IEEE Transactions on Cybernetics, vol. 49, no. 6, pp. 2215–2228, 2019. [Google Scholar]
13. Y. Li, M. Liu, W. Wang, Y. Zhang and Q. He, “Acoustic scene clustering using joint optimization of deep embedding learning and clustering iteration,” IEEE Transactions on Multimedia, vol. 22, no. 6, pp. 1385–1394, 2020. [Google Scholar]
14. L. F. Zhu, J. S. Wang and H. Y. Wang, “A novel clustering validity function of FCM clustering algorithm,” IEEE Access, vol. 7, pp. 152289–152315, 2019. [Google Scholar]
15. V. Menon, G. Muthukrishnan and S. Kalyani, “Subspace clustering without knowing the number of clusters: A parameter free approach,” IEEE Transactions on Signal Processing, vol. 68, pp. 5047–5062, 2020. [Google Scholar]
16. X. Ye, J. Zhao, Y. Chen and L. J. Guo, “Bayesian adversarial spectral clustering with unknown cluster number,” IEEE Transactions on Image Processing, vol. 29, pp. 8506–8518, 2020. [Google Scholar]
17. S. Hu, X. Yan and Y. Ye, “Multitask image clustering through correlation propagation,” IEEE Transactions on Knowledge and Data Engineering, vol. 33, no. 3, pp. 1113–1127, 2021. [Google Scholar]
18. A. S. Shirkhorshidi, T. Y. Wah, S. M. R. Shirkhorshidi and S. Aghabozorgi, “Evolving fuzzy clustering approach: An epoch clustering that enables heuristic post pruning,” IEEE Transactions on Fuzzy Systems, vol. 29, no. 3, pp. 560–568, 2021. [Google Scholar]
19. N. AlKhafaf, M. Jalili and P. Sokolowski, “A novel clustering index to find optimal clusters size with application to segmentation of energy consumers,” IEEE Transactions on Industrial Informatics, vol. 17, no. 1, pp. 346–355, 2021. [Google Scholar]
20. I. Khan, Z. Luo, J. Z. Huang and W. Shahzad, “Variable weighting in fuzzy k-means clustering to determine the number of clusters,” IEEE Transactions on Knowledge and Data Engineering, vol. 32, no. 9, pp. 1838–1853, 2020. [Google Scholar]
21. L. Zhao, Z. Chen, Y. Yang, L. Zou and Z. J. Wang, “ICFS clustering with multiple representatives for large data,” IEEE Transactions on Neural Networks and Learning Systems, vol. 30, no. 3, pp. 728–738, 2019. [Google Scholar]
22. X. Chen, J. Z. Huang, Q. Wu and M. Yang, “Subspace weighting co-clustering of gene expression data,” IEEE/ACM Transactions on Computational Biology and Bioinformatics, vol. 16, no. 2, pp. 352–364, 2019. [Google Scholar]
23. Z. Wang, Z. Yu, C. P. Chen, J. You, T. Gu et al., “Clustering by local gravitation,” IEEE Transactions on Cybernetics, vol. 48, no. 5, pp. 1383–1396, 2018. [Google Scholar]
24. P. Wang and X. Yang, “Three-way clustering method based on stability theory,” IEEE Access, vol. 9, pp. 33944–33953, 2021. [Google Scholar]
25. Y. Li, J. Cai, H. Yang, J. Zhang and X. Zhao, “A novel algorithm for initial cluster center selection,” IEEE Access, vol. 7, pp. 74683–74693, 2019. [Google Scholar]
26. S. Kumar and M. Singh, “A novel clustering technique for efficient clustering of big data in hadoop ecosystem,” Big Data Mining and Analytics, vol. 2, no. 4, pp. 240–247, 2019. [Google Scholar]
27. J. Hu, T. Zhou, S. Ma, D. Yang, M. Guo et al., “Rock mass classification prediction model using heuristic algorithms and support vector machines: A case study of chambishi copper mine,” Scientific Reports, vol. 12, pp. 928, 2022. [Google Scholar]
28. S. Lampinen and J. Mattila, “Robust rock detection and clustering with surface analysis for robotic rock breaking systems,” in 2021 IEEE/ASME Int. Conf. on Advanced Intelligent Mechatronics (AIMDelft, Netherlands, pp. 140–147, 2021. [Google Scholar]
 | This work is licensed under a Creative Commons Attribution 4.0 International License, which permits unrestricted use, distribution, and reproduction in any medium, provided the original work is properly cited. |