DOI:10.32604/iasc.2023.024514
| Intelligent Automation & Soft Computing DOI:10.32604/iasc.2023.024514 | |
| Article |
Rapid Fault Analysis by Deep Learning-Based PMU for Smart Grid System
1Department of EEE, Park College of Engineering and Technology, Coimbatore, 641659, India
2Department of EEE, Alagappa Chettiar Government College of Engineering and Technology, Karaikudi, 630004, India
*Corresponding Author: J. Shanmugapriya. Email: priyanirag@gmail.com
Received: 20 October 2021; Accepted: 22 December 2021
Abstract: Smart Grids (SG) is a power system development concept that has received significant attention nationally. SG signifies real-time data for specific communication requirements. The best capabilities for monitoring and controlling the grid are essential to system stability. One of the most critical needs for smart-grid execution is fast, precise, and economically synchronized measurements, which are made feasible by Phasor Measurement Units (PMU). PMUs can provide synchronized measurements and measure voltages as well as current phasors dynamically. PMUs utilize GPS time-stamping at Coordinated Universal Time (UTC) to capture electric phasors with great accuracy and precision. This research tends to Deep Learning (DL) advances to design a Residual Network (ResNet) model that can accurately identify and classify defects in grid-connected systems. As part of fault detection and probe, the proposed strategy uses a ResNet-50 technique to evaluate real-time measurement data from geographically scattered PMUs. As a result of its excellent signal classification efficiency and ability to extract high-quality signal features, its fault diagnosis performance is excellent. Our results demonstrate that the proposed method is effective in detecting and classifying faults at sufficient time. The proposed approaches classify the fault type with a precision of 98.5% and an accuracy of 99.1%. The long-short-term memory (LSTM), Convolutional Neural Network (CNN), and CNN-LSTM algorithms are applied to compare the networks. Real-world data tends to evaluate these networks.
Keywords: Smart grid; phasor measurement units; global positioning system; coordinated universal time; deep learning; residual network–50
The smart-grid system allows two-way communication to control the flow of electricity, allowing multiple issues in the power system to be identified (Desai et al., 2019) [1]. Various Renewable Energy sources will be able to connect to different consumers through this system. Smart grids are self-healing and allow power users to have an active role in the system (Refaat et al., 2018) [2]. The controlling automation of the smart grid includes isolated microgrids, energy generation from renewable and non-renewable resources, different consumers like domestic and commercial, energy management, sensors and storage (Jamil et al., 2021) [3]. In most cases, the automation system controls all electrical parameters in the grid connection and identifies the fault or disturbance occurring in the grid system (Rivas et al., 2020) [4].
The PMU samples the analog current and voltage in synchronism with the GPS clock. It is one of the best real-time monitoring systems in smart-grid connected power systems. These phasors are well-synchronized and tend to compare two quantities in real-time (Jain et al., 2018) [5]. In addition, these comparisons tend to evaluate system characteristics such as frequency variation, MW, MVARs, and kV, among others (Rivas et al., 2020) [6]. Fig. 1 represents the functional diagram of PMU analysis and monitors the power system dynamics to induce current harmonic creation and propagation (Kumar et al., 2019) [7]. To analyze the dynamical event such as voltage, the current frequency of power transmission and distribution in the grid was carried with the traditional method by using Supervisory Control and Data Acquisition (SCADA) measurement (Liu et al., 2020) [8]. These kinds of estimations are helpful for engineers to analyze the various electrical quantities and faults (Senobari et al., 2018) [9]. But the SCADA takes 2–4 s to generate one measurement from the smart grid so, there will be a delay in fault measurement and other failures on the power system (Jakaria et al., 2021) [10]. Due to the delay, the discontinuous power supply will make the gap between the power supply and demand (Nath et al., 2019) [11]. A proposed solution for this problem includes the advanced measurement technology of the Phasor Measurement Unit (PMU). The commercial PMU can measure 120 measurements per second with high temporal resolution in the power system. PMUs can precisely time-stamp voltage and current phasors by measuring voltages and currents at main intersecting sites (essential substations) on a power grid. A machine learning system that acts as an automated and speedy method for identifying valuable grid connection failures utilizing bulk data monitoring systems alleviates this complexity.
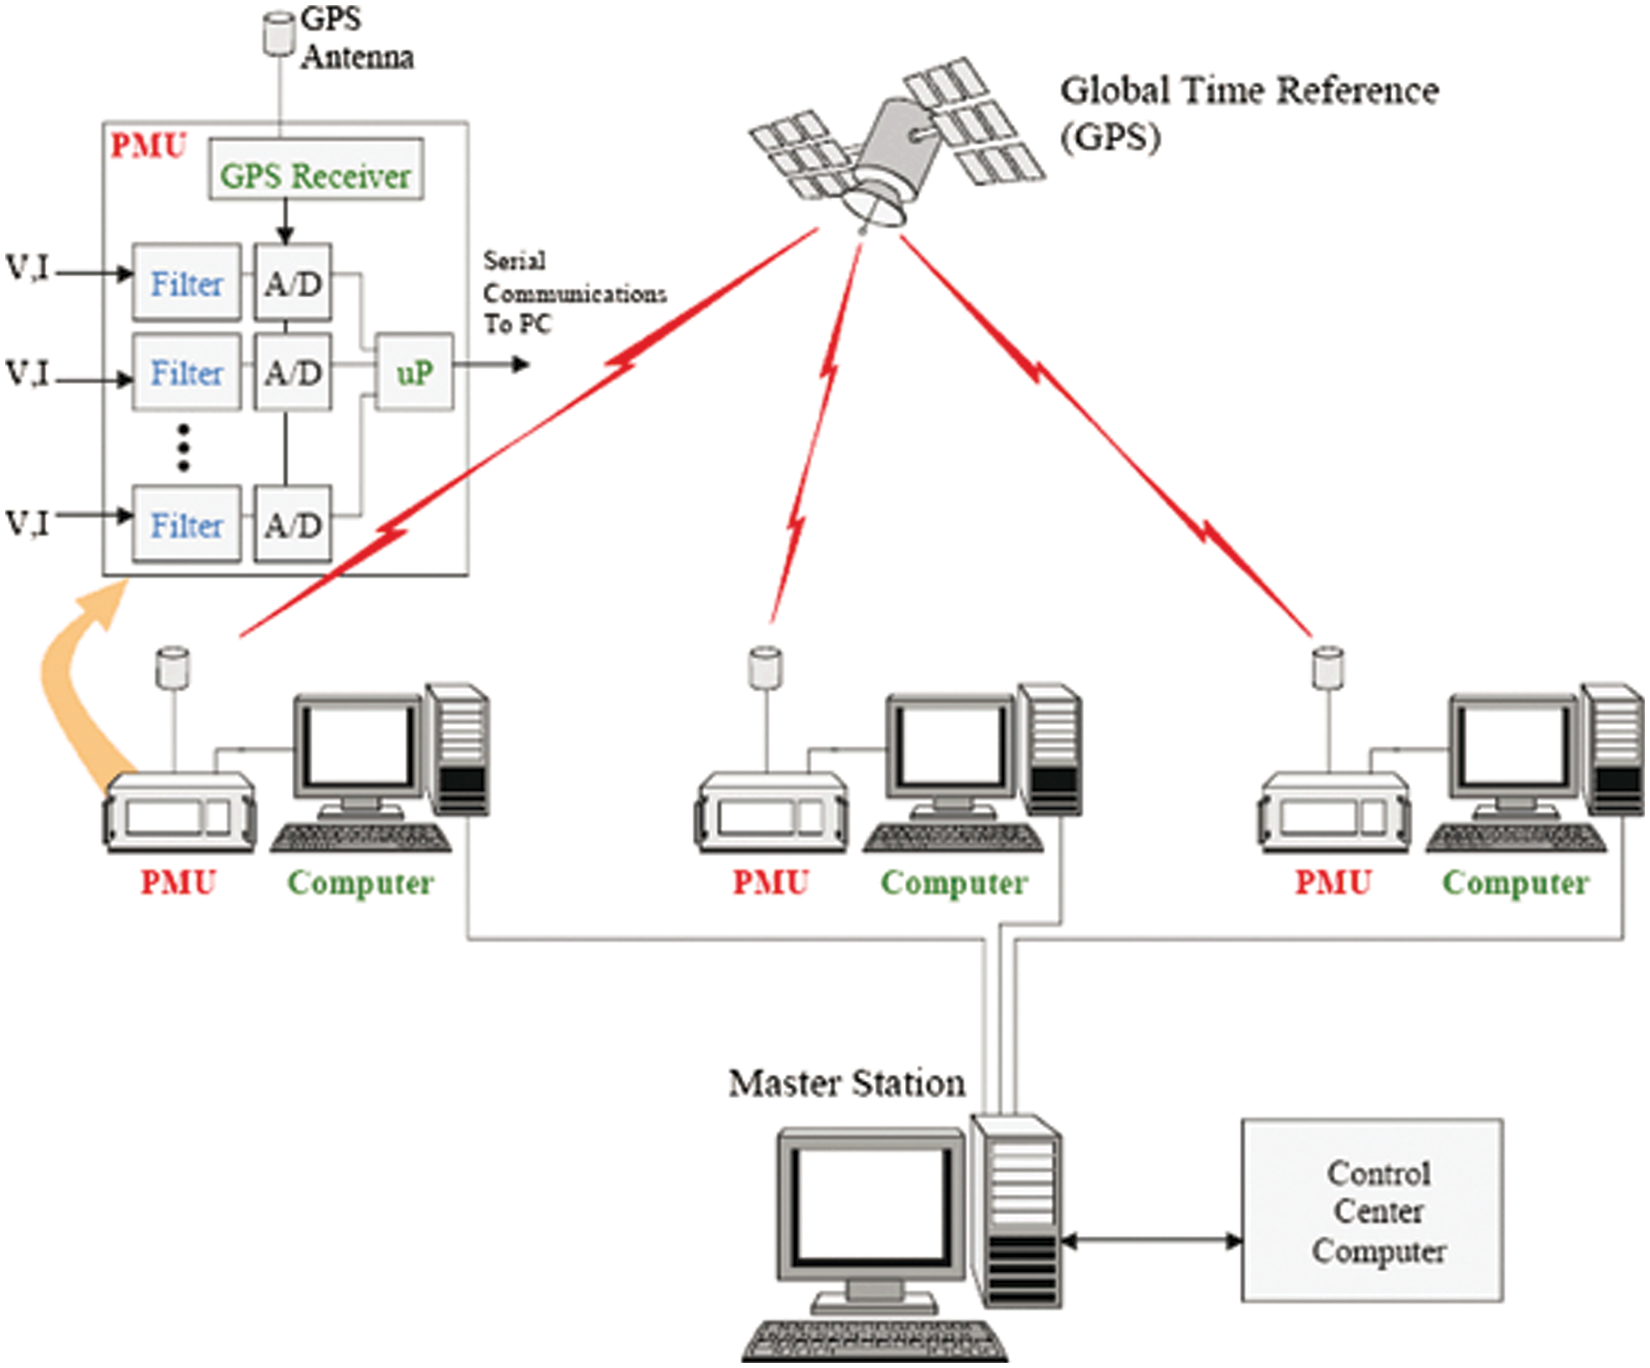
Figure 1: Functional diagram of PMU
The primary contribution of this work is briefly summarized as follows:
• To develop a Deep Learning (ResNet-50)-based Phasor Measurement Units (DL-PMU) model that can accurately identify and classify defects in grid-connected systems within an acceptable time.
• The rest of the paper is formatted in this method. Section 2 contains a review of the research used as a reference. Section 3 discusses the proposed hierarchical framework as well as data collection from PMUs. In Section 4, we discussed the proposed approach’s graphical outputs, performance evaluation, and accuracy. Section 5 comprises the conclusion of the study.
This section shows how several studies have been conducted throughout the years to classify faults in smart grids. This paper reviews and provides an overview of current developments in fault diagnosis.
Several research studies had attained on power system fault deduction and disturbance analysis in the context of smart-grid technologies. The most common disturbance in blazes in the grid is overvoltage (swell), under-voltage (sag), voltage fluctuation, interruption, transient and waveform distortion. Methods and monitoring systems are bound to identify these disturbances; this review describes the various fault analysis methods implemented in smart grids.
In an arbitrary power system, the variable fault analysis occurs through the simultaneous fault method with the help of the Java programming method for entering input data by graphical user interfacing. In addition to this, it comprises two different designs: one-directional overcurrent gets denied due to its poor tripping under short circuit conditions, and subsequent differential protection, which also has some disadvantages (Ehrenbenberger et al., 2014) [12].
The automated fault analysis occurs with different substation automation for intelligent electronic devices which operate, fault protection and fault asset management (Kezunovic, 2009) [13]. The major fault is associated with the frequency and voltage imbalance in the grid distribution system. Besides, the system designed to monitor and transport electricity, viable on the International Energy Agency (IEA). Various significant challenges occur under fault response of the smart grid system such as connection to the island, bidirectional flow, low voltage network, flashing and more occur in different renewable energy power generation (Hlalelea et al., 2019) [14]. The solid-state fault current limiter use s-transform, Hilbert Huang, Neural network for fault detection in smart grid system.
An artificial intelligence-based system that can assess grid information at any moment and estimate grid health using advanced formal models and innovative machine learning techniques like recurrent neural networks. Regular testing of grid stages is necessary, and if the present state is discovered to diverge considerably from the expected state, then careful monitoring is required (Bhattacharya et al., 2017) [15]. Using the traditional K-NN algorithm, a classification approach is developed to identify and categorize the defects in the smart grid. The principal component analysis (PCA) approach tends to reduce the dataset size in the suggested strategy, while linear discriminant analysis (LDA) gives online classification before implementing the K-NN. High impedance faults (HIFs) can arise when transmission lines are linked or grounded to each other using a high impedance connection method, making this a complicated detection procedure (Hosseinzadeh et al., 2019) [16].
However, other research on smart-grid fault diagnostics is employed. The proposed Phasor Measurement Units-Deep Learning (PMU-DL [ResNet-50]) is used to accurately and precisely classify the defect.
3 Proposed Deep Learning (Resnet-50) Based PMU Fault Classification
Normally the power system may affect various types of disturbance such as sag, swell, waveform distortion, transients, interruption and voltage fluctuation. Those disturbances are created faults in the power system and are most dangerous for grid connection. To identify this kind of fault the SCADA system was implemented in the past decay. The SCADA required skilled operators for controlling and complex for the programmer to maintain. And also, it is restricted to the supporting hardware and software. To rectify this complexity the machine learning method is suggested to carry PMU for precious fault detection in the grid connection and it works as automatic and very fast processing on bulk data monitoring system.
This section introduces the proposed PMU-Deep Learning (ResNet-50) fault diagnosis algorithm. The first half of this paper focuses on the Phasor Measurement Unit (PMU), while the second half shows how the PMU can be used in combination with the Deep Learning approach.
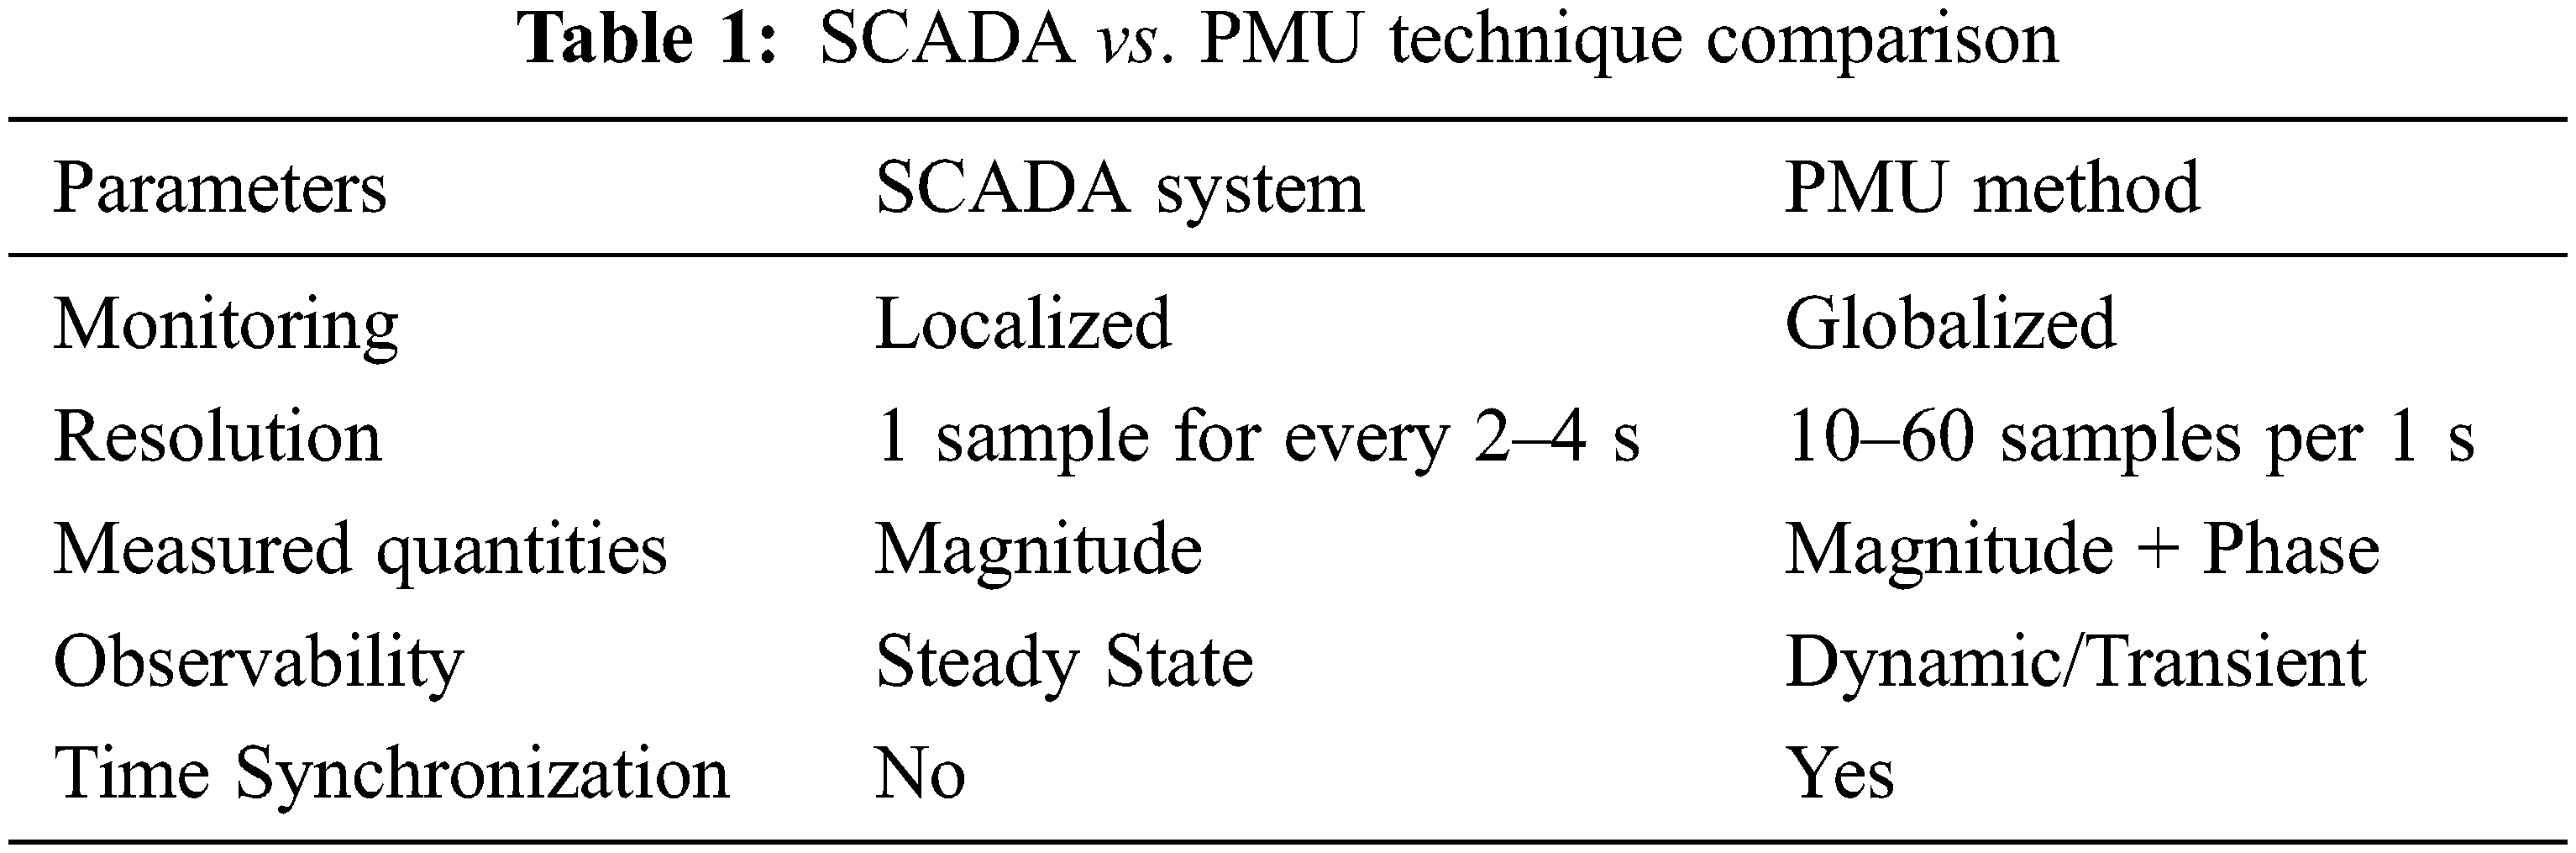
A Phasor Measurement Unit (PMU) detects electrical waveforms in a power system, specifically voltage and current signals, and can be a discrete device or a function integrated into other devices such as protective relays. Voltage and current measurements are time-stamped with high precision using a common time source given by a GPS clock allowing synchronization. Synchro phasors measurements are also known as synchronized phasor measurements, are becoming an important component of fault and disturbance analysis. Furthermore, PMUs give local measuring frequency and Rate of Change of Frequency (ROCOF). The synchro phasors provide more advanced control applications, real-time monitoring and protection which improve the functioning of electric power systems. Fig. 2 shows the frequency variation of the traditional SCADA and PMU with the sample of 50 Hz during the generator tripping. Tab. 1 shows the SCADA vs. PMU technique comparison.
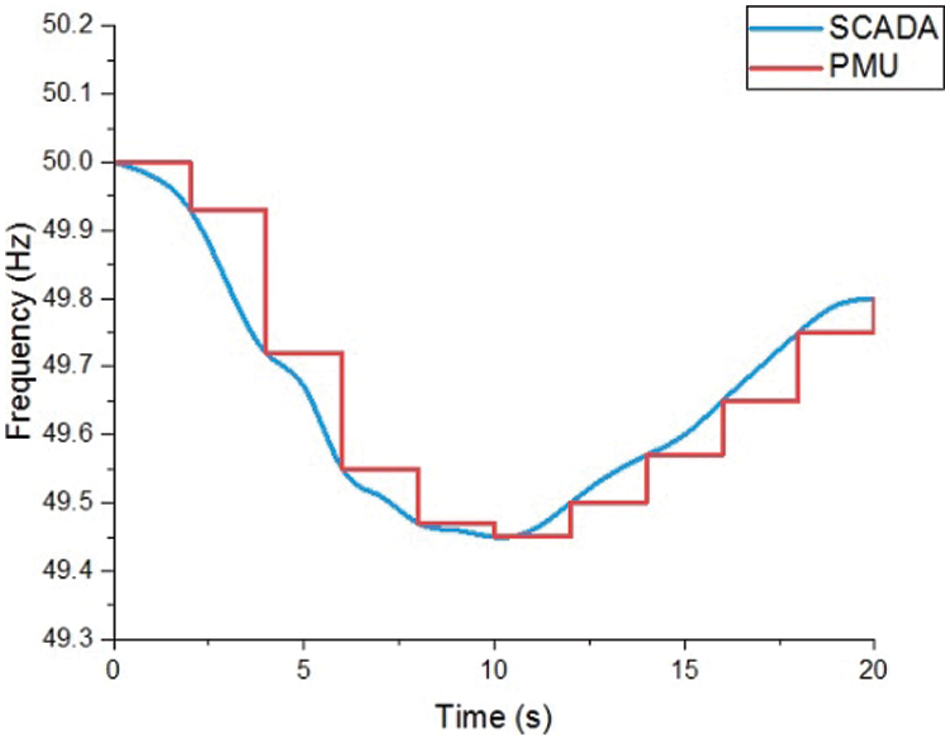
Figure 2: Generation tripping frequency variation of PMU and traditional SCADA with sampling at 50 Hz
With the constant frequency and magnitude of the sinusoidal waveform mathematical representation for the phasor is x (t);
Here the ‘
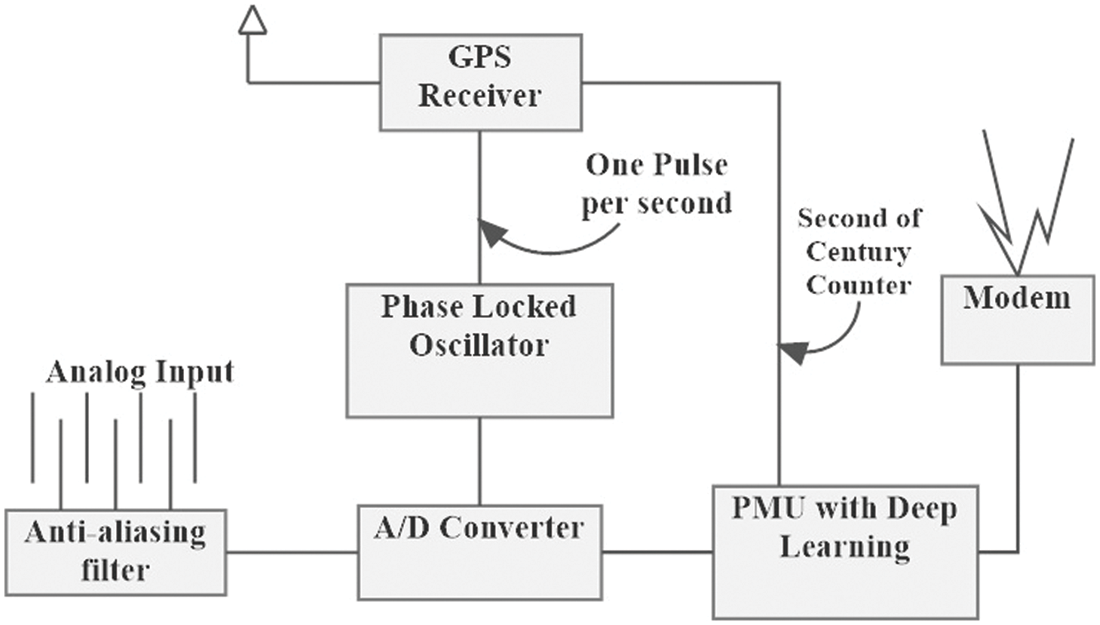
Figure 3: PMU with the deep learning process
All three-phase currents and voltages must be acquired from the relevant current and voltage transformers to compute positive-sequence measurements. The analog inputs can be obtained from a variety of locations within a substation. Anti-aliasing filters, whose frequency response is dictated by the sample rate set for the sampling process, are commonly used to avoid aliasing mistakes. However, there are some advantages to using a high sampling rate (therefore oversampling) with a high cut-off frequency. To reduce the sampling rate, a digital decimation filter must be introduced, resulting in a digital anti-aliasing filter that is concatenated with the analog ones. As a result, all analog signals have identical phase shifts and attenuation, ensuring that phase-angle discrepancies and relative magnitudes between signals are preserved. If raw data storage is available, the oversampling approach can also enable digital defect recording. It’s vital to remember that current and voltage signals must be transformed to appropriate voltages for the analog-to-digital converters to function properly. The primary function of the GPS receiver is to give the UTC clock time that is required to time-tag the sampled values. The phase-locked oscillator converts the GPS’s one pulse per second into a series of high-speed timing pulses that are employed in waveform sampling. The positive sequence of current and voltage signals is determined by the CPU. The frequency of a sinusoidal signal is assumed to be constant in phasor representations, meaning stationary sinusoidal waveforms.
As a result, phasor representations must be carefully managed in actual situations where frequency does not remain constant. When the input signal is considered across a finite data window, usually one cycle of its fundamental frequency, this is exceeded. Before determining the phasor, the PMU must perform a frequency-tracking step to estimate the fundamental frequency’s period. In addition, the PMU must filter the input signal to separate the fundamental frequency from the harmonic or non-harmonic components. The application of the Discrete Fourier Transform (DFT) to a moving window over the sampled data is the most popular technique for identifying the phasor representation of an input signal. The phasor representation is given by: for N samples taken over one period and as the
While N can be chosen arbitrarily, where,
The PMU output files are transferred through the communication media to the higher level in the system hierarchy. PMUs are the ultimate example of metering devices, and they’re usually found in power system substations. Although local applications exist, the majority of PMU data is used remotely at control centers. Fig. 4 shows the PMU measurement by hierarchy.
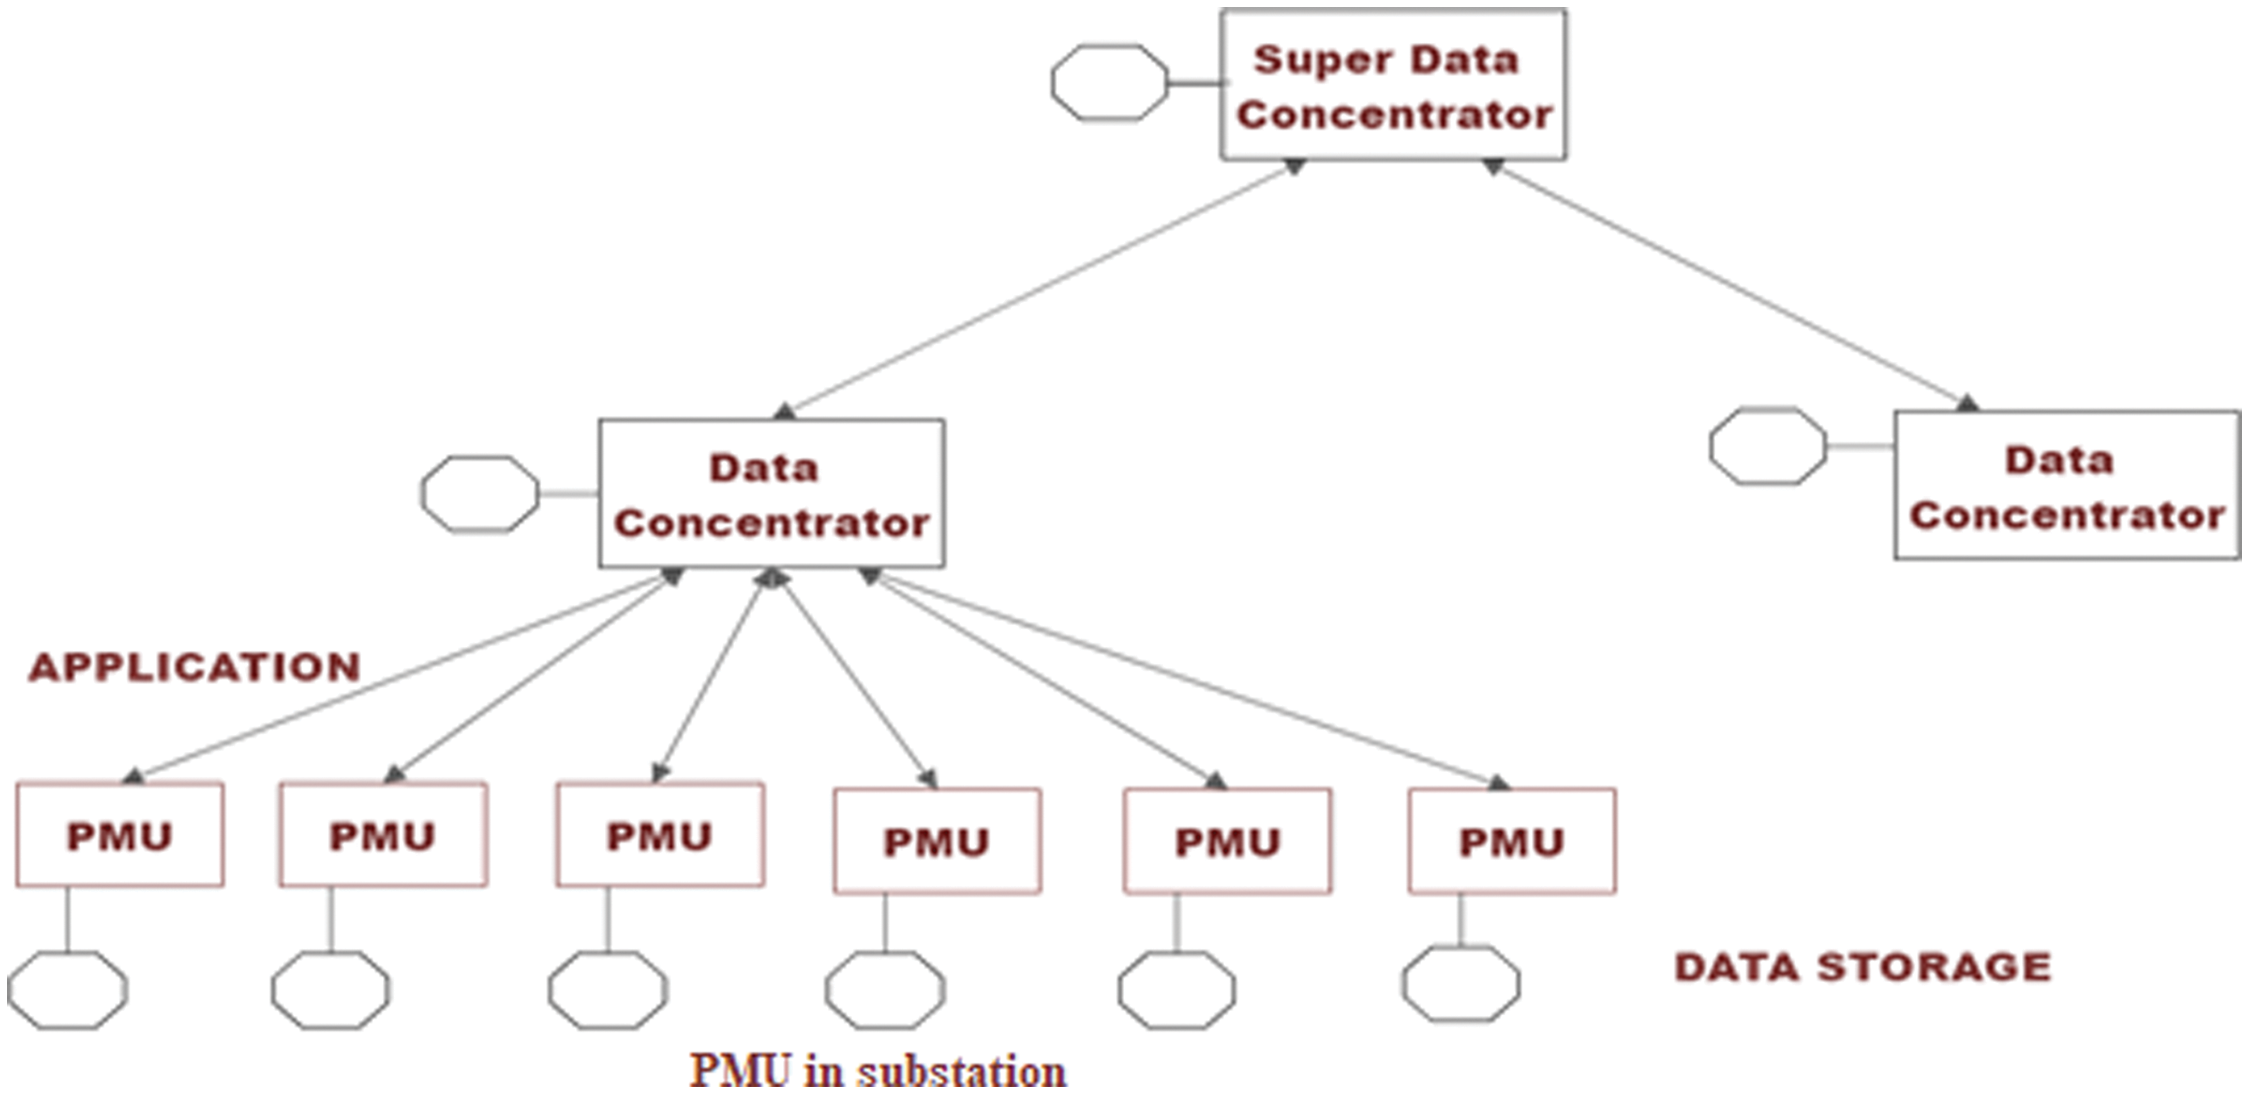
Figure 4: PMU measurement by hierarchy
As a result, an appropriate measuring system design is necessary, which includes specialized communication lines and data concentrators in addition to individual PMUs. In addition to frequency and Rate of change of frequency (ROCOF), the PMUs give time-stamped measurements of positive-sequence voltages and currents of all monitored buses and feeders in the corresponding substation. These measures can be saved for future research, such as post-mortem examination. Because the amount of data that can be stored locally is restricted, important events should be flagged for long-term preservation. Data from numerous remote PMUs are gathered at a higher hierarchical level in Phasor Data Concentrators (PDCs). The function of these devices is determined by the application. In non-real-time circumstances, PDCs typically reject poor data and save the rest for later analysis. PDCs align readings according to each time-stamp for real-time applications like network monitoring. Sorted measurements can then be sent to higher hierarchical levels like control centers, where primary PDCs or Super Phasor Data Concentrators (SPDC) are installed. Information can flow from local to global entities thanks to this hierarchical framework.
3.2 PMU with Deep Learning Process
Deep learning is a rapidly evolving topic, with new applications of its frameworks/architectures appearing regularly. The process of finding the optimum architecture is not straightforward because comparing their performance on the same datasets is not always practical or even advisable. It’s also worth noting that while Deep Learning hasn’t encountered the topic of Power Systems very often, the description provided is quite broad. Connections to Power Systems are, however, traced where necessary. That example, some architecture was created for specific tasks and may not be suitable for all. The sections that follow provide an overview of the most prominent Deep Learning Frameworks, particularly for classification tasks (the aim of this dissertation).
The structure of PMU-Deep Learning (ResNet-50) is first demonstrated for proper understanding of machine learning-based fault diagnosis. After that, the PMU-Deep Learning (ResNet-50) training approach is provided for analyzing system disturbances. Finally, the mechanism for evaluating performance for classifying faults is described. The proposed architecture is visualized in Fig. 5.
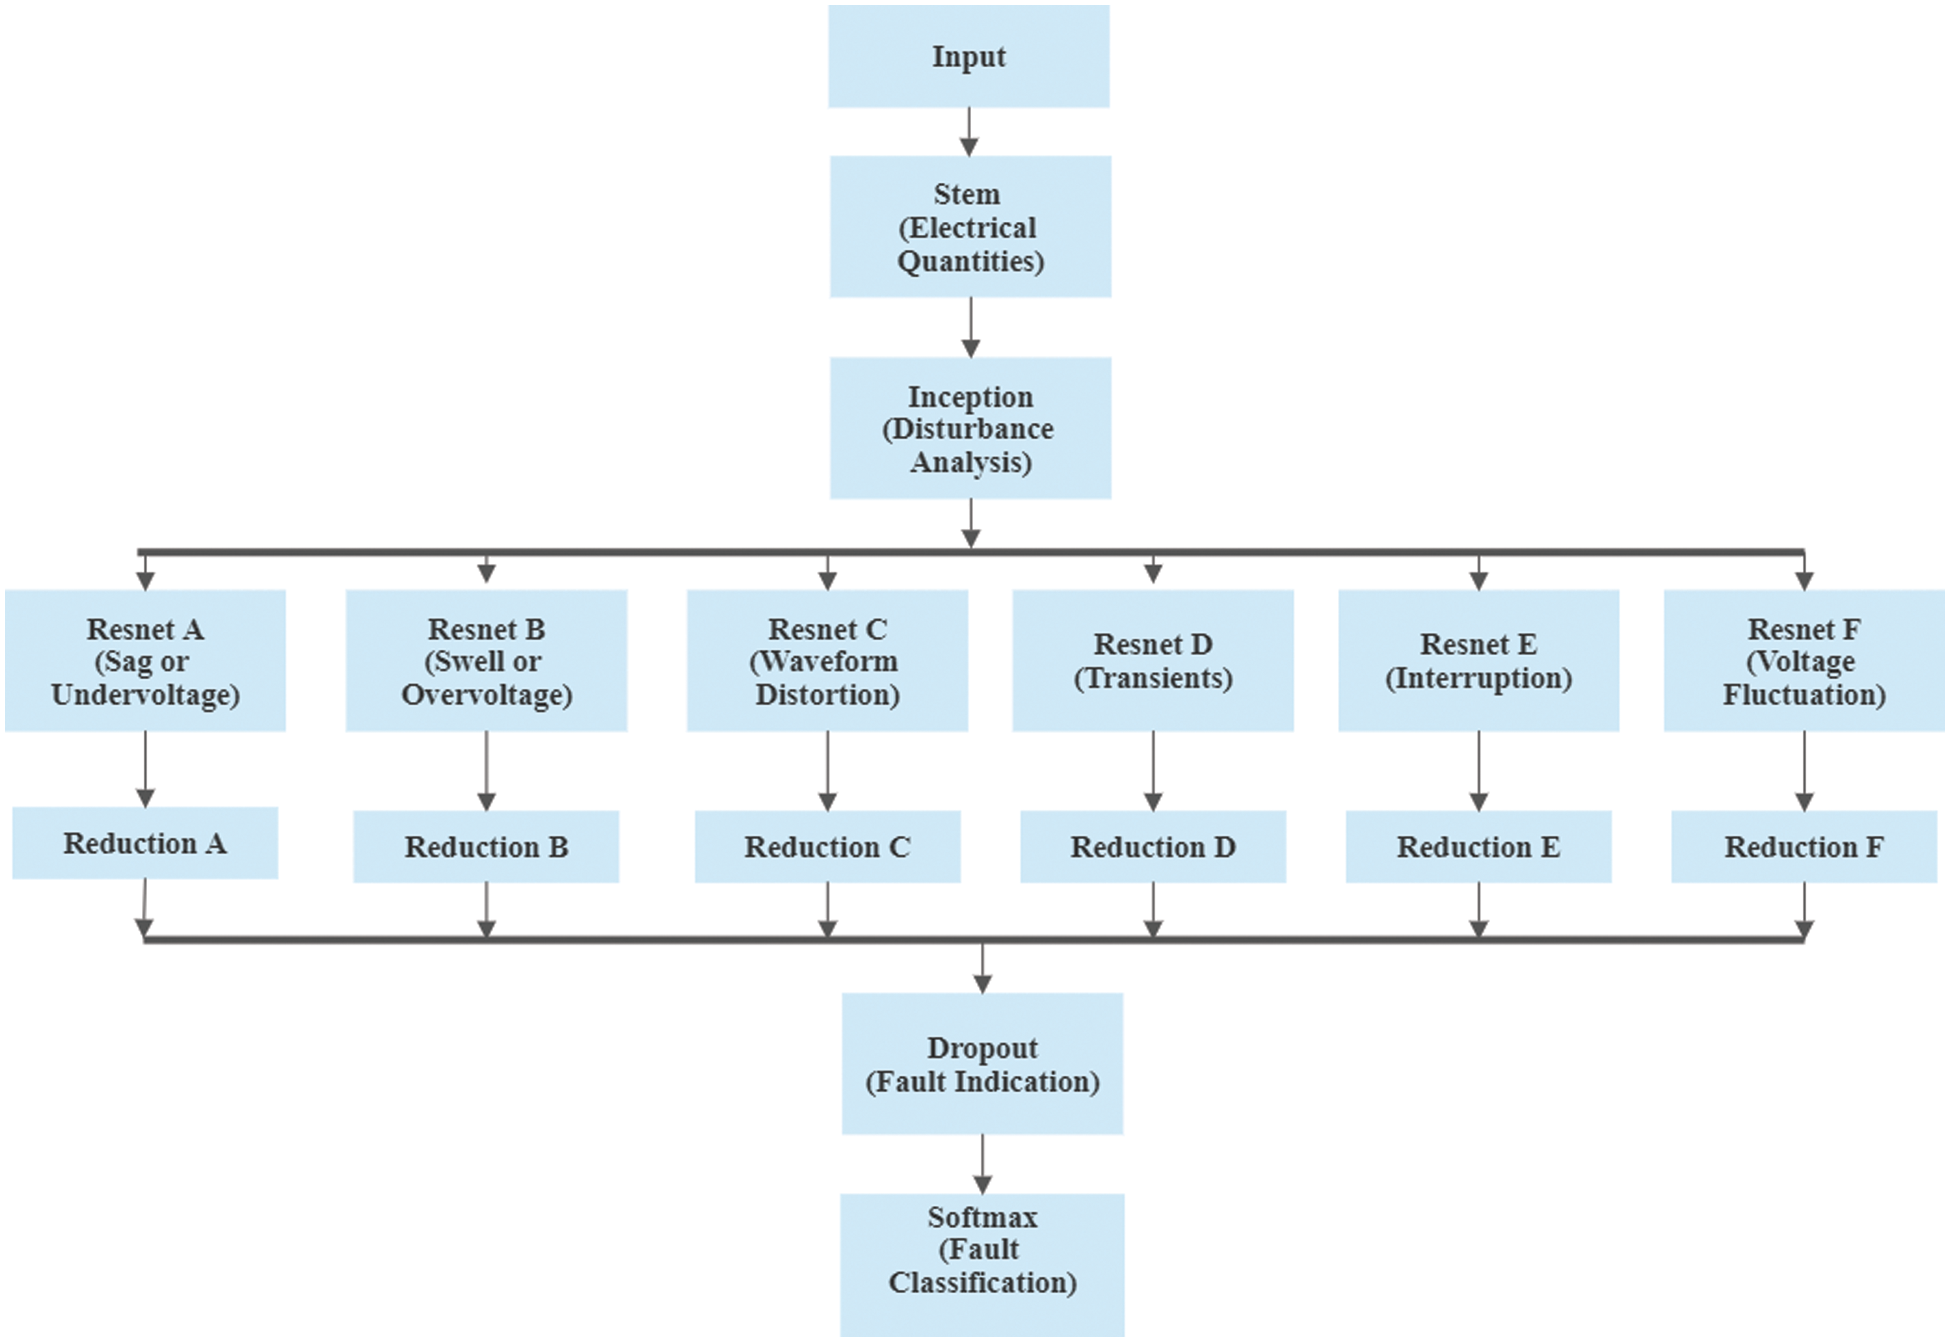
Figure 5: Proposed method of PMU-deep learning (ResNet-50)
Electrical quantities are utilized in a smart grid to characterize and analyze various problems. To distinguish fault signals, the properties of the initiation, i.e., disturbance analysis, must first be retrieved. A filter-expansion layer follows each Inception block, which is used to separate the signal based on fault analysis. This is appropriate for determining the features of the faulty signal. The primary assumption of Inception is to obtain a fault signal by injecting various faults, including sag or Undervoltage, swell or overvoltage, waveform distortion, transients, interruption, and fault fluctuation.
In this research, we utilize the ResNet-50 signal training in the field of fault diagnosis. ResNet-50 may readily achieve an accuracy as well as a significant increase in depth. Given ResNet-50’s excellent signal classification performance and ability to extract high-quality signal features, we expect the extracting feature layers of ResNet-50 will also perform well in the fault diagnostic field. Fig. 6 shows the residual’s inner structure.
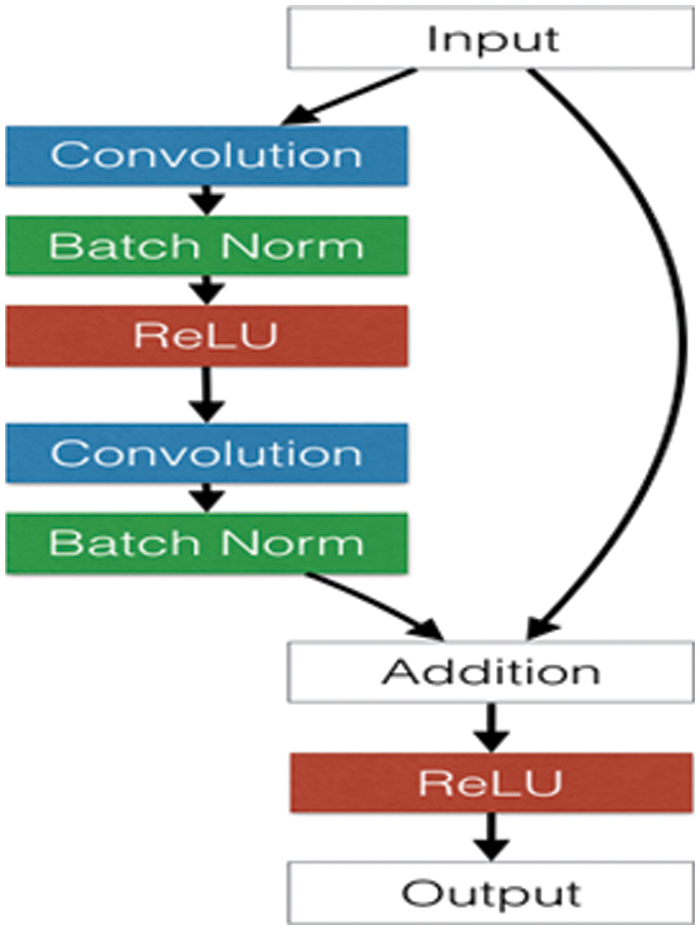
Figure 6: Residual block’s internal structure
ResNet-50’s most essential element is the Residual Network Block (RNB). RNB is based on the concept of exploiting shortcut connections to skip blocks of convolutional layers. These methods can create deeper CNN structures to improve final performance for defect fault diagnosis by optimizing trainable parameters in error back-propagation to avoid the vanishing/exploding gradients problem.
The standard two-dimensional convolutional layer (Conv2d) is a popular deep learning structure that uses the advantages of the local receptive field and weight sharing to greatly reduce free parameters in the training process and improve performance. Eq. (4) specifies the Conv2d’s specific computation process, whereas Eq. (5) specifies the Conv1d’s cross-correlation operator.
where
The pooling layer, which is usually inserted between convolution layers, is primarily used to reduce the spatial size of the feature map and effectively control overfitting, as shown in Eqs. (6) and (7) respectively. In particular, the dimension computation is identical to that of Conv1d and Conv2d. In this paper, the average pooling (
The input two-dimensional matrix’s width and height are represented by
The nonlinear activation function is used to enhance the nonlinearity of the extracted features to learn difficult and nonlinear features from the input dataset. The nonlinear activation function Rectified Linear Unit (ReLU) is utilized in this paper, as given by Eq. (8) where x is the input feature, which can substantially speed up convergence and alleviate the vanishing gradient problem. Furthermore, as compared to the Sigmoid with the exponential operation, the simple activation function with no limitations is significantly more computation efficient.
After the neural network topology has been determined, the ResNet network must be trained using the signal to detect the internal problem. The ResNet-50-based model can be used to detect and diagnose signal faults after the network has been trained. After obtaining the signal’s characteristics, a conventional approach reduction is applied to produce a fault classifier with reliable performance. The fault analysis performance of PMU-DL (ResNet-50) is achieved using a 6x reduction in this paper. The fault identification achieved after the reduction process will be evaluated by a separate dropout, i.e., fault indication. During the training phase, the dropout mechanism is used to detect and locate a failure in the grid system. Finally, in the grid-connected system, the softmax is employed to classify the fault.
The demonstration and assessment of the proposed Deep Learning (ResNet-50)-based Phasor Measurement Units (DL-PMU) approach utilizing MATLAB/Simulink on the smart grid system depicted in Fig. 7 are presented in this part.
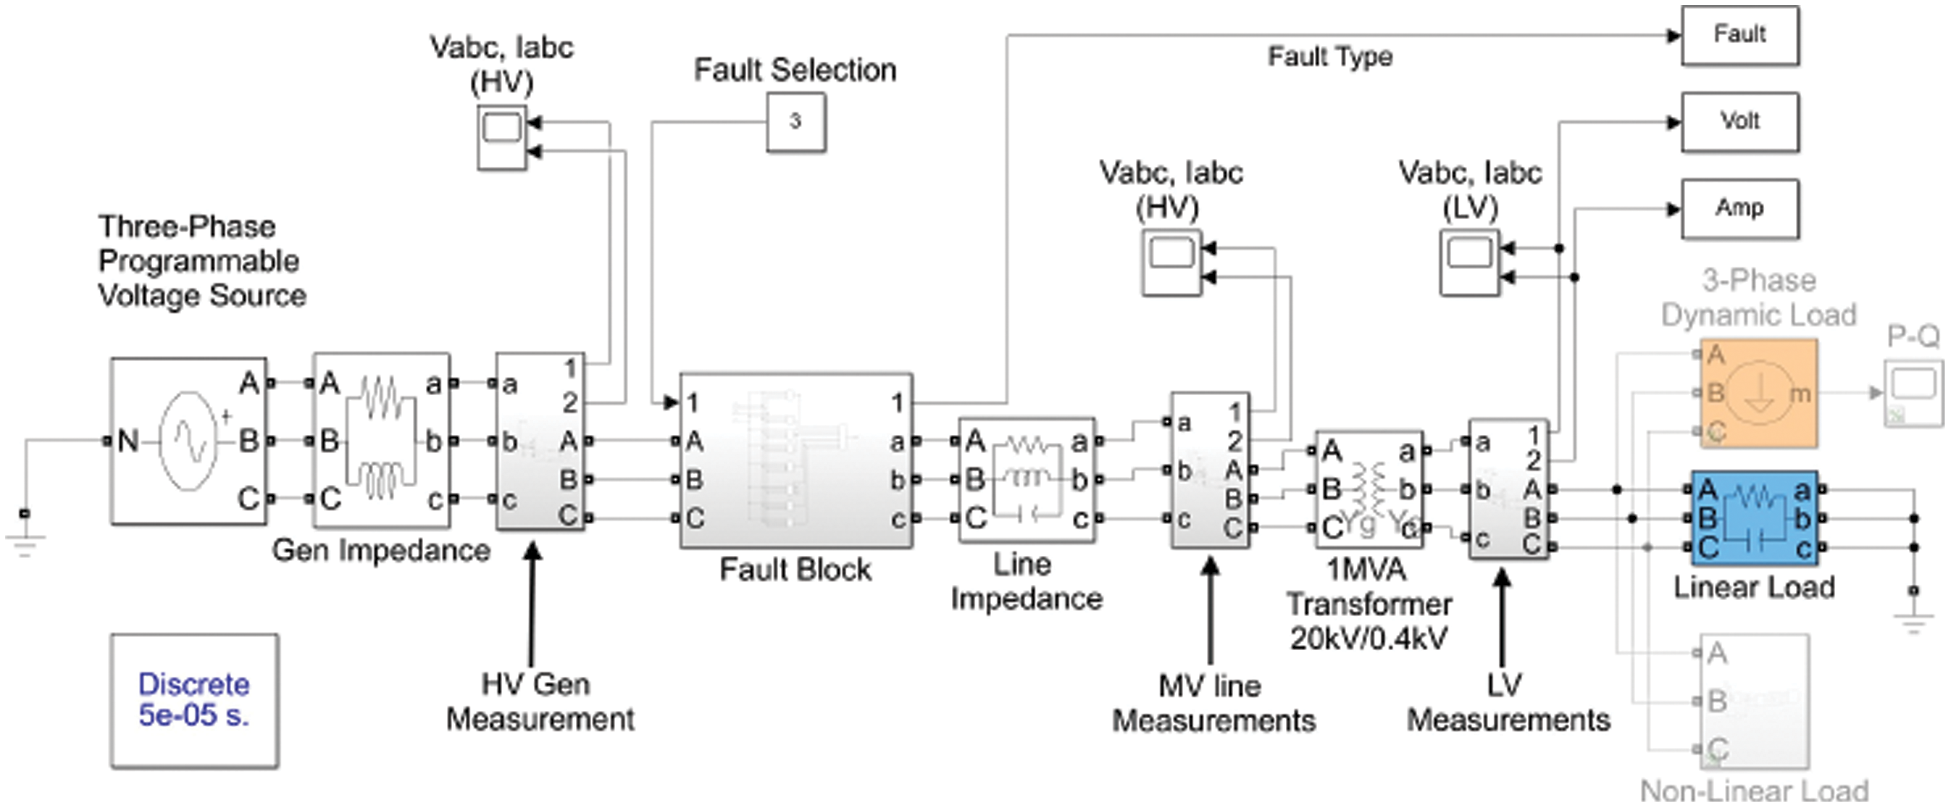
Figure 7: Simulated fault classifier model in MATLAB/Simulink
The proposal is evaluated using synthetic signals. To synthesize them, the Power Quality Disturbances (PQD) are described in this paper as sags, swells, wave distortion, transients, interruptions, and voltage fluctuation, as well as the normal state. A random sample of 100 signals is generated for each PQD. The sampling rate has been set at 6000 samples per second. In Fig. 9, each condition is visualized. The input signals are presented in the first. The second illustrates how the PMU algorithm keeps track of the magnitude of the fundamental component. The signal generated using the PMU-based model’s estimated amplitude, phase, and frequency attributes is shown in the third figure. When the original signal sags, swells, or is interrupted the generated signal varies in amplitude. The fourth diagram shows PQDs linked to non-fundamental frequency components such as transients, waveform distortion, and voltage variation. Fig. 8 depicts the magnitude tracking outcomes, which show that sags, swells, and interruptions can be identified, while the other PQDs can be distinguished from the input signal. After the PQDs have been separated, a threshold-based approach is used to classify them. Trial and error are used to identify the number of neurons in the hidden layer, to achieve the lowest overall error.
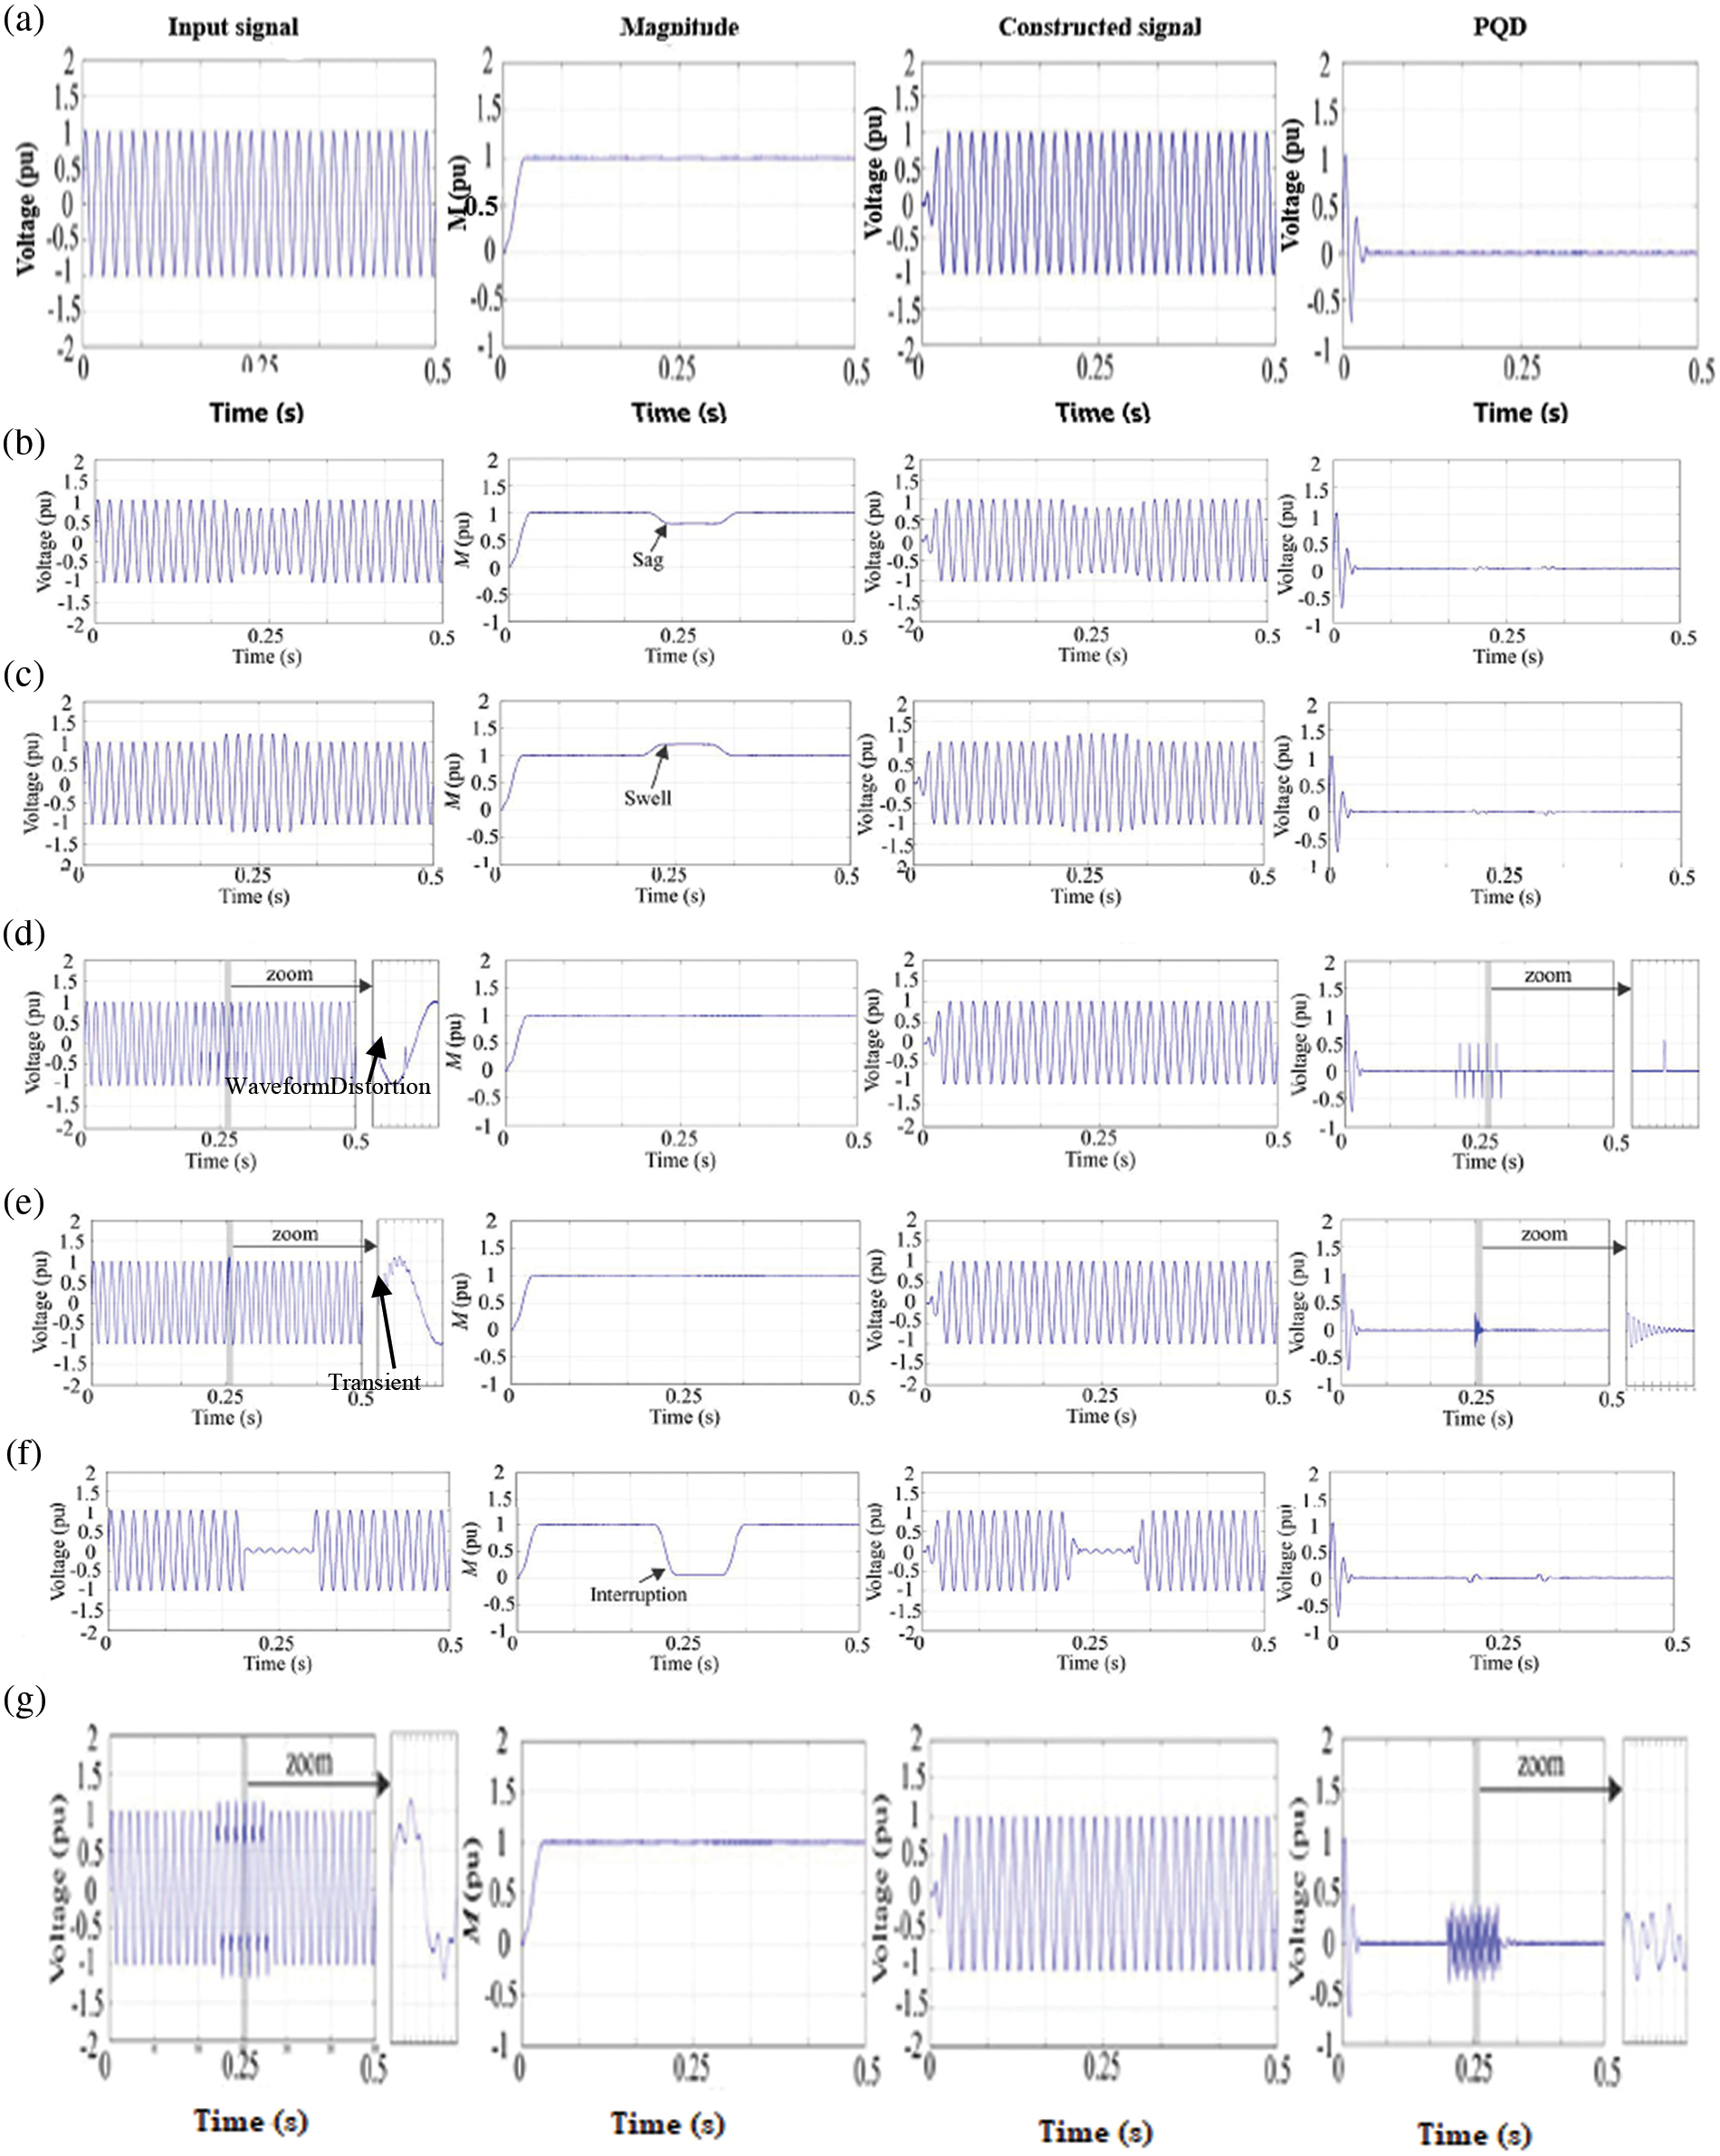
Figure 8: The synthetic signals are (a) normal condition, (b) sag, (c) swell, (d) waveform distortion, (e) transient, (f) interruption, and (g) voltage fluctuation
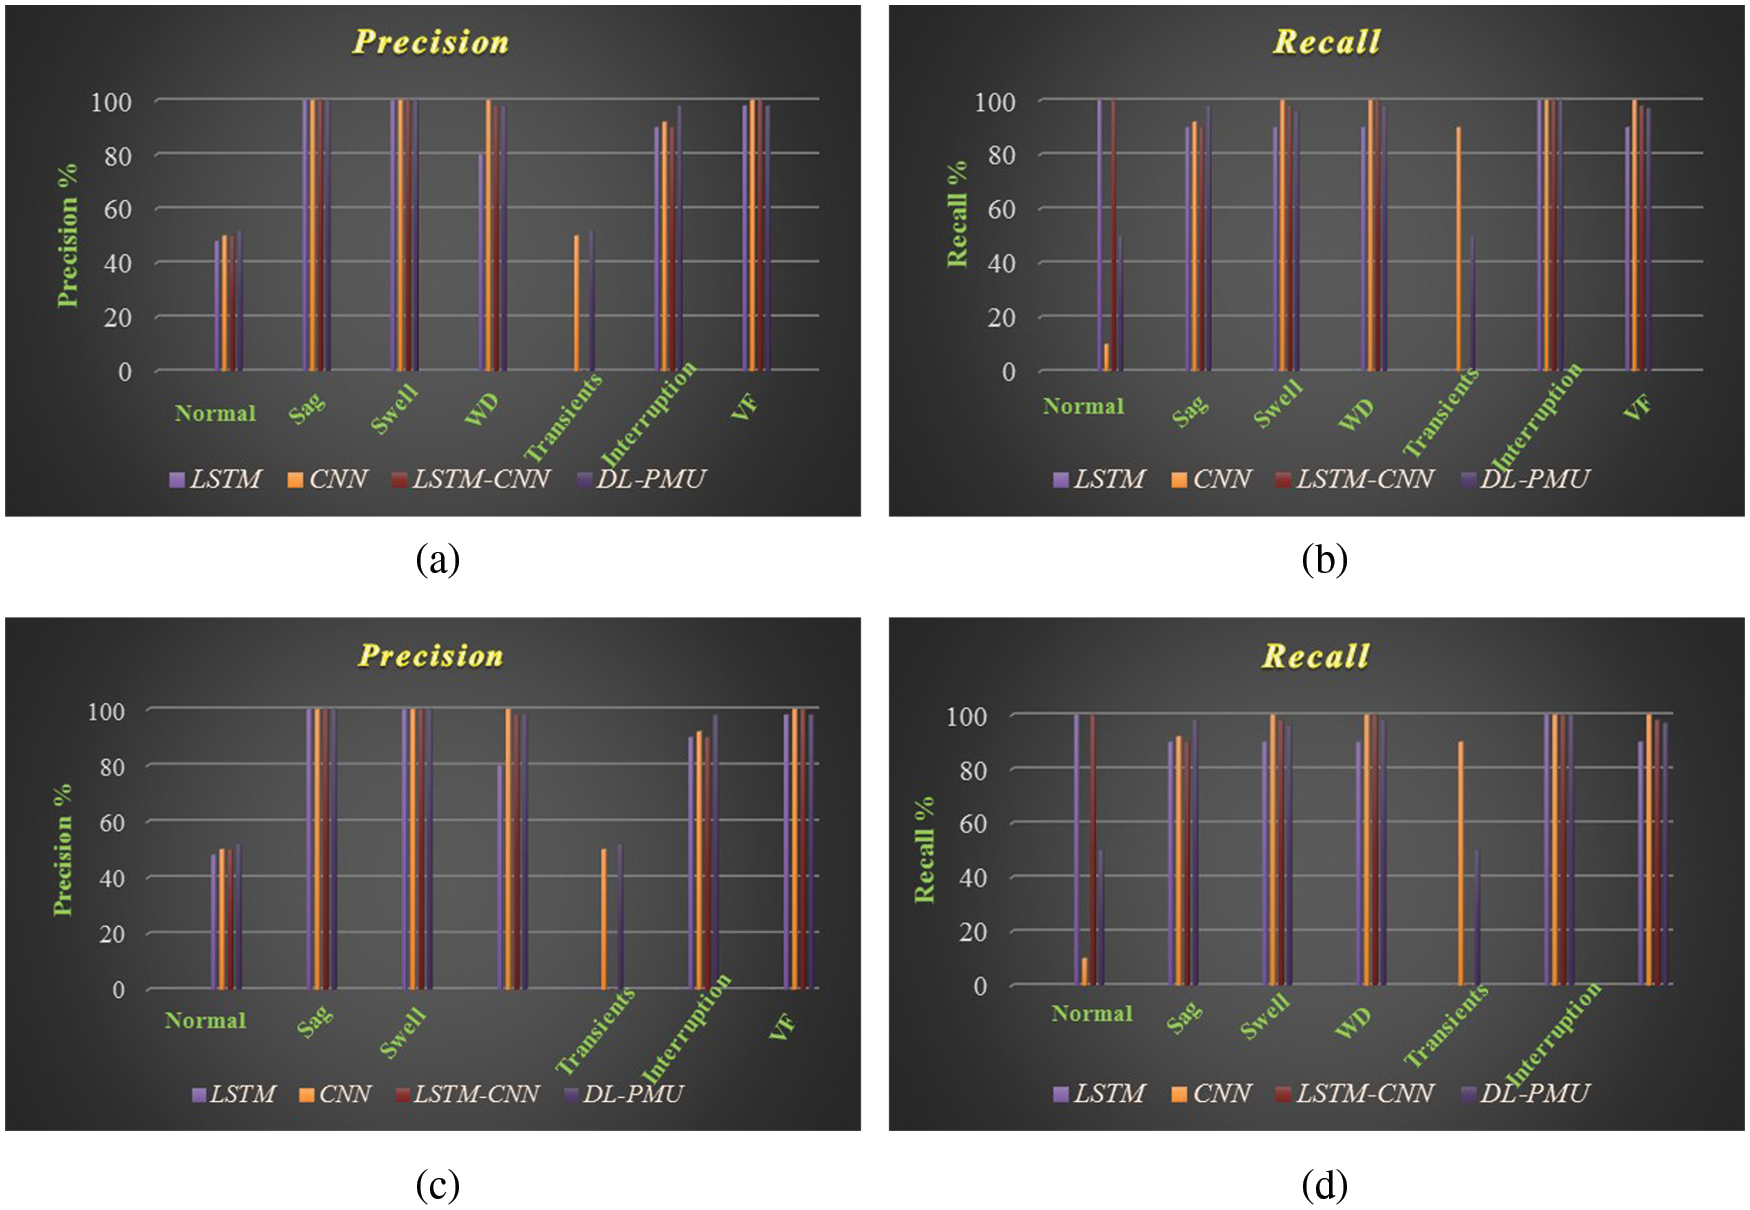
Figure 9: Comparative analysis of (a) Training data precision (b) Training data recall (c) Testing data precision (d) Testing data recall
To validate the approach, synthetic signals based on mathematical models are used. This paper considered swells, sags, wave distortion, transients, interruptions, and voltage fluctuation, as well as the nominal state. As a confusion matrix, Tab. 2 shows the classification results for all synthetic signals, with all accurate classifications in the diagonal. PQD circumstances should not be confused with nominal conditions because nominal conditions are 100% effective. Minimum efficiency of 99% is achieved for sags, swells, and interruptions (where the sag is confused with an interruption). In the non-fundamental component, PQDs have minimum effectiveness of 98%.
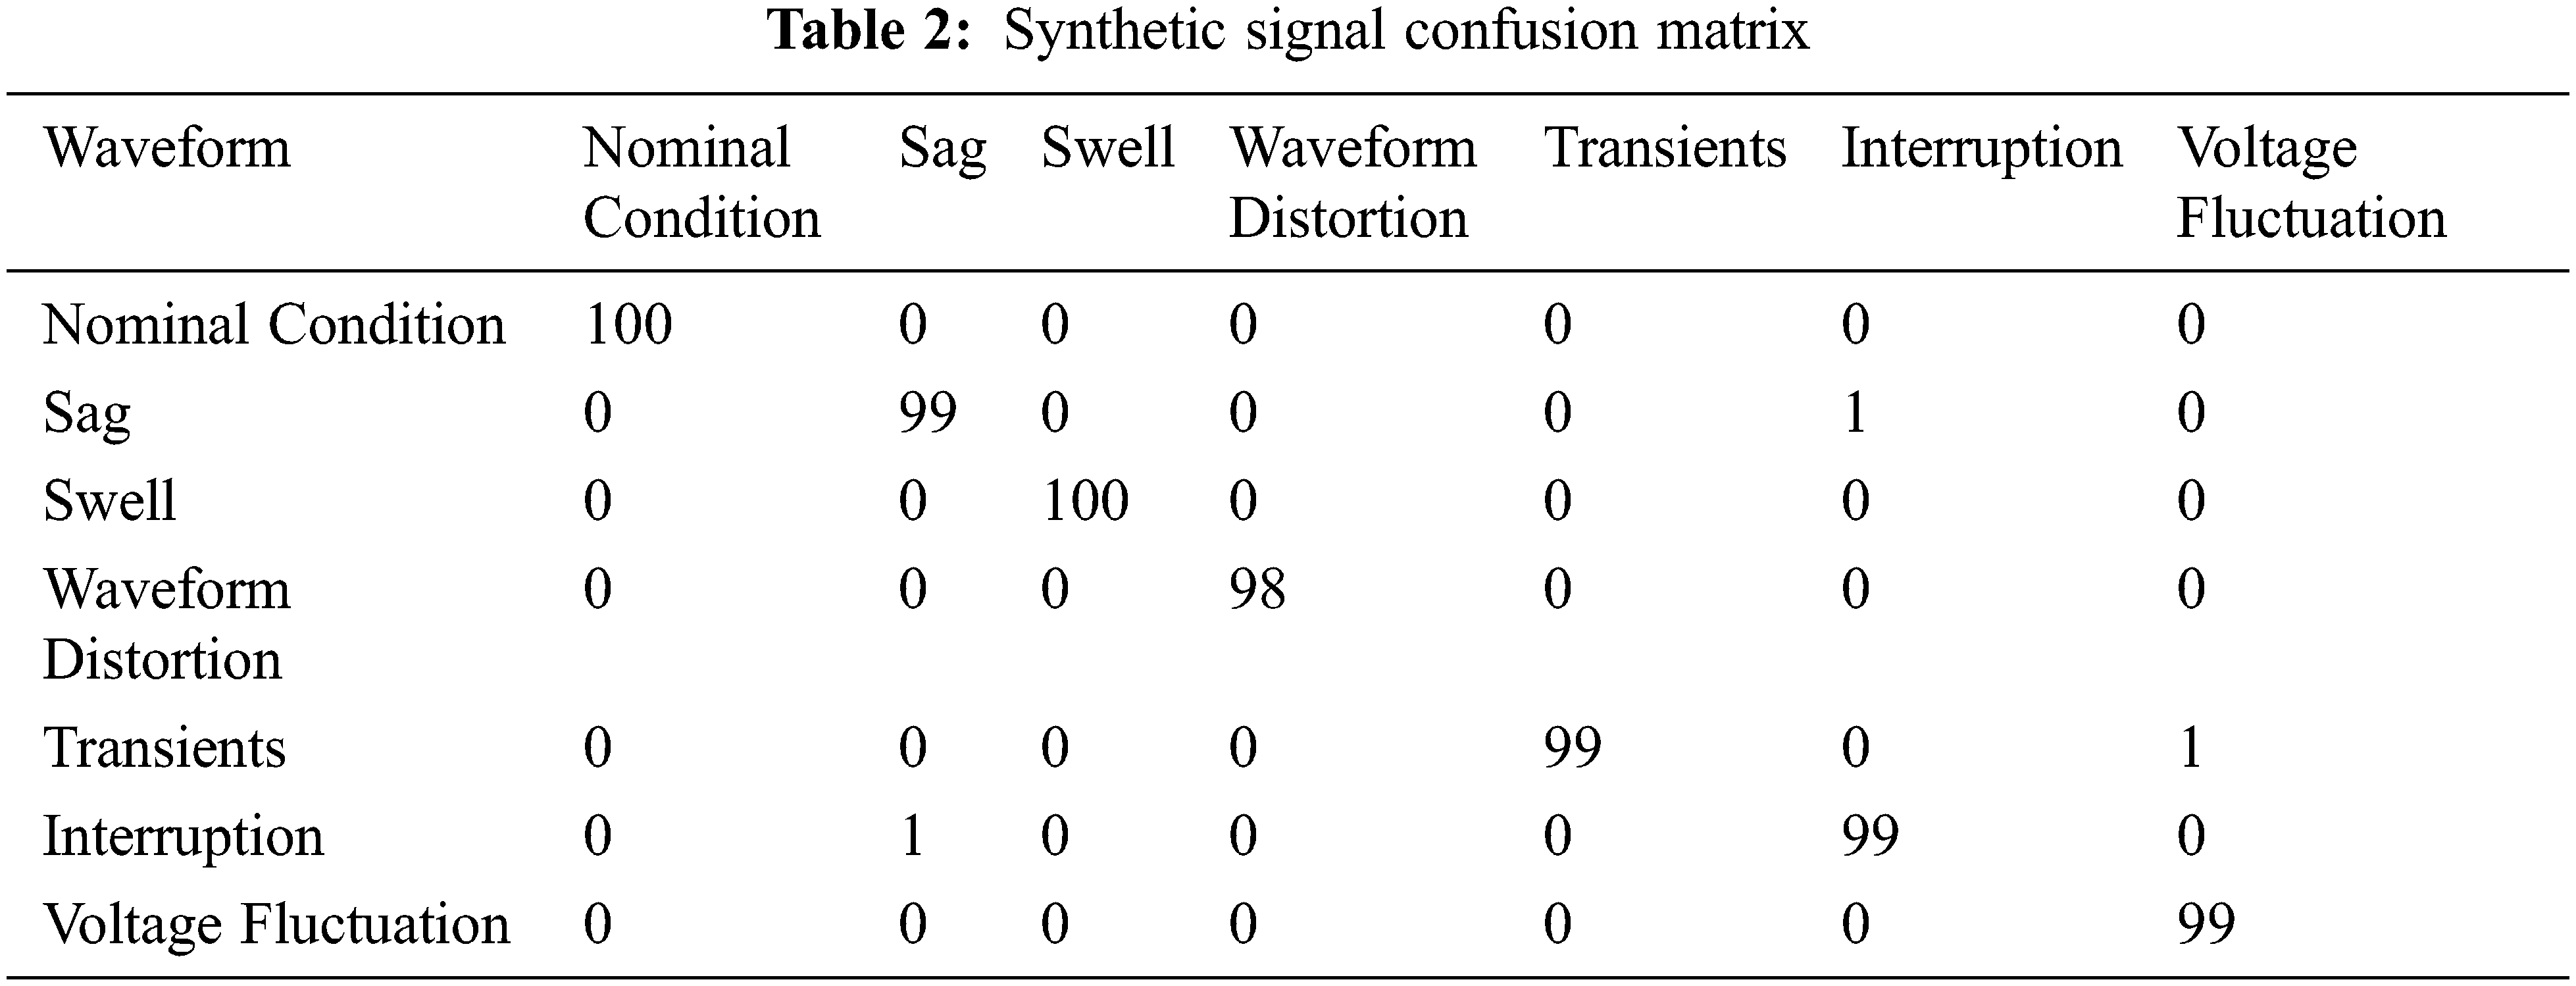
Fig. 9 shows the comparative analysis of (a) Training data precision (b) Training data recall (c) Testing data precision (d) Testing data recall. The figure compares the precision and recall of different designs. The DL (ResNet-50)-based PMU got better scores for classifying the transient in both training and testing when compared to the other designs, resulting in enhanced precision and recall.
As indicated in the precision and recall graphs, the LSTM training had an accuracy of 79.14%, with the majority of the difficulties occurring in the Transient disturbance. The LSTM classifies the Transient signal as a no-fault signal in 100% of the cases due to the failure of the design to detect the transient disturbance in both the training and validation signals. Other classes were misclassified in 10.2%–14.6%.
The CNN’s training accuracy was higher than the LSTM’s, at 84.58 percent. The difficulty with this design is that it classified 89% of no faults as transients in the training dataset but only 88.6 percent in the validation dataset. The precision and recall graphs demonstrated that the two groups had become confused once again.
Except for the transient, which had a 100% misclassification rate when compared to the LSTM, the CNN-LSTM improved the classification performance of almost all of the disturbances. Other disturbance misclassifications ranged from 2% to 10%, which was an improvement; however, the proposed architecture improved transient response recognition significantly, with a 51.1% misclassification with the no-fault condition. In both precision and recall, it revealed 50% probability of misclassification. Other disturbances have a misclassification rate of 1.3% to 4.8%, which is also an improvement. The hybrid Deep Learning (ResNet-50)-based Phasor Measurement Units approach detected the transient interruption in 48.9% of the signals where the transient was present. The other architectures failed in this attempt. Furthermore, this architecture outperformed several disturbance classifications. Our method has obtained good experimental results in the existing data sets and provides better results for the classification of a various datasets. However, owing to a lack of samples, some data sets with subtle feature patterns are frequently confused with other data sets, resulting in high error rates in particular data sets and a fall in average accuracy. As a result, in the future, we will investigate ways to increase accuracy in the event of a smaller sample size.
Furthermore, the DL-PMU (ResNet-50) outperformed several smart grid disturbance classifications.
In smart-grid, a strategy that includes the significance of fault detection and classification through Deep Learning (ResNet-50)-based Phasor Measurement Units (DL-PMU) is investigated. To generalize classification results, deep learning architectures require a large amount of data for training and validation. PQDs impersonate fundamental components (sags, swells, wave distortion, transients, interruptions, and voltage fluctuation). The proposed methodology separates PDQs with the fundamental components from non-fundamental components (oscillatory transients, harmonics, spikes and notching). A MATLAB/Simulink model was created and deployed to generate these commotions, to synthesize the signals. The datasets including LSTM, CNN, and a combined architecture using both the LSTM and the CNN examined with the DL-PMU (ResNet-50) proved to be the most effective in both simulated and experimental datasets. These results show that simulated data trains the deep learning architectures, whereas the experimental data detect and classify faults. The proposed approaches classify the fault type with a precision of 98.5% and an accuracy of 99.1%. In the future, we plan to expand our research by simulating more realistic PQD attack behaviors and determining the minimal number of sensing units required for our proposed detection technique to be successful. In addition, a hardware implementation of the idea will be created to provide an online and real-time monitoring tool.
Acknowledgement: The authors with a deep sense of gratitude would thank the supervisor for his guidance and constant support rendered during this research.
Funding Statement:The authors received no specific funding for this study.
Conflicts of Interest:The authors declare that they have no conflicts of interest to report regarding the present study.
1. S. Desai, R. Alhadad, N. Chilamkurti and A. Mahmood, “A survey of privacy preserving schemes in IoE enabled smart grid advanced metering infrastructure,” Cluster Computing, vol. 22, no. 1, pp. 43–69, 2019. [Google Scholar]
2. S. S. Refaat, A. Mohamed and P. Kakosimos, “Self-Healing control strategy; challenges and opportunities for distribution systems in smart grid,” in Proc. Compatibility, Power Electronics and Power Engineering (CPE-POWERENG 2018), Doha, Qatar, pp. 1–6, 2018. [Google Scholar]
3. F. Jamil, N. Iqbal, S. Ahmad and D. Kim, “Peer-to-peer energy trading mechanism based on blockchain and machine learning for sustainable electrical power supply in smart grid,” IEEE Access, vol. 9, pp. 39193–39217, 2021. [Google Scholar]
4. A. E. L. Rivas and T. Abrao, “Faults in smart grid systems: Monitoring, detection and classification,” Electric Power Systems Research, vol. 189, pp. 106602, 2020. [Google Scholar]
5. A. Jain and S. Bhullar, “Micro-phasor measurement units (μPMUs) and its applications in smart distribution systems,” in Proc. Compendium of Technical Papers, Singapore, Springer, pp. 81–92, 2018. [Google Scholar]
6. A. E. L. Rivas, N. D. Silva and T. Abrao, “Adaptive current harmonic estimation under fault conditions for smart grid systems,” Electric Power Systems Research, vol. 183, pp. 106276, 2020. [Google Scholar]
7. P. Kumar, P. Juneja and R. Garg, “Reliability of PMU using fuzzy markov dynamic method,” in Proc. Applications of Artificial Intelligence Techniques in Engineering, Singapore, Springer, pp. 43–53, 2019. [Google Scholar]
8. Y. Liu, L. Wu and J. Li, “D-PMU based applications for emerging active distribution systems: A review,” Electric Power Systems Research, vol. 179, pp. 106063, 2020. [Google Scholar]
9. R. K. Senobari, J. Sadeh and H. Borsi, “Frequency response analysis (FRA) of transformers as a tool for fault detection and location: A review,” Electric Power Systems Research, vol. 155, no. 9, pp. 172–183, 2018. [Google Scholar]
10. A. H. M. Jakaria, M. A. Rahman and A. Gokhale, “Resiliency-aware deployment of SDN in smart grid SCADA: A formal synthesis model,” IEEE Transactions on Network and Service Management, vol. 18, no. 2, pp. 1430–1444, 2021. [Google Scholar]
11. S. Nath, I. Akingeneye, J. Wu and Z. Han, “Quickest detection of false data injection attacks in smart grid with dynamic models,” IEEE Journal of Emerging and Selected Topics in Power Electronics, vol. 1, pp. 1–10, 2019. [Google Scholar]
12. J. Ehrenbenberger, “Fault analysis of smart grid power system employing simultaneous faults method,” in Proc. Electric Power Engineering (EPE), Brno-Bystrc, Czech Republic, pp. 95–100, 2014. [Google Scholar]
13. M. Kezunovic, “Automated fault analysis in a smart grid,” in Proc. Transmission & Distribution Conference & Exposition: Asia and Pacific, Seoul, Korea (Southpp. 1–3, 2009. [Google Scholar]
14. T. S. Hlalele, Y. Sun and Z. Wang, “Faults classification and identification on smart grid: Part-a status review,” Procedia Manufacturing, vol. 35, no. 7, pp. 601–606, 2019. [Google Scholar]
15. B. Bhattacharya and A. Sinha, “Intelligent fault analysis in electrical power grids,” in Proc. IEEE Int. Conf. on Tools With Artificial Intelligence, Boston, MA, USA, pp. 985–990, 2017. [Google Scholar]
16. J. Hosseinzadeh, F. Masoodzadeh and E. Roshandel, “Fault detection and classification in smart grids using augmented K-NN algorithm,” SN Applied Sciences, vol. 1, no. 12, pp. 1–13, 2019. [Google Scholar]
 | This work is licensed under a Creative Commons Attribution 4.0 International License, which permits unrestricted use, distribution, and reproduction in any medium, provided the original work is properly cited. |