DOI:10.32604/iasc.2023.027977
| Intelligent Automation & Soft Computing DOI:10.32604/iasc.2023.027977 | |
| Article |
DLMNN Based Heart Disease Prediction with PD-SS Optimization Algorithm
1Department of Information and Communication Technology, Manipal Institute of Technology, Manipal Academy of Higher Education, Manipal, 576104, India
2Department of Information Science and Engineering, SDM College of Engineering and Technology, Dharwad, 580002, India
3Department of Computer Science and Engineering, School of Computing, SRM Institute of Science and Technology, Kattankulathur, Chennai, 603203, India
4Department of Computer Science and Engineering, B.V Raju Institute of Technology, Telangana, 502313, India
5Faculty of Engineering and Technology, SRM Institute of Science and Technology, NCR Campus, Uttar Prasesh, 201204, India
6School of Computing Science and Engineering, VIT Bhopal University, Madhya Pradesh, 466114, India
7Department of Computer Science and Engineering, Vel Tech Multi Tech Dr. Rangarajan Dr. Sakunthala Engineering College, Chennai, 600062, India
*Corresponding Author: S. Velmurugan. Email: velmurugan@veltechmultitech.org
Received: 30 January 2022; Accepted: 09 March 2022
Abstract: In contemporary medicine, cardiovascular disease is a major public health concern. Cardiovascular diseases are one of the leading causes of death worldwide. They are classified as vascular, ischemic, or hypertensive. Clinical information contained in patients’ Electronic Health Records (EHR) enables clinicians to identify and monitor heart illness. Heart failure rates have risen dramatically in recent years as a result of changes in modern lifestyles. Heart diseases are becoming more prevalent in today’s medical setting. Each year, a substantial number of people die as a result of cardiac pain. The primary cause of these deaths is the improper use of pharmaceuticals without the supervision of a physician and the late detection of diseases. To improve the efficiency of the classification algorithms, we construct a data pre-processing stage using feature selection. Experiments using unidirectional and bidirectional neural network models found that a Deep Learning Modified Neural Network (DLMNN) model combined with the Pet Dog-Smell Sensing (PD-SS) algorithm predicted the highest classification performance on the UCI Machine Learning Heart Disease dataset. The DLMNN-based PDSS achieved an accuracy of 94.21%, an F-score of 92.38%, a recall of 94.62%, and a precision of 93.86%. These results are competitive and promising for a heart disease dataset. We demonstrated that a DLMNN framework based on deep models may be used to solve the categorization problem for an unbalanced heart disease dataset. Our proposed approach can result in exceptionally accurate models that can be utilized to analyze and diagnose clinical real-world data.
Keywords: Machine learning; random forest; coronary heart disease; cardiovascular; optimization algorithm
Heart disease was blowing up the young Indian population ten years ahead of their western counterparts, primarily due to inactive lifestyles and a lack of exercise, as the nation’s foremost cardiac experts warned. The term “cardiovascular disease” or “CVD” is frequently used to refer to disorders affecting the heart, arteries, veins, and blood vessels. This term is frequently used to refer to heart failure, cardiomyopathy, coronary artery disease (CAD), peripheral vascular disease, strokes, and cardiac arrests. According to Naresh Trehan, Chairman and Managing Director of Gurgaon’s Medanta, approximately 10.5% of young patients now live in developed cities, while 6% live in underdeveloped areas. When similar age groups of people in the west are compared, it is discovered that our country has an increase of approximately 3 to 4%. According to studies from heart doctors in major cities, around 7% of the afflicted population falls into the age bracket of 25 to 40, which is particularly susceptible to coronary artery disease. According to Ashwani Mehta, a renowned cardiac specialist at Ram Hospital in Delhi, CAD is the obstruction of the blood veins and arteries that supply blood to the heart. It is one of the deadliest diseases afflicting today’s kids. Additionally, it is related to the veins becoming toughened as a result of plaque buildup on the inside walls of the blood vessels.
Arteries are naturally soft, smooth, and flexible, but they become inelastic and exceedingly constricted as a result of plaque buildup. This scenario obstructs blood flow to the heart, resulting in an increase in oxygen demand. The deposited plaques may rupture, resulting in a severe cardiac arrest or an instantaneous heart attack. When the coronary arteries grow narrow and tiny, symptoms such as mild chest pain and difficulties breathing will occur. In these instances, particularly during exertion, the interior heart chambers will not receive sufficient blood and oxygen. Occasionally, unanticipated symptoms such as epigastria discomfort, unease, and mild pains in the upper abdomen migrate abruptly beneath the ribs. Additionally, it will indicate the presence of jaw discomfort, left arm pain, and significant heart pain or attack. According to Gunjan Kapoor, Director of Jaypee Hospital in Noida, Indians have a 50%–400% higher rate of Coronary Heart Disease (CAD) than persons from other cultural origins. This childhood condition affects people in India due to inherited susceptibility, which is defined by elevated low-density lipoprotein cholesterol (LDL-C) levels or by poor lipid fat. Additionally, individuals who have a family history of diabetes, hypertension, or other heart-related concerns must have their health checked prior to the age of twenty-five, while the remainder of the population may be closer to thirty. Early detection enables timely treatment and reduces the risk of developing heart disease in the future.
According to an expert dietician, processed foods have a significant number of calories and sodium, and so should be avoided. One can maintain a healthy heart by abstaining from such foods. Additionally, avoiding saturated and trans fats is a wise choice. Contributions should begin at the primary level in the United States, where one person suffers a heart attack every 42 s and one person dies of heart disease every minute. In the United States, the majority of cultural/tribal communities have a population of less than 100,000. Schools, educators, fathers, mothers, and private and governmental organizations on a local and regional level. By eradicating heart-related ailments and deaths, the aforementioned peoples can demonstrate their primary responsibility for redeeming the lives of future leaders and rulers. Male and female mortality rates increase significantly as a result of heart disease.
In 2009, over 50% of deaths were attributed to heart disease in men and women alike. CAD is a type of heart disease that claimed over 3.65 lakh lives in the last three years. Each 42 s, someone in the United States experiences a heart attack, and each minute, someone dies of heart disease. The majority of cultural/tribal communities in the United States have a population of around 100,000 people. As a result, heart disease becomes the leading cause of death for Americans, Hispanics, and whites. Each year, the United States spends over 207 billion dollars on cardiac illnesses, which include the cost of medical care, medicines, and absent production. Approximately two million heart attacks occur in India each year, with the majority of victims being children. India monitors two million heart attacks annually, with the majority of victims being children. According to a prominent cardiologist, one person dies of a heart attack every 33 s in India, placing Indians ten years ahead of their Western counterparts.
Men who live in cities have a threefold increased chance of having a heart attack than those who live in villages, while women’s risk increases significantly after menopause. Low density lipoprotein cholesterol (LDL-C), also referred to as bad cholesterol, is the main cause of heart attacks. Additional risk factors for heart attack include smoking, diabetes, high blood pressure, lifestyle choices, genetic predisposition, specifically increased carbohydrate-rich food consumption, and a lack of sustained physical activity. Patients frequently disregard chest pain, blaming it on acid reflux or gastrointestinal discomfort, neither of which should be ignored. Any uneasiness or exertion experienced after walking, particularly if it persists following a rest, may be an indication of a heart condition that should not be ignored but should be treated immediately. Heart disease is preventable with appropriate therapies, and India has the world’s highest rate of cardiac arrests. Avoiding heart attacks requires eating a healthy diet rich in organic fruits and vegetables, exercising regularly, and living in a stress-free environment. Stress reduction, periodic physical examinations (including a lipid profile), and medication adherence are all substantial lifestyle benefits. CVD has become the leading cause of death in India. Stroke and ischemic disease are the primary causes of death from cardiovascular disease, accounting for more than 80% of fatalities.
CVD is responsible for an average of 272 deaths per 10,000 persons in India, according to the Worldwide survey of CVD. Several aspects of CVD that are prevalent in India are cause for concern, including their rapid accumulation, the average age at which people begin to develop the disease, and the higher death rate. In a decade, the death rate in years of life lost to CVD increased by more than 59%, from 23.2 million to 37 million. Despite the widespread resemblance in the incidence of CVD hazard issues across numerous geographical regions, CVD has emerged into the leading cause of mortality in a number of regions of India, including the poorest states and rural areas. Individuals in poorer financial conditions frequently do not receive the finest care, leading to poor outcomes.
Existing algorithms must be investigated, analyzed, and updated in order to improve predicted behaviour and provide superior results. Heart disease is one of the leading causes of death worldwide. In today’s world, it is the principal source of boredom and mortality. Cardiovascular disease, the World Health Organization estimates, will kill 23.6 million people by 2030. (WHO). To mitigate the risk, it is recommended that heart disease risk be decreased in half [1]. The second most challenging task in medical institutions is determining the true nature of an individual’s disease. In 2008, the United States spent over 2.2 trillion dollars on health care, or 15.5% of GDP (GDP). Additionally, hospitals are responsible for 31% of the outflow. Clearly, the cost of hospital care will fall gradually and incrementally. Hospital costs totaled about 30.8 billion USD in 2006, with cardiac disorders accounting for around 31% of that total [2]. Heart disease has increased significantly in recent decades and has become the leading cause of death. It is extremely difficult for healthcare workers to recognize accurately and rapidly [3]. As a result, adding computer information into this research is critical for assisting healthcare practitioners in more precisely diagnosing cancer at an earlier stage. The purpose of this study is to correctly and professionally analyze heart-related hospitalizations based on the patient’s medical history. The study’s approaches are innovative in this field. Heart disease can show in a variety of ways, causing damage to the internal organs of the heart. As a result, every sort of heart disease can be classified as a cardiovascular disease [4], and this section discusses numerous heart-related ailments.
According to Nikhil Kumar et al. [5], machine learning algorithms in medical technology aid in earlier disease prediction. The transition from written prescriptions to medical records necessitated the introduction of machine learning to healthcare. Electronic health records enable medical practitioners to share patient records across multiple domains of the health sector, resulting in improved patient care and a reduction in medical errors. Amandeep et al. [6] explains in their study that medical companies generate a tremendous quantity of data in the modern day, including text and photos, which we collectively refer to as electronic health records. The relevant extraction and analysis of these records aid in the successful decision-making process necessary to treat patients appropriately across healthcare systems such as hospitals and primary health care clinics. Pahulpreet et al. [7] demonstrate how machine learning provides a set of technological frameworks for processing and discovering the cryptic structure of health data, hence assisting healthcare practitioners in making more informed decisions. Several healthcare diligences are currently utilizing machine learning approaches to classify and organize medical data.
According to Soni et al. [8], a systematic examination of this data is more critical for each patient and strategically significant for the healthcare businesses. This enables earlier disease detection, patient diagnosis, appropriate therapy, and avoidance of healthcare complication risks, as well as shorter treatment prediction and diagnosis times. Because they do not require prior knowledge of data distribution, decision trees are frequently employed for categorization. Additionally, it does well with noisy and ambiguous data. It has been used to categories patients depending on their disorders in eHealth applications. Additionally, it forecasts a patient’s sickness based on his or her symptoms. The article discusses a method for automating the diagnosis of coronary heart disease [9]. Ordonez [10] explain in their study that information processing is carried out by highly linked neurons. This is a widely used approach, with the principal use being pattern recognition and data classification [11–14]. The network is made up of nodes or connected units referred to as neurons [15]. According to Reshma [16], the K-nearest neighbor algorithm is the most robust technique for pattern identification and data classification. Distance functions or similarity measures are the fundamental notion underlying K-nearest neighbor algorithms. This article employs a non-linear support vector machine to construct a model-based recommendation system [17]. Non-linear support vector machine methods are the most extensively utilized technique for dealing with unlabeled data, and they are used in a wide variety of industrial applications. Asha et al. [18] examine the growing importance of various machine learning methods in predictive analysis. Predictive analysis is a strategy that consists of five parts. A ensemble neural network models [19] for medical analysis. The performance of these classifiers is evaluated using a variety of estimation criteria using real-world datasets. The base classifier’s performance is compared to that of the target classifier. An approach for modifying atrial arrhythmias that distinguishes between critical locations within important atrial bundles [20]. The Electrocardiography (ECG) may have a distorted P-wave morphology (PWM) as a result of the atria moving at an abnormally high rate, which can be reproduced [21–23]. The algorithm was realistic and capable of properly predicting atrial position to within an 85% margin of error [24–26].
3 Proposed DLMNN Heart Disease Prediction and Classification Model Architecture
The DLMNN analysis of heart disease prediction using PD-SS optimization methods is depicted in Fig. 1. Existing algorithms such as Logistic Regression, Random Forest Classifiers, and K closest neighbours (KNN) are applied in this research, which can assist practitioners or medical analysts in accurately diagnosing Heart Disease. The approach is a series of procedures that transforms raw data into recognisable data patterns for the consumers’ knowledge. The suggested work performs hearing illness prediction and DLMNN classification. This article makes a significant contribution by performing four stages: pre-processing, feature extraction, classification, and validation. The modification process is carried out here by optimising the weight value of the ranked values utilising the PD-SS algorithm. Each step is thoroughly explained. Fig. 1 illustrates this proposed paradigm in detail. Additionally, the existing classifier for heart disease prediction is less accurate. After pre-processing the data, the proposed model DLMNN Classifier is utilised to categorise the pre-processed data.
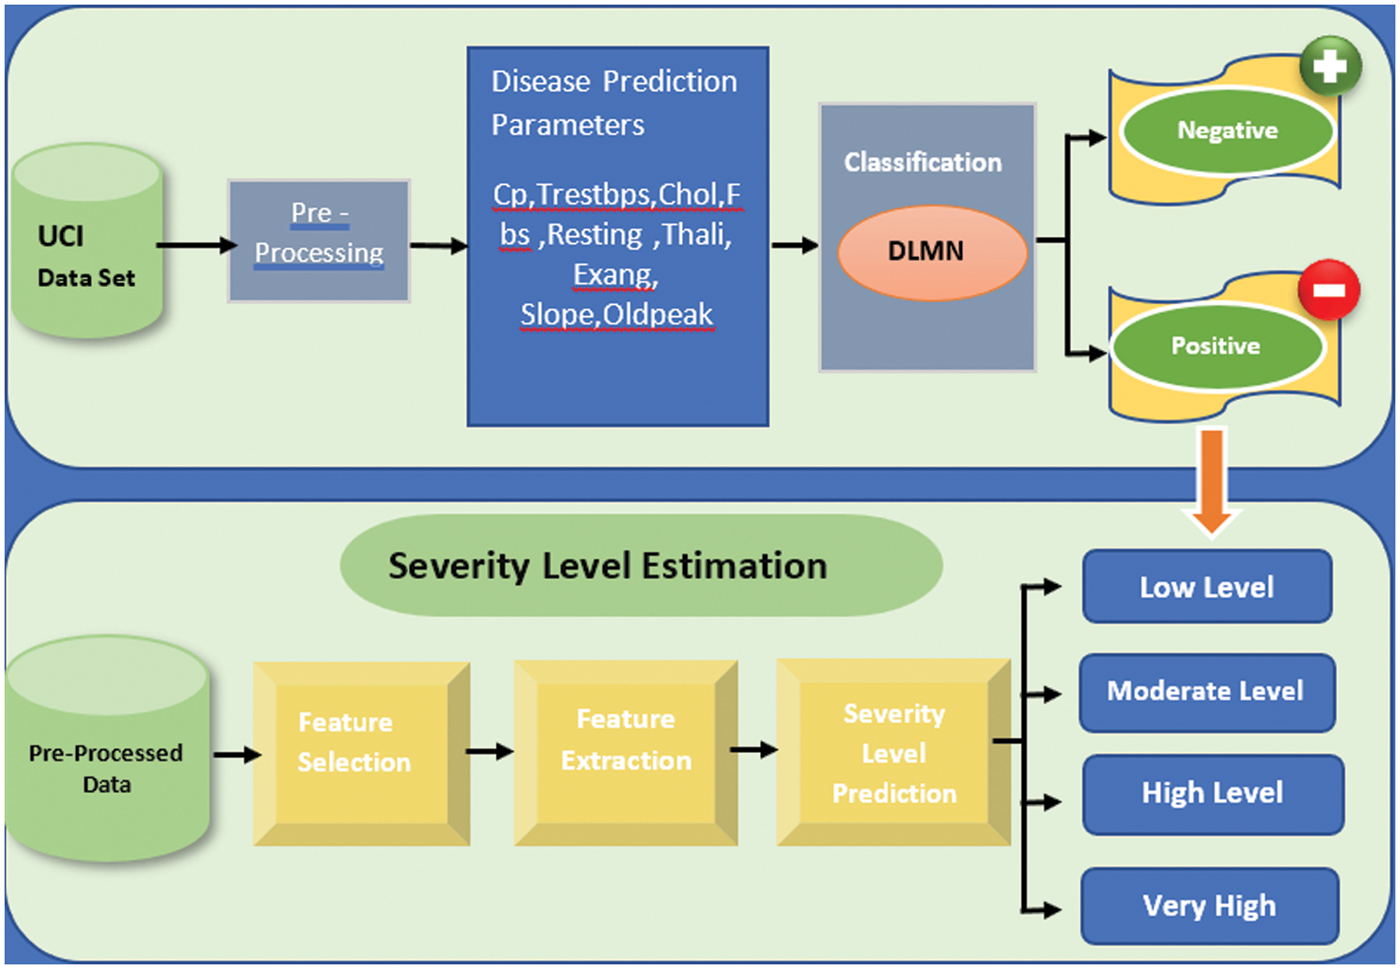
Figure 1: DLMNN-based PD-SS proposed model
Step 1: Let the selected feature values and their equivalent weights.
Step 2: Multiply the inputs by the weight vectors you chose at random, then add them up:
M signifies the total value.
Step 3: Determine the purpose of activation (AF).
Afi denotes the activation function, while Ci denotes the Gi exponential. A Gaussian function is a type of AF used in this system.
Step 4: Use the output of the following hidden layer to evaluate it.
Step 5: where Bi denotes the bias and Xi denotes the weight distribution between the input and hidden layers.
where Oi is the value of the layer before the output layer, Xj is the hidden layer’s weights, and Ri is the output unit.
Step 6: This stage compares the output of the network to the desired value. The error signal is the difference between these two numbers. This value is quantifiable as follows:
where Er denotes the error signal and Di denotes the desired output.
Step 7: The value of the output unit is compared to the target value. It is determined which fault is causing it. Here on basis of this error, a value I is generated, and this value is also used to broadcast the error at the output to all other units in the network.
Step 8: The backpropagation algorithm is used to correct the weights. The following is a description of this relationship:
Wci denotes weight correction, M denotes momentum, and I denote the network error. Weight values are optimized using the PD-SS technique.
Pet Dog-Smell Sensing (PD-SS) is a strategy for optimizing the weight values in a Deep Learning Neural Network (DLNN), therefore the name “DLMNN.” Following the selection of features, the DLMNN is used to classify them. These features are classified using the DLMNN classifier. Each input is given and arbitrarily assigned weight. The next hidden layer’s nodes are responsible for merging the input value and weight vectors of all the nodes connected to them. Using random weight values improves the backpropagation process. Thus, optimization is accomplished. After then, the activation technique is used, and the output of this layer is passed to the subsequent layer. These weights have a significant impact on the classifier’s output.
4.1 PD-SS Optimization Algorithm
The PD-SS algorithm is based on the concept of a remote-sensing pet dog. Due to a dog’s greater sense of smell to that of people and other animals, it is capable of identifying its master before to their arrival. A pet dog’s scent is characterized by two distinct features. 1. The aroma of its master; 2. The sounds (properties) associated with the master. BMI, weight, and height are all fundamental human characteristics. Su represents a person’s basic symptoms. Medical history, including blood glucose measurements.
The algorithm detects the features in the same way as a pet dog detects its master’s characteristics; in this case, the master is heart disease, and so the function returns true if heart disease is expected and false otherwise. The PD-SS algorithm is composed of the following steps:
Step-1: Restore the default settings for the odour parameters. Hu refers to genital parameters, which include information regarding the parents’ and grandparents’ heart problems. Iu historical elements include case studies and other physical characteristics.
To estimate the olfactory attributes, several time intervals are used; As the algorithm iterates, these intervals could alter. At first, monthly or weekly intervals are utilized; after that, daily or hourly intervals are used, depending on the state information.
The Prediction State is initially set to false (non-heart disease), but this is changed as the algorithm progresses.
Step-2: The list of symptoms is computed for a specified time interval Uu1
Step-3: Create a comprehensive list of all conceivable outcomes. Due to the fact that the H parameters remain constant, Vu is removed from the Wu. Vu is a collection of parameters computed in previous phases and includes Qu, Iu, and Tu.
Step-4: Verify the parameters and their Variations Wu to determine whether a Prediction State may be discovered. You should return to the Prediction State if you have arrived.
Step-5: If the Prediction State cannot be obtained, the smelling parameters should be estimated using alternate time periods Uu. If the Prediction State cannot be attained, steps 1–4 should be repeated.
Algorithm
Let N1: Number of PD-SS
N2: The quantity of odour patches
N3: The maximum number of SDAs that can arrive at the destination
Step 1. To ensure that the SDA is considered in the iteration with the biggest radius, it is required to initialize the agents with natural numbers as signature indexes and radii values in inverse order.
Step 2. Select at random N2 points within the Cartesian plot’s extremities to serve as smell spots. Assign a scent value of ‘s’ to each of the smell spots, where s = 1/(a b 9 d) and s = 1/(a b 9 d) are the number of smell spots. For instance, the distance between the source of the smell and the destination is expressed in Cartesian distance (cl), but the proportionality constants a and b are expressed in angular distance (a).
Step 3. Connect each agent to the source point by establishing a connection between the two agents.
Step 4. For each and every agent numbered from one to one hundred one
Step 4.1 In a set of scent places, select the unmarked point (within the radius) that has the greatest smell value out of those that aren’t labelled.
Step 4.2 The SDA should now be relocated to the point by inputting a value for the SDA’s signature in the scent location index.
Step 5. Continue to follow step 4 until you accomplish your goal.
Step 6. Calculate and attribute N3 to the number of SDAs that arrived at their destination.
The processing of the system begins with data collection, which we performed by using the UCI repository dataset, which has been fully validated by a number of researchers and the UCI administration [27].
Data collection and selection of training and testing datasets are the first steps in developing a prediction system. We used 73% of the training dataset and 37% of the testing dataset in this project.
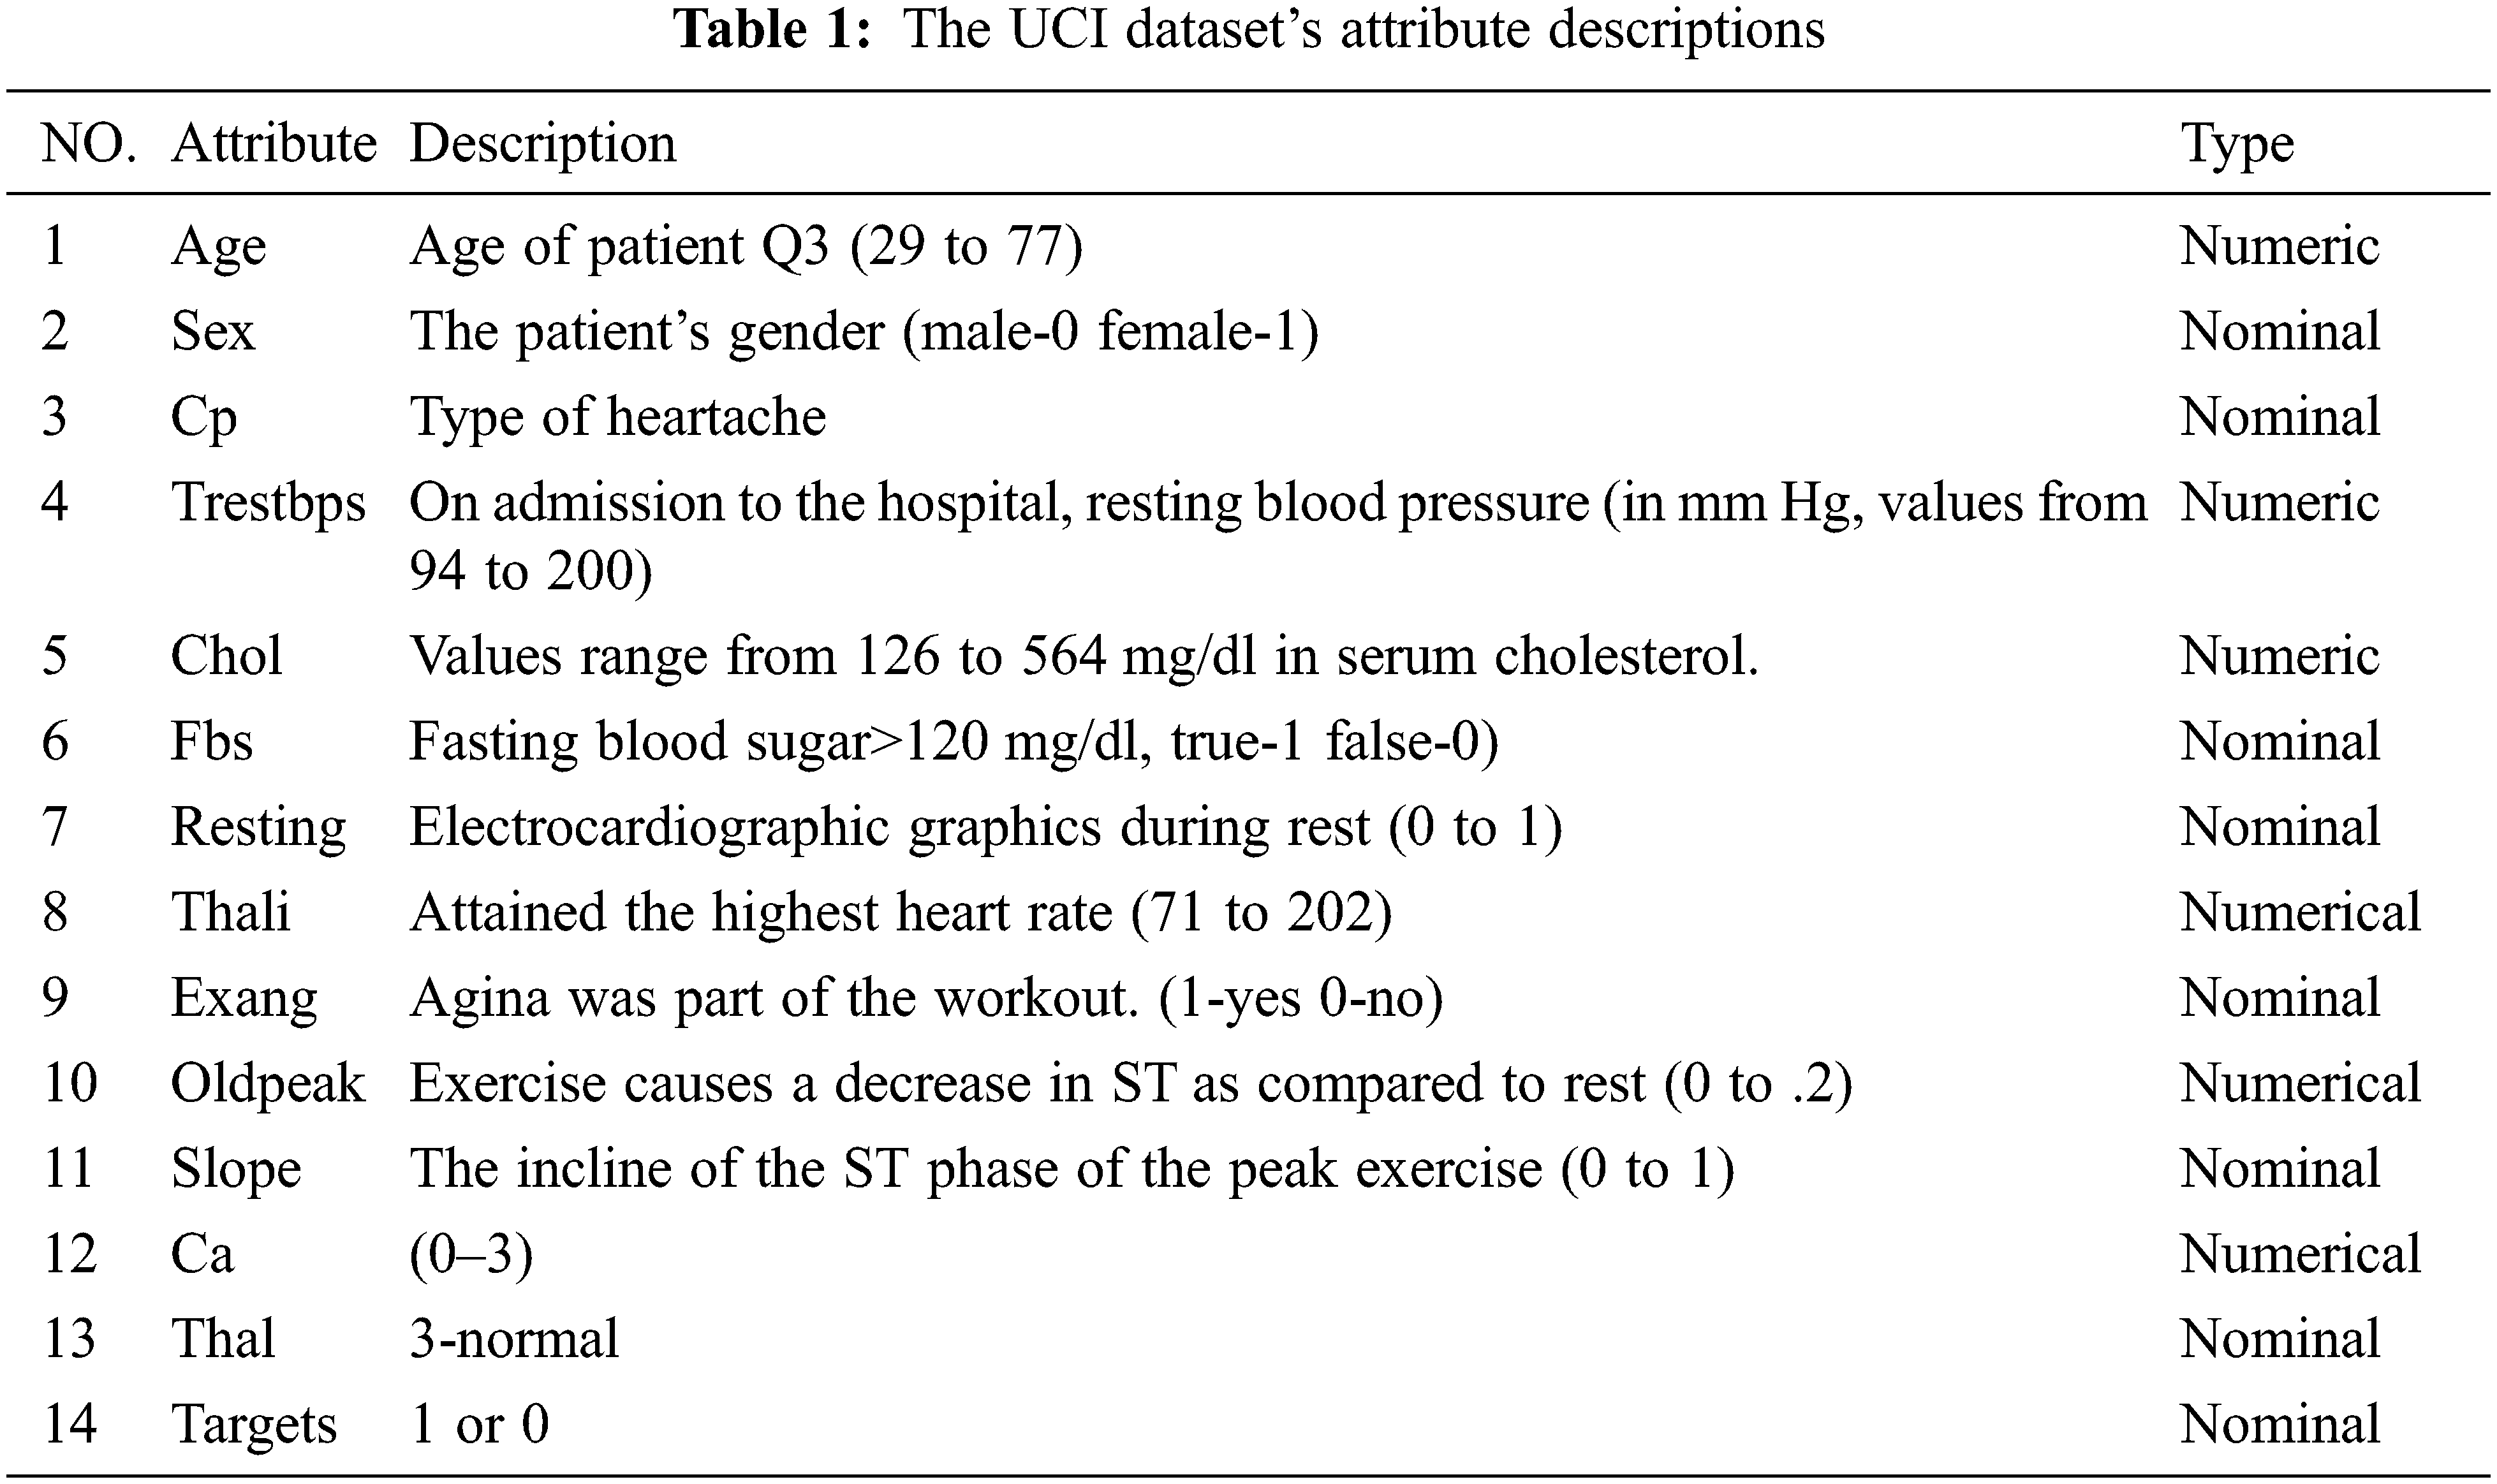
Individuals with a history of cardiac problems or other medical conditions were selected from a structured dataset [28]. Heart disease refers to a variety of conditions that affect the heart. Cardiovascular diseases are the leading cause of death among middle-aged people, according to the World Health Organization (WHO). The data set we use contains the medical histories of 304 people ranging in age from infants to elderly. This dataset contains crucial information about the patient, such as his or her age, resting blood pressure, fasting blood sugar level, and other medical features. This information assists us in establishing whether the patient has been diagnosed with heart disease as show in Tab. 1. Attributes That Are Predictable The following conditions are verified for the prediction of heart disease:
1. Value 0: diameter narrowing < 50%. Then there is no possibility of heart diseases.
2. Value 1: diameter narrowing > 50%. The there is a possibility of heart diseases.
The suggested IoT framework was prototyped utilizing existing hardware devices, a microcontroller, and LoRa communication hardware to send data to a cloud system. The system records the patient’s age, gender, and patient identification number. Because no instrument exists to quantify chest pain, the chest pain (cp) parameter is produced using a pseudo number ranging from 1–4. The resting blood pressure (trestbps) parameter was determined using the Omron HeartGuid-bp8000m, which transmits data to the cloud and sends notifications to the user’s mobile phone [29]. Due to the lack of a wearable device, serum cholesterol and glucose levels were estimated using a pseudo number generated within a certain range. Electrocardiographic data were acquired using the AD8232 heart monitor board [30]. The maximum heart rate, old peak, and slop are also recorded from the patient’s previous data. Data collection and analysis are time-consuming tasks on a Raspberry Pi single-board computer [31]. The hardware required for this experiment is listed in Tab. 2.
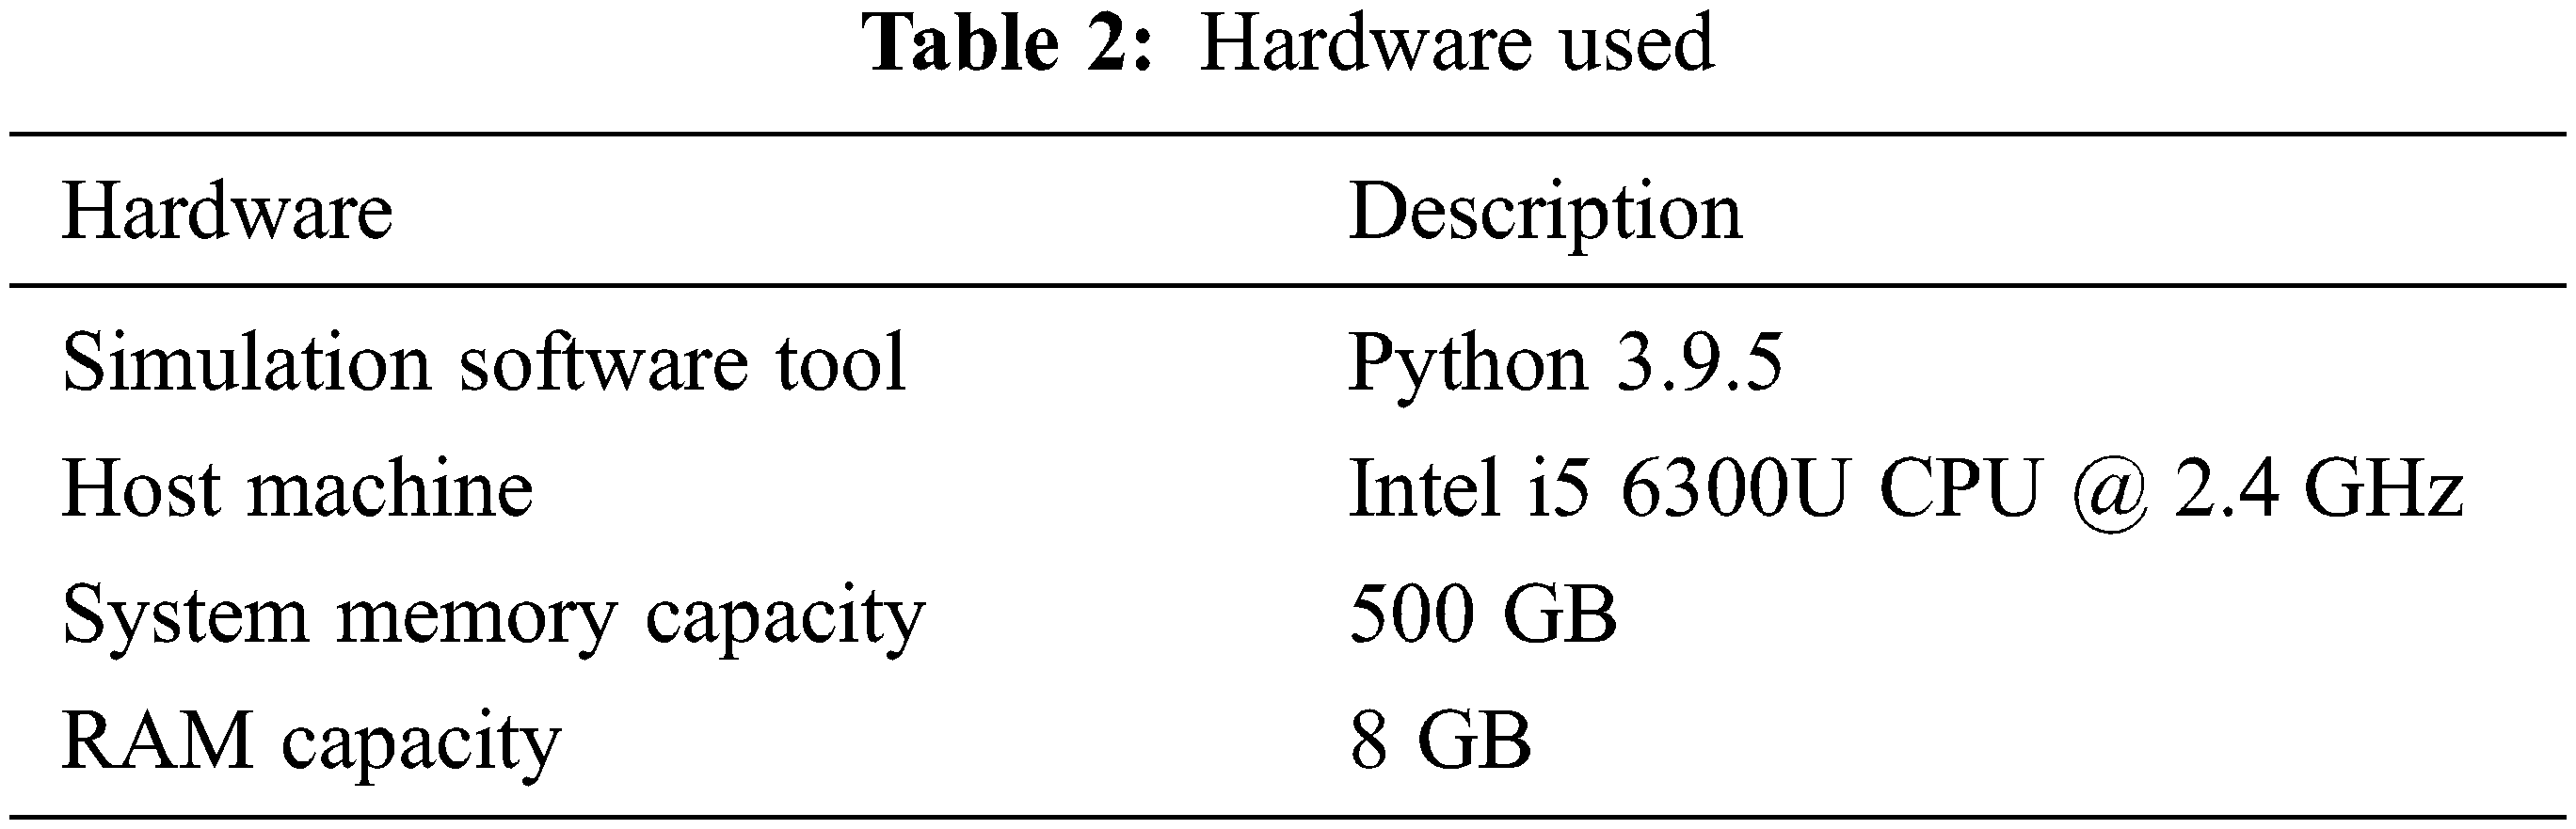
6.1 Hardware Used in This Model
When the sample size exceeds 50, the Central Limit Theorem states that every distribution with finite variance has a sample mean that is approximately normal. Additionally, our analysis and estimation are based on the samples’ natural distribution. Observing and contrasting the distributions of positive and negative opinions with those of binary values (only positive & negative). Conducting the Z test (proportion) on data from the dataset to determine binary significance (only Positive and Negative values) using the following hypothesis: The null hypothesis is H0, which asserts the equality of positive and negative numbers. P equals 0.5, which indicates that the value is equal to one or ‘PASS’. H1: A plausible explanation The properties of positive and negative numbers are not identical. P = 0.5, which indicates that the value is zero or ‘FAIL’. The remaining data is simulated in a similar method.
This is accomplished by examining a range of performance metrics. A classifier’s precision is defined by its accuracy across all classifications. Precision is a performance statistic that is used to evaluate the results of planned activities. This measure contrasts the overall number of TPs and TNs with the total number of correctly classified occurrences (True Negatives). The following equation illustrates the mathematical subject of precision.
where, TP specifies the True Positives &
Recall is the next performance statistic that is determined for performance analysis. Recall is a metric that indicates the completeness of all classifiers. The mathematical equation is used to determine the value of Recall.
where,
In general, the F-score is a performance metric that considers both precision and recall. It has a minimum value of 0 and a maximum value of 1. It is calculated as the harmonic mean of both the recall and precision numbers. The F-score is calculated as follows:
Accuracy is a measure of how close the suggested model is to the target value. It is a measure that indicates the number of forecasts made in relation to the total number of predictions. The accuracy of the system is calculated using the following mathematical representation.
where, TN denotes the true negatives.
The execution time (ET) is defined as the time required for a CPU to process instructions on a system. This is a critical metric for determining the proposed system’s performance. The ASS (‘Average Sentiment Score’) is the emotional score’s mean value. This is the most precise numerical representation of the polarity of sentiments.
In the Tab. 3, DLMNN outperforms traditional linear regression, random forest, Nave Bayes, and KNN algorithms in terms of precision. The proposed algorithm outperforms all other linear regression, random forest, nave bayes, and KNN techniques, as seen in the table above. For example, the present Naive Bayes algorithm performs significantly worse than the proposed one. Nave Bayes achieves a precision of 79.11%. Precision-wise, the existing Linear Regression, Random Forest, and KNN algorithms all outperform the recommended one. In comparison to conventional methods, the proposed DLMNN system achieves a precision of 90.45%. Fig. 2 illustrates this point more clearly.

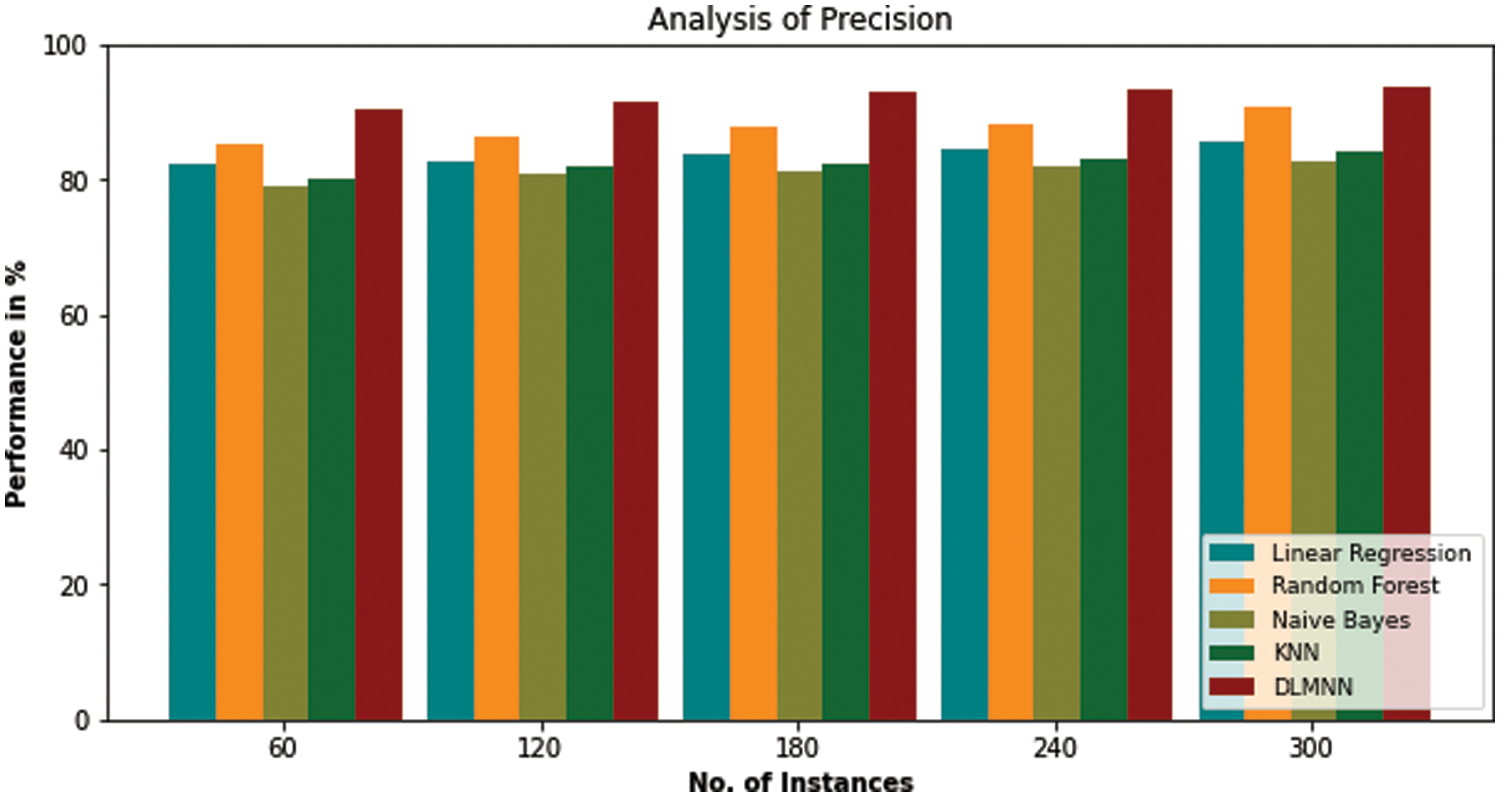
Figure 2: Precision analysis of DLMNN technique with the existing methods
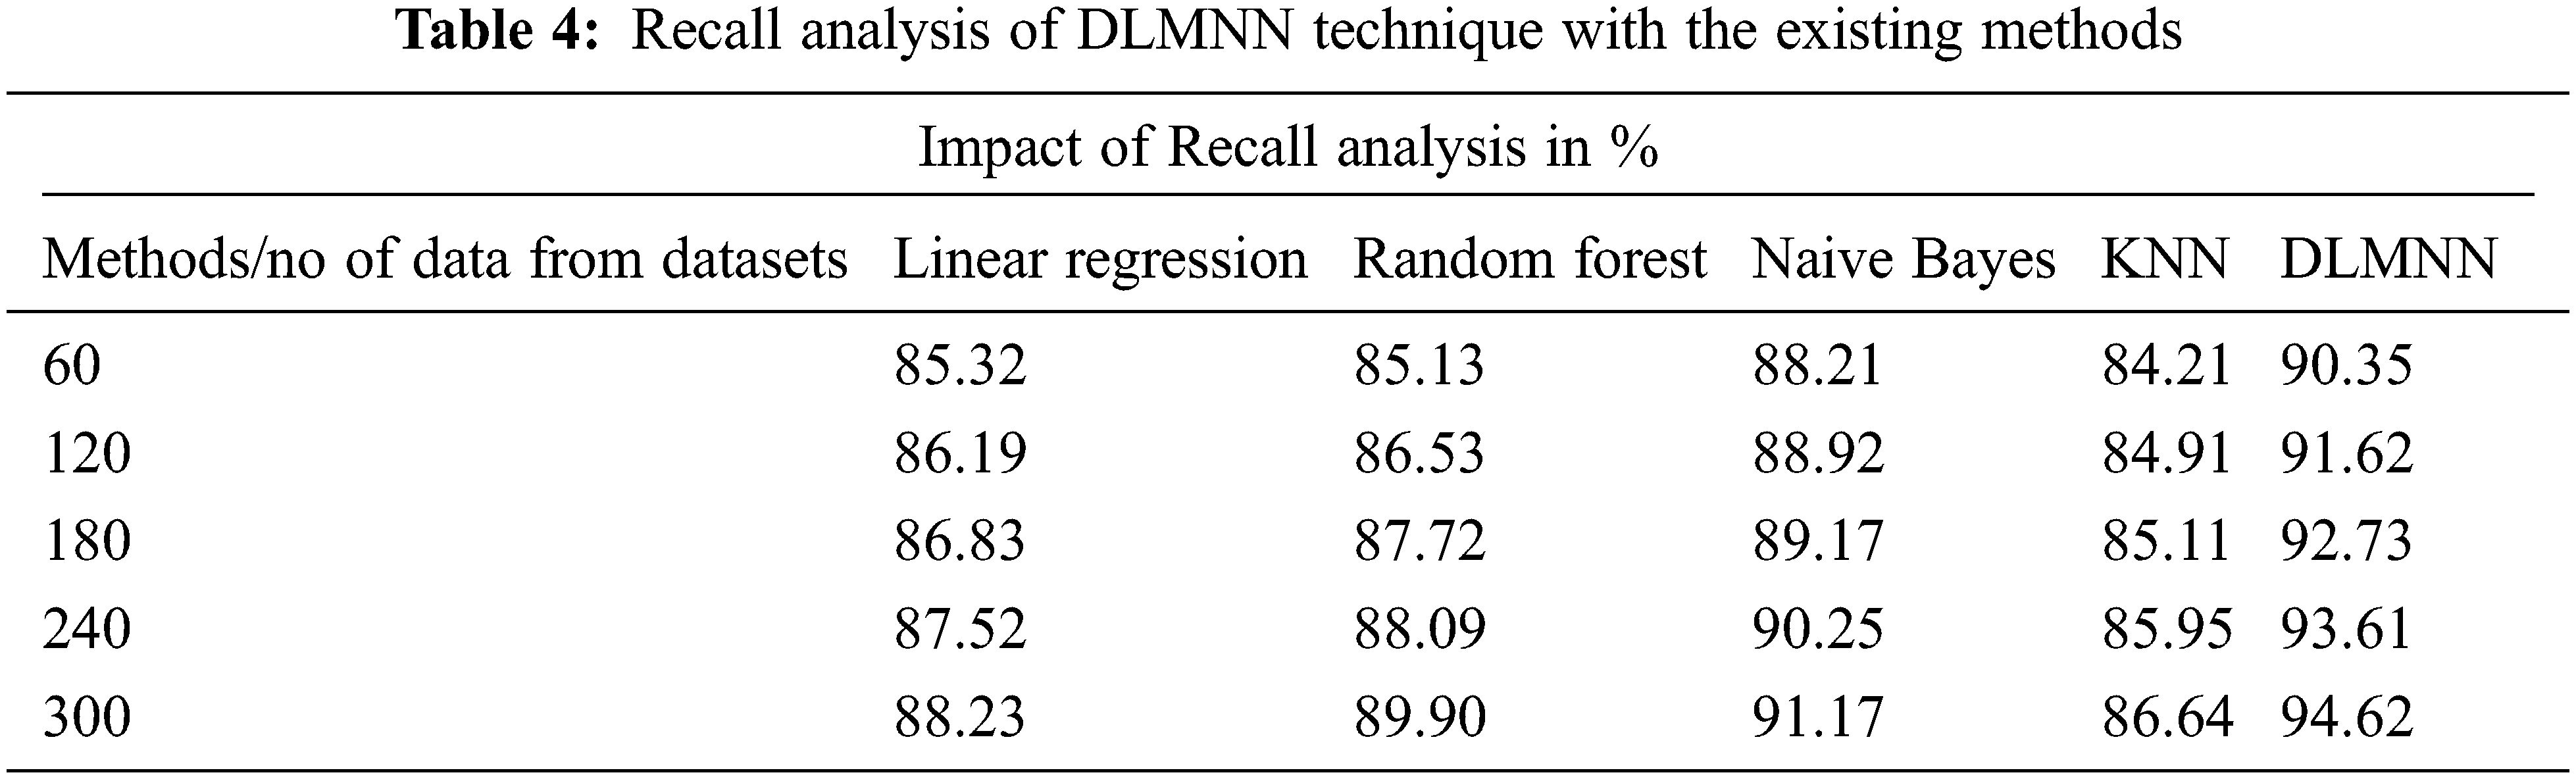
Fig. 3 compares the present Linear Regression, Random Forest, Nave Bayes, KNN, and proposed DLMNN techniques in terms of recall. For N = 60, 120, and 300, the proposed model has a higher recall value than existing techniques. As the number of N values increases, the recall value increases proportionately. For N = 300, the proposed DLMNN has a recall value of 94.62%, which is higher than the present Linear Regression, Random Forest, Nave Bayes, and KNN, which all demonstrate superior performance as shown in Tab. 4.
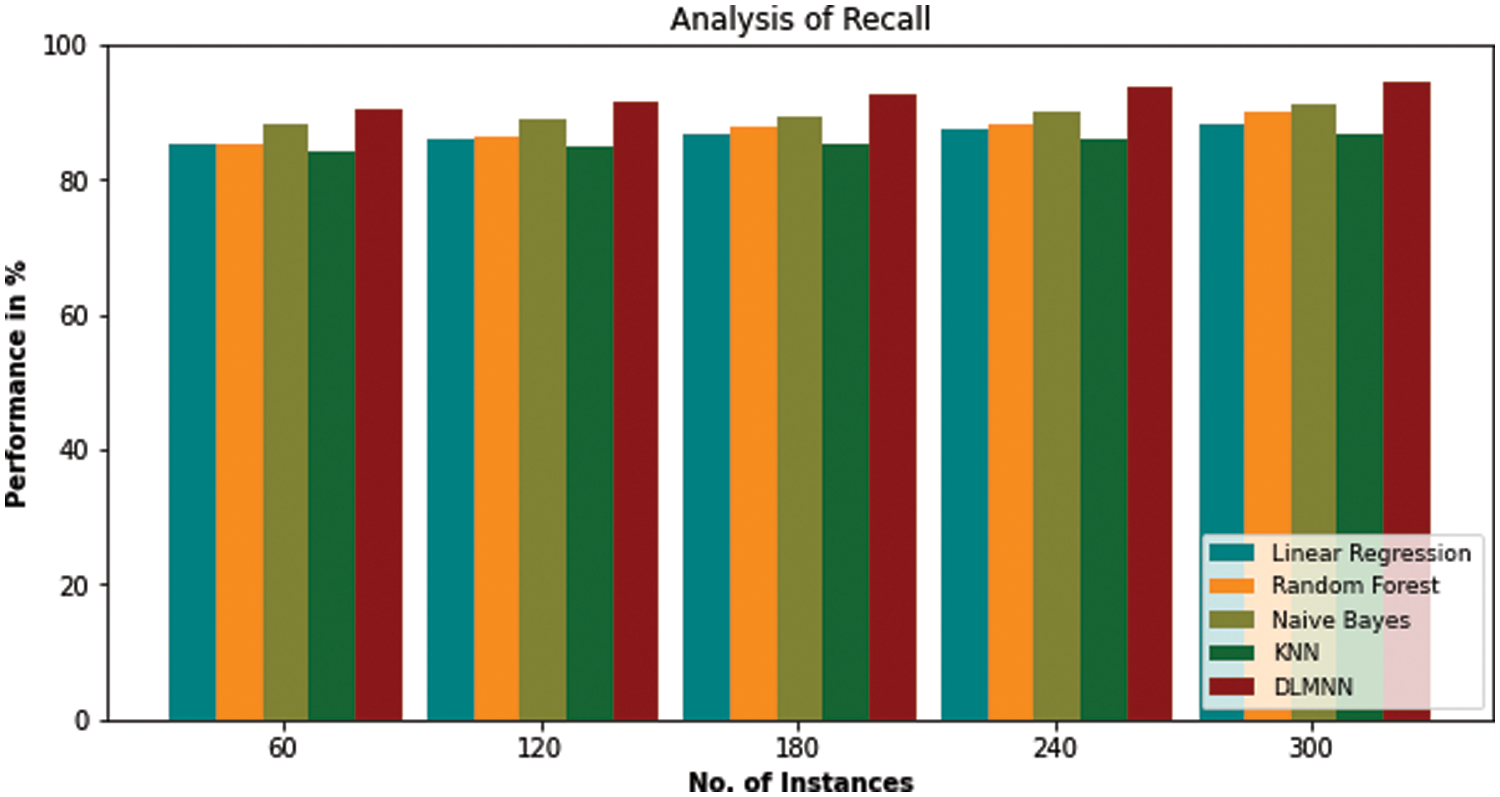
Figure 3: Recall analysis of DLMNN technique with the existing methods
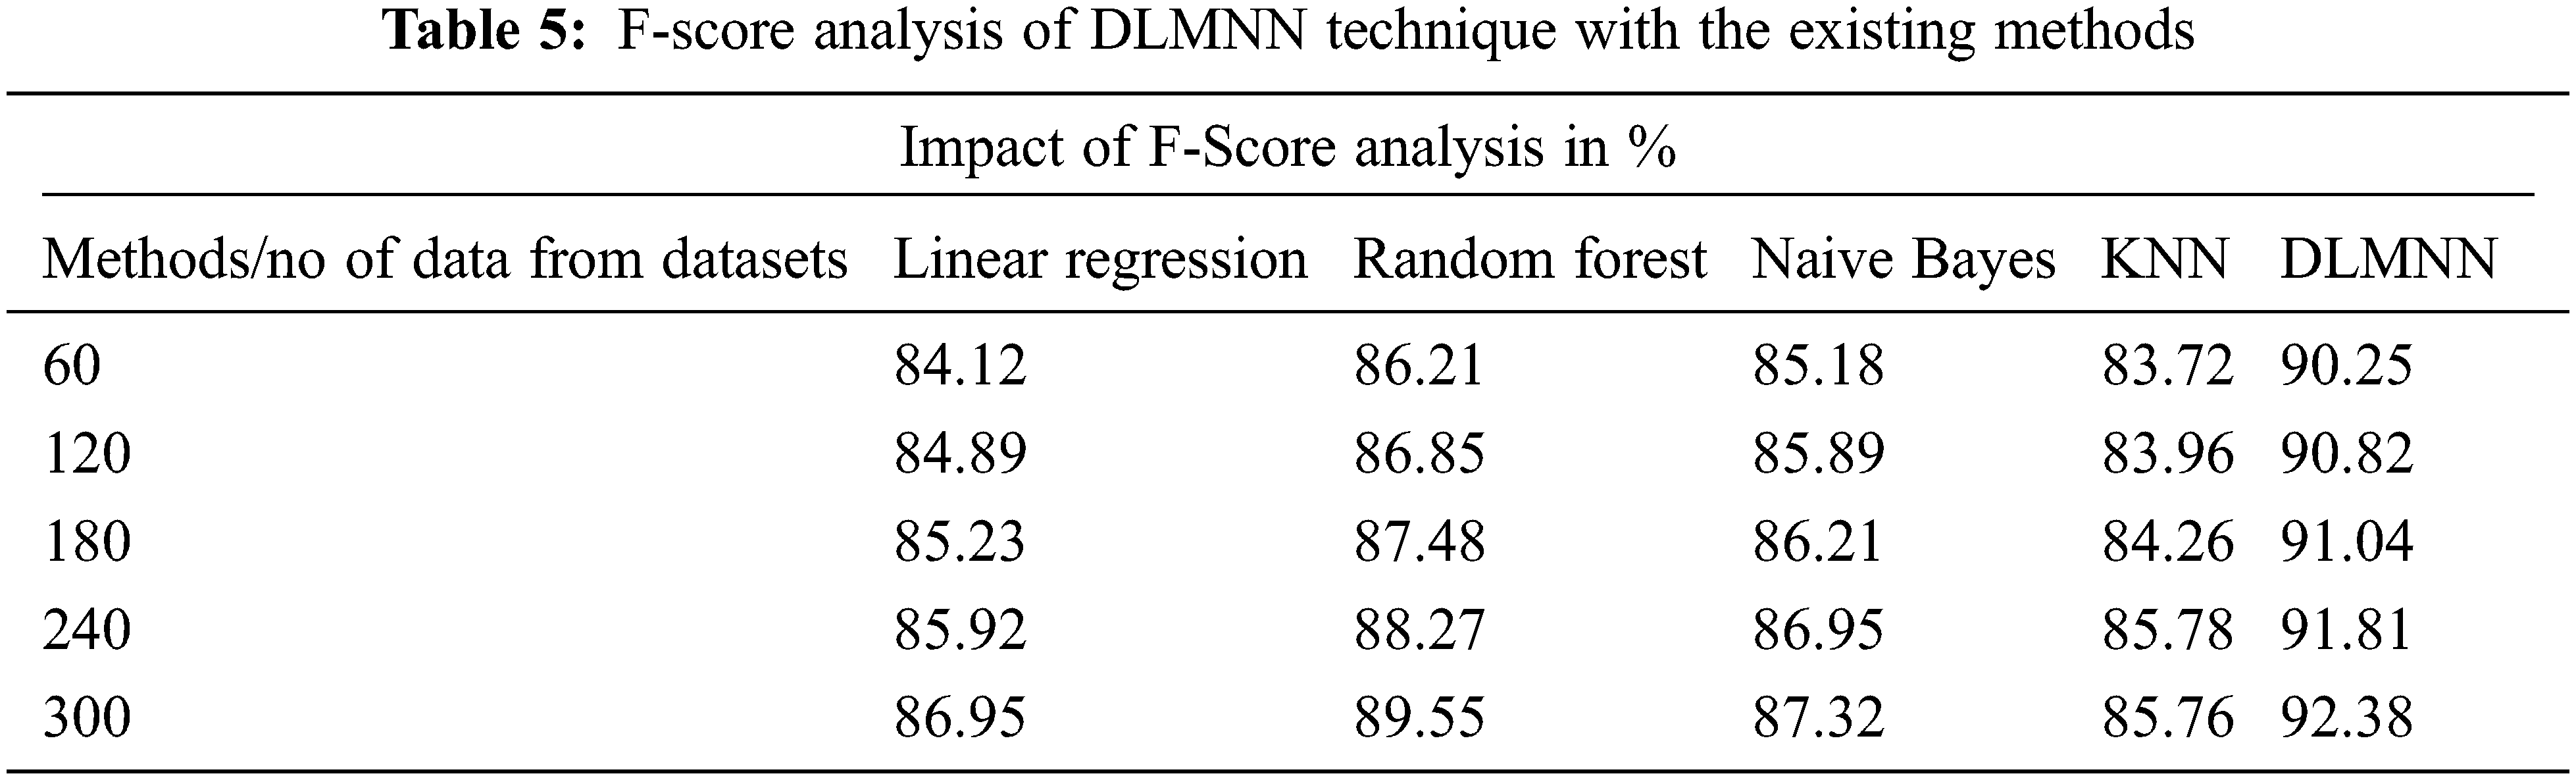
The F-Score performance of the present approaches and the suggested DLMNN techniques is shown in Fig. 4. It may be deduced that the F-Score increases in lockstep with the N value. The F-Score values for linear regression, Random Forest, Naive Bayes KNN, and DLMNN are 86.95, 89.55, 87.32, and 85.76, respectively, whereas the suggested DLMNN has a score of 92.38. The suggested DLMNN has a 92.38 F-Score, which is greater than the F-Scores of the existing techniques, indicating that it performs the best as shown in Tab. 5.
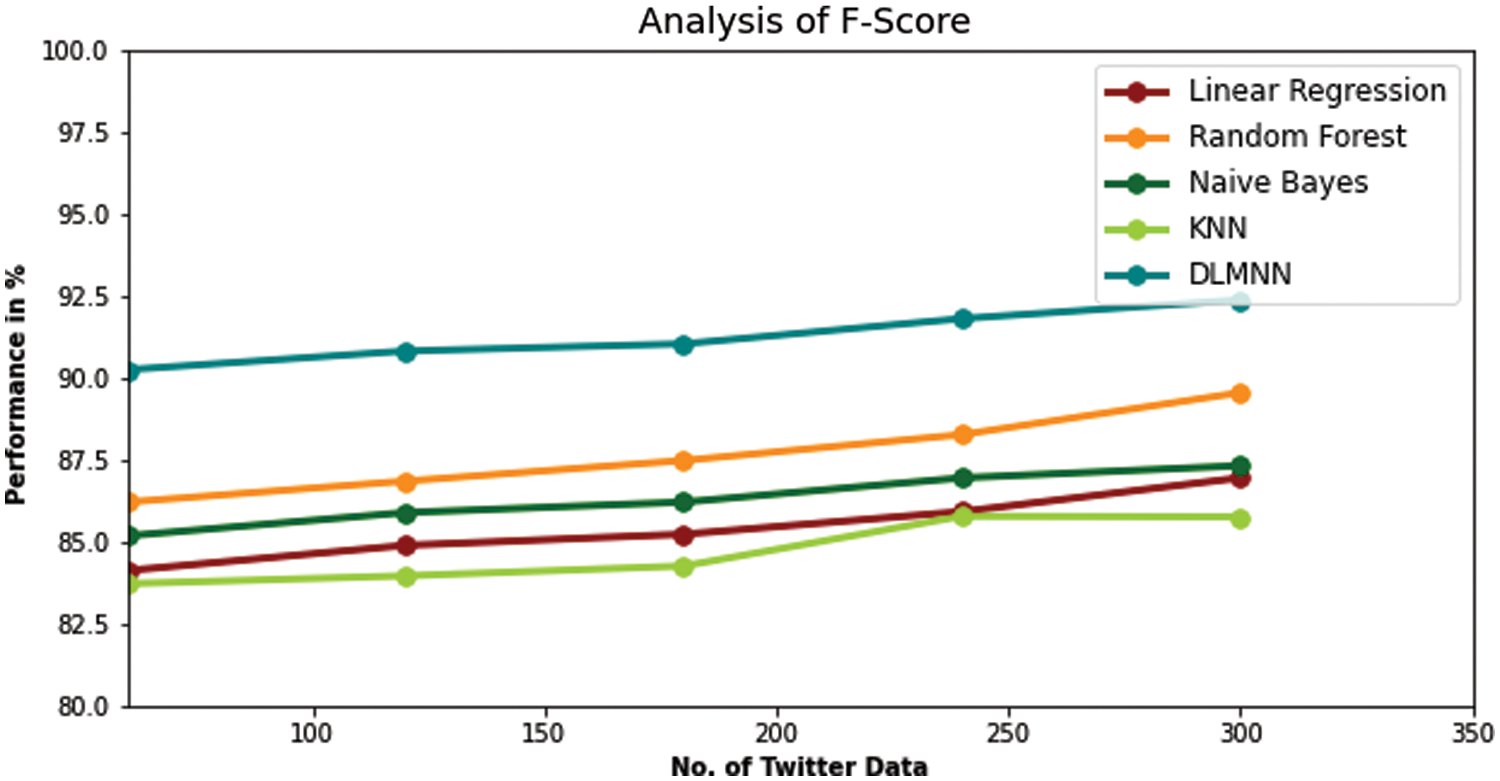
Figure 4: F-Score performance analysis of existing techniques and proposed DLMNN
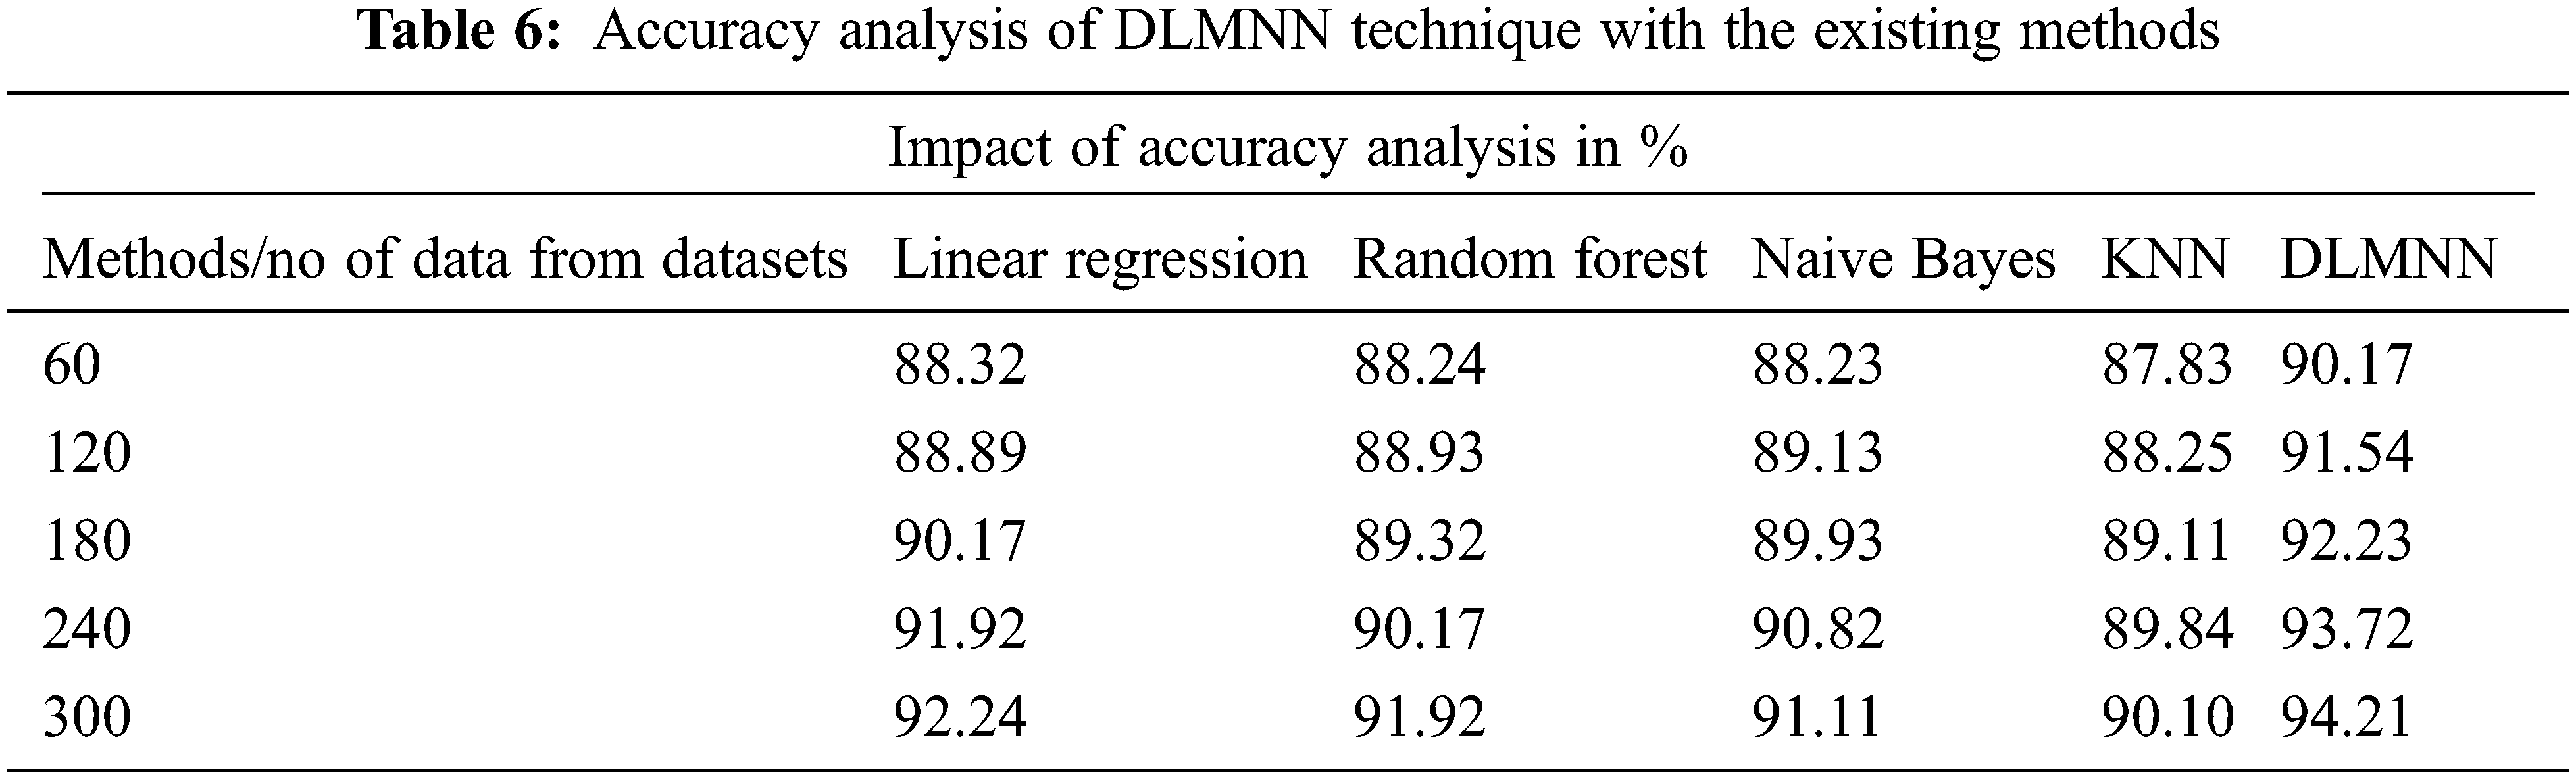
Accuracy metrics for DLMNN, Linear Regression, Random Forest, Naive Bayes, and KNN are all displayed in Fig. 5. Accuracy is a critical factor in predicting heart disease. In terms of accuracy, the present Linear Regression approach provides only 92.24%. Other techniques, like as Random Forest, Nave Bayes, and KNN, achieve a better level of accuracy, but not quite as high as the proposed one (91.92% vs. 90.10%). However, the proposed system, DLMNN, is 94.21% accurate. This is superior to the methods currently in use. As a result, the proposed DLMNN algorithm surpasses previously utilised approaches in terms of performance as shown in Tab. 6.
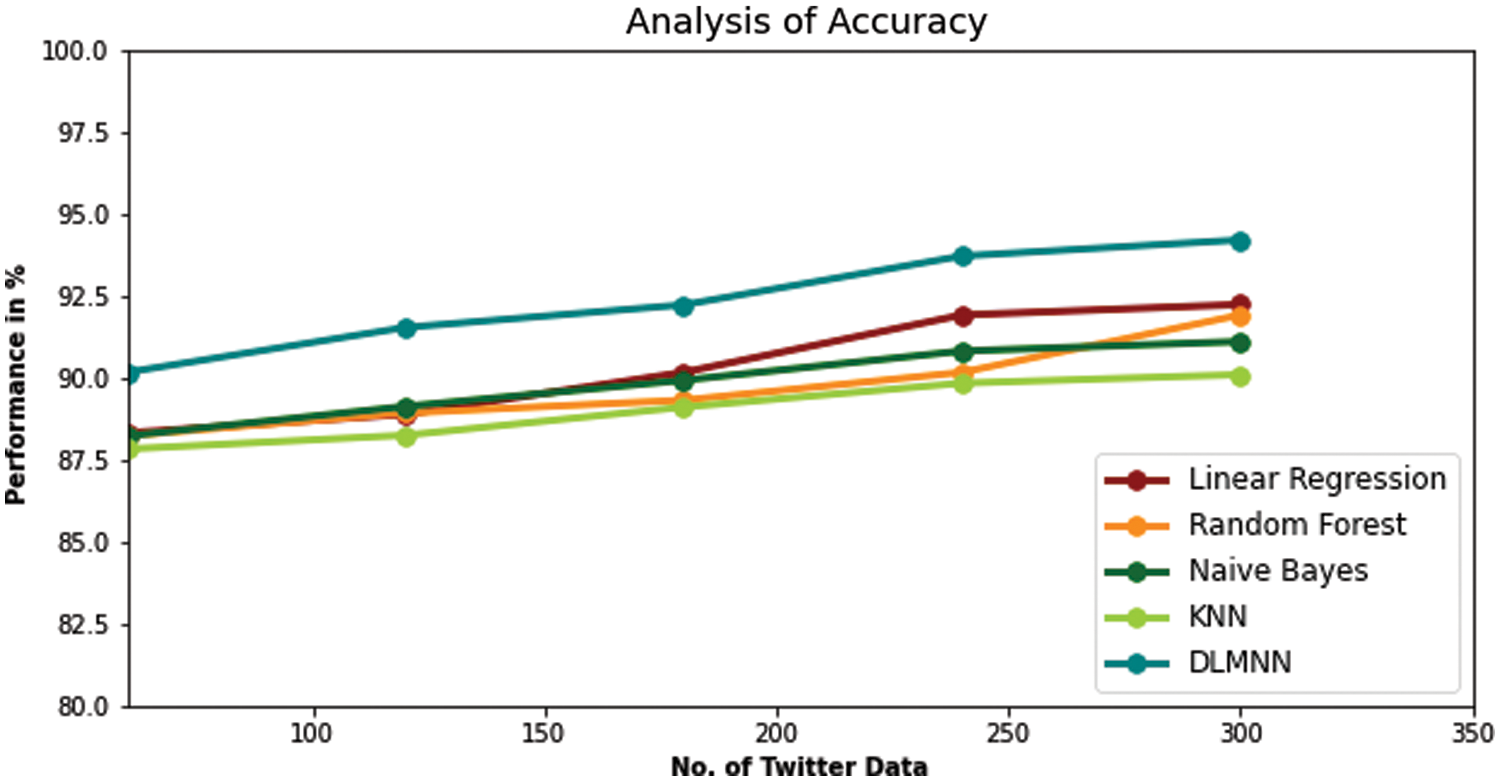
Figure 5: Accuracy analysis of existing techniques and proposed DLMNN
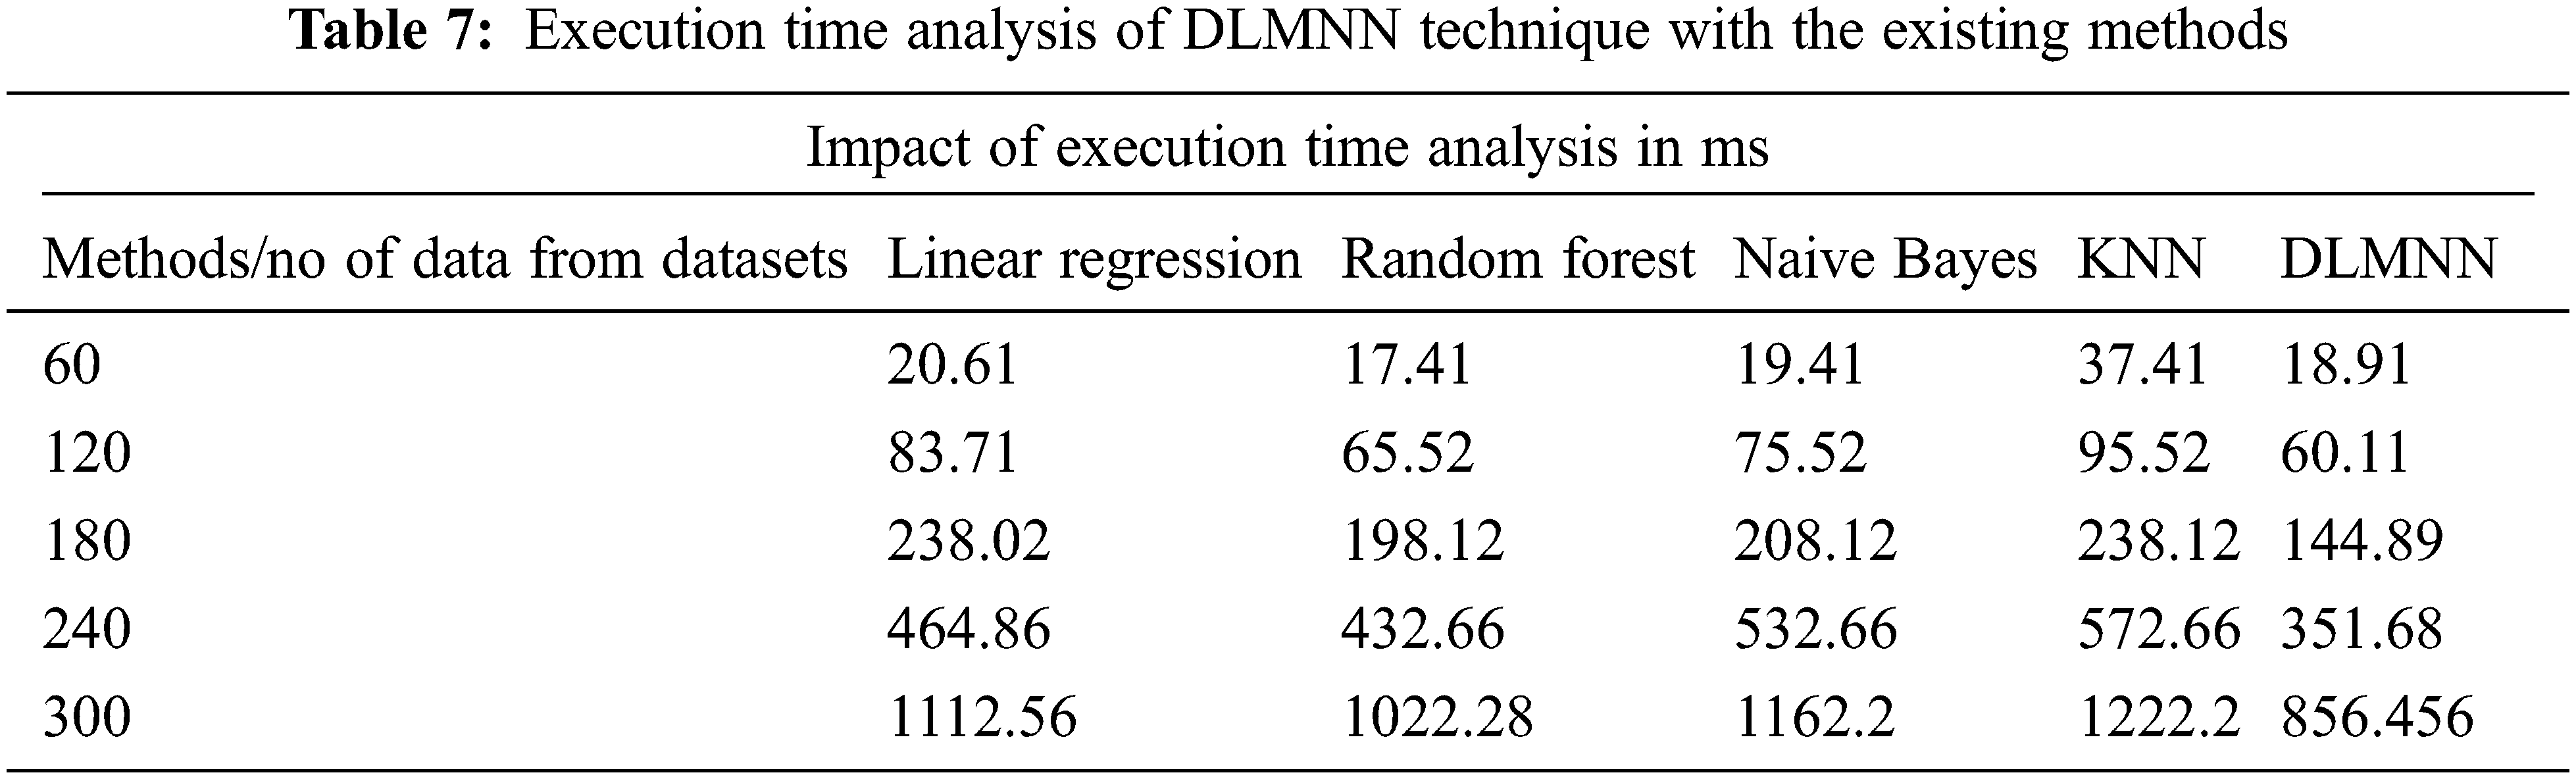
The proposed DLMNN algorithm beats more established approaches such as Linear Regression, Random Forest, Nave Bayes, and KNN in terms of execution time performance. The overall operating time of a computer is calculated as the sum of the time spent by each software application. The sequence of events that occur throughout the execution of a device’s performance. Numerous iterations of a variety of algorithms have occurred. DLMNN outperforms all other methods currently in use. For example, it takes 60.11 ms to run the suggested DLMNN on a 120-point dataset. Clustering the data takes 83.71 ms for Linear Regression, 65.52 ms for Nave Bayes, and 75.52 ms for KNN, which is faster than previous methodologies as showin in Fig. 6. Similarly, existing approaches cluster data more slowly than the recommended method does for the remaining data. As may be observed, the DLMNN system proposed here outperforms more standard techniques as shown in Tab. 7.
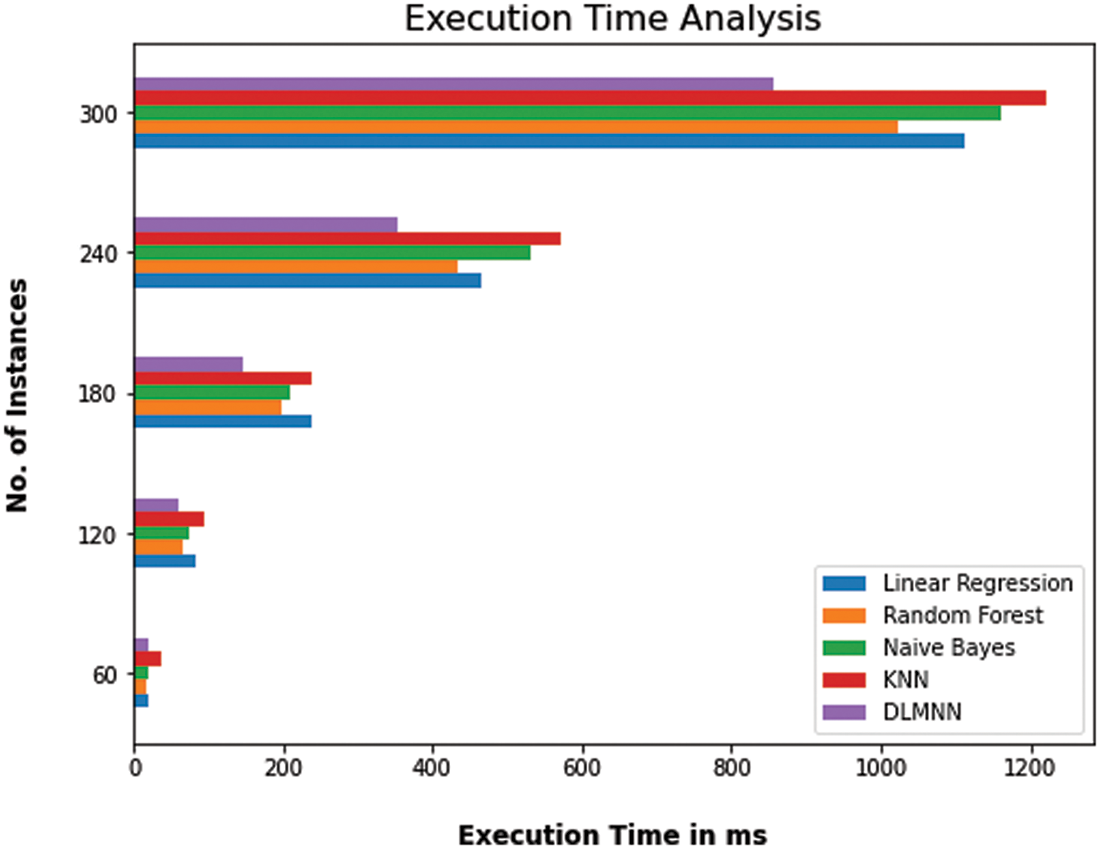
Figure 6: Computation time analysis of DLMNN technique with the existing methods
Heart disease is one of the most serious concerns in today’s globe. Heart disease can be predicted and detected early, reducing the likelihood of death. Because the heart is one of the most vital organs in the human body and the prediction of cardiac problems is a major source of concern for people, algorithm accuracy is one of the performance metrics used to evaluate algorithms. The accuracy of machine learning algorithms can be determined using the datasets used for training and testing. Early identification is critical for developing the most effective treatment for cardiac problems. In this study, the PD-SS-based DLMNN is used to forecast cardiac disease and quantify severity levels. The proposed method is separated into two stages: the first is used to forecast cardiac disease, while the second is used to estimate severity levels. The disease prediction step encompasses data collection, pre-processing, feature extraction, and classification. Three stages are involved in estimating the severity level: pre-processing, feature extraction, and severity level prediction. Two metrics are used to evaluate the recommended system’s performance.
The new DLMNN approach is compared against existing Linear Regression, Random Forest, Nave Bayes, and KNN algorithms in terms of accuracy, precision, recall, and f-measure. The proposed method achieves a precision of 94.21%, an accuracy of 92.38%, an F-score of 92.38%, a recall of 94.62%, and a precision of 93.86%. In general, the results indicate that the proposed DLMNN-based PD-SS approach is more efficient than existing methods. PD-DD based on DLMNN. This algorithm is primarily intended for use in prediction systems for heart disease, but it has the potential to be applied to a range of other critical diseases in the future. Machine learning algorithms will become more prevalent in the future for the best analysis of cardiac problems and for earlier disease prediction, with the goal of lowering the incidence of mortality cases through enhanced disease awareness.
Funding Statement: The authors received no specific funding for this study.
Conflicts of Interest: The authors declare that they have no conflicts of interest to report regarding the present study.
1. U. H. Amin, P. L. Jian, H. M. Muhammad, N. Shah and S. Ruinan, “A hybrid intelligent system framework for the prediction of heart disease using machine learning algorithms,” Mobile Information Systems, vol. 2018, no. 12, pp. 1–21, 2018. [Google Scholar]
2. G. Aditi, K. Gouthami, P. Isha and D. Kailash, “Prediction of heart disease using machine learning,” in Proc. of the 2nd Int. Conf. on Electronics, Communication and Aerospace Technology (ICECA), Coimbatore, India, pp. 102–108, 2018. [Google Scholar]
3. S. Mohan, C. Thirumalai and G. Srivastava, “Effective heart disease prediction using hybrid machine learning techniques,” IEEE Access, vol. 7, no. 8, pp. 81542–81554, 2019. [Google Scholar]
4. S. Himanshu and M. A. Rizvi, “Prediction of heart disease using machine learning algorithms: A survey,” International Journal on Recent and Innovation Trends in Computing and Communication, vol. 5, no. 8, pp. 99–104, 2017. [Google Scholar]
5. M. Nikhil Kumar, K. V. S. Koushik and K. Deepak, “Prediction of heart diseases using data mining and machine learning algorithms and tools,” International Journal of Scientific Research in Computer Science, Engineering and Information Technology, vol. 3, no. 3, pp. 883–898, 2019. [Google Scholar]
6. K. Amandeep and A. Jyoti, “Heart diseases prediction using data mining techniques: A survey,” International Journal of Advanced Research in Computer Science, vol. 9, no. 2, pp. 2015–2019, 2018. [Google Scholar]
7. K. S. Pahulpreet and A. Shriya, “Application of machine learning in diseases prediction,” in 4th IEEE Int. Conf. on Computing Communication and Automation, Greater Noida, India, pp. 149–153, 2018. [Google Scholar]
8. J. Soni, U. Ansari, D. Sharma and S. Soni, “Predictive data mining for medical diagnosis: An overview of heart disease prediction,” International Journal of Computer Applications, vol. 17, no. 8, pp. 43–48, 2011. [Google Scholar]
9. C. S. Dangare and S. S. Apte, “Improved study of heart disease prediction system using data mining classification techniques,” International Journal of Computer Applications, vol. 47, no. 10, pp. 44–48, 2012. [Google Scholar]
10. C. Ordonez, “Association rule discovery with the train and test approach for heart disease prediction,” IEEE Transactions on Information Technology in Biomedicine, vol. 10, no. 2, pp. 334–43, 2012. [Google Scholar]
11. S. Rayen and J. Arunajsmine, “Social media networks owing to disruptions for effective learning,” Procedia Computer Science, vol. 172, no. 2, pp. 145–151, 2020. [Google Scholar]
12. D. Paulraj, “A gradient boosted decision tree-based sentiment classification of twitter data,” International Journal of Wavelets, Multiresolution and Information Processing, vol. 18, no. 4, pp. 1–21, 2020. [Google Scholar]
13. D. Paulraj, “An automated exploring and learning model for data prediction using balanced ca-svm,” Journal of Ambient Intelligence and Humanized Computing, vol. 12, no. 5, pp. 1–17, 2020. [Google Scholar]
14. M. Ranjith Kumar, V. Chandra Shekhar Rao, A. Rohit Anand and S. Harinder, “Interpretable filter based convolutional neural network for glucose prediction and classification using PD-SS algorithm,” Measurement, vol. 183, no. 10, pp. 1–13, 2021. [Google Scholar]
15. C. Pretty Diana Cyril, J. Rene Beulah, N. Subramani, A. Harshavardhan and D. Sivabalaselvamani, “An automated learning model for sentiment analysis and data classification of twitter data using balanced CA-SVM,” Concurrent Engineering Research and Applications, vol. 29, no. 4, pp. 386–395, 2020. [Google Scholar]
16. G. Reshma, A. Chiai, N. Vinay Kumar, B. Geetha, G. Sunitha et al., “Deep learning-based skin lesion diagnosis model using dermoscopic images,” Intelligent Automation & Soft Computing, vol. 31, no. 1, pp. 621–634, 2021. [Google Scholar]
17. A. Arun, B. Raghu Ram, M. H. Bhalchandra, T. Kumar and M. Ashok, “An automated word embedding with parameter tuned model for web crawling,” Intelligent Automation & Soft Computing, vol. 32, no. 3, pp. 1617–1632, 2022. [Google Scholar]
18. P. Asha, L. Natrayan, B. T. Geetha, J. Rene Beulah, R. Sumathy et al., “IoT enabled environmental toxicology for air pollution monitoring using AI techniques,” Environmental Research, vol. 205, no. 2, pp. 1–15, 2022. [Google Scholar]
19. R. Shinde, S. Arjun, P. Patil and J. Waghmare, “An intelligent heart disease prediction system using k-means clustering and naïve Bayes algorithm,” International Journal of Computer Science and Information Technologies, vol. 6, no. 1, pp. 637–649, 2012. [Google Scholar]
20. R. Zhang, S. Ma, L. Shanahan, J. Munroe, S. Horn et al., “Automatic methods to extract New York heart association classification from clinical notes,” in IEEE Int. Conf. on Bioinformatics and Biomedicine, Kansas City, MO, USA, pp. 1296–1299, 2017. [Google Scholar]
21. S. Bashir, U. Qamar and M. Y. Javed, “An ensemble-based decision support framework for intelligent heart disease diagnosis,” in IEEE Int. Conf. on Information Society (i-Society 2014), London, UK, pp. 259–64, 2014. [Google Scholar]
22. V. Sindu and P. Mohan, “Comparative analysis among decision tree vs. naive Bayes for prediction of weather prognostication,” Smart Intelligent Computing and Communication Technology, vol. 38, no. 10, pp. 94–100, 2020. [Google Scholar]
23. G. Guidi, M. C. Pettenati, P. Melillo and E. Iadanza, “A machine learning system to improve heart failure patient assistance,” IEEE Journal of Biomedical and Health Informatics, vol. 18, no. 6, pp. 1750–1756, 2014. [Google Scholar]
24. G. Twig, G. Yaniv, H. Levine, A. Leiba, N. Goldberger et al., “Body-mass index in 2.3 million adolescents and cardiovascular death in adulthood,” New England Journal of Medicine, vol. 374, no. 25, pp. 2430–2440, 2016. [Google Scholar]
25. M. Abdar, U. R. Acharya, N. Sarrafzadegan and V. Makarenkov, “NE-Nu-SVC: A new nested ensemble clinical decision support system for effective diagnosis of coronary artery disease,” IEEE Access, vol. 7, no. 7, pp. 167605–167620, 2019. [Google Scholar]
26. A. Kaur and J. Arora, “Heart disease prediction using data mining techniques: A survey,” International Journal of Advanced Research Computter Science, vol. 9, no. 2, pp. 569–572, 2018. [Google Scholar]
27. Detrano, R., Janosi, A., Steinbrunn, W., Pfisterer, M. and Schmid, J., (1989). International application of a new probability algorithm for the diagnosis of coronary artery disease. American Journal of Cardiology, vol. 64, no. 3, pp. 304–310. [Google Scholar]
28. K. M. Almustafa, (2020). Prediction of heart disease and classifiers’ sensitivity analysis. BMC Bioinformatics, vol. 21, no. 278, pp. 1–18. [Google Scholar]
29. H. Almarabeh and E. Amer, “A study of data mining techniques accuracy for healthcare,” International Journal Computer Application, vol. 168, no. 3, pp. 12–17, 2017. [Google Scholar]
30. M. S. Amin, Y. K. Chiam and K. D. Varathan, “Identification of significant features and data mining techniques in predicting heart disease,” Telematics and Informatics, vol. 36, no. 2, pp. 82–93, 2019. [Google Scholar]
31. S. Satpathy, M., Debbarma Swapana, S. C. Sengupta Aditya and K. D. Bhattacaryya Bidyut, “Design a FPGA, fuzzy based, insolent method for prediction of multi-diseases in rural area,” Journal of Intelligent & Fuzzy Systems, vol. 37, no. 5, pp. 7039–7046, 2019. [Google Scholar]
 | This work is licensed under a Creative Commons Attribution 4.0 International License, which permits unrestricted use, distribution, and reproduction in any medium, provided the original work is properly cited. |