DOI:10.32604/iasc.2023.028574
| Intelligent Automation & Soft Computing DOI:10.32604/iasc.2023.028574 | |
| Article |
Ensemble Deep Learning for IoT Based COVID 19 Health Care Pollution Monitor
Department of Computer Sciences, College of Computer and Information Sciences, Princess Nourah Bint Abdulrahman University, Riyadh, 11671, Saudi Arabia
*Corresponding Author: Nithya Rekha Sivakumar. Email: NRRaveendiran@pnu.edu.sa
Received: 13 February 2022; Accepted: 29 April 2022
Abstract: Internet of things (IoT) has brought a greater transformation in healthcare sector thereby improving patient care, minimizing treatment costs. The present method employs classical mechanisms for extracting features and a regression model for prediction. These methods have failed to consider the pollution aspects involved during COVID 19 prediction. Utilizing Ensemble Deep Learning and Framingham Feature Extraction (FFE) techniques, a smart healthcare system is introduced for COVID-19 pandemic disease diagnosis. The Collected feature or data via predictive mechanisms to form pollution maps. Those maps are used to implement real-time countermeasures, such as storing the extracted data or feature in a Cloud server to minimize concentrations of air pollutants. Once integrated with patient management systems, this solution would minimize pollution emitted via patient’s sensors by offering spaces in the cloud server when pollution thresholds are reached. Second, the Gini Index factor information gain technique eliminates unimportant and redundant attributes while selecting the most relevant, reducing computing overhead and optimizing system performance. Finally, the COVID-19 disease prognosis ensemble deep learning-based classifier is constructed. Experimental analysis is planned to measure the prediction accuracy, error, precision and recall for different numbers of patients. Experimental results show that prediction accuracy is improved by 8%, error rate was reduced by 47% and prediction time is minimized by 36% compared to existing methods.
Keywords: Internet of Things; Covid-19; ensemble deep learning; framingham feature extraction
An IoT framework was designed in [1] to first obtain real-time symptom data from users with the purpose of early identification of suspected corona viruses cases, monitoring response rate recovered from virus, and to comprehend virus nature by data analysis. The framework included five different stages. They were, Symptom Data gathering and uploading via wearable sensors, design of Quarantine Center, Data Analysis, preserving good Health Physicians and Data Storage and Retrieval using Cloud Infrastructure. To identify the coronavirus cases eight different machine learning algorithms were utilized. Experiments were also conduct to analyze the method using real COVID-19 symptom dataset. With this accurate identification of disease analysis were made. Despite improvement observed in disease analysis, the time involved in analysis was not concentrated. In [2] for predicting the novel corona virus (COVID-19) pandemic, a Multi-Task Gaussian Process (MTGP) regression model was presented. The suggested MTGP regression model was developed with the intent of globally predicting the outbreak. With the design of this model, speedy and wide spread can be minimized to certain extent and contributing to minimum error rate. Despite improvements observed in the accuracy rate and validation of prediction results on the basis of reduction of error, the accuracy aspect with respect to pollution monitoring was not focused.
For IoTs related to health sciences with eco systems, pollution monitoring is a critical criterion to consider when it comes to Quality of Service, i.e., accuracy, error and time involved in prediction of COVID-19 pandemic disease. The goal is to develop a pollution monitoring system for health care that will improve QoS with regard to enhance QoS in prediction accuracy, prediction time and error. Usually, IoT through sensors gathering patient’s data, huge sum of pollution is supposed to be created by sensors while extracting healthcare data.
In existing systems prediction accuracy, recall, precision was not improved in order to overcome this issue, a new technique called Framingham Feature-based Exponential Linear Ensemble Deep Learning (FF-ELEDP) was designed for enhancing the COVID-19 disease prediction accuracy with minimum error rate.
But still, a cloud server is applied to store the patient’s data, though suffer since serious pollution issues, therefore affecting time, accuracy and error involved in COVID-19 pandemic disease prediction. With these situations to monitor the COVID-19 disease prediction with pollution aspect, a pollution threshold is utilized to map the pollution data into cloud server (i.e., placing the users or patients in containment zones or making the zones with highly pollution being a containment area and so on during extraction of features). The objective is to use the extracted clinical data to forecast a disease, such that the user’s mobility trend could be analyzed and isolation could be recommended according on their present health situation.
The contributions include the following:
1. An IoT health care pollution monitor cloud computing network-based framework is suggested regarding COVID-19 disease prediction in case of high level of pollution (i.e., higher persons infected with disease and creating pollution in a particular area or zone.).
2. The patient’s pollution monitor based COVID-19 disease prediction model is projected to assist the human being affected with disease regarding staying at home and maintaining social distance while the patient is detected with COVID-19. The pollution monitoring model shows better precision than the existing methods.
3. A Cloud-based Framingham Feature Extraction model is initial design to extract the relevant features for COVID-19 detection via Pollution Map and Pollution Threshold that checks with corresponding threshold in case of emergency or pollution.
4. An Exponential Linear Ensemble Deep Learning algorithm is considered by the extracted feature aimed at detection also the occurrence or absentee of disease by engaging suitable knowledge of parameters.
5. The proposed method was implemented and verified through 500 records of samples. The prediction accuracy, prediction time and error for different samples by using proposed technique are determined and theoretical study shows the suggested technique surpasses current best practice techniques.
6. The remainder of the article is laid out in the succeeding manner. The associated work is conferred in section two. Section 3 introduces suggested Framingham Feature-based Exponential Linear Ensemble Deep Learning (FF-ELEDP) approach. Section 4 examines the suggested method’s efficiency, followed by in depth discussion in Section 5. Lastly, Section 6 possesses the conclusion.
The internet of things (IoT) is a surfacing prototype which empowers the transmission of data across gadgets and sensors over the internet in attempt to ease the livelihood. This is performed by employing smart gadgets and the internet to ensure novel solutions to a variety of ultimatums and concerns with in health sector, as well as public and private industries across the globe. The swift facilitation in sensor tied up with Internet technologies have given the domain of health care technology an additional magnitude.
A hospital at home model that is IoT-based and cloud computing-based was proposed [3]. A review article involving both social and technological perspective was analyzed in [4]. However, the continuous change in location of the users places the major issues in monitoring healthcare. To address this issue, a healthcare framework considering mobility pattern was proposed in [5] with the purpose of minimizing the energy and delay involved in predicting health status.
From the point of view of patient monitoring, one of the most essential element of an IoT based model involved is the Wireless Body Area Networks (WBAN). The WBANs comprises of minute devices or sensors involved that are placed in the human body that communicates with other sensors wirelessly. An architecture specifically was designed in [6] concentrating on pulse rate, oxygen ratio and so on. Yet another Silver Birch Trees was utilized in [7] for air pollution monitoring.
In today’s era, as far as academic research is concerned, work across different scientific and technological fields, specifically in the health care domain, is rapidly progressing with IoT. As a consequence, a new technology known as fog computing is used to bridge between the cloud and consumers reducing latency issues and hence enhancing access.
In [8], proper functioning of heart was analyzed was validation was also performed. A smart healthcare system was also proposed in [9] to monitor patient’s basic health signs in real time manner, therefore contributing to minimizing error percentage. An emerging 5G-IoT scenario was discussed in detail in [10].
A delay intensive and resource intensive framework was designed in [11] ensuring optimal offloading. This was attained using Firefly algorithm, therefore contributing to both energy consumption and computational time. Physical layer and multiple access layers [12] were combined to minimize energy consumed for IoT in E-Health applications. Yet another paper was designed in [13] by employing a real-time encoding system which conducts recursive threshold and wavelet coefficient estimation.
An Internet of Healthcare Thing system for respiratory devices concentrating error was designed in [14]. Performance of protocol stacks for transportation of healthcare monitoring data was proposed in [15] over the user access network supporting the connected health model. However, with high data traffic generated via healthcare IoT devices results in network congestion and high latency. To address this issue, an analytical model to reduce the latency was proposed in [16].
The road map to network architecture in India with the consequences of IoT in healthcare sector was analyzed in depth for COVID-19 pandemic in [17]. Yet another study of IoT towards healthcare acceptance in Malaysia was analyzed in [18]. A comprehensive survey of IoT for healthcare was investigated in [19]. Maximum the current methods prediction mechanism goes to optimal, moreover minimalizing the prediction time or improving the prediction accuracy. Single-objective optimization, on the other side, can reduce the cloud-based data center’s efficiency and effectiveness. To execute such kinds of applications or tasks i.e., prediction of COVID-19 with respect to healthcare pollution monitoring aspects with minimum prediction time and error and higher prediction accurateness remains the exciting issue.A robust IoT and deep learning-based multi-modal data classification method was designed in [20] for accurate prediction of COVID-19. It consist of two lightweight models, namely CovParaNet for audio (cough, speech, breathing) classification and CovTinyNet for image (X-rays, CT scans) classification. But prediction time was higher.IoT-based conceptual architecture was introduced in [21] for a COVID-19 patient monitoring system. The results include a valid and extensively used early-warning score method for checking and monitoring hospitalized patients and contains a mechanism for customizing this assessment method to guarantee the individualization of assessments. However prediction accuracy was not enhanced. A smart health monitoring system was designed in [22] with Internet of Things (IoT) technology for monitoring blood pressure, heart rate, oxygen level, and temperature of a person. It was mainly employed for rural areas or villages where nearby clinics can be in touch with city hospitals about their patient health conditions. But error rate was higher. An IoT-cloud-based healthcare predictive model was developed in [23] to identify COVID-19 using eKNN. A novel enhanced KNN classifier (eKNN) was selects the k value using a radical mathematical function instead of choosing it randomly. But latency was not reduced. A smart healthcare system was proposed in [24] that integrate IoT-cloud technologies for detecting and classifying COVID-19. The system employs smart sensors to gather data from medical images. However prediction time was higher. A3D medical watermarking algorithm based on wavelet transform was designed in [25]. The proposed algorithm employs the principal component analysis (PCA) transform for minimizing the data dimension, which can reduce the error between the extracted components and the original data inthe mean square sense. But time consumption was higher. A two-stage reversible robust audio watermarking algorithm was proposed in [26] for preserving medical audio data. The scheme decomposes the medical audio into two independent embedding domains, embeds the robust watermark and the reversible watermark into the two domains respectively. Hurst exponent was employed to identify a suitable position for watermark embedding .However error rate was not reduced. In related works the overall existing paper analysis, covid 19 disease predicting accuracy was not improved with minimum time for overcoming this problem a new technique called Cloud-based Framingham Feature Extraction (FFE) model was introduced.This article has proposed a Cloud-based Framingham Feature Extraction algorithm. IoT devices offload data or features to cloud server based on the pollution threshold. This may reduce the prediction time and therefore progress prediction accuracy of finding patients with COVID-19 symptoms. Proposed FF-ELEDP method also with the deployment of Exponential Linear Ensemble Deep Learning algorithm reduces the error rate involved in prediction also.
Intensively go over how to extract structured and categorical attributes from data, as well as how to turn the data into a structured form utilizing normalization. Initially, Cloud-based Framingham Feature Extraction (FFE) model is designed. Then, perform ensemble deep learning COVID-19 virus prediction.
As in Fig. 1, proposed FF-ELEDP method comprises of two steps. In the first step, with COVID-19 dataset in India provided as input, the objective remains in extracting the essential and relevant features for future prediction considering the healthcare pollution monitoring via Cloud Server. Next, with the extracted features, exponential deep learning with exponential linear function is applied for COVID-19 disease prediction in an accurate manner.
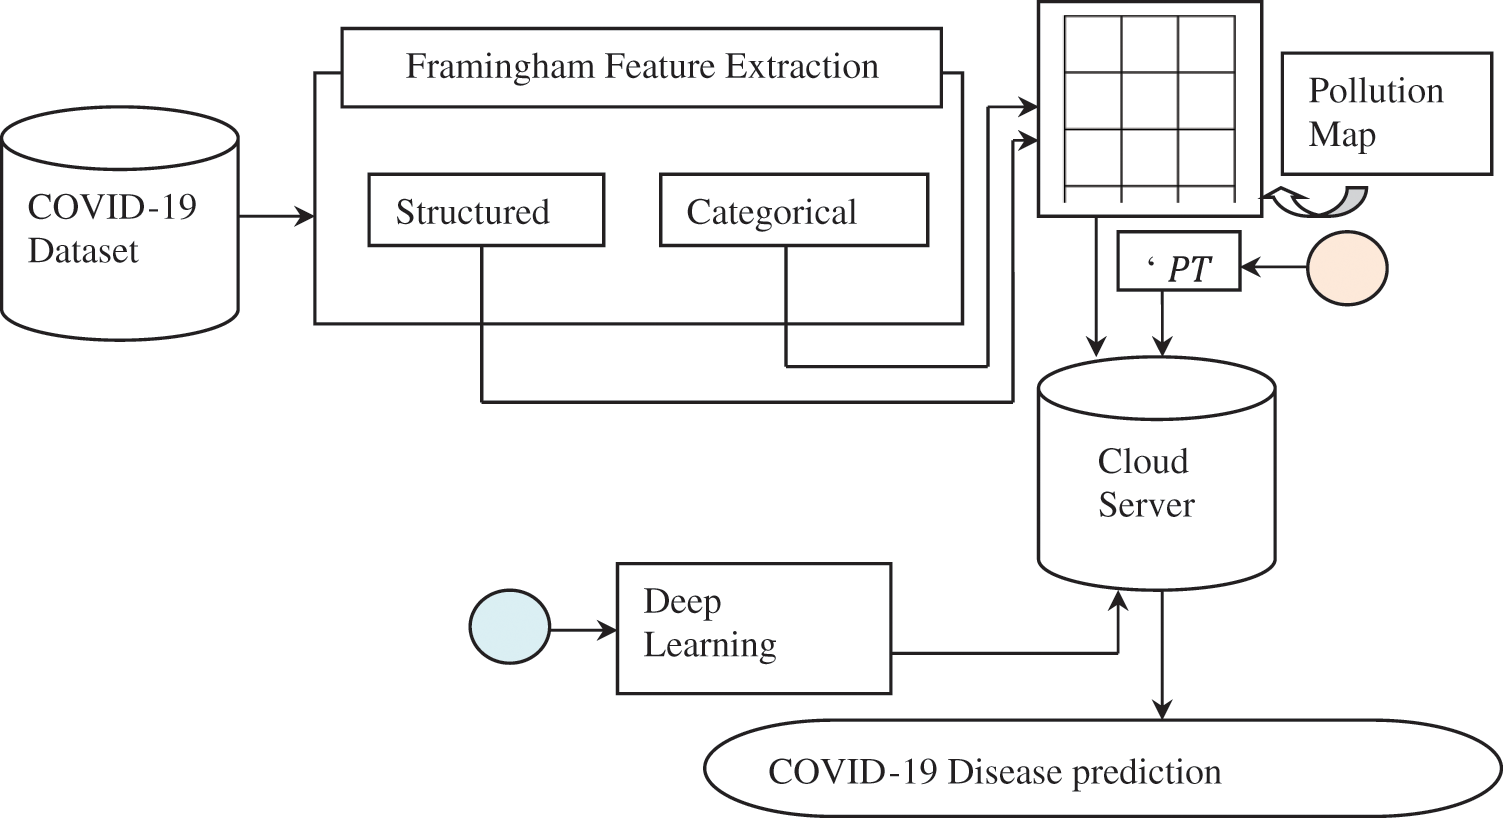
Figure 1: Block diagram of framingham feature-based exponential linear ensemble deep learning (FF-ELEDP)
3.1 Cloud-Based Framingham Feature Extraction (FFE) Model
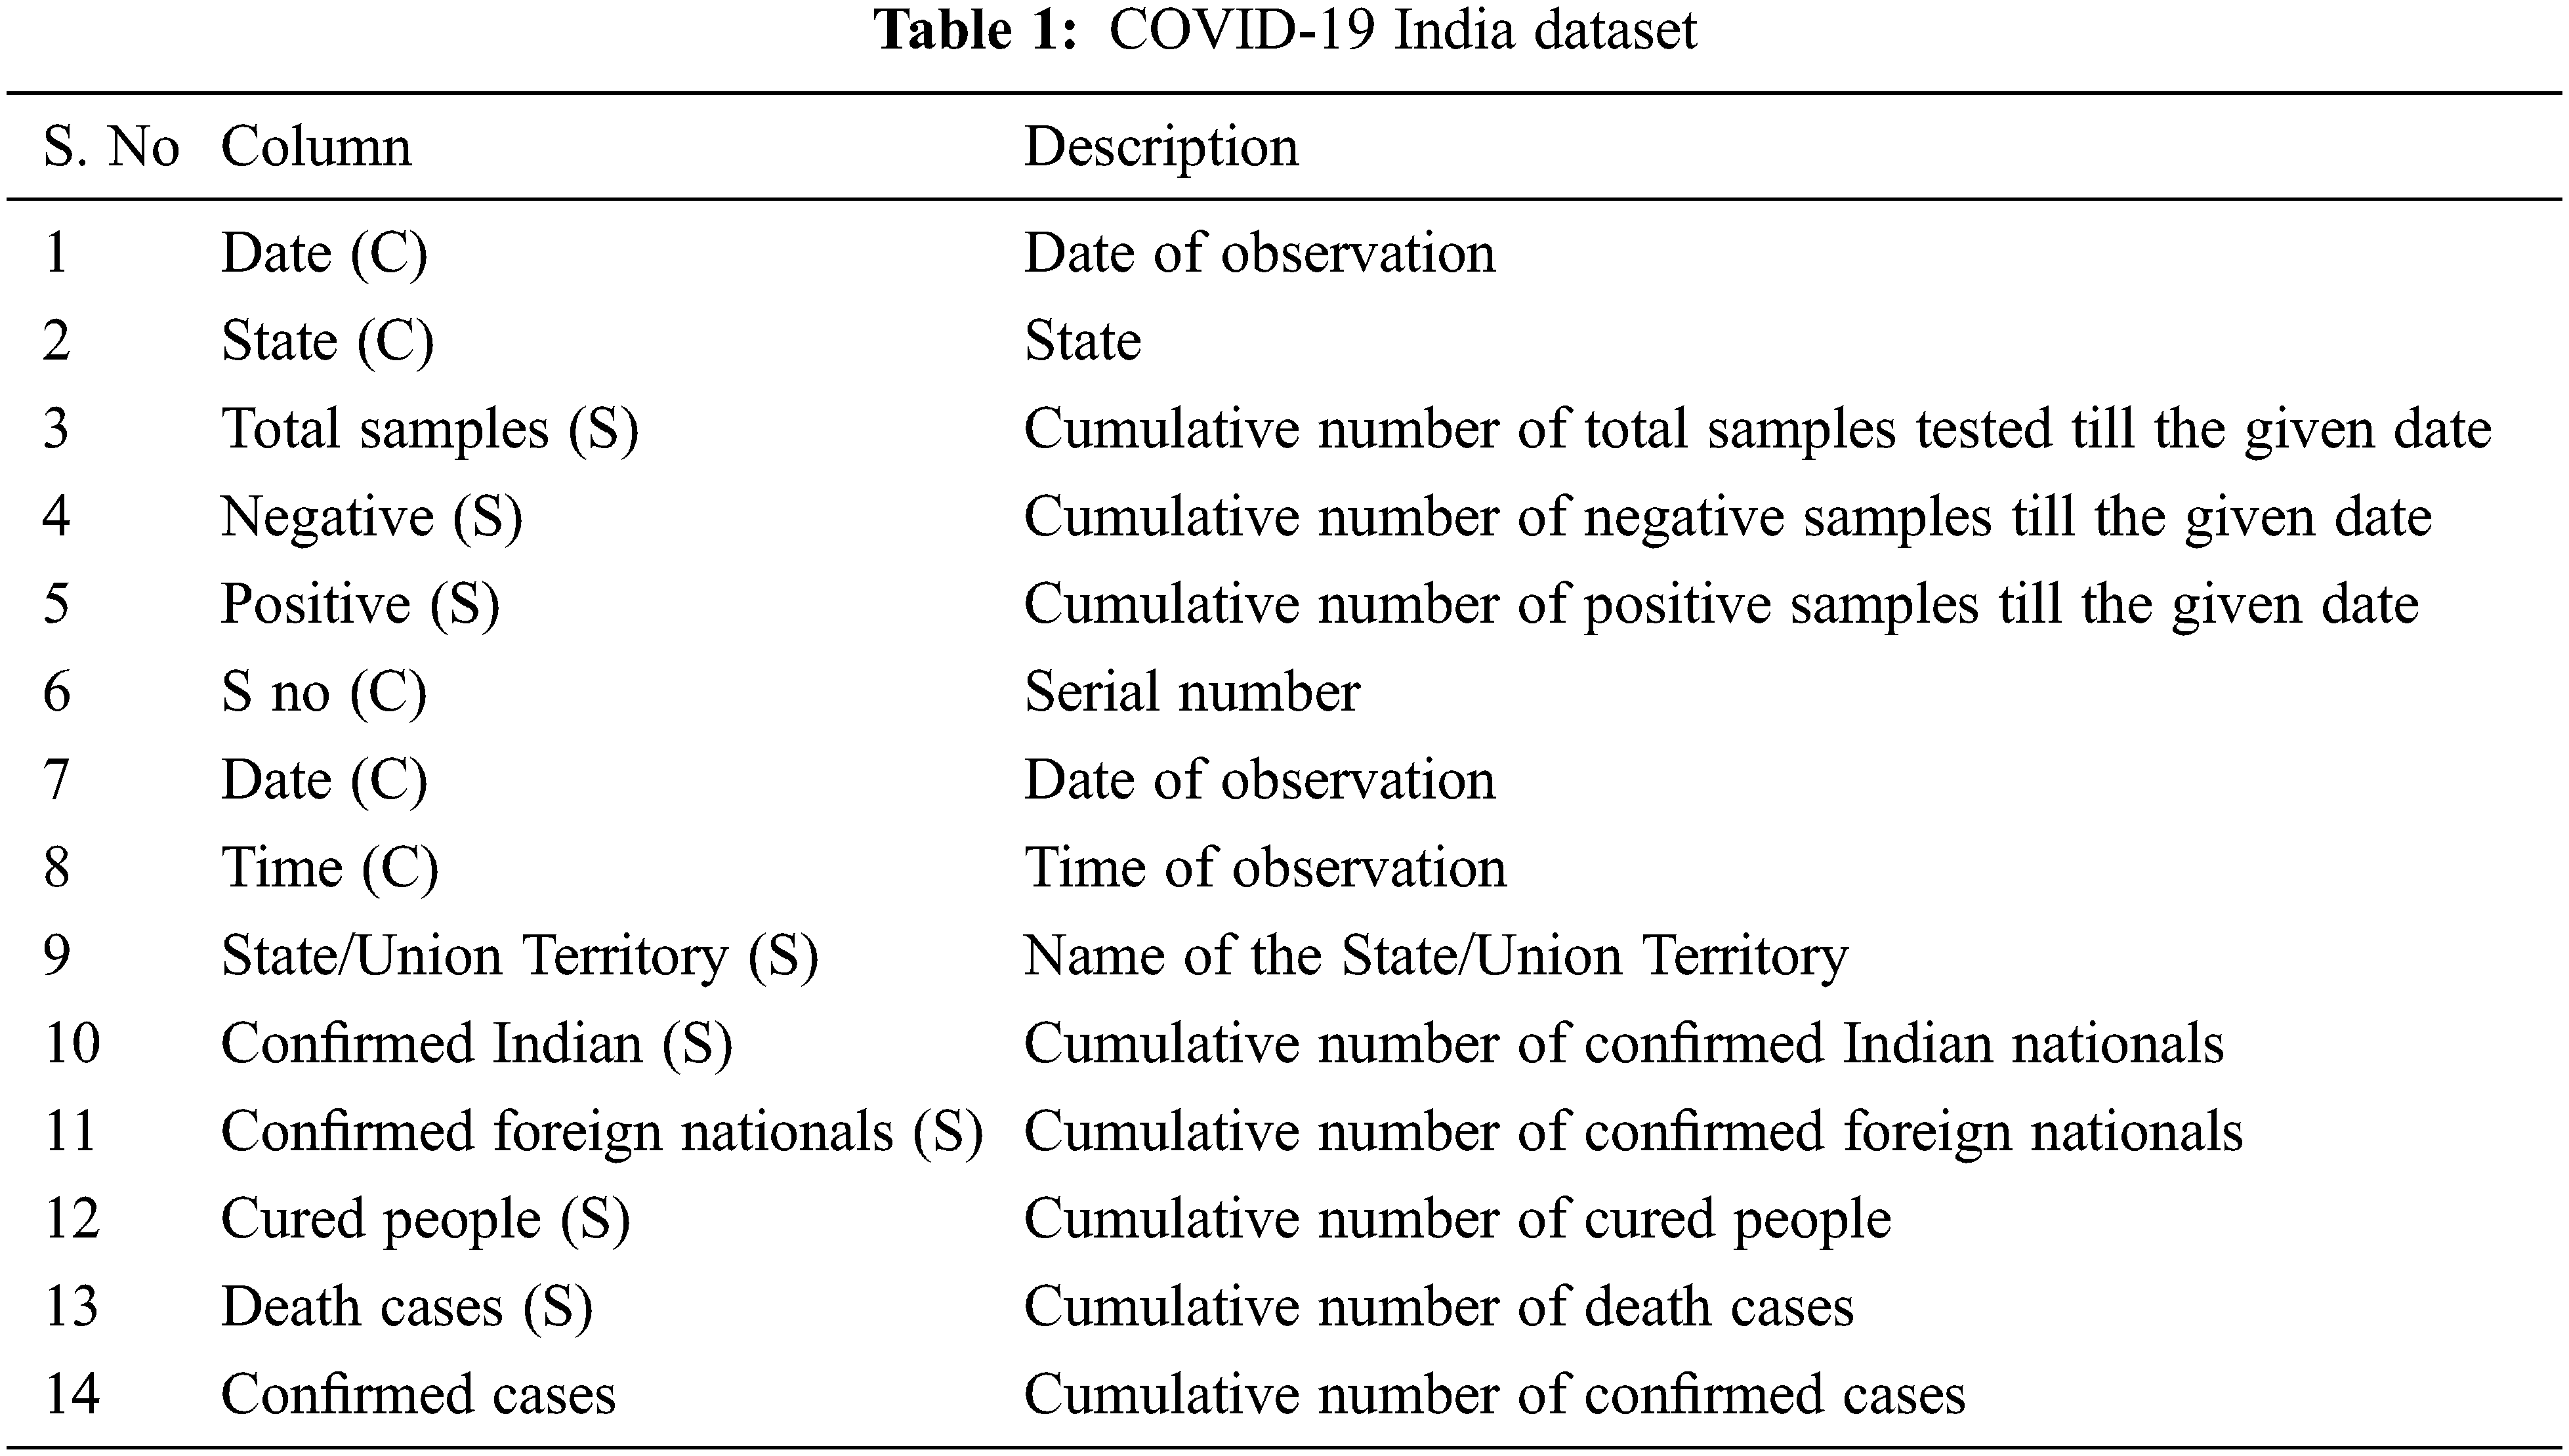
Consider technique by feature extraction model since unstructured data (i.e., feature), data’s (feature’s) conversion to structured format. FFE model generates valuable healthcare data for both the structured (i.e., structured format, like, total samples, negative, positive, state/union territory, etc.) and categorical features (i.e., date, time, state, etc.).
With this FFE model, the result is able to investigate the collected feature or data via predictive mechanisms to form pollution maps. Those maps are used to implement real-time countermeasures, such as storing the extracted data or feature in a Cloud server to minimize concentrations of air pollutants. Once integrated with patient management systems, this solution would minimize pollution emitted via patient’s sensors by dynamically offering spaces in the cloud server when pollution thresholds are reached. Fig. 2 shows the block diagram of Framingham Feature Extraction model.
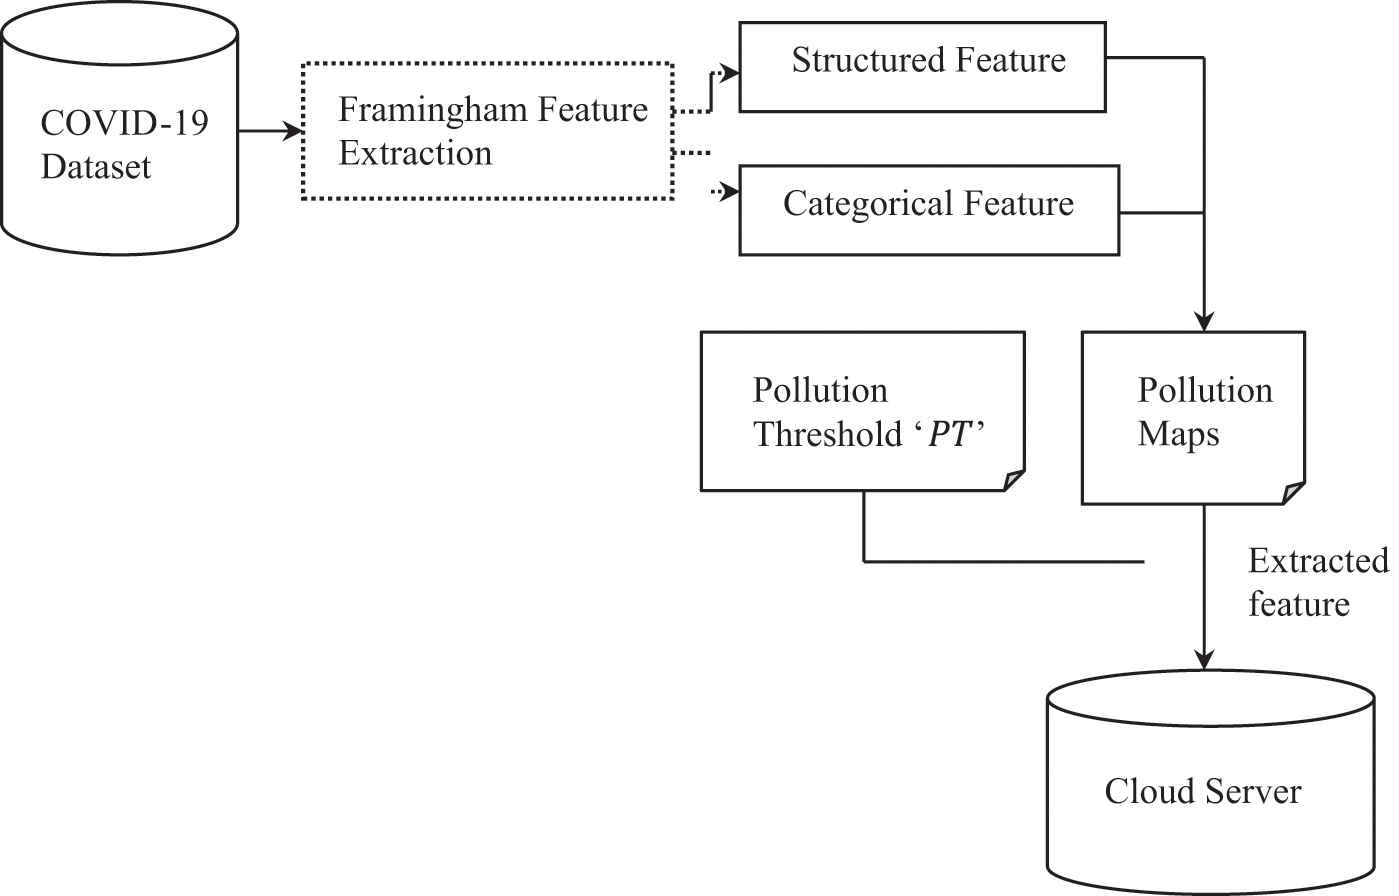
Figure 2: Block diagram of framingham feature extraction
As in Fig. 2, data collected using wearable sensors and medical records consist of incorrect and noisy information. Data from wearable-sensors for coronavirus disease classification wreak havoc by signal aberration lowering the predictive performance. The features are extracted in our work by employing Framingham Feature Extraction model. This feature extraction model cleans the data by splitting the dataset into structural feature ‘
From the above Eq. (1), ‘
From the above Eqs. (2) and (3), ‘
From the above Eqs. (4) and (5), the Gini Index Factor separately for structure feature ‘
As given in the above Cloud-based Framingham Feature Extraction algorithm with COVID -19 dataset [20] provided as input, the objective here remains in extracting the most relevant and robust features according to structured and categorical features obtained via patient’s sensors. Next, Gini indexed factor is evaluated separately for both structured and categorical factors, therefore removing irrelevant and redundant features.
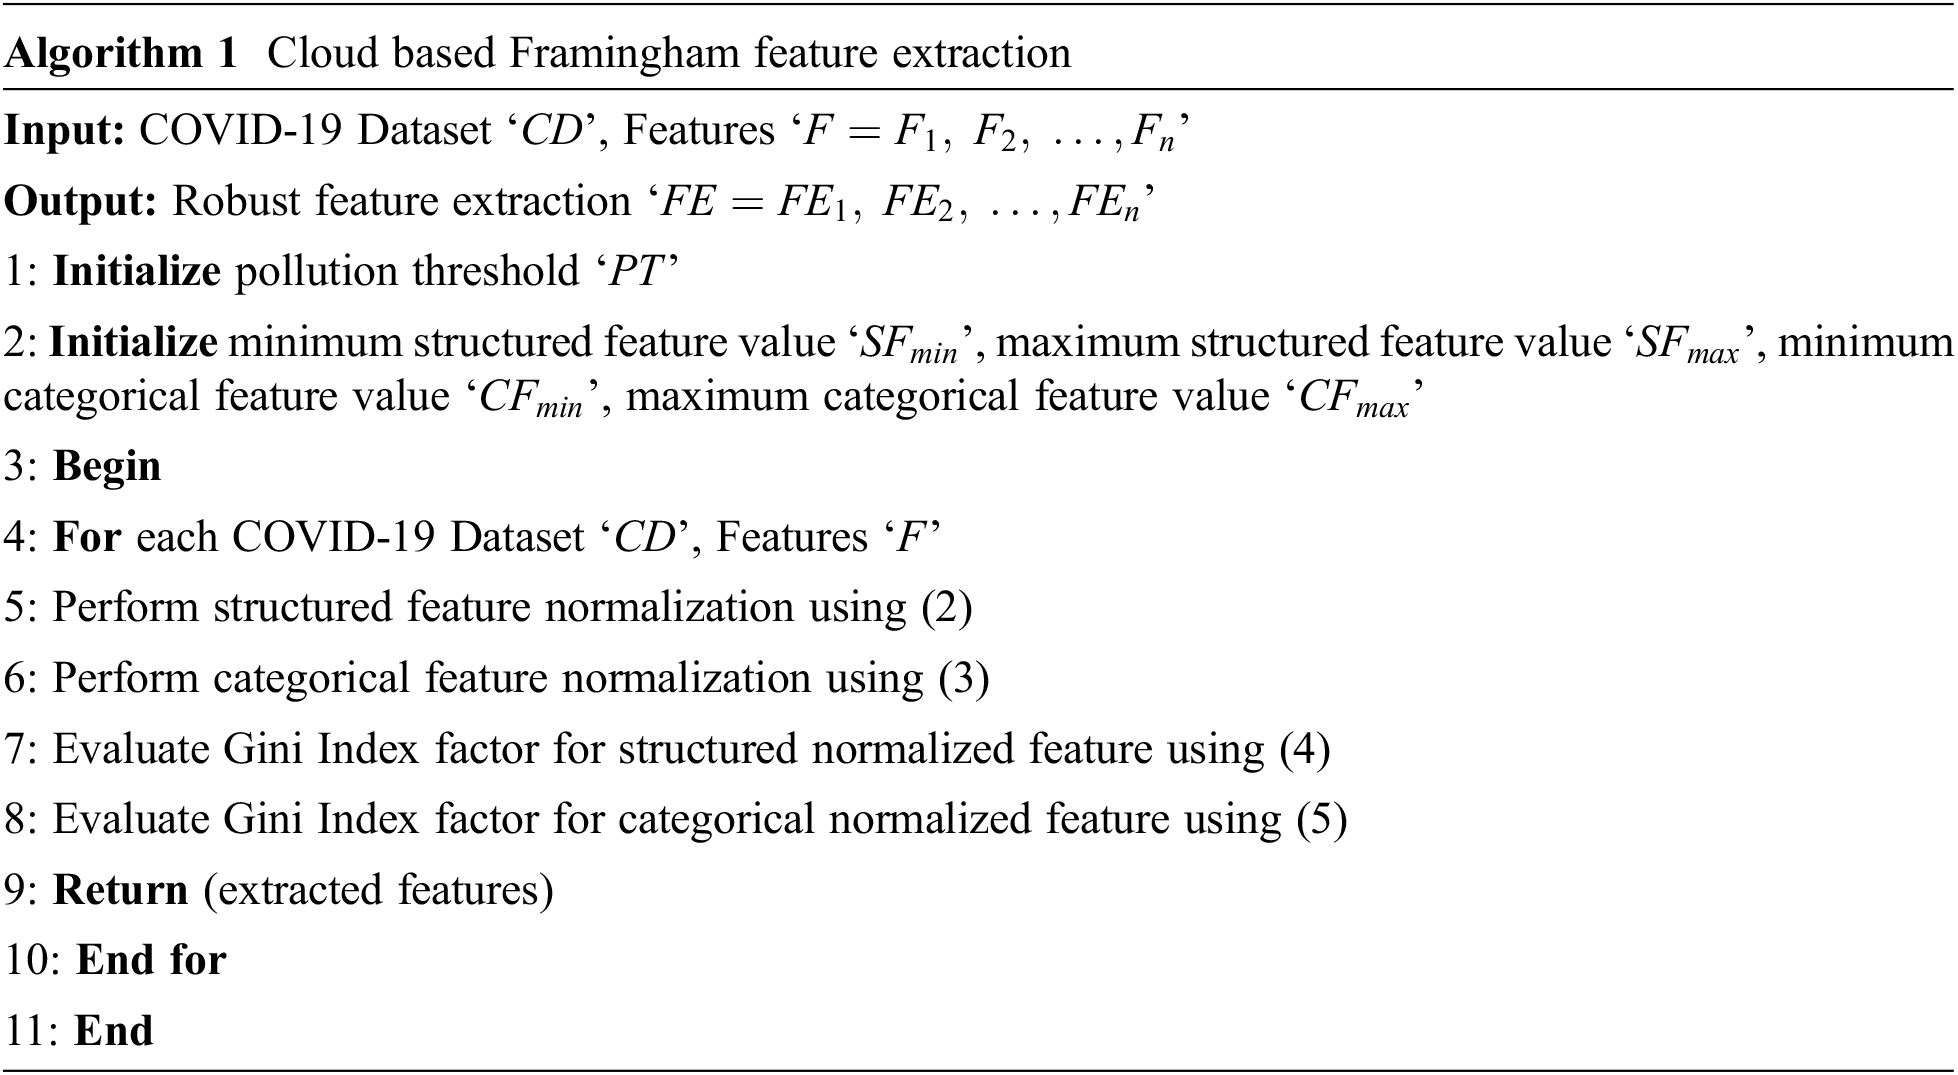
With the obtained Gini indexed factor based on the initialized pollution threshold ‘
3.2 Exponential Linear Ensemble Deep Learning Model
In this section, with the extracted features based on the pollution maps leaving minimum room with health care pollution monitoring via cloud server, an Exponential Linear Ensemble Deep Learning model is built to train coronavirus sickness classification. This Exponential Linear Ensemble Deep Learning employs back propagation mechanism for binary classification of COVID-19 diseases.
Different numbers of features was utilized to train model with the extracted features, prediction has been made in this section as presented in Fig. 3, it shows the block diagram of Exponential Linear Ensemble Deep Learning model.
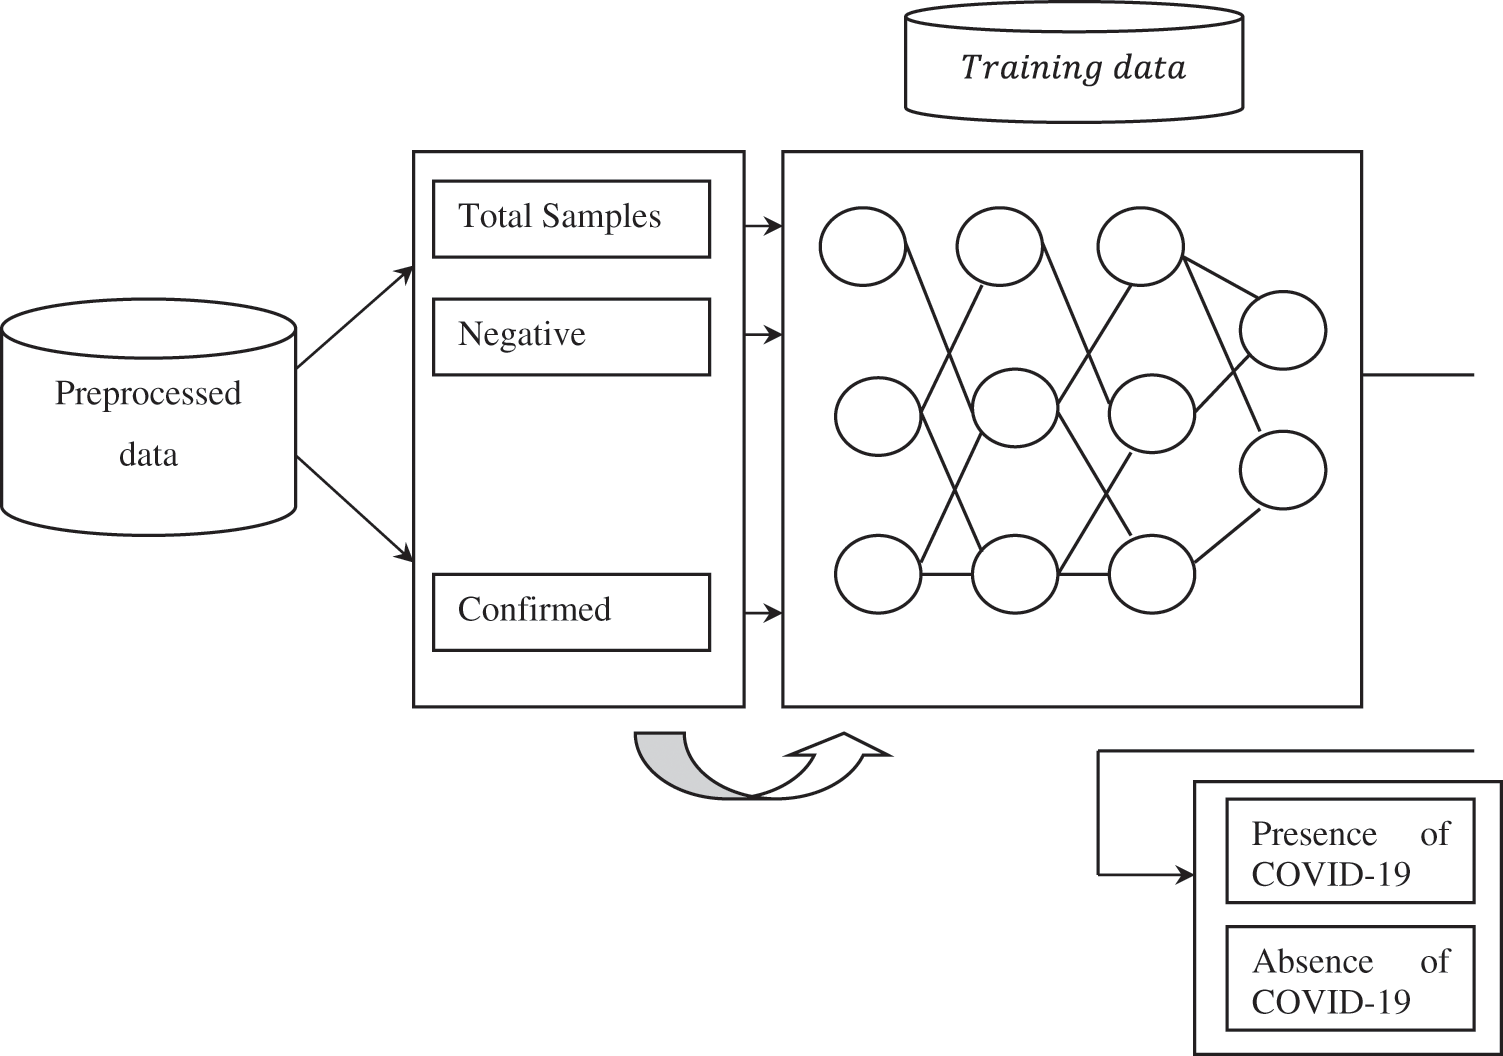
Figure 3: Block diagram of exponential linear ensemble deep learning model
As illustrated in Fig. 3, the Exponential Linear Ensemble Deep Learning structure imposes five containers, one input layer followed by three hidden layers and one output layer. Input layer includes 8 nodes (i.e., 8 features, Total samples, negative, positive, date, state, cured, death, confirmed) and are utilized to evaluate the hidden layers. We investigate a completely connected hidden layer with eight neurons that produces reliable results in the proposed work.
The features are passed to the first layer of the deep neural network. By multiplying their respective weights with values, these eight features are subsequently proceeded to the three hidden layers. Here, weight is first evaluated and bias value is included with purpose of processing the input feature in the hidden layer nodes and formulated as given below.
From Eq. (6), ‘
The derivative of ELU is then formulated as given below.
To forecast coronavirus pandemic in India, the transformed data is then sent to the output layer. The binary classifier’s outcomes of the presence or absence of the pandemic are represented by the size of the final layer, which comprises two neurons. During deep learning training, the weights are adjusted as follows.
The Eq. (9), the weights ‘
From Eq. (10), an error factor ‘
As given in the above Exponential Linear Ensemble Deep Learning algorithm, with the extracted features, the objective here remains in learning accurate and precise COVID-19 disease prediction with conscious healthcare pollution monitor. This is achieved by applying Exponential Linear function to the extracted features and updating the weight based on the derivative of ELU and the learning parameters. Finally, prediction is made according to the results of back propagation mechanism.

The proposed method FF-ELEDP was implemented using the JAVA libraries and CloudSim Simulator. FF-ELEDP is evaluated with benchmark dataset COVID-19 in India dataset. Dataset includes information from day-to-day state-wise sum of cases, total samples, sum of positive cases, sum of negative cases, date of observation, time of observation, state from where samples were obtained, cumulative number of confirmed Indian nations, cumulative number of foreign nations, cured people, death cases and confirmed cases obtained from COVID-19 India Dataset. The evaluation of the results was conducted on specific parameters such as, pandemic prediction time, pandemic prediction accuracy, error aimed at different sample frequencies collected on different time intervals. Tab. 1 given below provides the dataset details.
Deep learning (DL) consists of several containers so called layers. The DL structure is used to analyze data. With such architecture, the input is processed via different layers. Where each produces an output with the aid of the previous layer that is passed as an input to the succeeding layer. Analyzing health sciences issues assist investigators identify a different level for assisting the medical sector. Due to the high prevalence of transfer through IoT devices, early detection and isolation of the infected persons remain foremost crucial aspects in handling this disease.
In this work, a Cloud-based FF-ELEDP method is proposed towards Health Care Pollution Monitor with the objective of controlling the COVID-19 pandemic. First, relevant features are extracted by employing Cloud-based Framingham Feature Extraction model. With this feature extraction model, relevant features for COVID-19 disease prediction are extracted so that the pollution is said to be controlled. Here, pollution is controlled by dividing the country, state, district into different zones.
With this, control measures can be made in an efficient manner by isolating certain district and taking preventive measures accordingly. Then, with the extracted feature, i.e., splitting the entire state into district and district into zones in case of the pollution map exceeding the pollution threshold, the pandemic prediction time and accuracy can be improved. With the extracted features, next, disease prediction is made by employing three layers via ensemble deep learning model.
The main significant parameters of investigation aimed at IoTs associated towards health sciences with eco systems is the rate of accuracy with which the prediction is made. This is because accurateness stands straight connected to health sciences by way of prevention can also be made and therefore reducing pollution. Prediction accuracy is measured as given below.
From (11), prediction accuracy ‘
From (12), the prediction time ‘
From the above Eq. (13), the root mean square ‘
The outcome study aimed at various metrics, prediction time, prediction accuracy and error rate for outbreak of pandemic corona virus in India is discussed with health sciences and eco system and comparison is made with FF-ELEDP method and existing methods, IoT-based framework [1] and Multi-Task Gaussian Process (MTGP) [2] using COVID-19 India dataset from Kaggle.
4.3.1 Performance Measure of Mrediction Accuracy
To determine the efficacy of FF-ELEDP method, various parameters were employed. Prediction accuracy indicates overall prediction ability of deep learning method. Tab. 2 shows the results of the performance evaluation of the prediction accuracy using the three methods, FF-ELEDP, IoT-based framework [1] and MTGP [2] respectively.
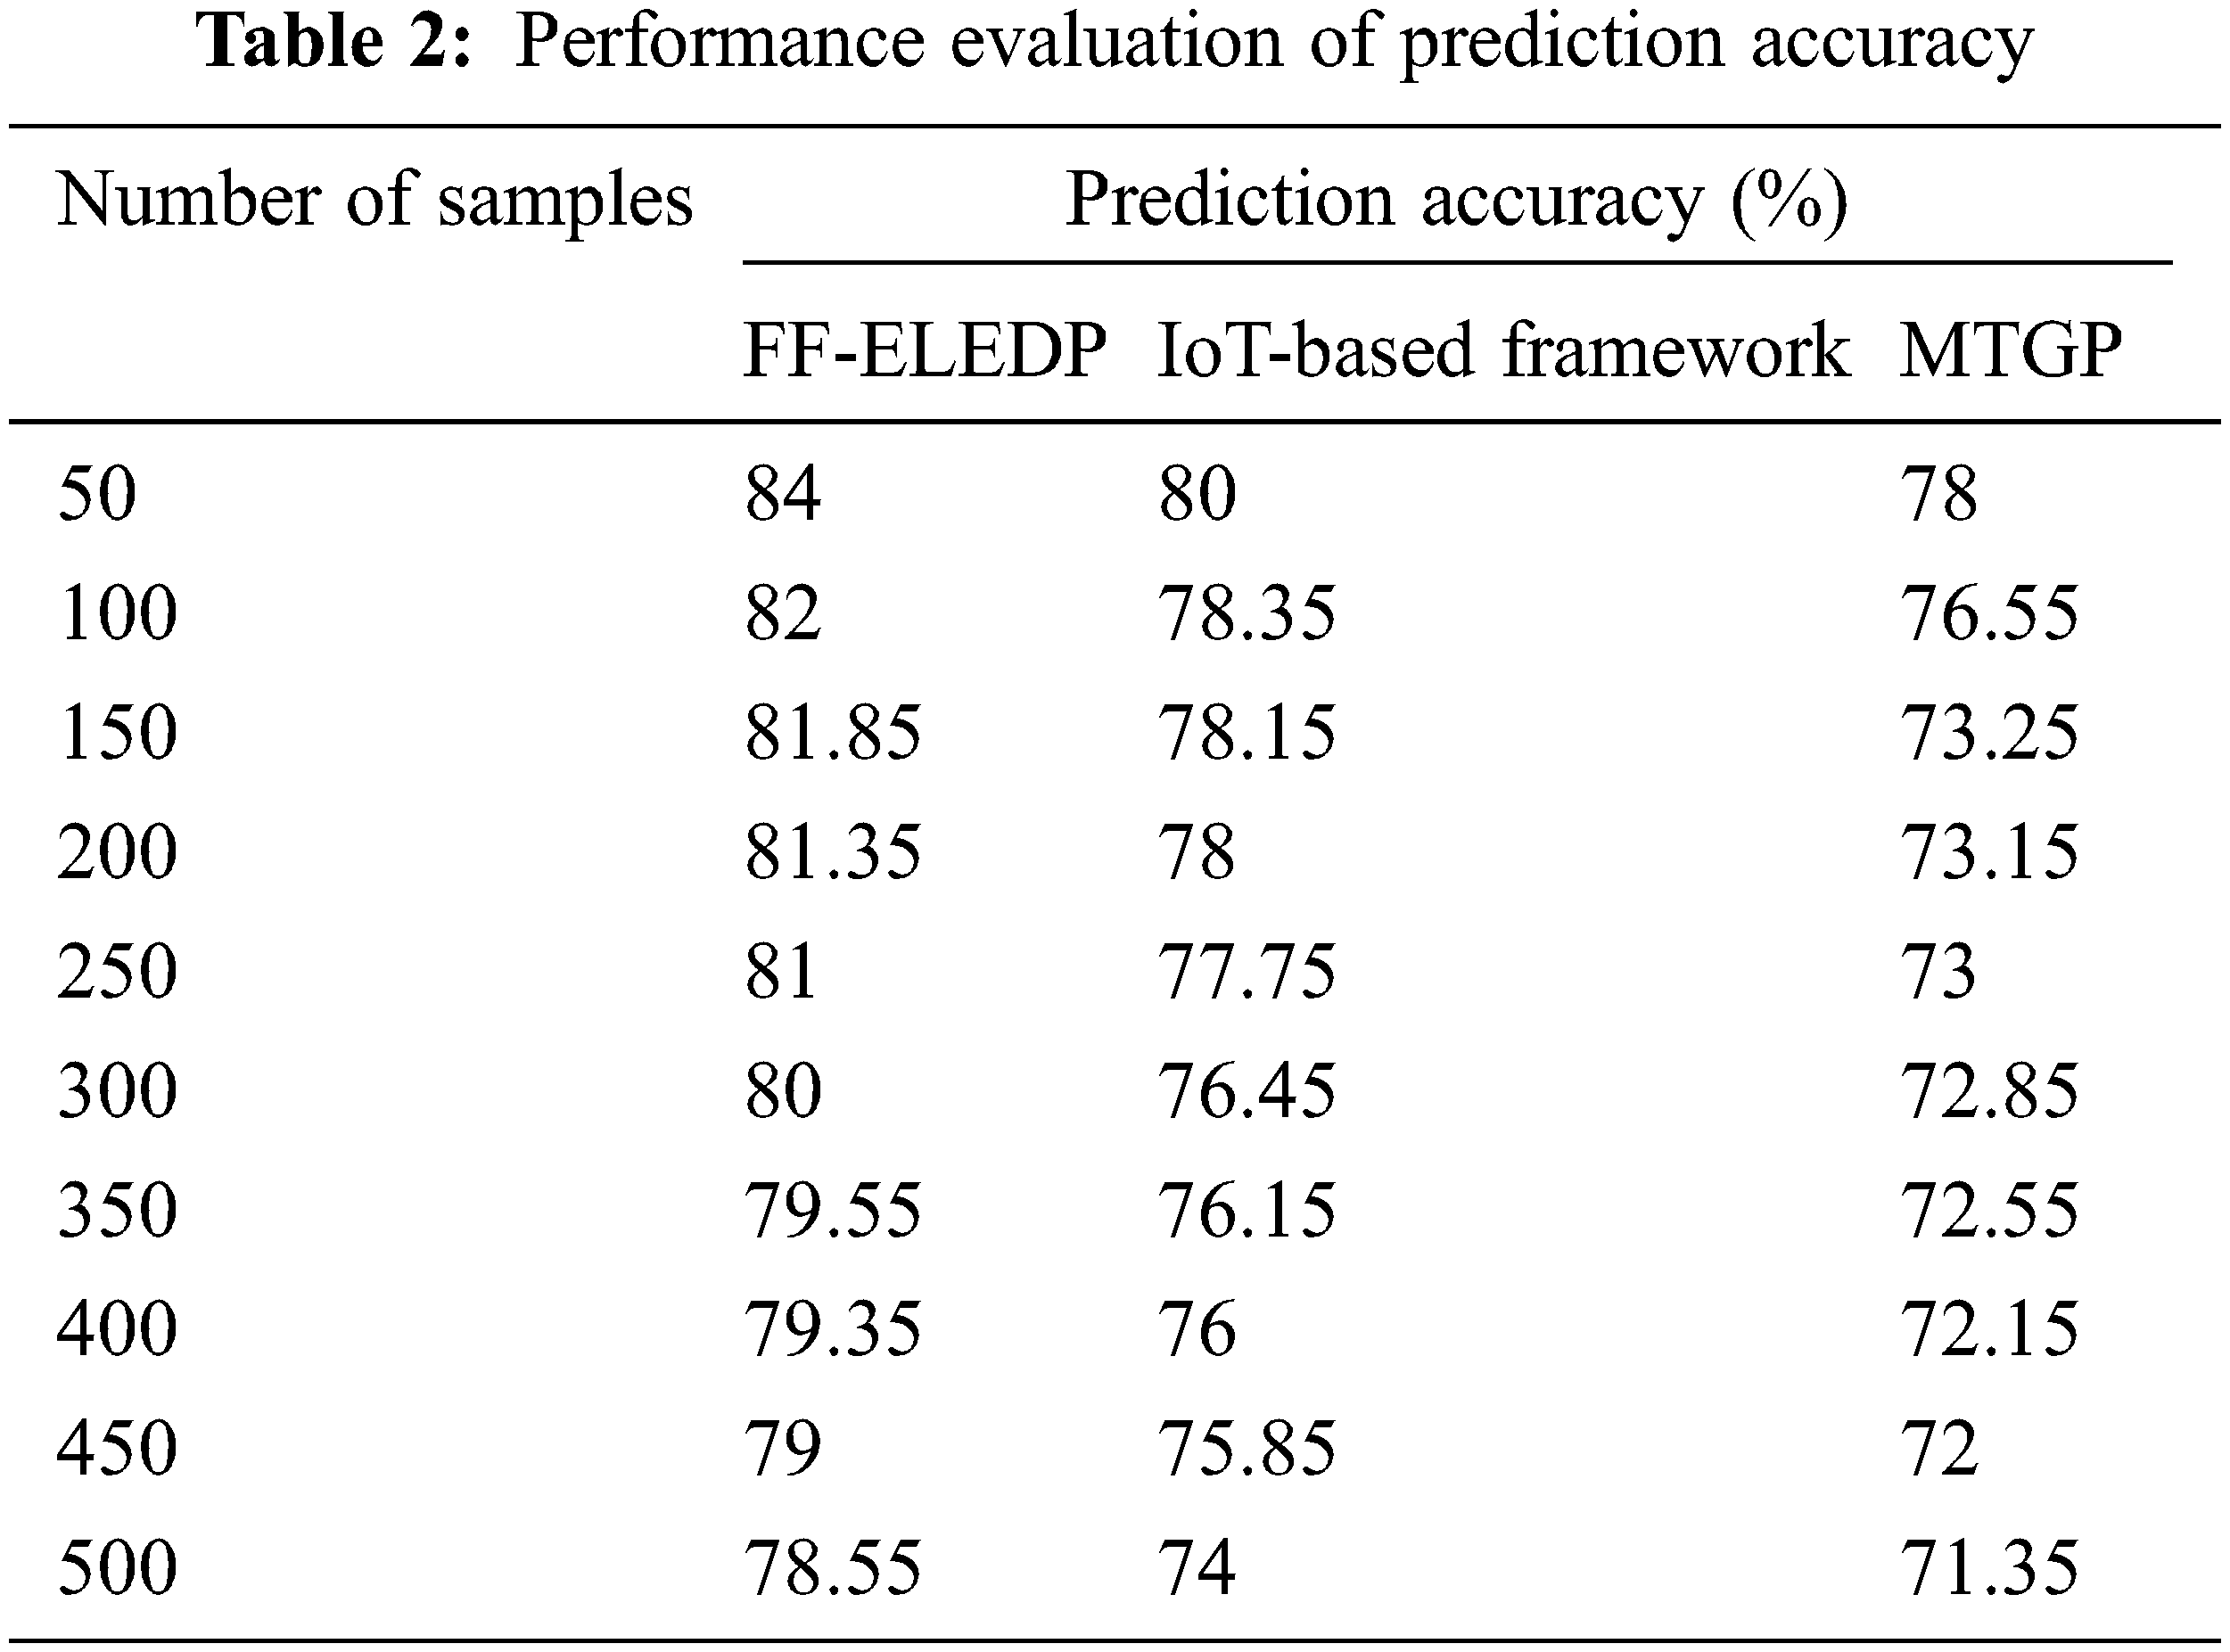
Tab. 2 reports the performance of prediction accuracy using three methods namely FF-ELEDP, IoT-based framework [1], and MTGP [2] with respect to the number of samples. The observed results prove that the proposed FF-ELEDP performs well in terms of achieving higher prediction accuracy than the other two existing methods. Fig. 4 explains prediction accurateness with 500 different numbers of samples collected between the month of April 2020 and June 2020 in Tamil Nadu from both male and female. From Fig. 4, the prediction accuracy is inversely proportional to number of samples provided as input. In additional, increasing the number of samples causes a proportionate decrease in prediction accuracy. However, with ‘ ’ numbers of samples considered for simulation and ‘ ’ numbers of sample correctly predicted using FF-ELEDP, ‘ ’ numbers of sample correctly predicted using [1] and ‘ ’ numbers of sample correctly predicted using [2], the overall prediction accuracy was observed to be 84%, 80% and 78% using the three different methods.The motives behind the enhancement are due to application of Cloud-based Framingham Feature Extraction model. Through applying this model, only applicable features elaborated in prediction remained extracted through resources of pollution threshold. This stayed achieved through splitting the features into structured and categorical that in turn extracts the related features, so exactly predicting the COVID-19 pandemic using FF-ELEDP by 5% and 10% as compared to [1,2].
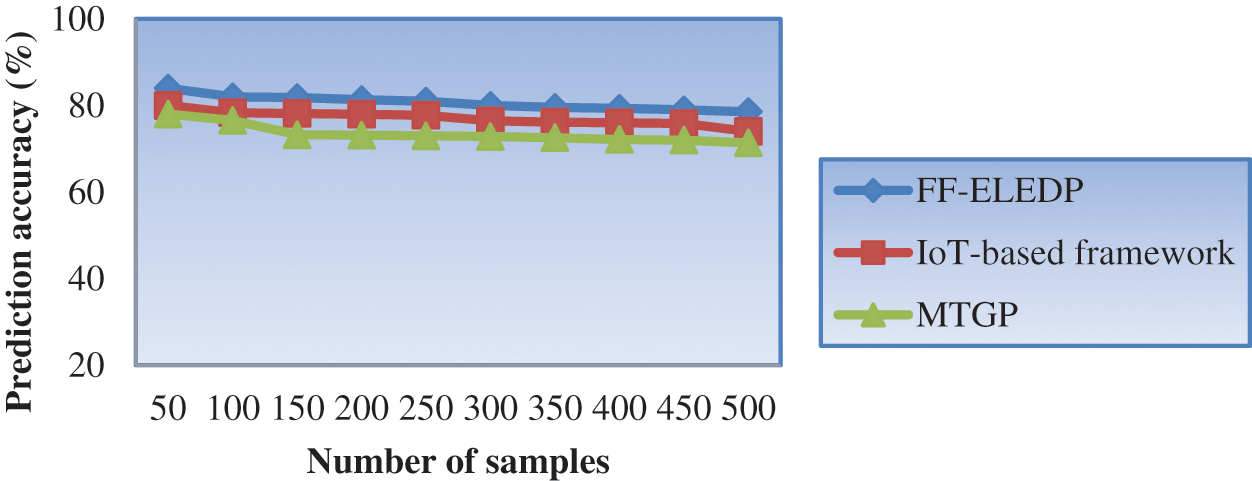
Figure 4: Graphical representation of prediction accuracy
4.3.2 Performance Measure of Prediction Time
The unit prediction time intricate in health sciences aimed at COVID-19 prediction by means of the proposed ensemble deep learning method remains presented. Tab. 3 shows results of performance evaluation of the prediction time by means of the three methods, FF-ELEDP, IoT-based framework [1] and MTGP [2] respectively.
Tab. 4 given above show the prediction time results based on a number of sample images. With the collected samples, the time involved was analyzed and plotted in the above figure. As shown in Fig. 5, the performance of prediction time is increased linearly while increasing the count of sample images for all three methods. However, the prediction time was found to be minimized using the FF-ELEDP model upon comparison with IoT-based framework [1] and MTGP [2]. Here 500 numbers of samples collected from Tamil Nadu during the period 01/04/2020 to 15/04/2020 were utilized for analysis. From Fig. 5, prediction time is initiated right proportional to number of samples provided as input. Increasing the number of samples causes an upsurge in the testing made and also upsurge in the swab samples made and visibly prediction time is too found to be increased.With ‘ ’ numbers of samples taken used for investigation and time consumed in predicting single sample being ‘
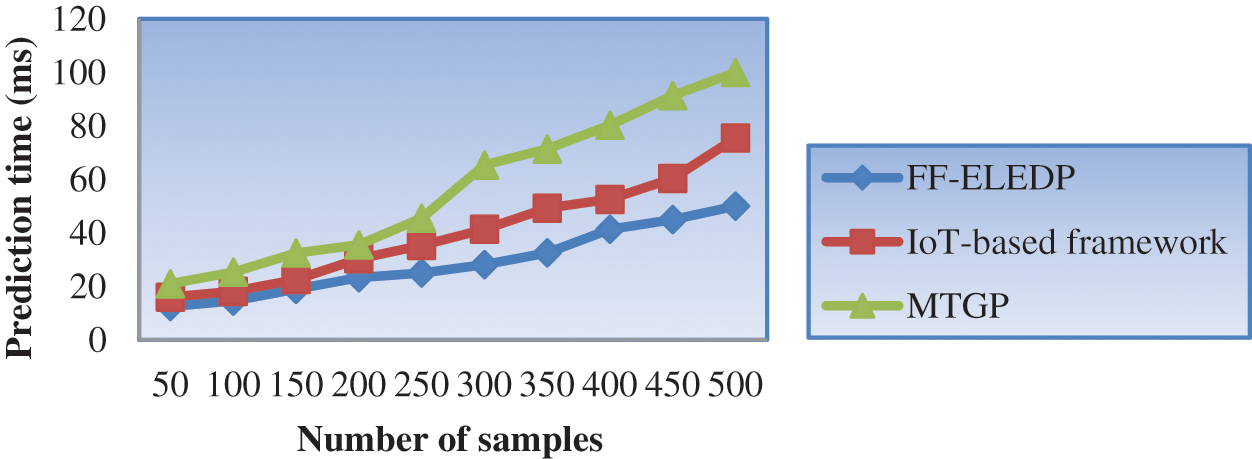
Figure 5: Graphical representation of prediction time
4.3.3 Performance Measure of Error Rate
Lastly, the error rate involved in the prediction is measured. Tab. 4 shows the results of the performance evaluation of the prediction time by means of the three methods, FF-ELEDP, IoT-based framework [1] and MTGP [2] respectively.
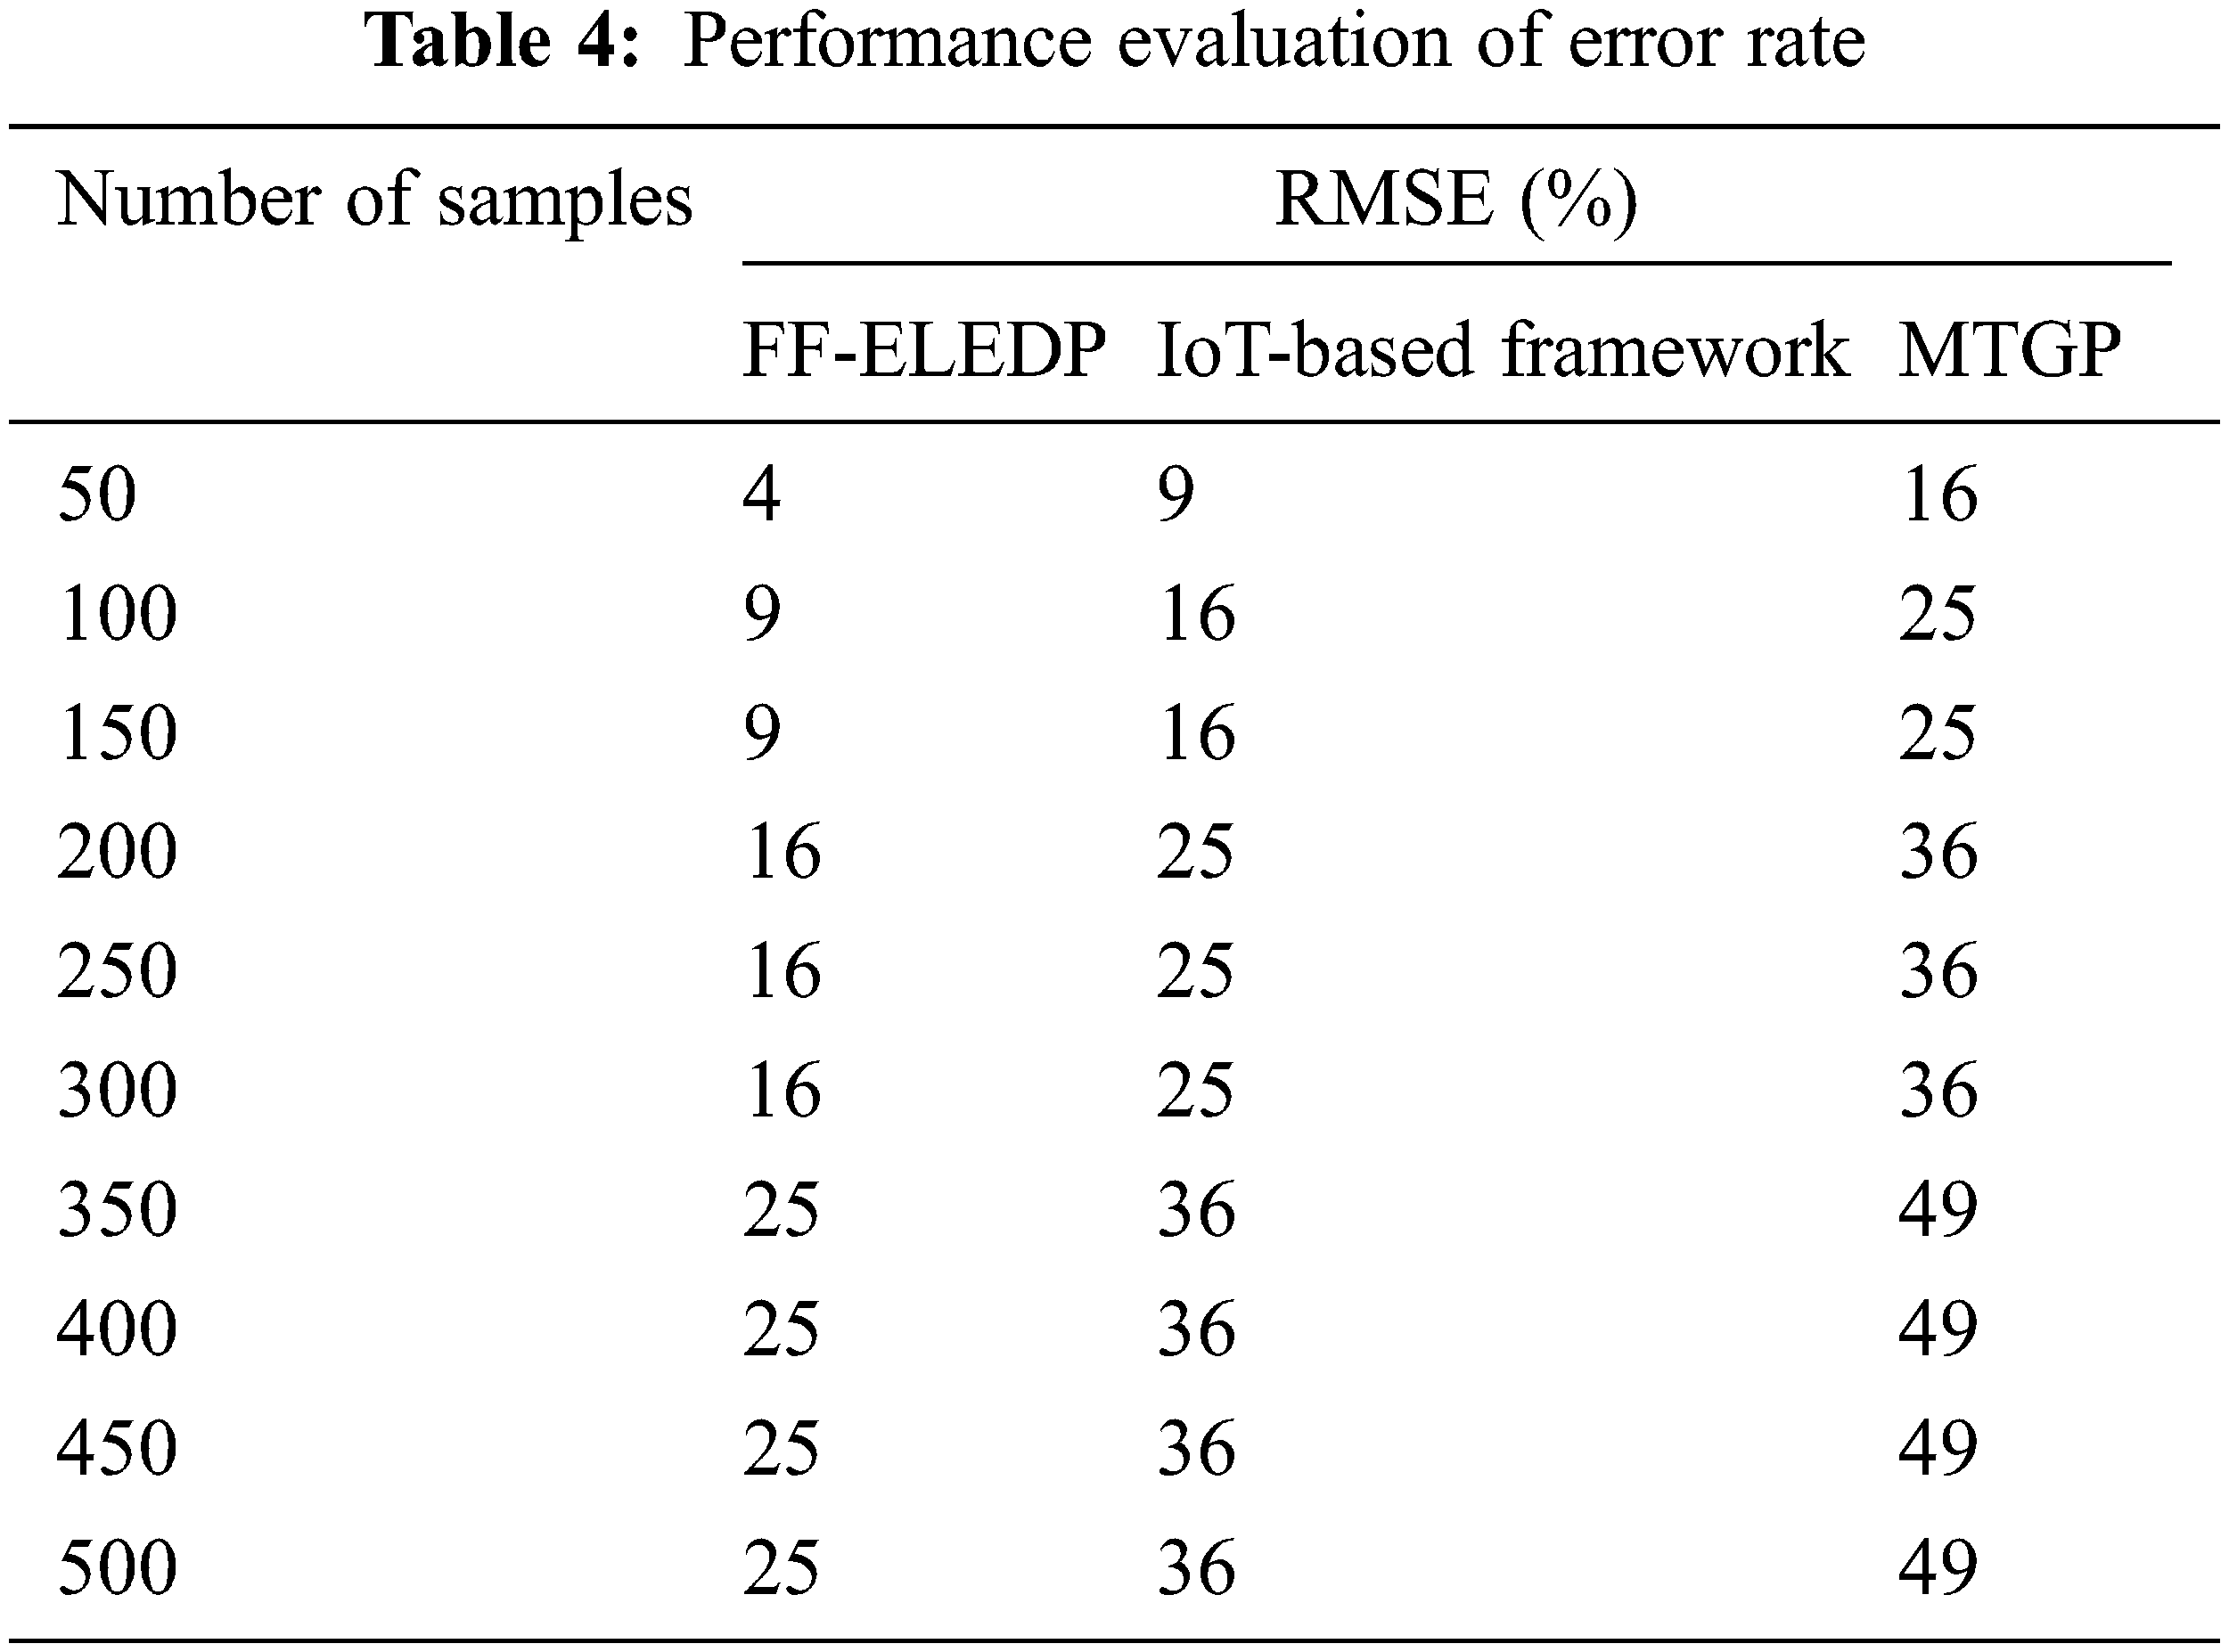
Performance analysis of error rate for proposed and existing methods is described in Tab. 4. The results of error rate using proposed FF-ELEDP is compared with existing IoT-based framework and MTGP. Error rate is computed and results are tabulated for 500 samples. By observing the tabulated results, error rate using FF-ELEDP model is reduced than the other methods.
Fig. 6 explains RMSE measure for three different methods. The error or RMSE remains one of the important features through prediction because not all the results are found to be accurately predicted as certain consequences remain evenly incorrectly predicted toward occurrence of noise in the extracted features.
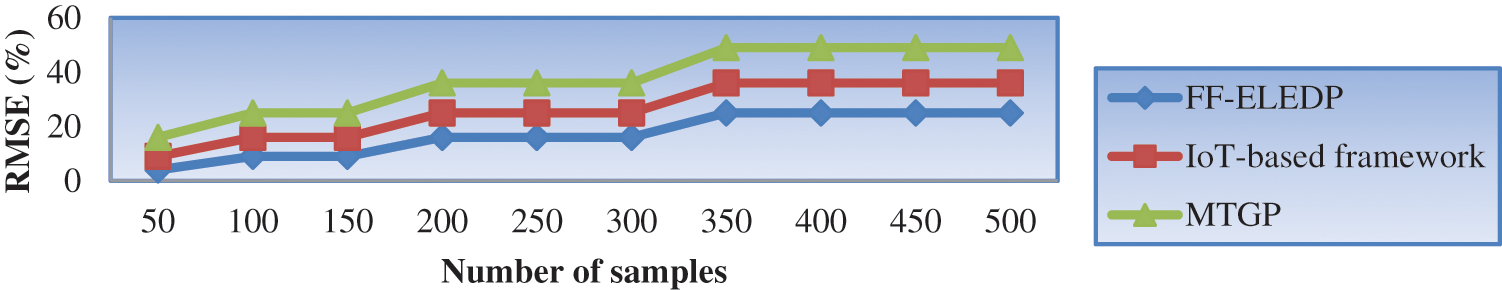
Figure 6: Graphical representation of RMSE
There is a substantial volume of rise found with the rise in samples (in all the three methods) provided as input observed from the COVID-19 India dataset. However, through simulations conducted with 50 samples, the error was detected by 4% 9% and 16% by means of the proposed and present two methods respectively. By this measure, an error was reduced using FF-ELEDP on comparison with the two other existing methods. The aim behind the enhancement stood owing to the application of Exponential Linear Ensemble Deep Learning algorithm. Through applying this algorithm, conscious healthcare pollution monitor stood by updating the weight based on the learning parameter using Exponential Linear function. By this, an error rate remained reduced in FF-ELEDP by 37% related to [1] and 57% compared to [2].
In this research, a Cloud-Based IoT Health Care Pollution Monitor for COVID 19 Pandemic stands proposed to check vital features and predicts variations of individuals through smart personnel care technologies. Affording to the theoretic model and transposable formation of the projected method, two levels has considered. These levels comprise determining the applicable data or else feature for COVID-19 pandemic prediction according to the pollution map and disease prediction via Exponential Linear Ensemble Deep Learning algorithm. The proposed method was estimated by various prediction methods. The functional predictors comprised machine learning and regression methods. The investigational results exposed that the predicting algorithms using ensemble deep learning, called, FF-ELEDP method achieved well. FF-ELEDP method got the highest performance for diseases predicting in our situation by 84% accuracy, 12.5 ms time and error rate of 4%. High accuracy of FF-ELEDP method in contrast with added applied predictors is a substantial difference that makes it applicable in real-time COVID-19 pandemic prediction concerning health science of eco systems also.
Acknowledgement: The author would like to thank Princess Nourah bint Abdulrahman University Researchers Supporting Project number (PNURSP2022R194), Princess Nourah bint Abdulrahman University, Riyadh, Saudi Arabia for providing a research environment and platform to work.
Funding Statement: This research is supported by Princess Nourah bint Abdulrahman University Researchers Supporting Project number (PNURSP2022R194), Princess Nourah bint Abdulrahman University, Riyadh, Saudi Arabia.
Conflicts of Interest: The author declares that she has no conflicts of interest to report regarding the present study.
1. M. Otoom, N. Otoum, M. A. Alzubaidi, Y. Etoom and R. Banihani, “An IoT-based framework for early identification and monitoring of COVID-19 cases,” Biomedical Signal Processing and Control, vol. 62, pp. e102149, 2020. [Google Scholar]
2. S. Ketu and P. K. Mishra, “Enhanced Gaussian process regression-based forecasting model for COVID-19 outbreak and significance of IoT for its detection,” Applied Intelligence, vol. 51, no. 3, pp. 1492–1512, 2020. [Google Scholar]
3. H. B. Hassen, N. Ayari and B. Hamdi, “A home hospitalization system based on the Internet of things, Fog computing and cloud computing,” Informatics in Medicine Unlocked, vol. 20, no. 4, pp. 100368, 2020. [Google Scholar]
4. S. Kumar, P. Tiwari and M. Zymbler, “Internet of Things is a revolutionary approach for future technology enhancement: A review,” Journal of Big Data, vol. 6, no. 111, pp. 26, 2019. [Google Scholar]
5. A. Mukherjee, S. Ghosh, A. Behere, S. K. Ghosh and R. Buyya, “Internet of Health Things (IoHT) for personalized health care using integrated edge-fog-cloud network,” Journal of Ambient Intelligence and Humanized Computing, vol. 12, no. 1, pp. 943–959, 2020. [Google Scholar]
6. M. A. Akka, R. Sokullu and H. E. Çetin, “Healthcare and patient monitoring using IoT,” Internet of Things, vol. 11, no. 7, pp. 100173, 2020. [Google Scholar]
7. R. Subhashini and R. Sethuraman, “IoT-based air pollution monitoring using silver birch trees,” National Academy, Science Letters, Short communication, vol. 43, no. 9, pp. 233–236, 2019. [Google Scholar]
8. E. Moghadas, J. Rezazadeh and R. Farahbakhsh,, “An IoT patient monitoring based on fog computing and data mining: Cardiac arrhythmia usecase,” Internet of Things, pp. e100251, vol. 11, 2020. [Google Scholar]
9. M. M. Islam, A. Rahaman and M. R. Islam, “Development of smart healthcare monitoring system in IoT environment,” SNComputer Science, vol. 1, no. 185,pp. 1–11,2020. [Google Scholar]
10. K. Shafique, B. A. Khawaja, F. Sabir, S. Qaqi and M. Mustaqim, “Internet of Things (IoT) for Next-Generation smart systems: A review of current challenges, future trends and prospects for emerging 5G-IoT scenarios,” IEEE Access, vol. 8, pp. 23022–23040, 2020. [Google Scholar]
11. M. Adhikari and H. Gianey, “Energy efficient offloading strategy in fog-cloud environment for IoT applications,” Internet of Things, vol. 6, no. 1, pp. 100053, 2019. [Google Scholar]
12. A. Chehri, “Energy-Efficient modified DCC-MAC protocol for IoT in E-Health applications,” Internet of Things, vol. 14, no. 1, pp. e100119, 2019. [Google Scholar]
13. A. Ghosh, A. Raha and A. Mukherjee, “Energy-Efficient IoT-Health monitoring system using approximate computing,” Internet of Things, vol. 9, no. 3, pp. 100166, 2020. [Google Scholar]
14. J. C. Tsai, J. S. Leu, S. W. Prakosa, L. C. Hsiao, P. C. Huang et al., “Design and implementation of an internet of healthcare things system for respiratory diseases,” Wireless Personal Communications, Springer, vol. 117, no. 2, pp. 337–353, 2021. [Google Scholar]
15. K. Karamitsios, T. Orphanoudakis and T. Dagiuklas, “Evaluation of IoT-based distributed health management systems,” in Proc. of Pan-Hellenic conf. on Informatics, Greece, pp. 1–6, 2019. [Google Scholar]
16. S. Shukla, M. F. Hassan, M. K. Khan, L. T. Jung and A. Awang, “An analytical model to minimize the latency in healthcare internet-of-things in fog computing environment,” PLOS ONE, vol. 14, no. 11, pp. 1–31, 2019. [Google Scholar]
17. S. P. Dash, “The impact of IoT in healthcare: Global technological change & the roadmap to a networked architecture in India,” Journal of the Indian Institute of Science, vol. 100, no. 4, pp. 773–785, 2020. [Google Scholar]
18. Y. S. Yuani and T. C. Cheah, “A Study of Internet of Things enabled healthcare acceptance in Malaysia,” Journal of Critical Reviews, vol. 7, no. 3, pp. 25–32, 2020. [Google Scholar]
19. S. M. R. Islam, D. Kwak, M. H. Kabir, M. Hossain, K. S. Kwaki et al., “The Internet of Things for health care: A comprehensive survey,” IEEE Access, vol. 3, pp. 678–708, 2015. [Google Scholar]
20. V. P. Jayachitra, S. Nivetha, R. Nivetha and R. Harini, “A cognitive IoT-based framework for effective diagnosis of COVID-19 using multimodal data,” Biomedical Signal Processing and Control, vol. 70, no. 4, pp. 102960, 2021. [Google Scholar]
21. A. I. Paganelli, P. E. Velmovitsky, P. Miranda, A. Branco, P. Alencar et al., “A conceptual IoT-based early-warning architecture for remote monitoring of COVID-19 patients in wards and at home,” Internet of Things, vol. 18, pp. 1–21, 2021. [Google Scholar]
22. V. Bhardwaj, R. Joshi and A. M. Gaur, “IoT-based smart health monitoring system for COVID-19,” SN Computer Science, vol. 3, pp. 1–11, 2021. [Google Scholar]
23. R. Mukherjee, A. Kundu, I. Mukherjee, D. Gupta, P. Tiwari et al., “IoT-cloud based healthcare model for COVID-19 detection: An enhanced k-Nearest Neighbour classifier based approach,” Computing, vol. 111, no. August, pp. 1–21, 2021. [Google Scholar]
24. N. Nasser, Q. Emad-ul-Haq, M. Imran, A. Ali, I. Razzak et al., “A Smart healthcare framework for detection and monitoring of COVID-19 using IoT and cloud computing,” Neural Computing and Applications, vol. 323, no. 1, pp. 1–15, 2021. [Google Scholar]
25. X. R. Zhang, W. F. Zhang, W. Sun, X. M. Sun, S. K. Jha et al., “A robust 3-D medical watermarking based on wavelet transform for data protection,” Computer Systems Science & Engineering, vol. 41, no. 3, pp. 1043–1056, 2022. [Google Scholar]
26. X. R. Zhang, X. Sun, X. M. Sun, W. Sun, S. K. Jha et al., “Robust reversible audio watermarking scheme for telemedicine and privacy protection,” Computers, Materials & Continua, vol. 71, no. 2, pp. 3035–3050, 2022. [Google Scholar]
 | This work is licensed under a Creative Commons Attribution 4.0 International License, which permits unrestricted use, distribution, and reproduction in any medium, provided the original work is properly cited. |