DOI:10.32604/iasc.2023.028605
| Intelligent Automation & Soft Computing DOI:10.32604/iasc.2023.028605 | |
| Article |
Harnessing LSTM Classifier to Suggest Nutrition Diet for Cancer Patients
1Department of Computer Science and Engineering, Al-Ameen Engineering College, Erode, 638115, India
2Department of Information and Technology, Kongu Engineering College, Erode, 638060, India
3Al-Ameen Engineering College, Erode, 638115, India
*Corresponding Author: S. Raguvaran. Email: prof.sraguvaran@gmail.com
Received: 14 February 2022; Accepted: 19 April 2022
Abstract: A customized nutrition-rich diet plan is of utmost importance for cancer patients to intake healthy and nutritious foods that help them to be strong enough to maintain their body weight and body tissues. Consuming nutrition-rich diet foods will prevent them from the side effects caused before and after treatment thereby minimizing it. This work is proposed here to provide them with an effective diet assessment plan using deep learning-based automated medical diet system. Hence, an Enhanced Long-Short Term Memory (E-LSTM) has been proposed in this paper, especially for cancer patients. This proposed method will be very useful for cancer patients as this would help them predict the foods which can be consumed by them based on the nutrition analysis of food images. The classification will be performed in E-LSTM by analyzing the two datasets, one with food images and another with cancer patients’ details. Following an in-depth analysis of the major research papers concerning deep learning strategies to identify the foods along with their nutrition composition, this method has been identified as one of the finest deep learning approaches that are used for classification especially. This work has been identified as the first work producing a new layer for feature extraction and providing nutrition suggestions, especially for cancer patients using the LSTM technique. The accuracy of prediction and classification will be improved by the dedicated layer for feature extraction in E-LSTM. Hence, it is proved that this proposed method outperforms all other existing techniques in terms of F1 Score, Precision, Recall, Classification accuracy, Training loss and Validation loss.
Keywords: Classification; diet assessment; enhanced long short term memory; nutrition suggestion
Cancer is one of the most challenging diseases in today’s world. A research involved about 1,00,000 people states that for every 10% of increase in consuming ultra-processing foods, that eventually led to 12% of increase in risks that cause cancer [1]. Cancer is nothing but the uncontrolled overgrowth of abnormal cells that spreads faster to form a dangerous tumor affecting the cancer patient’s neighborhood body parts. Efforts have been taken to find a successful therapy that can cure and treat cancer. Numerous therapy types like chemotherapy, hormone therapy and surgery are effectively used at present to abolish the dangerous cancer tumors [2]. But, the treatments provided for treating cancer may damage the immune system of the suffering patient as it may damage and affect the blood cells defending the body from disease and pathogens. Fighting against cancer will not only be a challenging and risky one for a cancer patient but also for everyone who is healthy! Hence, it is always recommended for cancer patients to intake nutrient-rich foods to maintain healthy body weight, healthy body tissues, and also to gain more strength to protect them against the side effects caused before and after the treatment. The risks causing cancer will be reduced by 10% to 20% when they follow a nutritious diet [3].
By making changes in the daily diet plan, the cancer patients will be able to gain more strength, especially during their treatment thereby enduring the effects of cancer and its treatment. The best nutrition system can be suggested depending upon the type of cancer, its treatment, and its side effects [4]. Positive food nutrition exerts positive effects on certain diseases which that help to cure those diseases. Also, food nutrition may have a negative influence on some diseases which will worsen the severity of certain disease disorders [5]. Hence, it is vital to consider both the positive and negative nutrition while analyzing food nutrition but, most of the existing works haven’t considered these types. Only a few of them have assumed some nutrients as positive or negative. The deep learning is proved to be an advanced technology in big data analysis that deals with a huge amount of successful cases in speech recognition, image processing, object detection, etc. Recently, deep learning techniques have been introduced in food science and engineering [6] and it was used by multiple research papers for classifying food and its nutrients composition [7–10].
An automatic nutrition analysis and food recognition system was presented with just one single mobile photo [9]. By recognizing the food items and nutrition analysis from a meal, a dietary assessment report has been provided. This automatic system will be used for guaranteeing their health and through this, the patient can measure their daily intake by enabling them. A special deep learning Recurrent Neural Network (RNN) is LSTM and its network is found to be well-suitable for learning right from experiencing to processing, predicting, and classifying time series of data with unknown sizes existing among significant events. There are three or four “gates” presented in LSTM [11] blocks that are used for controlling the information flow into or out of their memory. For implementing these gates to compute a value between 0 and 1, a logistic function has been used. Multiplication is performed on this value to partially deny or allow information to flow into or out of memory.
The range of new value that flows into the memory will be controlled by the “Input Gate” whereas the range of leftover value in memory will be controlled by the “Forget Gate” and the range to which the value in memory will be used in the computation of activating the block’s output [11] will be controlled by the Output Gate”. The core components of an LSTM network are the sequence input layer and an LSTM layer. The input given to the network is an input sequence or time-series data and will be given through the sequence input layer. The long-term dependencies among periods of sequence data is learned by an LSTM layer. Fig. 1 illustrates the network architecture of simple LSTM for classification.
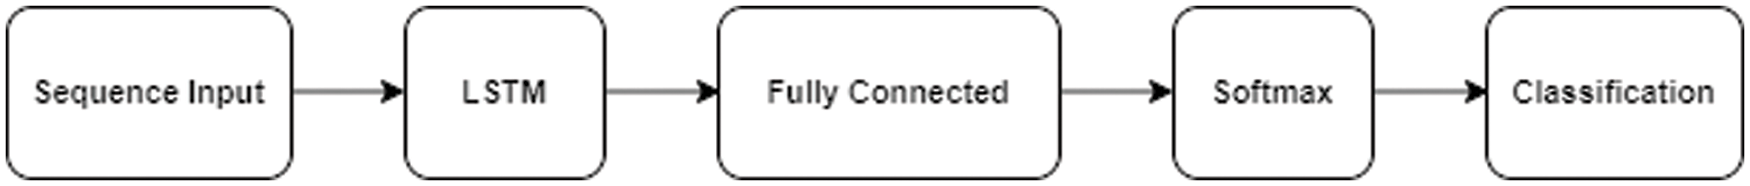
Figure 1: Network architecture of simple LSTM classification
A sequence input layer and an LSTM layer are the two initial layers of the network. A fully connected layer, softmax layer, and classification output layer are the last three layers used for predicting class labels in a network. The longest time lags in certain problems are bridged by using the LSTMs thereby handling the noise, continuous value, and distributed representations. It is not necessary to keep a finite number of states from beforehand with LSTMs as the LSTMs were providing us with a larger range of parameters like the input bias, output bias, and the learning rates. Hence, fine adjustments are not required. Similar to that of Back Propagation through Time (BPTT), the complexity of updating each weight will be reduced to O(1) with LSTMs, which is an added advantage.
A significant benefit over RNN is that the long-term dependencies will be handled by the capacity of LSTM. LSTM layer is the heart of the entire process and when it comes to image classification, a separate layer will not be required for extracting the feature in LSTM. Hence, an E-LSTM containing a new layer for feature extraction has been proposed in this work. Based on the nutrition analysis from food images using the proposed E-LSTM, it suggests the foods to be given to cancer patients.
The contributions of the proposed work are
• To propose an E-LSTM for cancer patients that performs nutrition analysis of food image
• To create a dedicated feature extraction layer in LSTM named E-LSTM
• To analyse both the positive food nutrients and negative food nutrients according to the health condition of the patient
• Finally, to classify the food to be given to cancer patients using the proposed technique.
This work is organized as follows: The related works in the fields of deep learning-based food and nutrition analysis were reviewed in Section 2. Section 3 defines the proposed E-LSTM based nutrition analysis on food images for cancer patients. Section 4 contains the result and discussions which shows the efficiency of the proposed work. The conclusion of the research work is discussed in Section 5.
Based on a deep model to analyze food items from the daily meal images, Jiang et al. [7] developed a food recognition and dietary assessment system. A deep learning technique for the classification of food nutrients composition was proposed by Salam et al. [8] but, this work has not provided any food recommendations for users.
For assessing the food attributes having nutritional and ingredients value through the classification of input food images, Yunus et al. [9] proposed an automated system. It extracting the semantically related words from a large amount of text which is gathered through the internet helps to estimate attributes and ingredients in image analysis. This work achieved 85% accuracy but, they considered only the mobile applications, in the healthcare sector may lead to an inaccurate results.
A disease discrimination model has been introduced by Mao et al. [11] by employing a deep neural network (DNN) method according to the movement of an eye but, they only focused on eye-oriented diseases. For automatically detecting the suitable food for patients, Iwendi et al. [12] proposed a deep learning solution based on their disease and other features but, the over-fitting problem in RNN techniques has not been overcome.
A Hidden-layer LSTM (H-LSTM) containing a hidden layer in the original one-level nonlinear control gates of LSTM was introduced by Dai et al. [13] and the error rate is reduced from 12.9% to 8.7% by this model. They provided multiple DNN gates in the LSTM structure which increased the complexity.
Padmapriya et al. [14] introduced and integrated the Automatic Variable Threshold LSTM (AVTL) and Modified Softmax Layer (MSL) called “Enhanced LSTM for Autism Spectrum Disorder (ASD) Classification (ELAC)” for expanding the performance of classification of conventional LSTM in ASD classification process. It increases the complexity during execution.
A general framework for recommending a daily meal plan has been introduced by Yera et al. [15] by integrating a key feature for the immediate management of preference-aware and nutritional-aware information. But, they haven’t focused on disease based analysis.
Sundaravadivel et al. [16] presented a new and fully automated nutrition monitoring system based on the Internet of Things (IoT) named as Smart-Log but, they do not perform any disease-based analysis. Sun et al. [17] proposed a novel end-to-end Three-Branch Embedding NETwork (TBE-Net) with feature of complementary learning and part-aware ability. Sun et al. [18] proposed a new Real-time Small Object Detection (RSOD) algorithm based on YOLOv3 (You Only Look Once, Version 3), which improves the accuracy of detecting the small objects but, they haven’t concentrated on the disease oriented analysis.
In this section, the network architecture of the proposed Enhanced Long-Short Term Memory (E-LSTM) which is shown in Fig. 2 is described. The proposed E-LSTM network consists of six layers such as Input Layer, Feature Extraction with Mapping Layer, LSTM layer, Softmax Layer, Classification Layer, and Output Layer.
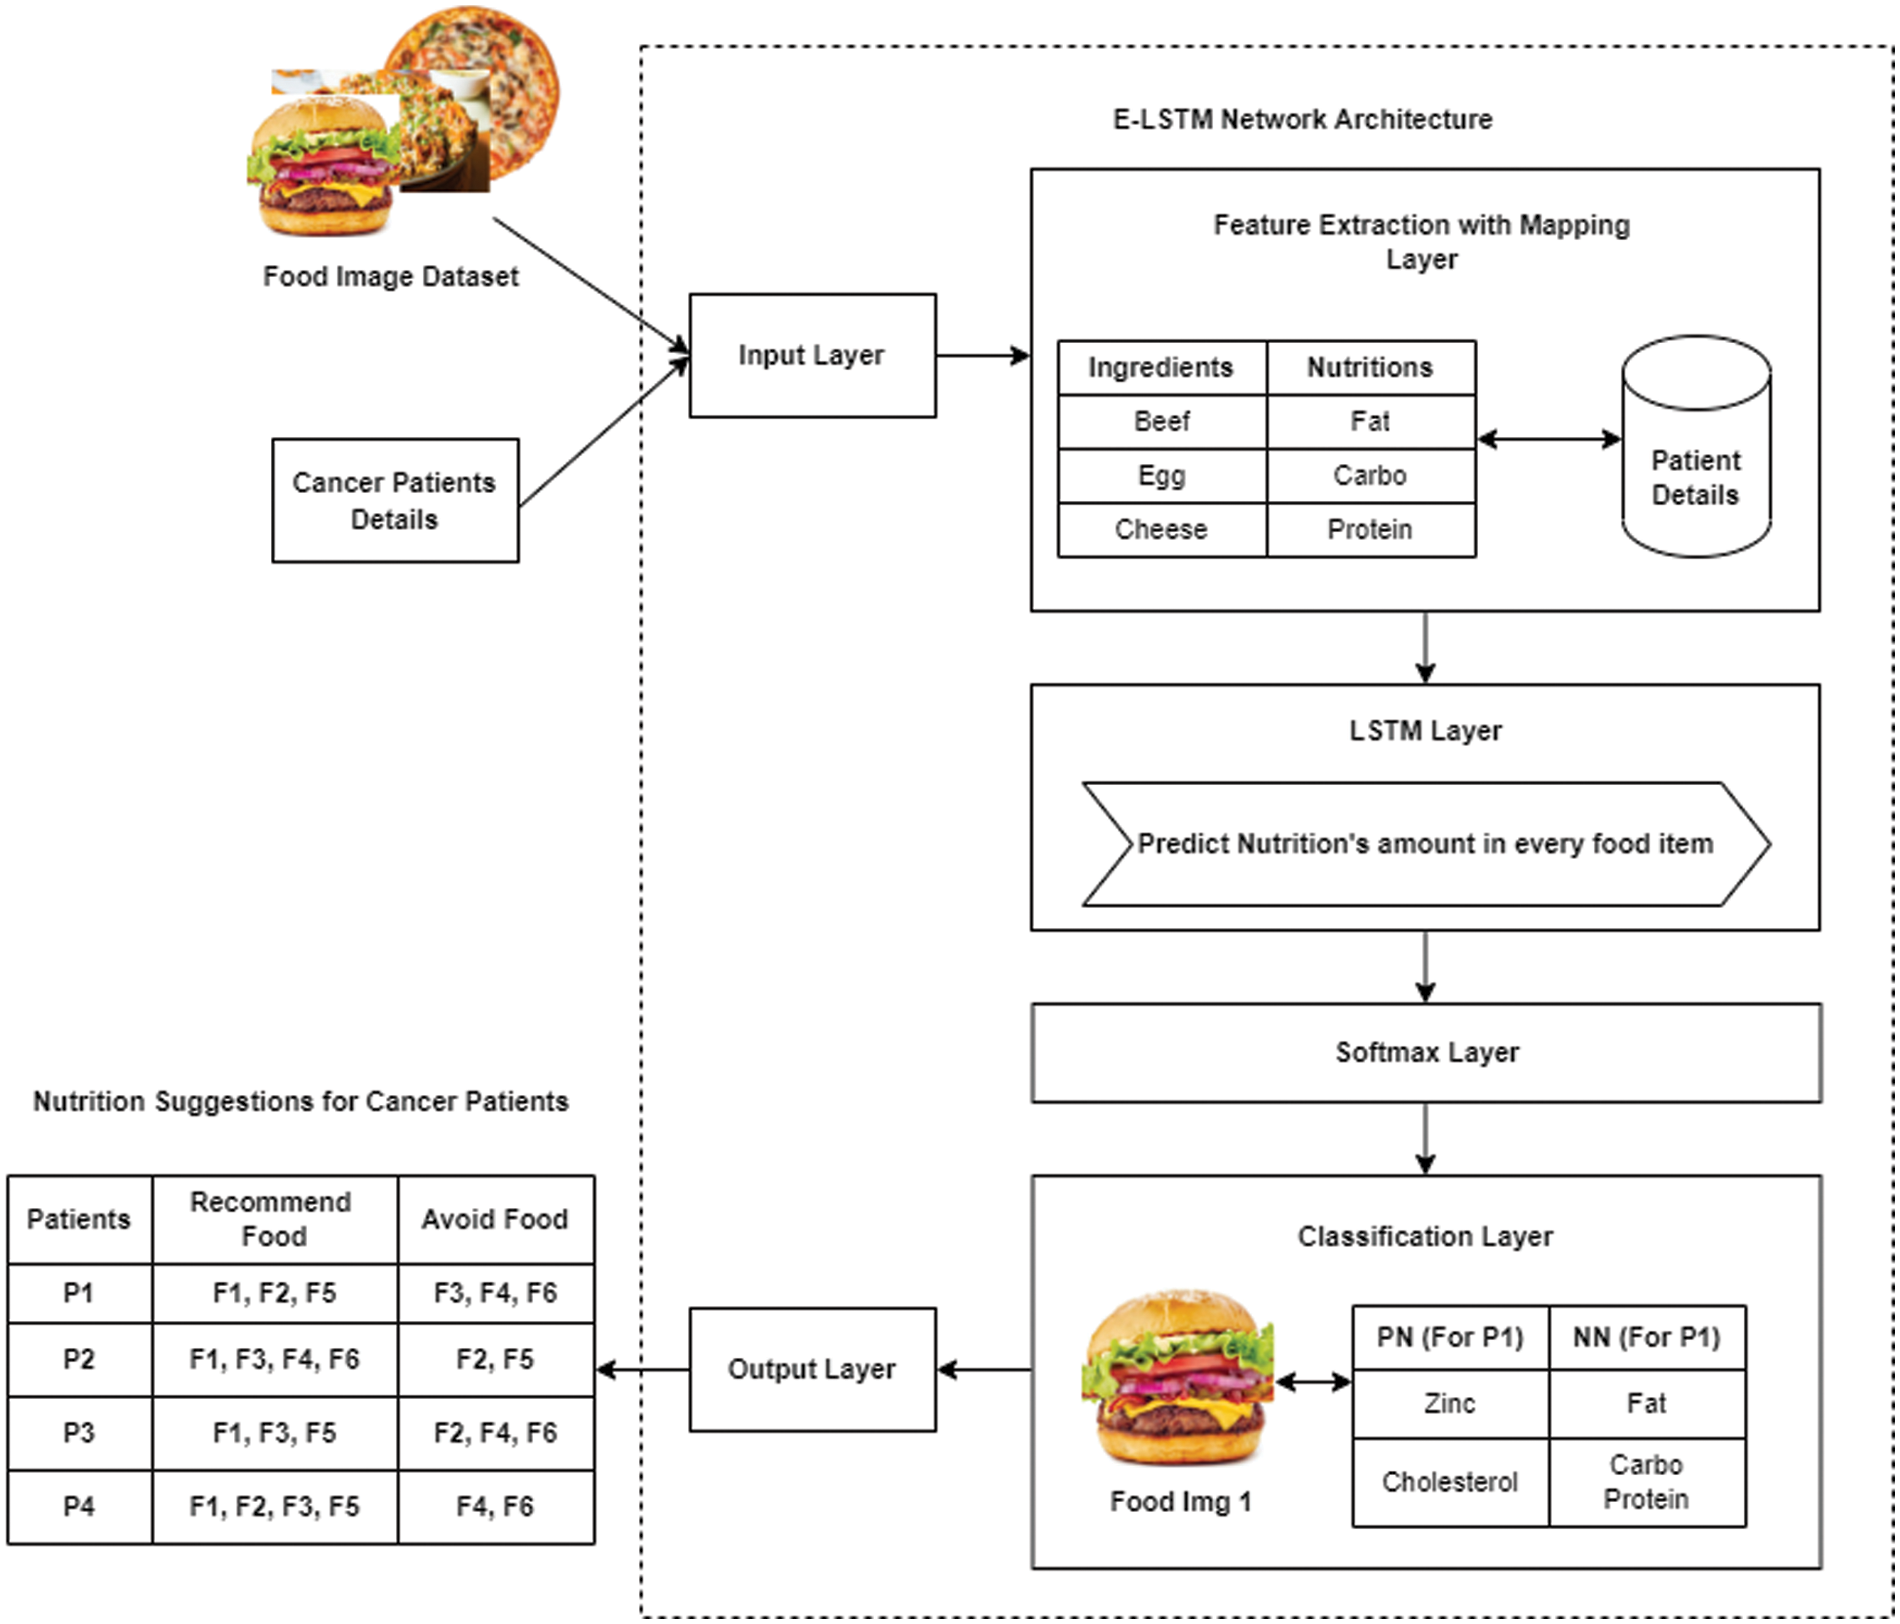
Figure 2: Network architecture of proposed E-LSTM
The first layer of the proposed E-LSTM is an input layer where inputs are fed to the network. Two types of inputs were used and they are food images and cancer patient details. Both the food image dataset and a dataset with details of cancer patients’ are given to this input layer.
Dataset: Here Food-101 [19] food image dataset is used for food classification which is publicly accessible. The Food-101 contains 101 classes of food items and each class has 1000s of images. It is specially designed for multi-class classification. Each image in the dataset has a resolution of 384 × 384 × 3 (RGB, unit8) and each image is rescaled to have a side length of 512 pixels for each class, 250 test images, and 750 training images are provided. Patient datasets are varied upon the patient body condition, and the stage of cancer like a severe stage, medium stage and starting stage. For each stage of the cancer, the food dataset will be used for classifying and generating a diet assessment plan for the cancer patients.
3.2 Feature Extraction with Mapping Layer
The second layer of proposed E-LSTM is the feature extraction with the mapping layer which takes the input data from the input layer and extracts features from those data for performing the mapping process on extracted features.
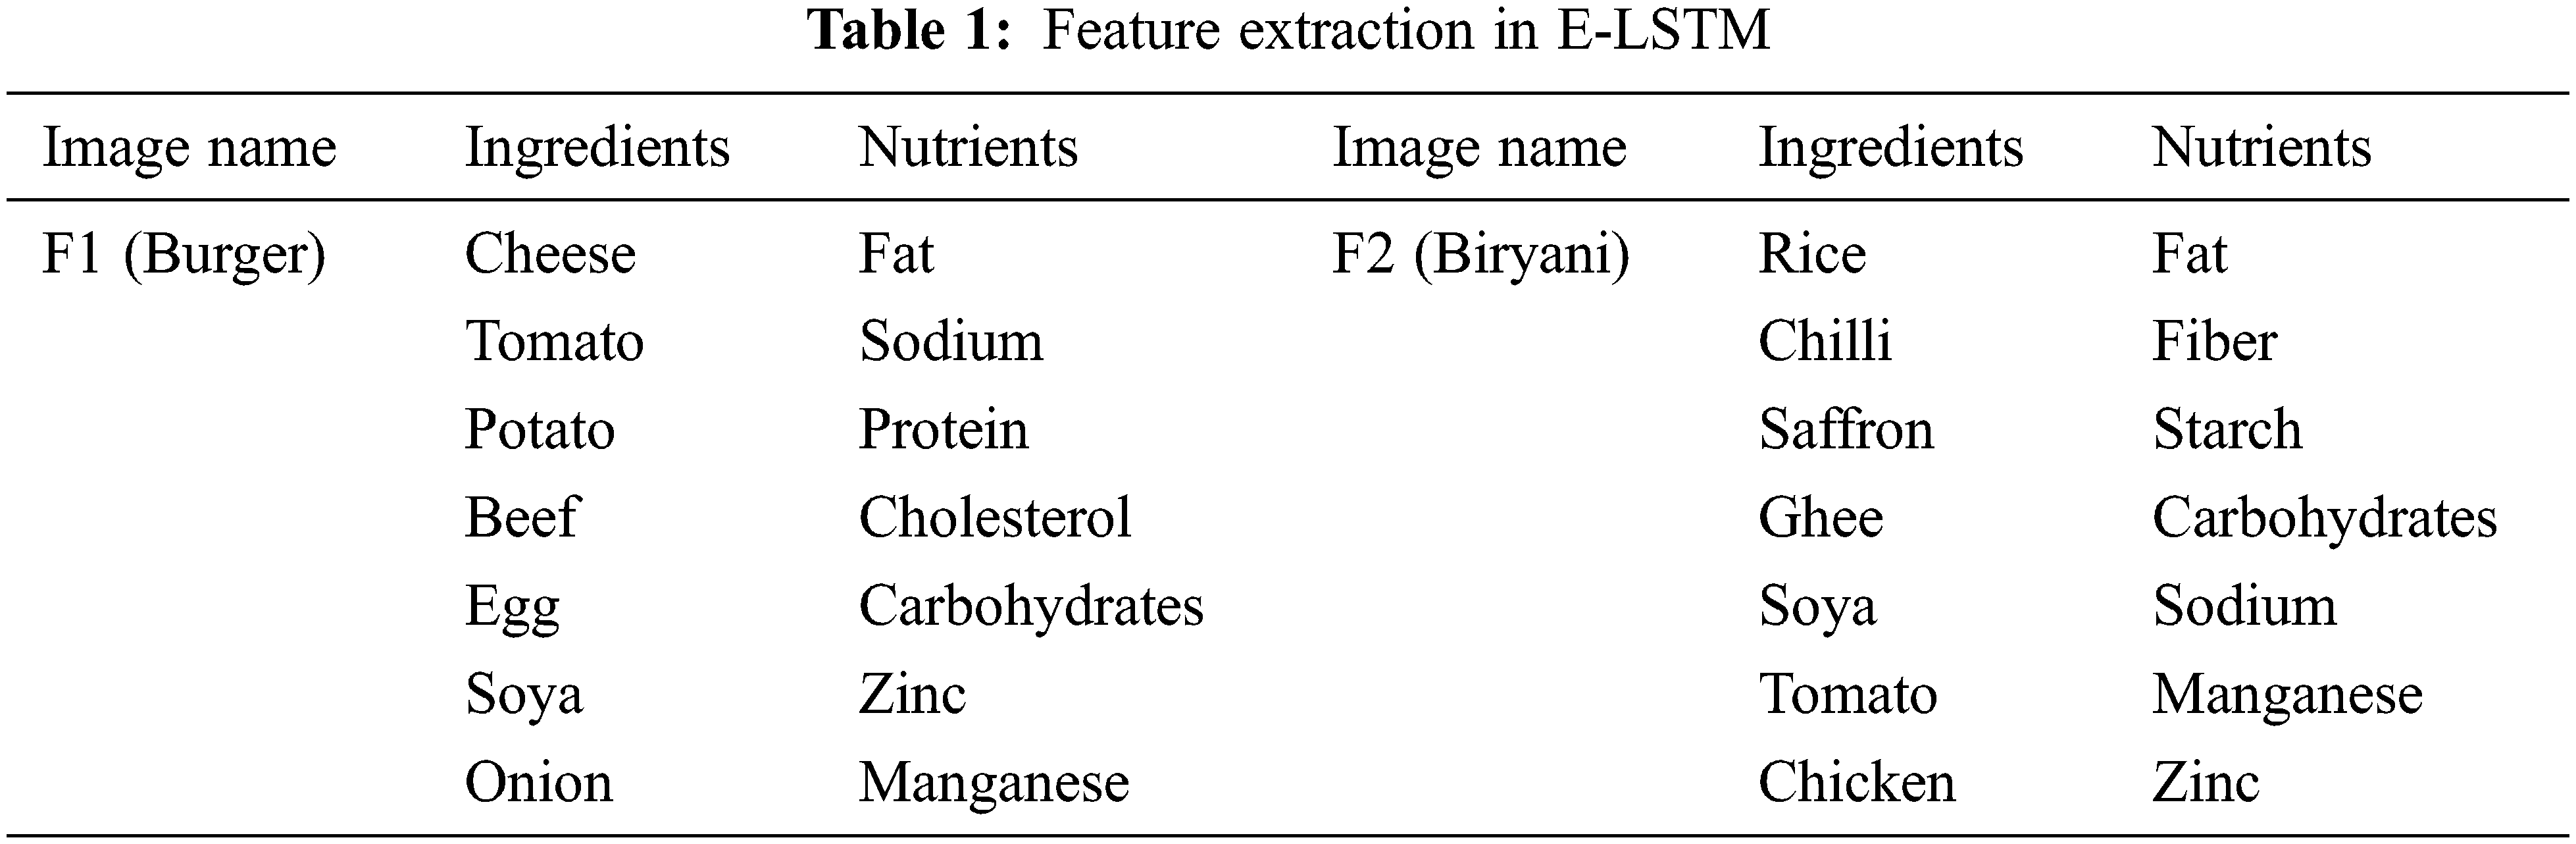
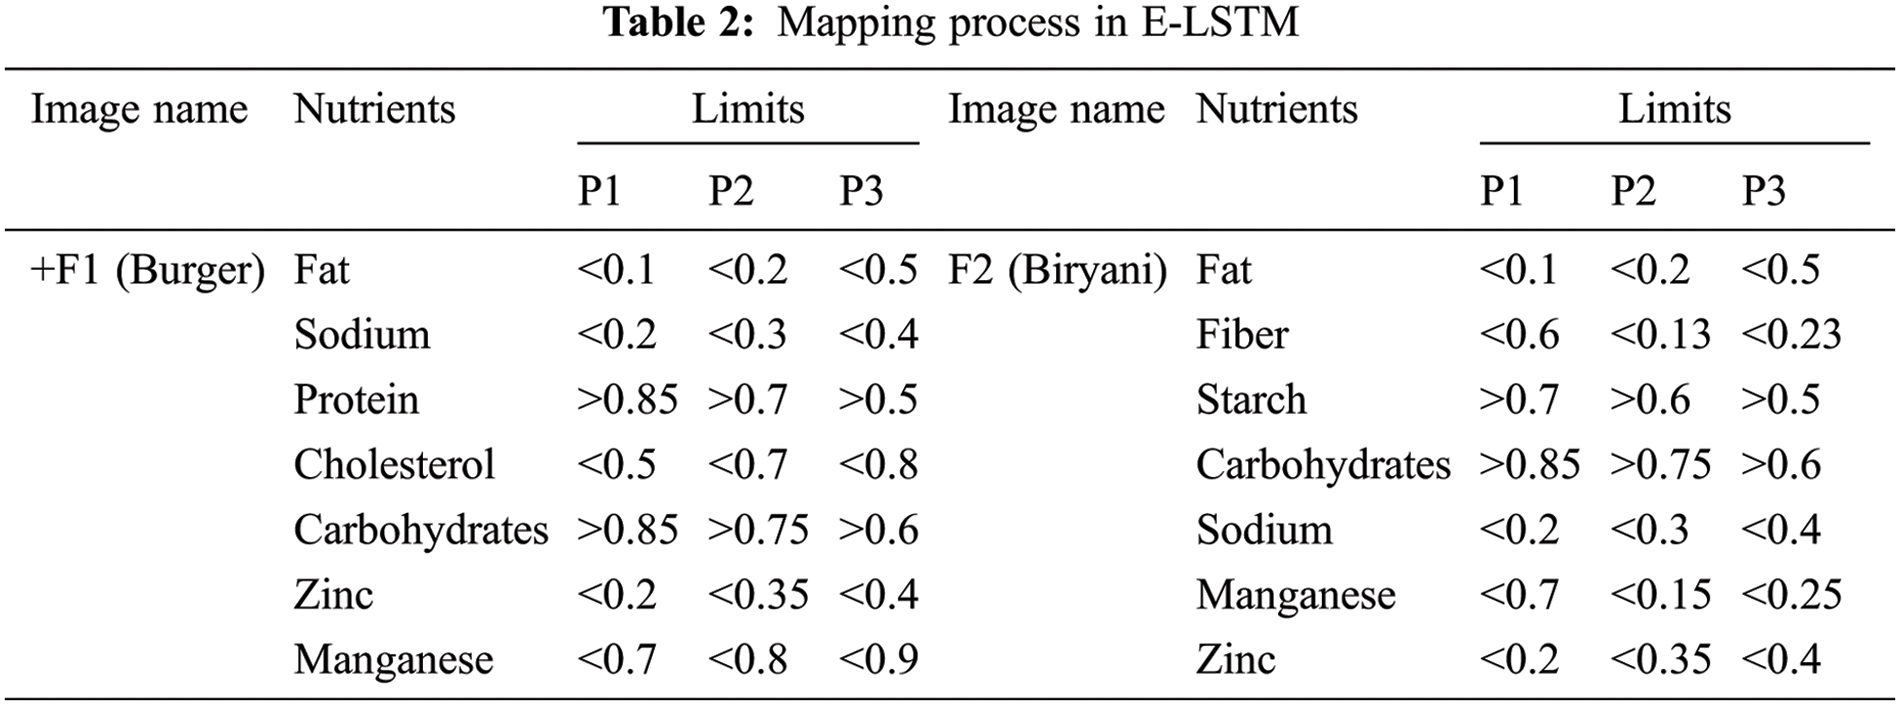
Both the food image and the patient details are used as inputs in this feature extraction which has been considered as the best method for mapping the original high dimensional features into low dimensional subspace [20]. In another method likes CNN; the convolutional layer performs the feature extraction process which extracts the mid-level features containing the deep information about the object features [21–24]. In E-LSTM, initially, the features like presented ingredients and nutrients from each input food image individually will be extracted and then, it will be mapping those extracted nutrients with each patient for every image, i.e., The limit for every presented nutrient of food for every patient based on their health condition will be mapped. For example, F1 & F2 are considered as input Food images (Burger & Biryani), and P1, P2, and P3 are the Patient1, Patient 2 & Patient 3 respectively (Note: P1 – severe stage cancer, P2 – Medium stage cancer, P3 – starting stage cancer). In this layer, first, the features (type of Ingredients &Nutrients) are extracted from F1 & F2 images to analyze the type of food. This feature extraction concept is stated in Tab. 1.
After extracting the features, the mapping process will be performed in this layer where the limits are mapped for every food nutrient depending upon the health details of the patients. Carbohydrates, proteins, fats, vitamins, minerals, and water are the basic nutrients [25]. In comparison with a good healthy diet, a healthy diet plan containing low fiber, low carbohydrates, more proteins, and high calories is provided by E-LSTM that is rich in natural sources of minerals such as vitamins, fiber, and carbohydrates needed for the patient’s body [26]. Nutrients vary based on the food type and those are already analyzed in this network during the training process [27].
Some of them are discussed below,
Protein – Protein is an essential nutrition for cancer patients and this should be high in their foods to heal tissues and fight infections, extra protein is generally needed after radiation therapy, surgery, or chemotherapy.
Fats – Fat plays a significant role in nutrients. For a body, a rich source of energy will be served through fats and oils and it would be better if it is less than 10%.
Carbohydrate –Major energy source of the body is Carbohydrates and they should be high because it gives the required fuel to the body for proper functioning of the organs and physical activity.
Vitamins and minerals– Vitamins and minerals are also essential nutrients. Large amounts of minerals, vitamins and other dietary supplements must be taken by the cancer patients who are trying to destroy cancer cells or boost their immune system but, some of the substances will be harmful when taken in extra doses.
This is the third layer of the proposed E-LSTM which helps to predict the amount of nutrients present in the food. For example, it was predicted that F1 (Food image 1) contains, 30% of Fat, 80% of Protein, 20% of Sodium, etc. In this work, a single LSTM layer is used which contains multiple LSTM blocks. A single LSTM block contains three types of gates called Input gate, Output gate, and Forget gate which are shown in Fig. 3. An equation for input gate, Output, gate and Forget gate are stated in Eqs. (1)–(3) respectively.
The count of new information added to the cell state is determined in the input gate, the information to be discarded from the cell is determined in the forget gate, and the information needed as output is determined in the output gate [28–30]. Those three gate structures were used in LSTM for information control and protection. LSTM cell structure mainly uses two functions called the sigmoid function and the tanh function [31–33]. Finally, it filters the cell state which will be passed through the activation function that predicts what portion should appear as the output of the current LSTM unit at timestamp (t). Here, the cell state is the memory of the LSTM, the current moment is the current time or present time (
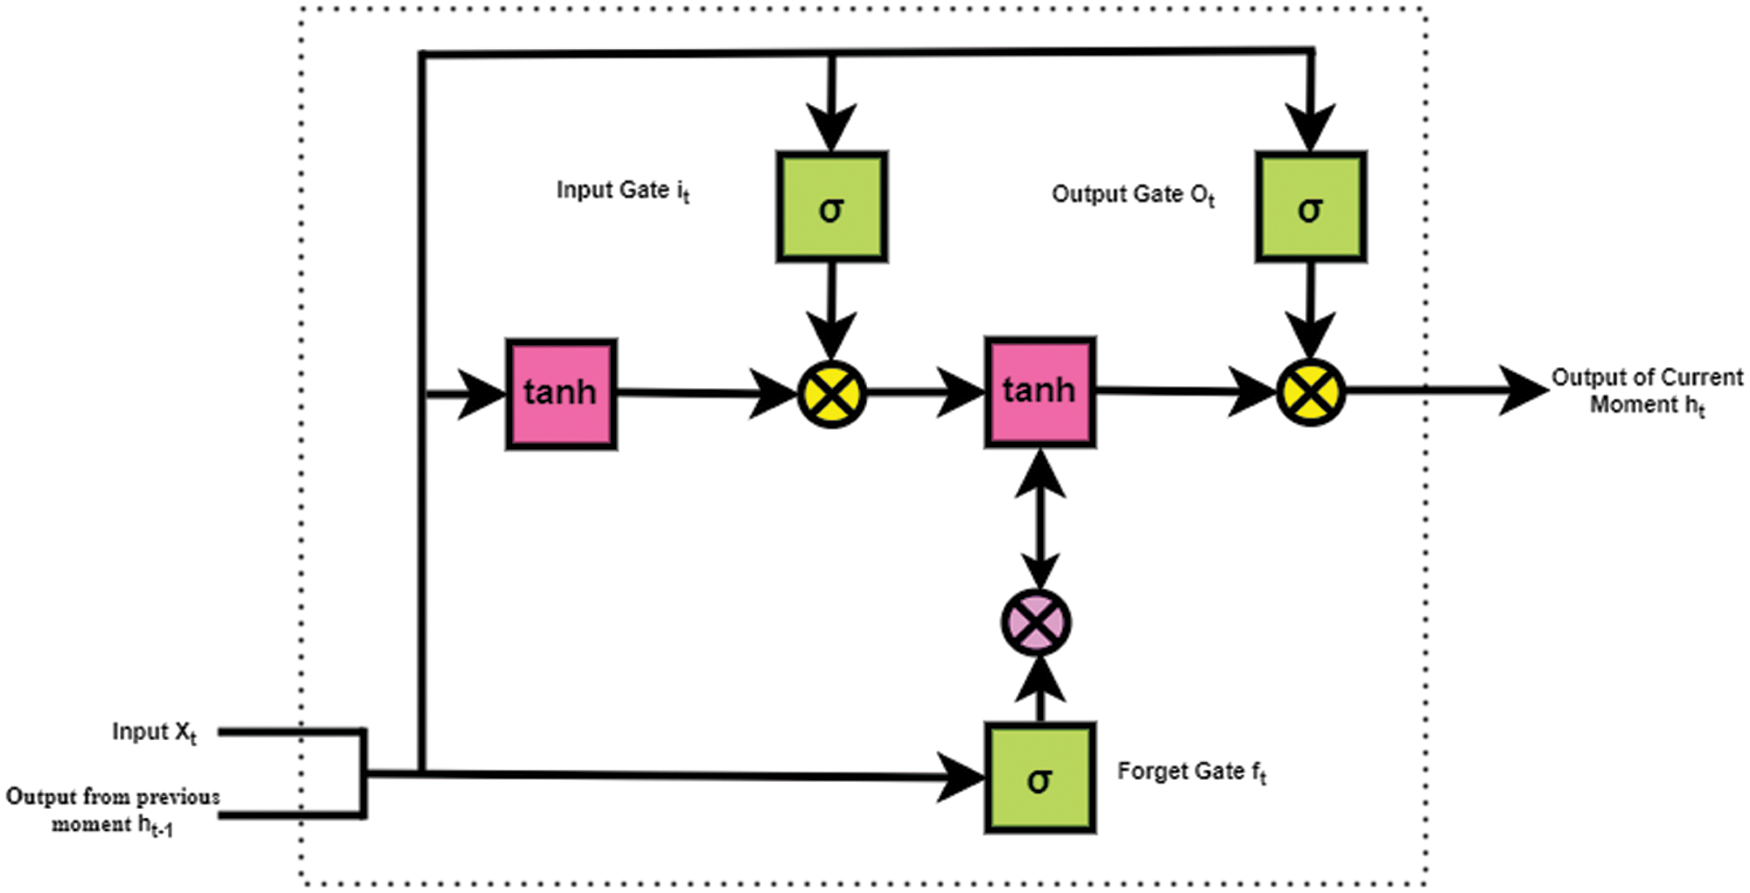
Figure 3: Structure of single LSTM block
The equations for the gates in LSTM are:
Here,
The equations for the cell state, candidate cell state and the final output:
Here,
The softmax function is included in this layer. The softmax function takes a vector z of K real numbers as input and normalizes it into a probability distribution consisting of K probabilities proportional to the exponentials of the input numbers. The softmax transforms the output values into the values between 0 and 1, even the input values are negative, positive, zero, or greater than one, so that they can be taken as probabilities. The softmax turns it into a small probability if one of the inputs is negative or small, and then turns it into a large probability if an input is large, but it will always persist between 0 and 1.
Softmax function or multi-class logistic regression are the other names for softmax function because the softmax is a generalization of logistic regression which is used for the classification of multi-class, and its formula is similar to that of the sigmoid function used for logistic regression. The softmax function is a core element used in deep learning classification tasks. If the score (input) is high, Softmax output will be high. If the score is low, Softmax output will be low. The distribution is not consistent. Softmax is typically added to the last layer of an image classification network, such as those used in ImageNet competitions by CNN.
Eq. (7) shows the formula for the softmax function.
where all the zi values are the nutrient values predicted in the previous LSTM layer. The denominator of the formula contains the normalization term which guarantees that all the output values of the function will sum to 1, thus establishing a valid probability distribution. Here, the predicted nutrient values will be converted between 0 and 1 by the softmax function.
For all the patients, the recommended foods, foods to be avoided, the positive nutrients, and the negative nutrients will be classified in the classification layer. At first, the positive and negative nutrients will be defined by comparing the predicted nutrients values with the mapped values. If the comparison satisfies the limits, the nutrients will be considered as positive, and if not, the nutrients will be considered as negative nutrients.
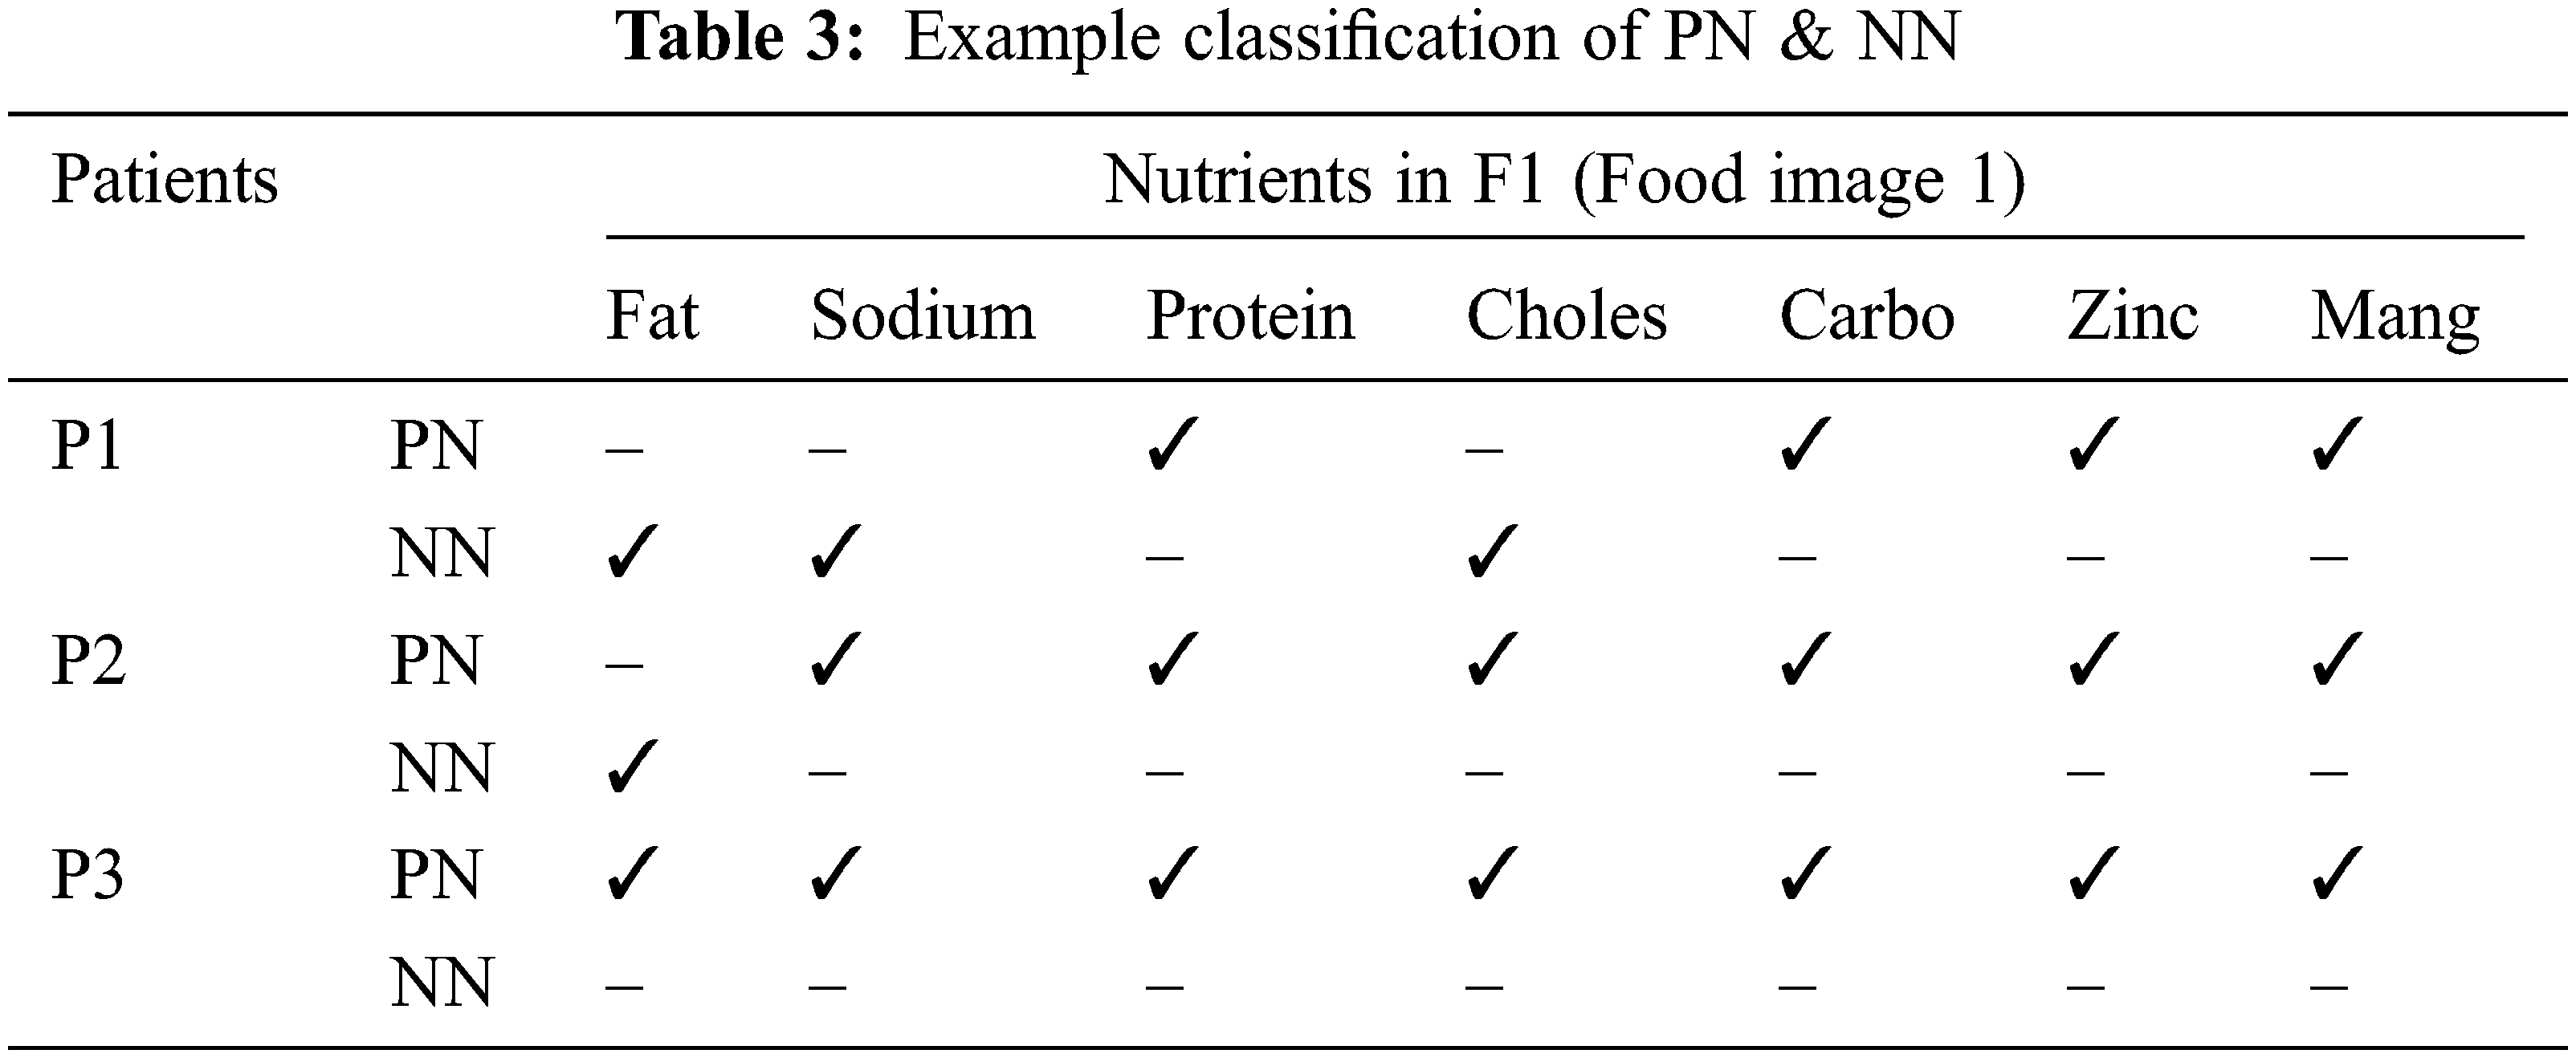
For example, Let’s assume that F1 contains, Fat – 1, Sodium – 0.55, Protein – 0.44, Cholesterol – 0.24, Carbohydrates – 0.7, Zinc – 0.3 and Manganese – 0.15 [9]. The limits for these nutrients were stated in Tab. 2. For P1, Fat should be <0.1 but F1 contains 1 which means the limit was crossed, so this nutrition (Fat) for P1 is considered as Negative Nutrition (NN). Manganese should be <0.7, F1 also contains 0.15, so that nutrition is considered as Positive Nutrition (PN). If the values are exactly equal to the limit values, that nutrients will be considered as Negative Nutrients. Like this, the value of every nutrient is compared with their limits for every food image. An example of this concept is stated in Tab. 3 for Food image 1 (F1). In this way, the positive and negative nutrients are classified for every patient with each food image. Here, food F1 is considered as burger. If a double cheeseburger is found, it can be identified in image processing by detecting two slices of cheese combined with the salads.
The output layer is the last layer of the proposed E-LSTM in which the nutrition suggestion for the cancer patients will be given based on the result of the classification layer. The foods will be recommended for them under the nutrient suggestions. Here, the food containing high amount of positive nutrients will be added to the recommended food list whereas the food containing a high amount of negative nutrients will be added to the avoided food list for that patient. The example result of Nutrition suggestions for cancer patients was shown in Tab. 4.
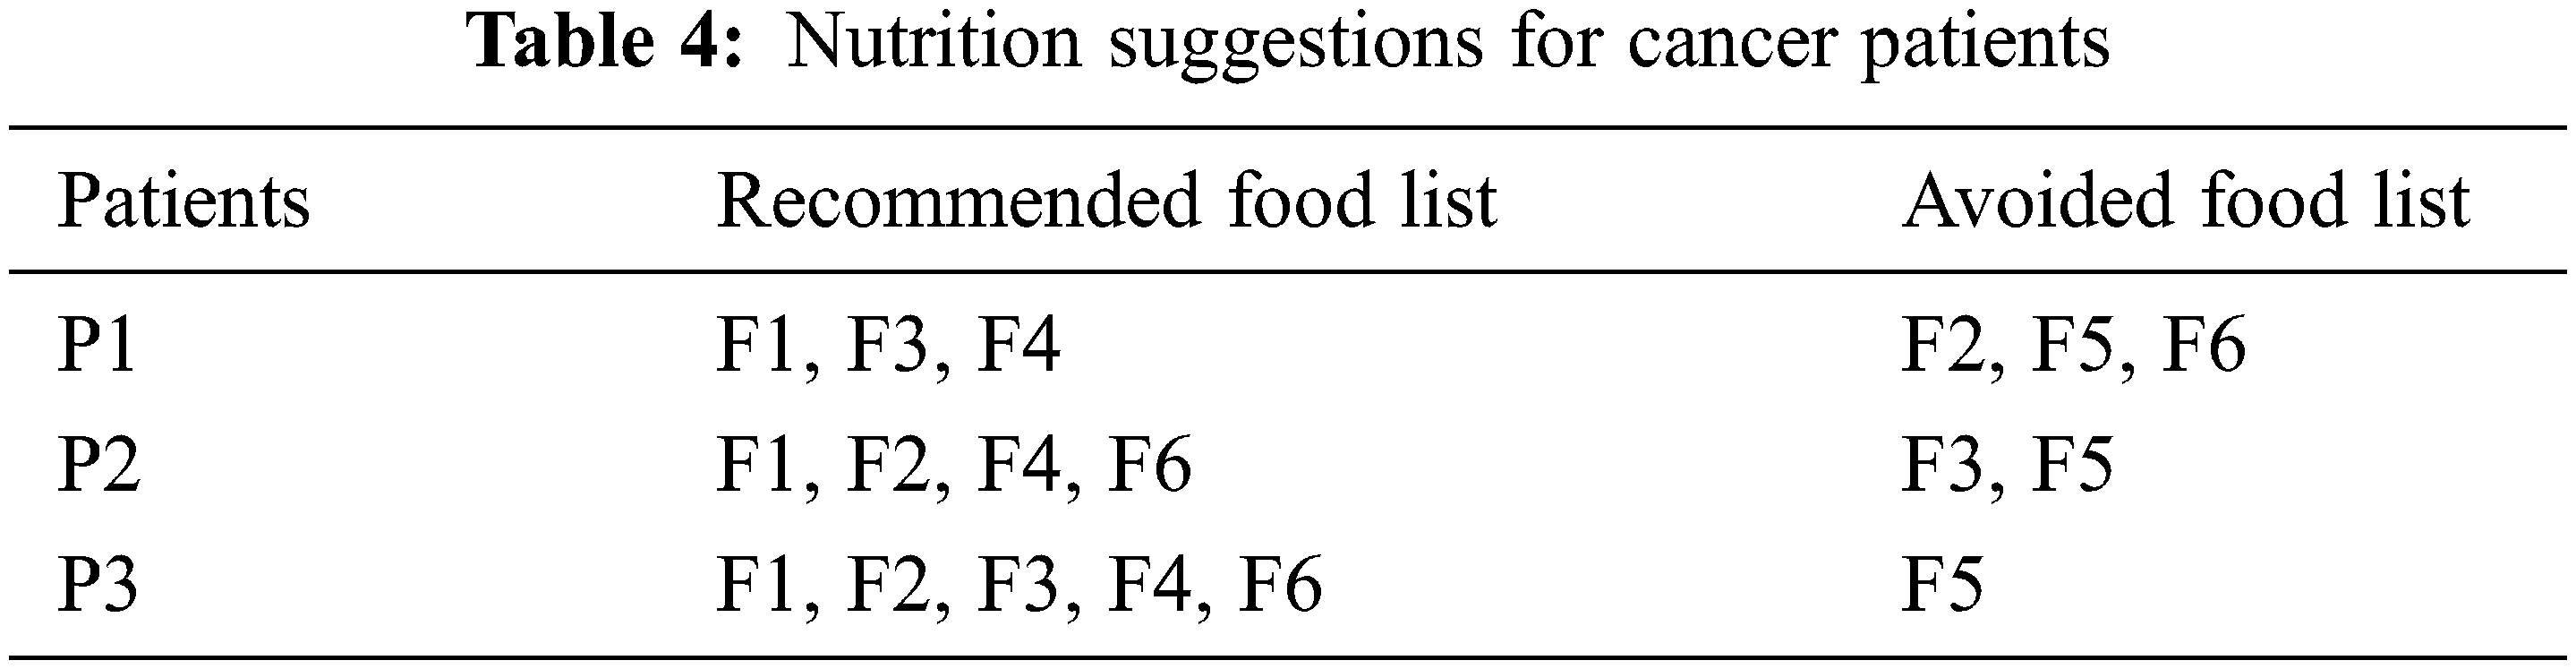
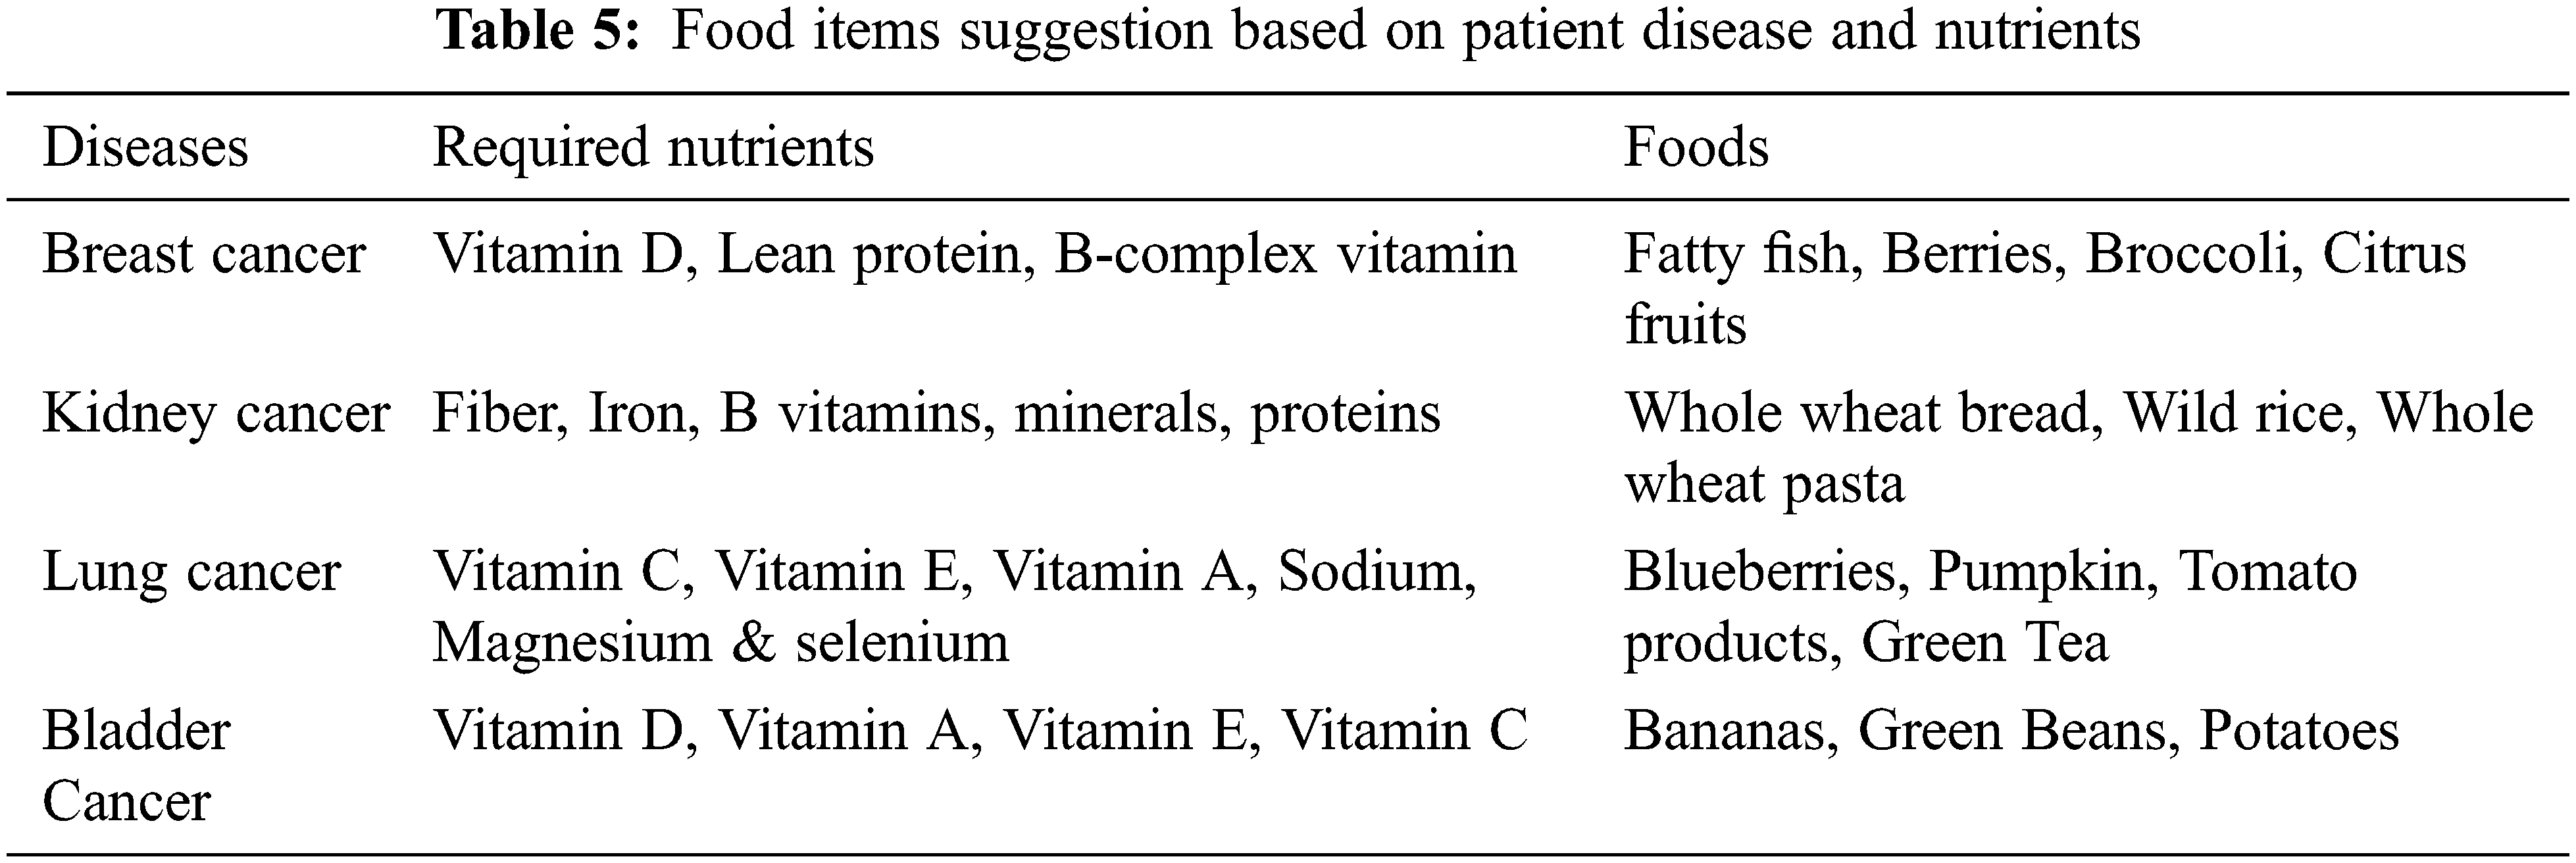
After classifying the positive and negative nutrients, it will be recommended for the cancer patients. The foods will be suggested to them based on the positive nutrients, and the food suggestion will be avoided based on the negative nutrients. Here, the patient P3 can take all the nutrients because he is in the starting stage of cancer, and hence, he can intake all the nutrients such as fat, protein, carbohydrates, Zinc, Manganese, Fiber, etc., based on the nutrients limit. For patient P2, he must avoid consuming some nutrients like fat based on the patient’s details. For patient P1, he can take only some necessary nutrients as he is in the severe stage of cancer. P1 must take a high amount of proteins which have the power to heal the tissues and help to fight against infection. All cancer patients must intake atleast 46 to 56 grams of proteins per day. Here E-LSTM also refers to food which has high protein that has been added to the positive nutrients list and recommended to all stage of cancer patients. Here, the food F1 (Burger) recommended for patients P1, P2, and P3 are based on the nutrients limit and the patient body condition depending upon the patient’s details. Food items suggestion based on patient disease and nutrients are shown in Tab. 5.
The efficiency of the proposed E-LSTM is analyzed by comparing with standard LSTM and existing systems DeepFood [7], Smart-Log [16], CSW-WLIFC (Cauchy, Generalized T-Student, and Wavelet kernel based Wu-and-Li Index Fuzzy Clustering) [34], and Quantized DRCNN (Deep Residual CNN) [35] which are developed for analyzing food nutrients and diets. The following terms are used for efficiency analysis,
• Precision, Recall, and F1 Score
• Classification Accuracy
• Training Loss and
• Validation Loss.
4.1 Precision, Recall and F1 Measure
The ratio between correctly predicted positive observations and the total predicted positive observations is known as precision. Here, precision indicates the correct food suggestions for cancer patients and it is represented by the formula below,
The evaluation of True Positive (TP) entities with False Negative (FN) entities is the persistence of recall which is not at all considered. Here, recall indicates the capability to identify the recommended food items for patients and it is represented by the below formula,
The weighted average of precision and recall is known as F1 score. Therefore, both the False Positives (FP) and False Negatives (FN) are considered in this score value and it is represented by the below formula,
In the above scenario, True Positive (TP) indicates the Food recommended for that cancer patient and it is classified into the recommended list. False Positive (FP) indicates the food that is not recommended for that cancer patient, but it is wrongly classified into the recommended list. True Negative (TN) indicates the Food which is not recommended for that cancer patient and it is correctly classified into the avoided list. False Negative (FN) indicates the Food which is recommended for that cancer patient but it is wrongly classified into the avoided list.
Precision, Recall, and F1 Score values for Standard LSTM, E-LSTM, DeepFood, Smart-Log, CSW-WLIFC, and Quantized DRCNN are stated in Tab. 6.
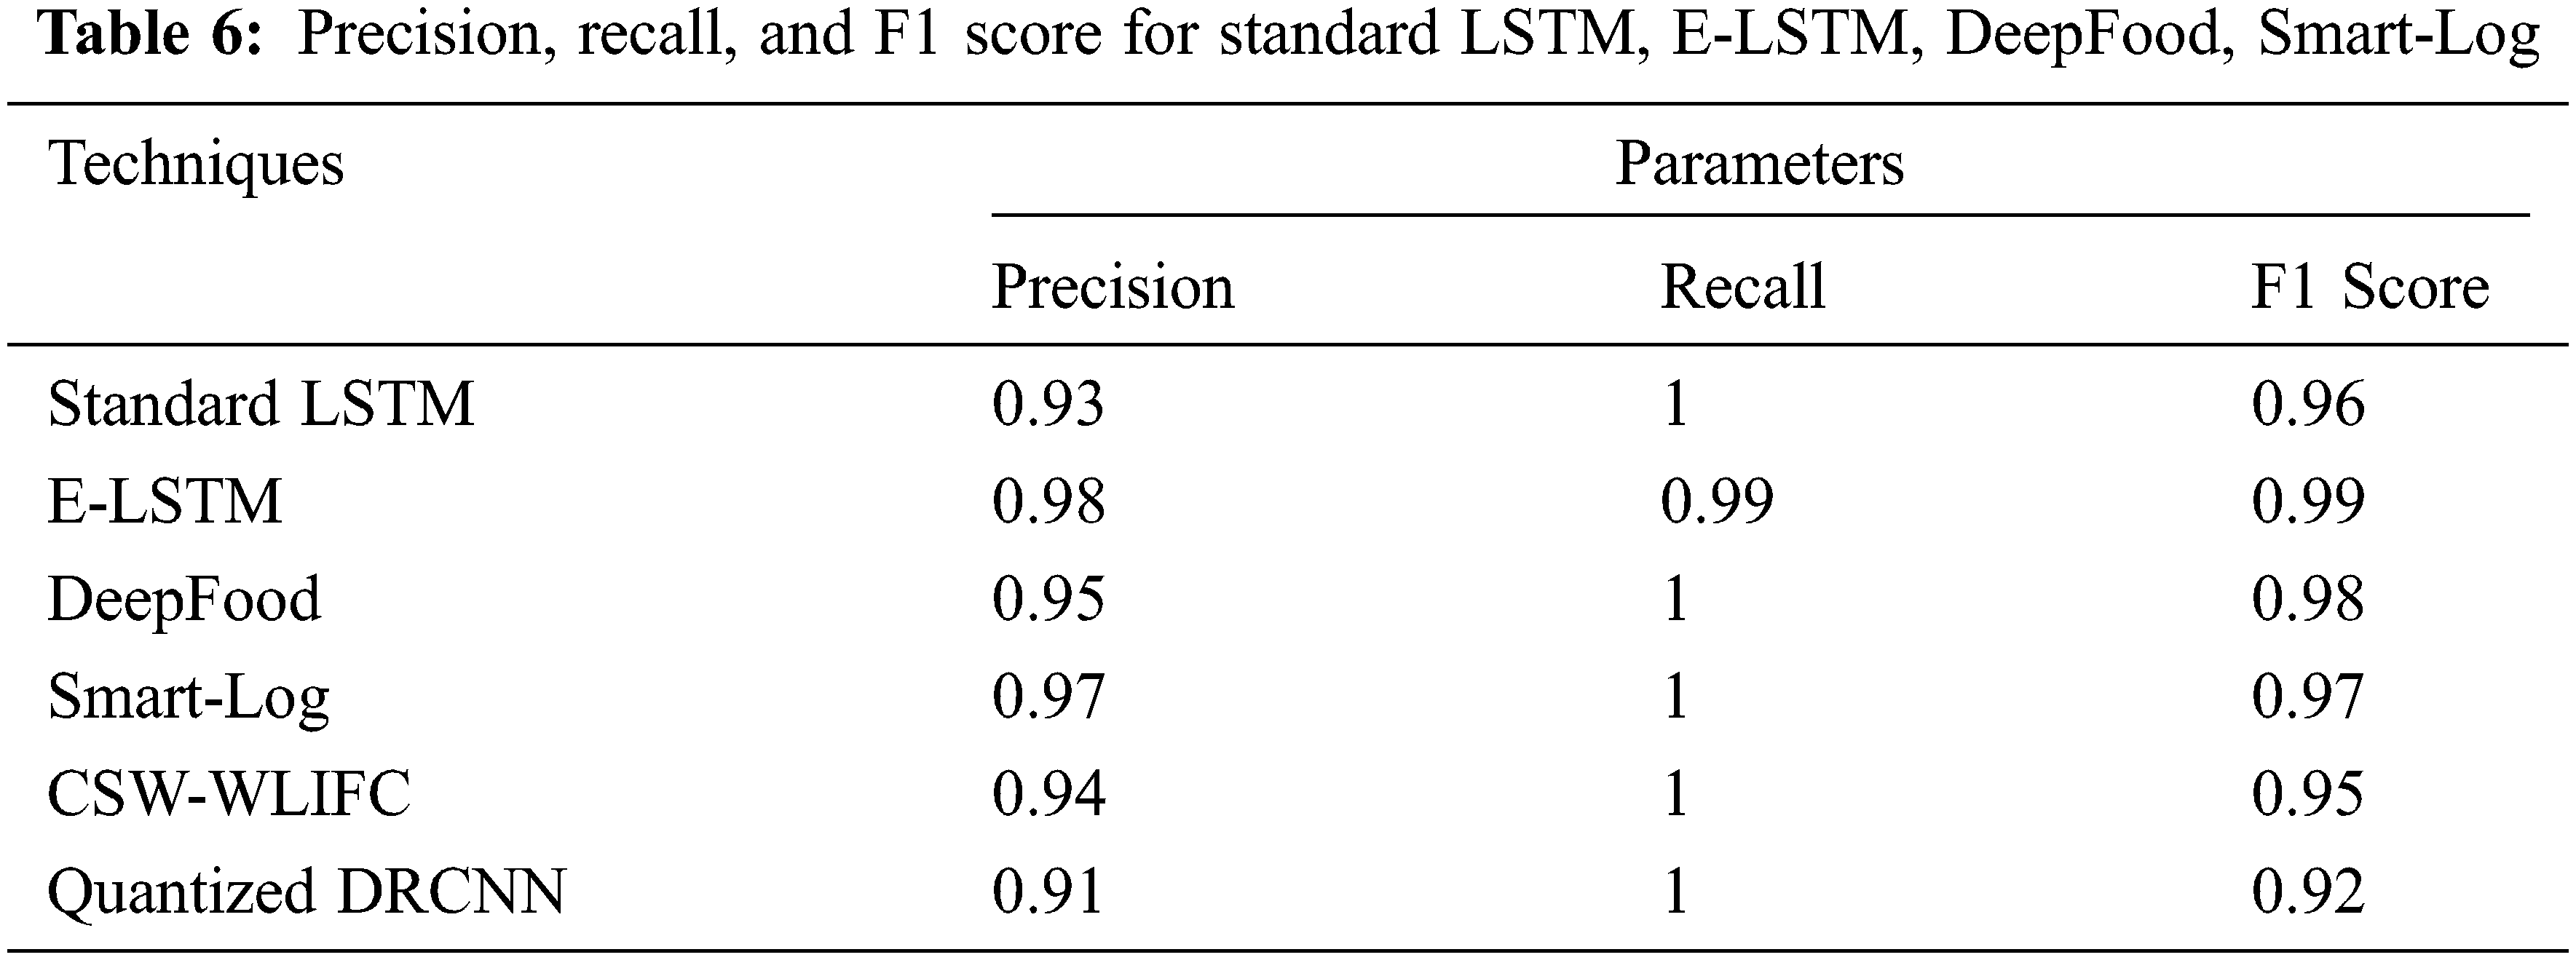
Fig. 4 shows that the E-LSTM outperformed better than the standard LSTM, E-LSTM, DeepFood, Smart-Log, CSW-WLIFC, and the Quantized DRCNN in all three parameters. For example, in Quantized DRCNN technique, the convolution layer needs kernel and the input image must have the same dimension to apply the convolution function. The training of the deep CNN is very complicated because the input of each layer is impacted by the output of the proceeding layers [36]. Also, the quantization process leads to performance degradation which will affect the accuracy and also leads to the wrong prediction. The wrong prediction reduces the precision values, and low F1 score, and hence, it reflects in the recall values. But in the proposed E-LSTM, the prediction process produces an accurate result as it is having high robust trainings. Hence, this proposed method is found to be outperforming well than other techniques.
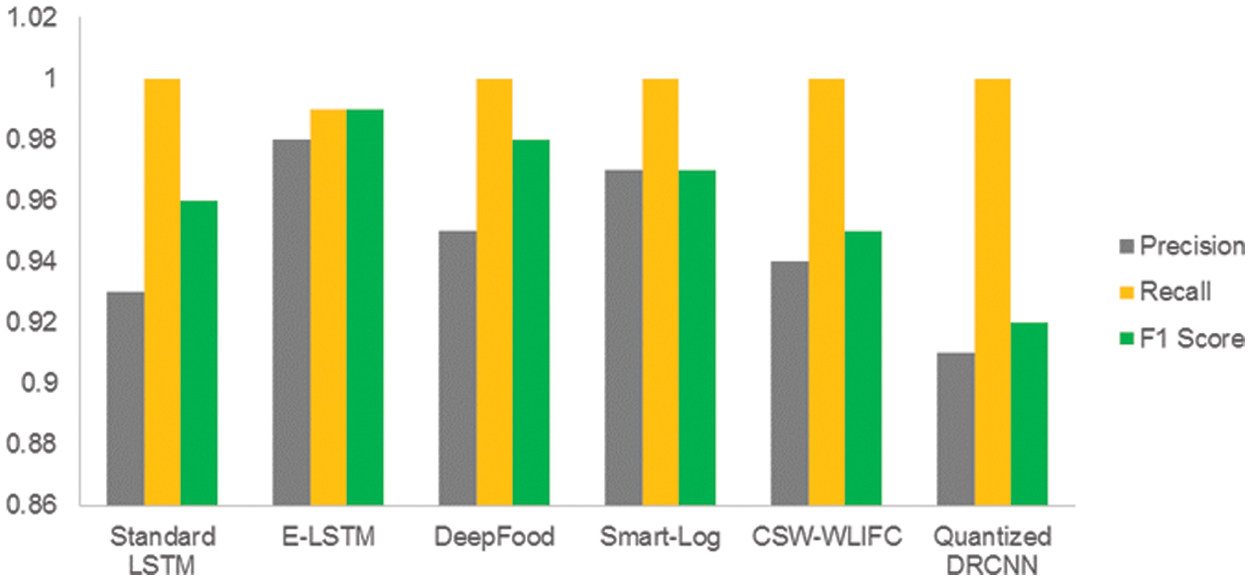
Figure 4: Precision, recall and F1 score of standard LSTM, E-LSTM, DeepFood, Smart-Log, CSW-WLIFC and Quantized DRCNN
The classification accuracy of the proposed E-LSTM was tested by comparing it with standard LSTM, DeepFood, Smart-Log, CSW-WLIFC, and Quantized DRCNN which is stated in Tab. 7 and Fig. 5. The accuracy is calculated by using the following formula,
Fig. 5 shows that the E-LSTM is outperforming well than the standard LSTM in terms of classification accuracy. From the graph, it is found that the proposed E-LSTM provides good classification accuracy results when compared with other techniques. In DeepFood [7], the food images are classified using the Deep CNN model. This Deep CNN is insufficient for thorough analysis as it considers only a certain amount of nutrition. In Smart-Log, [16] Perceptron Neural Network and Bayesian Network is used for food prediction. In this Smart-Log, only the food is predicted and it will not produce any diet plan. In Quantized DRCNN [35], the deep learning model (CNN) is used to identify only the vegetables in the food images and it will not consider the food nutrition values. In the CSW-WLIFC technique, Whale Levenberg Marquardt Neural Network (WLM-NN) classifier is used for the classification. In that classification, the classifier will produce only the calorie value of the food items and it does not classify those foods based on the calorie values. But in E-LSTM, the classification layer additionally produces the positive and negative nutrients list accurately based on the nutrients values.
Figure 5: Comparison of classification accuracy between standard LSTM, E-LSTM, DeepFood, Smart-Log, CSW-WLIFC and Quantized DRCNN
The error presented in the training set of data is called training loss and it should be low. Tab. 8 contains the training loss values for Standard LSTM, E-LSTM, DeepFood, and Smart-Log.
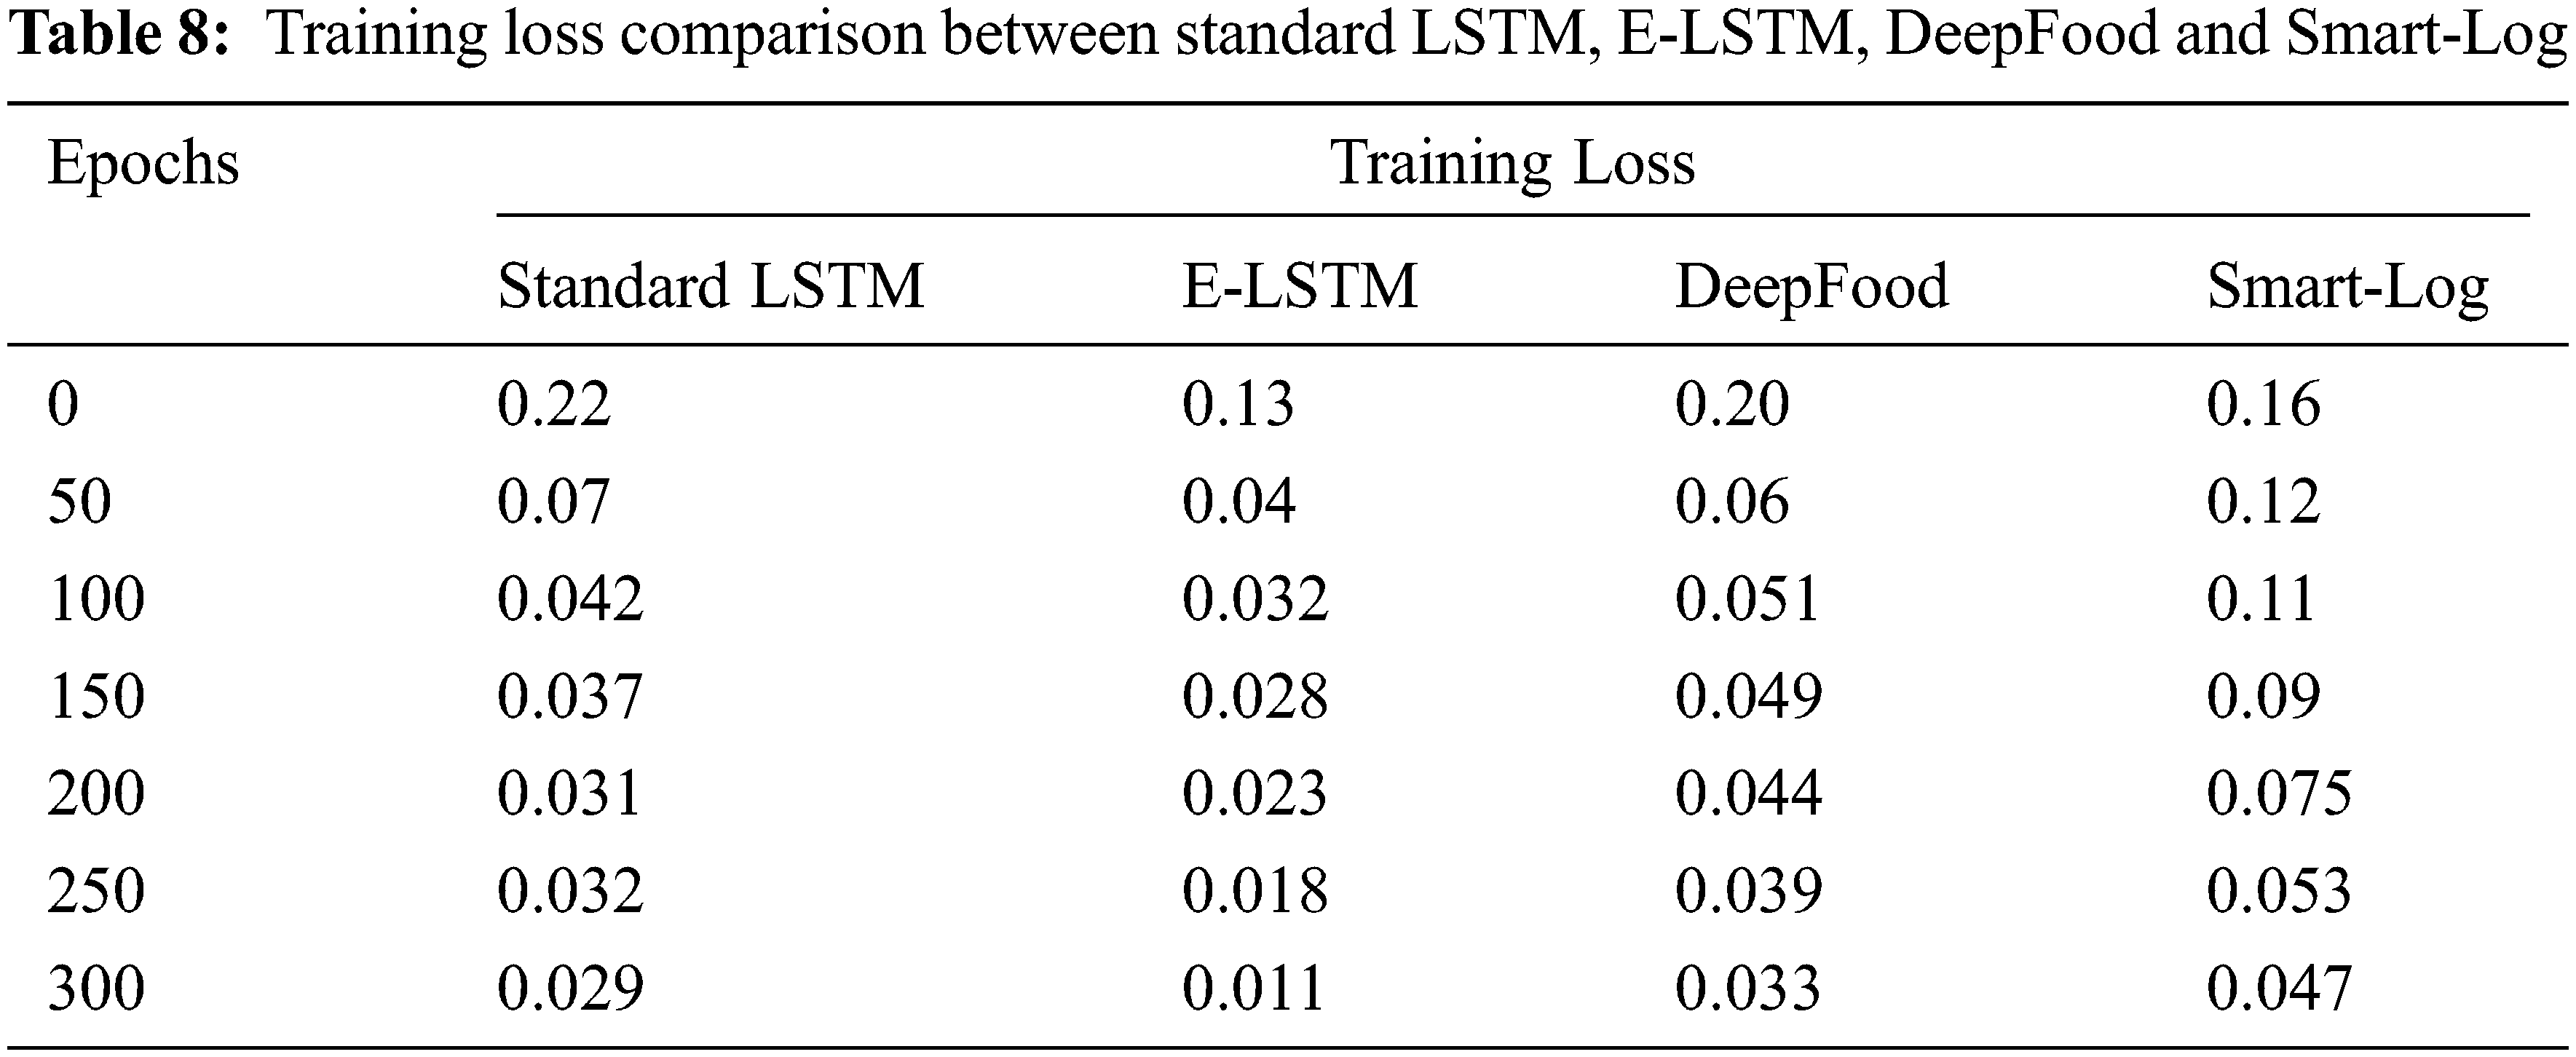
Fig. 6 shows the training loss comparison between Standard LSTM, E-LSTM, DeepFood and Smart-Log. It shows that the training loss of the proposed E-LSTM is smaller than the other three techniques.
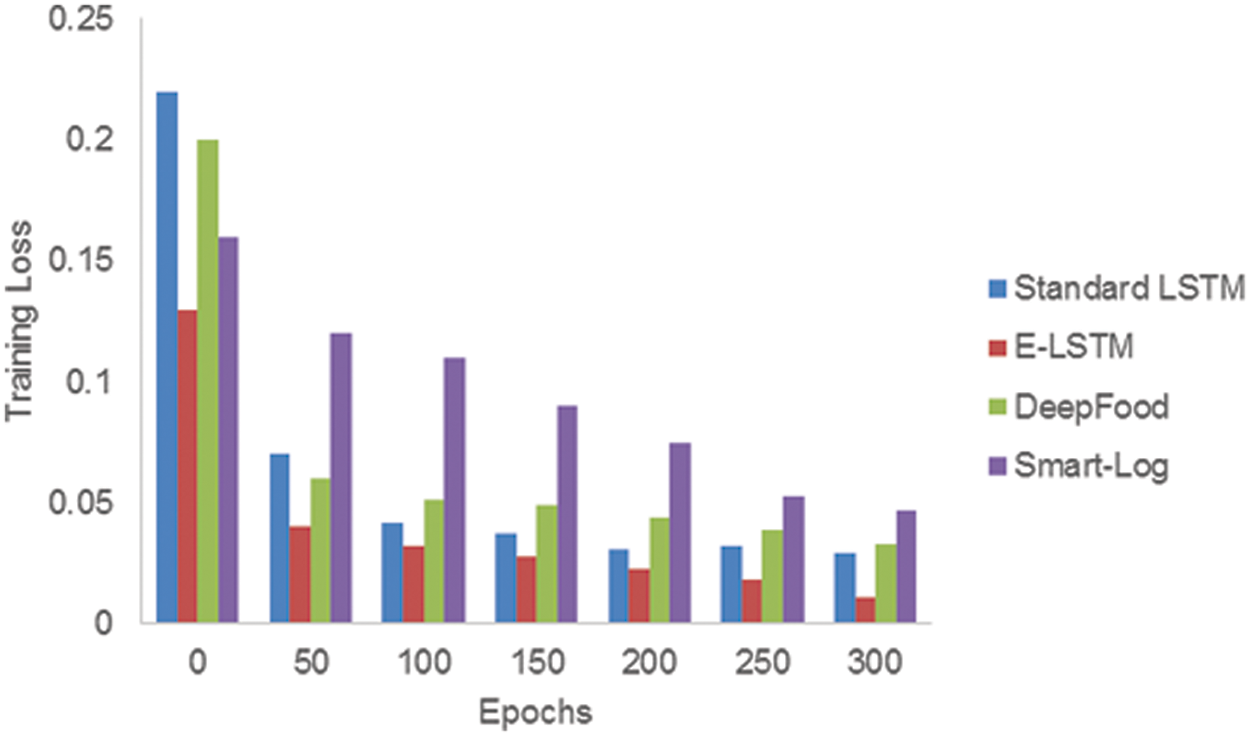
Figure 6: Comparison of training loss between standard LSTM, E-LSTM, DeepFood and Smart-Log
The error after the validation set of data running through the trained network is known as validation loss.
Fig. 7 shows the comparison of validation loss between Standard LSTM, E-LSTM, DeepFood and, Smart-Log. It shows that the validation loss of the proposed E-LSTM is smaller than the other three techniques. When compared with the training loss, only E-LSTM has a minimum value for validation loss whereas the validation loss values of other techniques were found to be exceeding its training loss values at certain points. Hence, the result shows that the E-LSTM has outperformed the other three techniques.
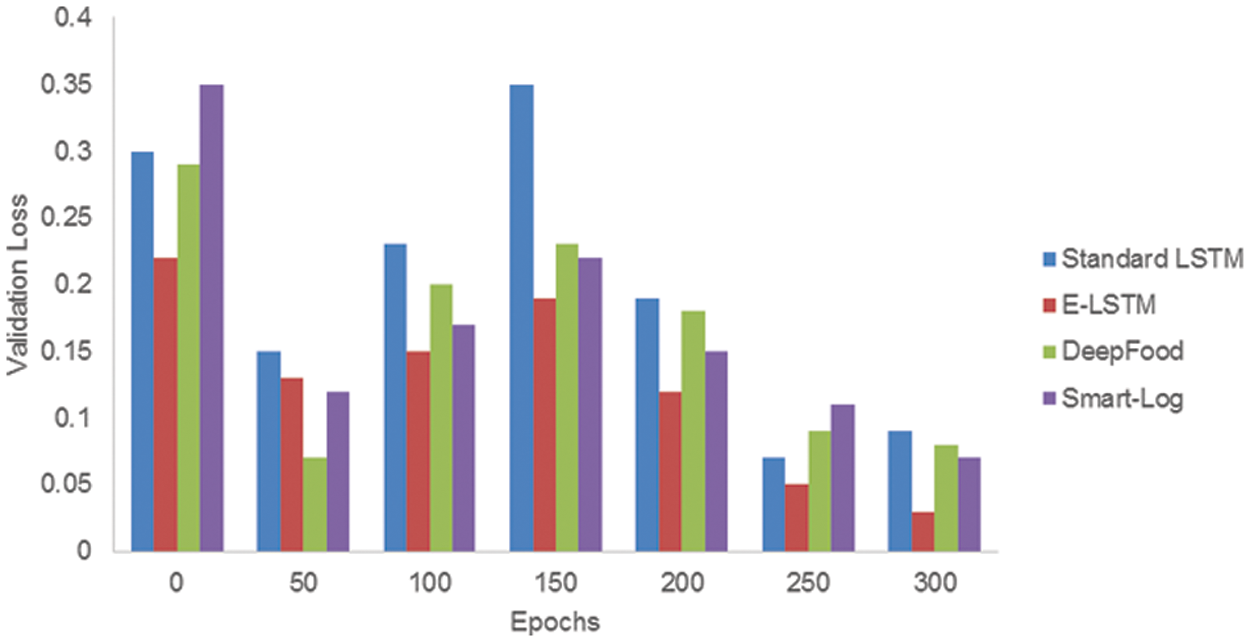
Figure 7: Comparison of validation loss between Standard LSTM, E-LSTM, DeepFood and Smart-Log
4.5 Training & Testing Accuracy
The training and testing accuracy of the proposed E-LSTM was tested by comparing it with standard LSTM, DeepFood, Smart-Log, CSW-WLIFC, and Quantized DRCNN which is stated in Tab. 9 and Fig. 8.
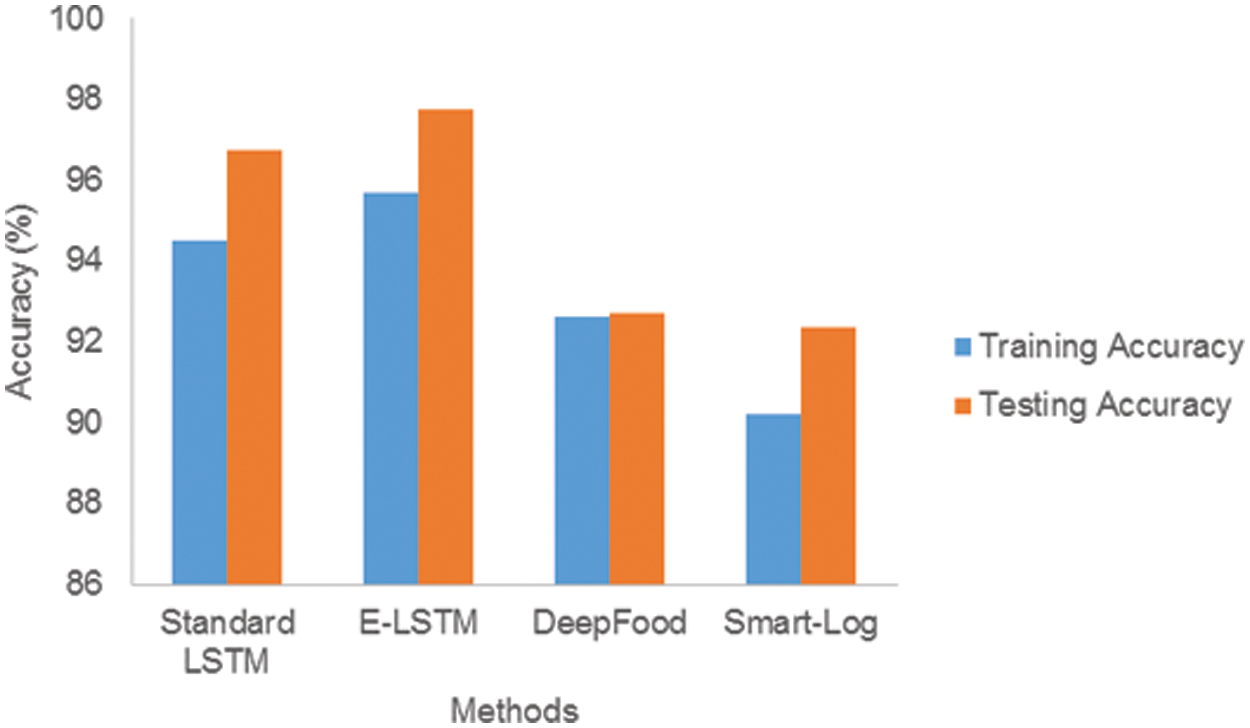
Figure 8: Comparison of training and testing accuracy between Standard LSTM, E-LSTM, DeepFood and Smart-Log
Fig. 8 shows the comparison of training and testing accuracy between Standard LSTM, E-LSTM, DeepFood and Smart-Log. 75% dataset is used as training data and 25% dataset is used as testing data. Fig. 8 shows that the training and testing accuracy of the proposed E-LSTM is better than the other three techniques. The proposed E-LSTM effectively compared the extracted food nutrition value with the patient details during the training and testing phase. Through this effective analysis, the cancer patient will get a proper food recommendation list.
Based on the nutrition analysis of food recommendation images for cancer patients, an Enhanced Long-short Term Memory has been proposed in this work. The proposed E-LSTM method was found to recommend an appropriate food diet chart for cancer patients automatically that includes both the positive and negative nutrients for every patient. In addition for feature extraction in LSTM, a dedicated layer has been produced in the name of E-LSTM to improve the level of prediction accuracy, and classification accuracy. Then, the proposed work is compared with standard LSTM and existing food recommendations like DeepFood, Smart-Log, CSW-WLIFC, and Quantized DRCNN and the result shows that the proposed E-LSTM technique outperforms well than the other techniques in terms of Classification Accuracy, F1 Score, Precision, Recall, Training Loss, and Validation Loss.
Acknowledgement: The author would like to appreciate the effort of the editors and reviewers. This research hasn’t received any specific grant from funding agencies in the public, commercial, or not-for-profit sectors.
Funding Statement: The authors received no specific funding for this study.
Conflicts of Interest: The authors declare that they have no conflicts of interest to report regarding the present study.
1. https://www.credihealth.com/blog/ultra-processed-foods-cancer-link-study/#:~:text=Teams%20from%20the%20Sorbonne%20in,percent%20higher%20risk%20of%20cancer. [Google Scholar]
2. E. Tammam, A. M. Said, A. A. Ibrahim and A. I. Galal, “About the interstitial microwave cancer ablation principles, advantages and challenges,” IEEE Access, vol. 8, pp. 49685–49694, 2020https://.https://doi.org/10.1109/access.2020.2978210. [Google Scholar]
3. https://www.hsph.harvard.edu/nutritionsource/cancer/preventing-cancer/#:~:text=Eat%20a%20healthful%20diet,healthy%20diet%20are%20often%20similar. [Google Scholar]
4. American cancer society, “Nutrition for people with cancer”, 2020. [Online]. Available: https://www.cancer.org/treatment/survivorship-during-and-after-treatment/coping/nutrition.html. [Google Scholar]
5. Z. Lei, S. Yang, H. Liu, S. Aslam, J. Liu et al., “Mining of nutritional ingredients in food for disease analysis,” IEEE Access, vol. 6, pp. 52766–52778, 2018https://.https://doi.org/10.1109/access.2018.2866389. [Google Scholar]
6. L. Zhou, C. Zhang, F. Liu, Z. Qiu and Y. He, “Application of deep learning in food: A review,” Comprehensive Reviews in Food Science and Food Safety, vol. 18, no. 6, pp. 1793–1811, 2019https://.https://doi.org/10.1111/1541-4337.12492. [Google Scholar]
7. L. Jiang, B. Qiu, X. Liu, C. Huang and K. Lin, “Deepfood: Food image analysis and dietary assessment via deep model,” IEEE Access, vol. 8, pp. 47477–47489, 2020https://.https://doi.org/10.1109/access.2020.2973625. [Google Scholar]
8. A. Salam and H. Riyaz Ahamed Ariyaluran, “Classification of food nutrients composition using deep learning,” Researchgate, vol. 4, pp. 66–83, 2019. [Google Scholar]
9. R. Yunus, O. Arif, H. Afzal, M. F. Amjad, H. Abbas et al., “A framework to estimate the nutritional value of food in real time using deep learning techniques,” IEEE Access, vol. 7, pp. 2643–2652, 2019https://.https://doi.org/10.1109/access.2018.2879117. [Google Scholar]
10. M. B. Lam, T. Nguyen and W. Chung, “Deep learning-based food quality estimation using radio frequency-powered sensor mote,” IEEE Access, vol. 8, pp. 88360–88371, 2020https://.https://doi.org/10.1109/access.2020.2993053. [Google Scholar]
11. Y. Mao, Y. He, L. Liu and X. Chen, “Disease classification based on synthesis of multiple long short-term memory classifiers corresponding to eye movement features,” IEEE Access, vol. 8, pp. 151624–151633, 2020https://.https://doi.org/10.1109/access.2020.3017680. [Google Scholar]
12. C. Iwendi, S. Khan, J. H. Anajemba, A. K. Bashir and F. Noor, “Realizing an efficient IoMT-assisted patient diet recommendation system through machine learning model,” IEEE Access, vol. 8, pp. 28462–28474, 2020https://.https://doi.org/10.1109/access.2020.2968537. [Google Scholar]
13. X. Dai, H. Yin and N. Jha, “Grow and prune compact, fast, and accurate LSTMs,” IEEE Transactions on Computers, vol. 69, no. 3, pp. 441–452, 2020https://.https://doi.org/10.1109/tc.2019.2954495. [Google Scholar]
14. S. Padmapriya and S. Murugan, “Enhanced LSTM for ASD classification,” International Journal of Scientific & Technology Research, vol. 8, no. 11, pp. 2428–2438, 2019. [Google Scholar]
15. R. Yera Toledo, A. A. Alzahrani and L. Martínez, “A food recommender system considering nutritional information and user preferences,” IEEE Access, vol. 7, pp. 96695–96711, 2019https://.https://doi.org/10.1109/access.2019.2929413. [Google Scholar]
16. P. Sundaravadivel, K. Kesavan, L. Kesavan, S. P. Mohanty and E. Kougianos, “Smart-log: A deep-learning based automated nutrition monitoring system in the IoT,” IEEE Transactions on Consumer Electronics, vol. 64, no. 3, pp. 390–398, 2018https://.https://doi.org/10.1109/tce.2018.2867802. [Google Scholar]
17. W. Sun, G. Dai, X. Zhang, X. He and X. Chen, “TBE-net: A three-branch embedding network with part-aware ability and feature complementary learning for vehicle re-identification,” IEEE Transactions on Intelligent Transportation Systems, pp. 1–13, 2021https://.https://doi.org/10.1109/TITS.2021.3130403. [Google Scholar]
18. W. Sun, L. Dai, X. Zhang, P. Chang and X. He, “RSOD: Real-time small object detection algorithm in UAV-based traffic monitoring,” Applied Intelligence, vol. 92, no. 6, pp. 1–16, 2021https://.https://doi.org/10.1007/s10489-021-02893-3. [Google Scholar]
19. http://www.vision.ee.ethz.ch/datasets/food-101/. [Google Scholar]
20. R. Li, Z. Pan, Y. Wang and P. Wang, “A convolutional neural network with mapping layers for hyperspectral image classification,” IEEE Transactions on Geoscience and Remote Sensing, vol. 58, no. 5, pp. 3136–3147, 2020https://.https://doi.org/10.1109/tgrs.2019.2948865. [Google Scholar]
21. Y. Peng, M. Liao, Y. Song, Z. Liu, H. He et al., “FB-CNN: Feature fusion-based bilinear CNN for classification of fruit fly image,” IEEE Access, vol. 8, pp. 3987–3995, 2020https://.https://doi.org/10.1109/access.2019.2961767. [Google Scholar]
22. V. Rachapudi and G. Lavanya Devi, “Improved convolutional neural network based histopathological image classification,” Evolutionary Intelligence, vol. 14, no. 3, pp. 1337–1343, 2020https://.https://doi.org/10.1007/s12065-020-00367-y. [Google Scholar]
23. M. Turkoglu, D. Hanba and A. Sengur, “Multi-model LSTM-based convolutional neural networks for detection of apple diseases and pests,” Journal of Ambient Intelligence and Humanized Computing, vol. 15, no. 1, pp. 211, 2019https://.https://doi.org/10.1007/s12652-019-01591-w. [Google Scholar]
24. F. P. Lo, Y. Sun, J. Qiu and B. Lo, “Image-based food classification and volume estimation for dietary assessment: A review,” IEEE Journal of Biomedical and Health Informatics, vol. 24, no. 7, pp. 1926–1939, 2020https://.https://doi.org/10.1109/jbhi.2020.2987943. [Google Scholar]
25. Y. Zhang, T. Zeng, X. Pan, W. Guo, Z. Gan et al., “Screening DYS-methylation genes and rules for cancer diagnosis by using the pan-cancer study,” IEEE Access, vol. 8, pp. 489–501, 2020https://.https://doi.org/10.1109/access.2019.2961402. [Google Scholar]
26. S. A. Alharbi and A. S. Rambely, “Dynamic simulation for analyzing the effects of the intervention of vitamins on delaying the growth of tumor cells,” IEEE Access, vol. 7, pp. 128816–128827, 2019https://.https://doi.org/10.1109/access.2019.2940060. [Google Scholar]
27. M. A. Moni, M. B. Islam, M. R. Rahman, M. Rashed-Al-Mahfuz, M. A. Awal et al., “Network-based computational approach to identify delineating common cell pathways influencing type 2 diabetes and diseases of bone and joints,” IEEE Access, vol. 8, pp. 1486–1497, 2020https://.https://doi.org/10.1109/access.2019.2962091. [Google Scholar]
28. D. Li and Y. Zhang, “Multi-instance learning algorithm based on LSTM for chinese painting image classification,” IEEE Access, vol. 8, pp. 179336–179345, 2020https://.https://doi.org/10.1109/access.2020.3027982. [Google Scholar]
29. T. Li, M. Hua and X. Wu, “A hybrid CNN-LSTM model for forecasting particulate matter (PM2.5),” IEEE Access, vol. 8, pp. 26933–26940, 2020https://.https://doi.org/10.1109/access.2020.2971348. [Google Scholar]
30. T. Ergen, A. H. Mirza and S. S. Kozat, “Energy-efficient LSTM networks for online learning,” IEEE Transactions on Neural Networks and Learning Systems, vol. 31, no. 8, pp. 3114–3126, 2020https://.https://doi.org/10.1109/tnnls.2019.2935796. [Google Scholar]
31. H. Xiao, M. A. Sotelo, Y. Ma, B. Cao, Y. Zhou et al., “An improved LSTM model for behavior recognition of intelligent vehicles,” IEEE Access, vol. 8, pp. 101514–101527, 2020https://.https://doi.org/10.1109/access.2020.2996203. [Google Scholar]
32. S. Wang, P. Lin, R. Hu, H. Wang, J. He et al., “Acceleration of LSTM with structured pruning method on FPGA,” IEEE Access, vol. 7, pp. 62930–62937, 2019https://.https://doi.org/10.1109/access.2019.2917312. [Google Scholar]
33. M. Roodschild, J. Gotay Sardiñas and A. Will, “A new approach for the vanishing gradient problem on sigmoid activation,” Progress in Artificial Intelligence, vol. 9, no. 4, pp. 351–360, 2020https://.https://doi.org/10.1007/s13748-020-00218-y. [Google Scholar]
34. W. R. Emmanuel and S. J. Minija, “Fuzzy clustering and whale-based neural network to food recognition and calorie estimation for daily dietary assessment,” Sādhanā, vol. 43, no. 5, pp. 67, 2018https://.https://doi.org/10.1007/s12046-018-0865-3. [Google Scholar]
35. R. Z. Tan, X. Chew and K. W. Khaw, “Quantized deep residual convolutional neural network for image-based dietary assessment,” IEEE Access, vol. 8, pp. 111875–111888, 2020https://.https://doi.org/10.1109/access.2020.3003518. [Google Scholar]
36. B. Mandal, N. B. Puhan and A. Verma, “Deep convolutional generative adversarial network-based food recognition using partially labeled data,” IEEE Sensors Letters, vol. 3, no. 2, pp. 1–4, 2019https://.https://doi.org/10.1109/lsens.2018.2886427about:blank. [Google Scholar]
 | This work is licensed under a Creative Commons Attribution 4.0 International License, which permits unrestricted use, distribution, and reproduction in any medium, provided the original work is properly cited. |