DOI:10.32604/iasc.2023.028785
| Intelligent Automation & Soft Computing DOI:10.32604/iasc.2023.028785 | |
| Article |
Networking Controller Based Real Time Traffic Prediction in Clustered Vehicular Adhoc Networks
1Saveetha School of Engineering, Saveetha Institute of Medical and Technical Sciences, Saveetha University, Saveetha Nagar, Thandalam, Chennai, 602105, India
2Department of Electronics and Communication Engineering, College of Engineering and Technology, SRM Institute of Science and Technology, Vadapalani Campus, Chennai, 600026, India
3Department of Biomedical Engineering, Saveetha School of Engineering, Saveetha Institute of Medical and Technical Sciences, Saveetha University, Saveetha Nagar, Thandalam, Chennai, 602105, India
*Corresponding Author: S. Srinivasan. Email: srinivasan.me.03@gmail.com
Received: 17 February 2022; Accepted: 14 April 2022
Abstract: The vehicular ad hoc network (VANET) is an emerging network technology that has gained popularity because to its low cost, flexibility, and seamless services. Software defined networking (SDN) technology plays a critical role in network administration in the future generation of VANET with fifth generation (5G) networks. Regardless of the benefits of VANET, energy economy and traffic control are significant architectural challenges. Accurate and real-time traffic flow prediction (TFP) becomes critical for managing traffic effectively in the VANET. SDN controllers are a critical issue in VANET, which has garnered much interest in recent years. With this objective, this study develops the SDNTFP-C technique, a revolutionary SDN controller-based real-time traffic flow forecasting technique for clustered VANETs. The proposed SDNTFP-C technique combines the SDN controller’s scalability, flexibility, and adaptability with deep learning (DL) models. Additionally, a novel arithmetic optimization-based clustering technique (AOCA) is developed to cluster automobiles in a VANET. The TFP procedure is then performed using a hybrid convolutional neural network model with attention-based bidirectional long short-term memory (HCNN-ABLSTM). To optimise the performance of the HCNN-ABLSTM model, the dingo optimization technique was used to tune the hyperparameters (DOA). The experimental results analysis reveals that the suggested method outperforms other current techniques on a variety of evaluation metrics.
Keywords: VANET; traffic flow prediction; clustering; metaheuristics; SDN controller; deep learning
Over the last decade, Intelligent Transportation Systems (ITS), particularly Vehicular Ad-hoc Networks (VANET), have garnered considerable attention for their potential to improve travel comfort [1,2], efficacy, and safety by facilitating communication between vehicles and infrastructure via infrastructure-based vehicle-to-infrastructure (V2I) or vehicle-to-vehicle (V2V) communication (V2V). At the moment, the VANET architecture has scalability issues due to the complexity of deploying services in a dynamic, large-scale, and dense topology [2]. The current VANET design is incapable of successfully addressing these increasing issues, necessitating the development of scalable and innovative adaptable VANET architectures. Recently, Software Defined Networking (SDN) has emerged as a critical technology for managing large-scale networks [3]. SDN has been promoted as a viable and appealing model for resolving past VANET issues. SDN is mostly based on a physical separation of the data plane (data forwarding capabilities) and the control plane (network management capabilities), as well as a logical separation of control and intelligence from the software controller. The primary motivation for this work is to exploit SDN’s adaptability and flexibility for forecasting traffic flows from the VANET architecture, owing to the accessibility of a holistic perspective. The framework of the VANET is depicted in Fig. 1 [4].
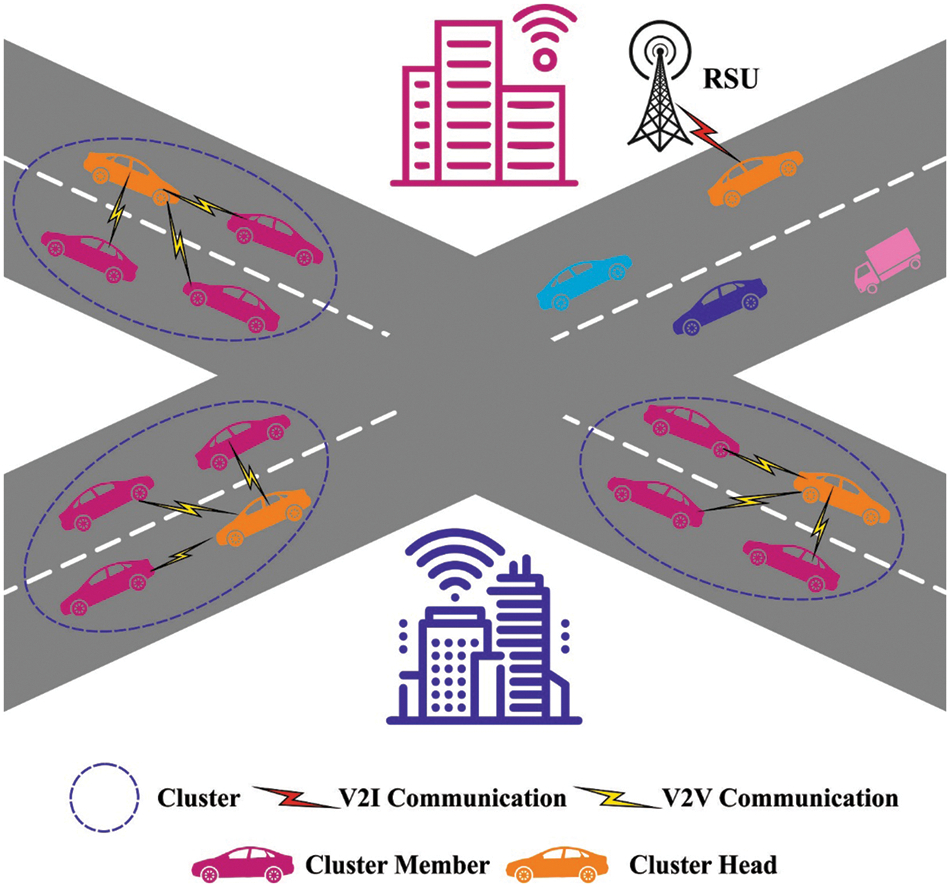
Figure 1: VANET structure
The VANET architecture creates a vast amount of data at RSUs and OBUs, which must be used intelligently to determine the scheme’s performance [5]. Traffic management in cities has remained a concern in recent years due to a lack of predictive methods for traffic flow. Machine learning’s (ML) decision-making and prediction capabilities are critical in VANET architecture [6]. Similarly, the current study on traffic flow prediction focuses on determining the vehicle movement pattern in a geographical location using data from a General Positioning System (GPS) sensor and then using machine learning to estimate traffic patterns [7]. This method evaluates vehicular data from the area, which may result in the discovery of common traffic patterns. However, this technique does not incorporate specialised behavioural learning for certain range junctions [8]. Due to the adaptive and dynamic nature of the SDN architecture, which manages the entire network, it is no longer essential to reconfigure physical devices (RSUs or OBUs) in response to network changes [9]. The vehicular node is very mobile in the VANET architecture, resulting in rapid changes and instability of network links. The primary purpose of this study is to apply computationally intelligent techniques to vehicle data under the supervision of a centralised SDN controller and then adaptively determine the scheme’s future state based on the projected model [10]. This paper introduces the SDNTFP-C technique, which is an efficient SDN controller-based real-time traffic flow forecasting technique for clustered VANETs. The proposed SDNTFP-C technique combines the SDN controller’s scalability, flexibility, and adaptability with deep learning (DL) models. Additionally, a novel arithmetic optimization-based clustering algorithm (AOCA) is developed to classify the automobiles in the VANET into discrete clusters. Additionally, the Tensor Flow Probability (TFP) procedure is carried out using a hybrid convolutional neural network combined with an attention-based bidirectional long short-term memory model (HCNN-ABLSTM). Finally, the tuning of hyperparameters is accomplished by the application of a sophisticated optimization technique (DOA). To determine whether the SDNTFP-C approach improves outcomes, a rigorous comparison study with existing procedures is conducted.
Bhatia et al. [11] described a data-driven approach for forecasting vehicular traffic behaviour using an artificially intelligent method. It combines the scalability, adaptability, and flexibility provided by Software Defined Video Networking (SDVN) infrastructure with Machine Learning (ML) approaches for successfully modelling traffic flow. Nahar et al. [12] combined spectral clustering and a deep deterministic policy gradient (DDPG) technology, dubbed SDN enabled spectral clustering-based optimised routing (SeScR), to improve cluster stability and route selection. The spectral clustering technique was used to overcome the arbitrary node distribution of VANETs and to provide flexible grouping based on the graph laplacian’s eigen values. The researchers in [13] presented SDPredictNet, a Recurrent Neural Network (RNN) infrastructure that is used on the SDN Controller to forecast network traffic and update the flow table of the superior layer switch for routing based on ostensible network constraints. SDPredictNet makes use of the Sequence-to-Sequence technique to forecast traffic from the SDN that is modelled using ANNs for predicting the direction of packets. Alioua et al. [14] focused on implementing SDN in a vehicle context devoid of infrastructure. To do this, it may be necessary to propose a novel distributed SDN-based infrastructure capable of addressing uncovered infrastructure-less vehicular circumstances. Khan et al. [15] proposed a novel framework for VANETs based on SDNs, which may be used to explore numerous novel services and applications that are supported by the novel structure. It is possible to offer a novel routing protocol for VANETS that makes use of SDN and is coupled to existing MANET/VANET protocols, demonstrating optimal efficiency. In [16], an SDN-based ODR Protocol, SVAO separates the data forwarding and network control layers in SDN to maximise the effectiveness of data broadcasting in VANET. The Roadside Service Unit serves as the Local Controller and is responsible for selecting vehicles that are used to forward packets from road segments. Each vehicle indicates its location on the route. Similarly, a two-level structure was used.
In this study, a new SDNTFP-C technique has been developed for real-time traffic flow forecasting in clustered VANET, named the SDNTFP-C technique. The proposed SDNTFP-C technique incorporates three major processes namely AOCA based clustering, HCNN-ABLSTM based prediction, and DOA-based hyperparameter tuning process.
3.1 Process Involved in AOCA Technique
At the initial stage, the AOCA technique has been developed to elect proper CHs and organize clusters in VANET. In AOCA, the optimized procedure begins with a group of candidate solutions (X) that is generated at arbitrary, and under all iterations, optimum candidate solution are considered that optimum-attained solution or around the optimally to this point [17].
Eq. (2) computes the Math Optimizer Accelerated (MOA) feature that is utilized from the essential searching phrases.
where
where
where Math Optimizer probability (MOP) represents the co-efficient, MOP
The AOCA is a comparatively novel technique, and this work is most primary tries for testing their efficiency from the damage quantification.
The AOCA technique aims to choose the maximum number of vehicles closer to the BS instead of the vehicles located farther from BS. The procedure of selecting Cluster Head (CHs) and organizing clusters using the AOCA technique is given as follows. Consider
Minimization of
Subjected to,
The initial condition denoted that vehicle
3.2 Real Time Traffic Flow Forecasting Process
During the traffic flow forecasting process, the HCNN-ABLSTM model is applied to predict the flow of traffic in the vehicular environment. The HCNN-LSTM model is the major element of the presented module which focus on extracting the spatial-temporal features of traffic flow. The CNN comprises 2 convolution layers and the LSTM network comprises 2 LSTM layers, correspondingly. For extracting the spatial feature, the 1D convolutional process is implemented through the flow data
whereas
For improving the efficiency of DNN, the conventional approach increases the number of layers in the algorithm. In the study, we stacked different LSTM layers for capturing a high level of features of the traffic flow. LSTM layer 1 processes the sequential output from the CNN model
whereas
An attention process was presented for exploring the inherent feature of data and improving the efficacy of data processing. The typical LSTM could not find a significant part of traffic flow sequence. The resultant of HCNN-LSTM at every time step
In which
The score
whereas
3.3 Hyperparameter Tuning Process
In order to optimally tune the hyperparameters involved from the HCNN-ABLSTM technique, the DOA is applied to it. Dingoes are highly effective to find the position of the prey [20]. Afterward tracking the position, the pack then alpha encircles the prey. For modeling dingoes’ social hierarchy, it is considered that the present optimal agent is the aim or goal prey that is analogous to the optimum as the quest area is not known a priori. Meanwhile, other quest agencies are constantly searching for refreshing the strategy on the next probable method. This behavior of the dingoes is modeled as follows.
The position of the neighboring dingoes is characterized by a 2D position vector. As per the location of the prey
For reaching a searching space with
To estimate the intensity of dingo, subsequent equation is utilized:
Here, we could simply visualize the location update of alpha, beta, and other dingoes. Also, it is understood that dingoes (alpha, beta, etc.) upgrade the position arbitrarily and estimate the location of the prey in the searching space [21,22].
When there is no location upgrade, it implies dingo completed the hunt by attacking the prey. To arithmetically express the algorithm, the
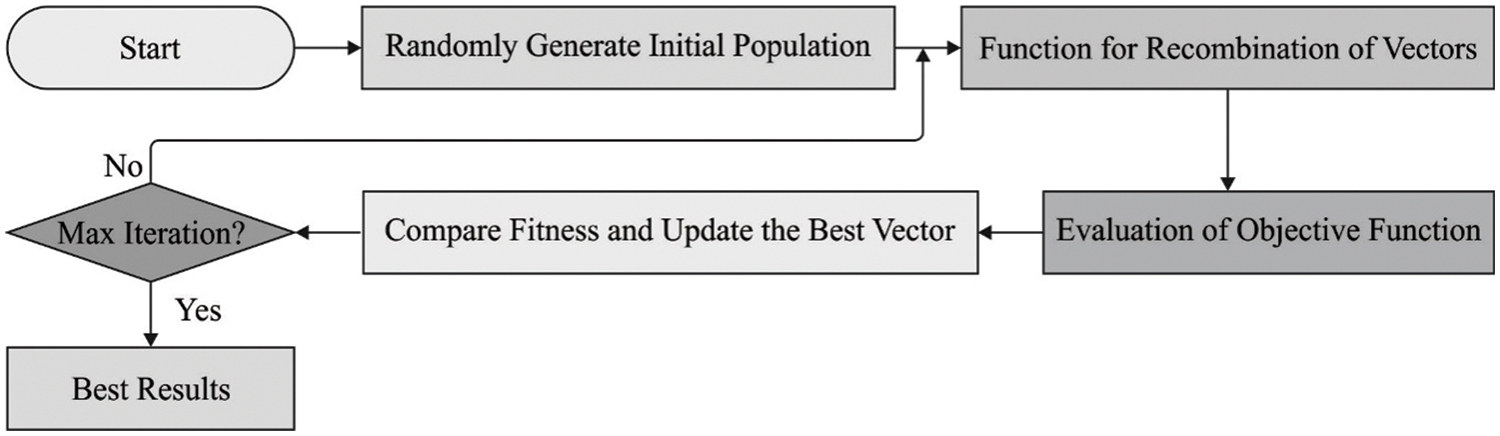
Figure 2: Process flow of DOA
The presented approach reveals exploration to a certain range; but, to highlight exploration, DOX needed more operators. This interference assists the DOX in scanning the target. It is better to search and avoid neighboring optima. Based on the dingo position, it would arbitrarily agree on the prey values and makes it essential for meeting dingo beyond or rigidly. On purpose, we utilized
The performance validation of the SDNTFP-C model takes place using varying numbers of vehicle speed (VS) and transmission range (TR). Tab. 1 and Fig. 3 demonstrate the cluster transitions (CTS) and CH lifetime (CHLT) examination of the SDNTFP-C model with recent approaches.
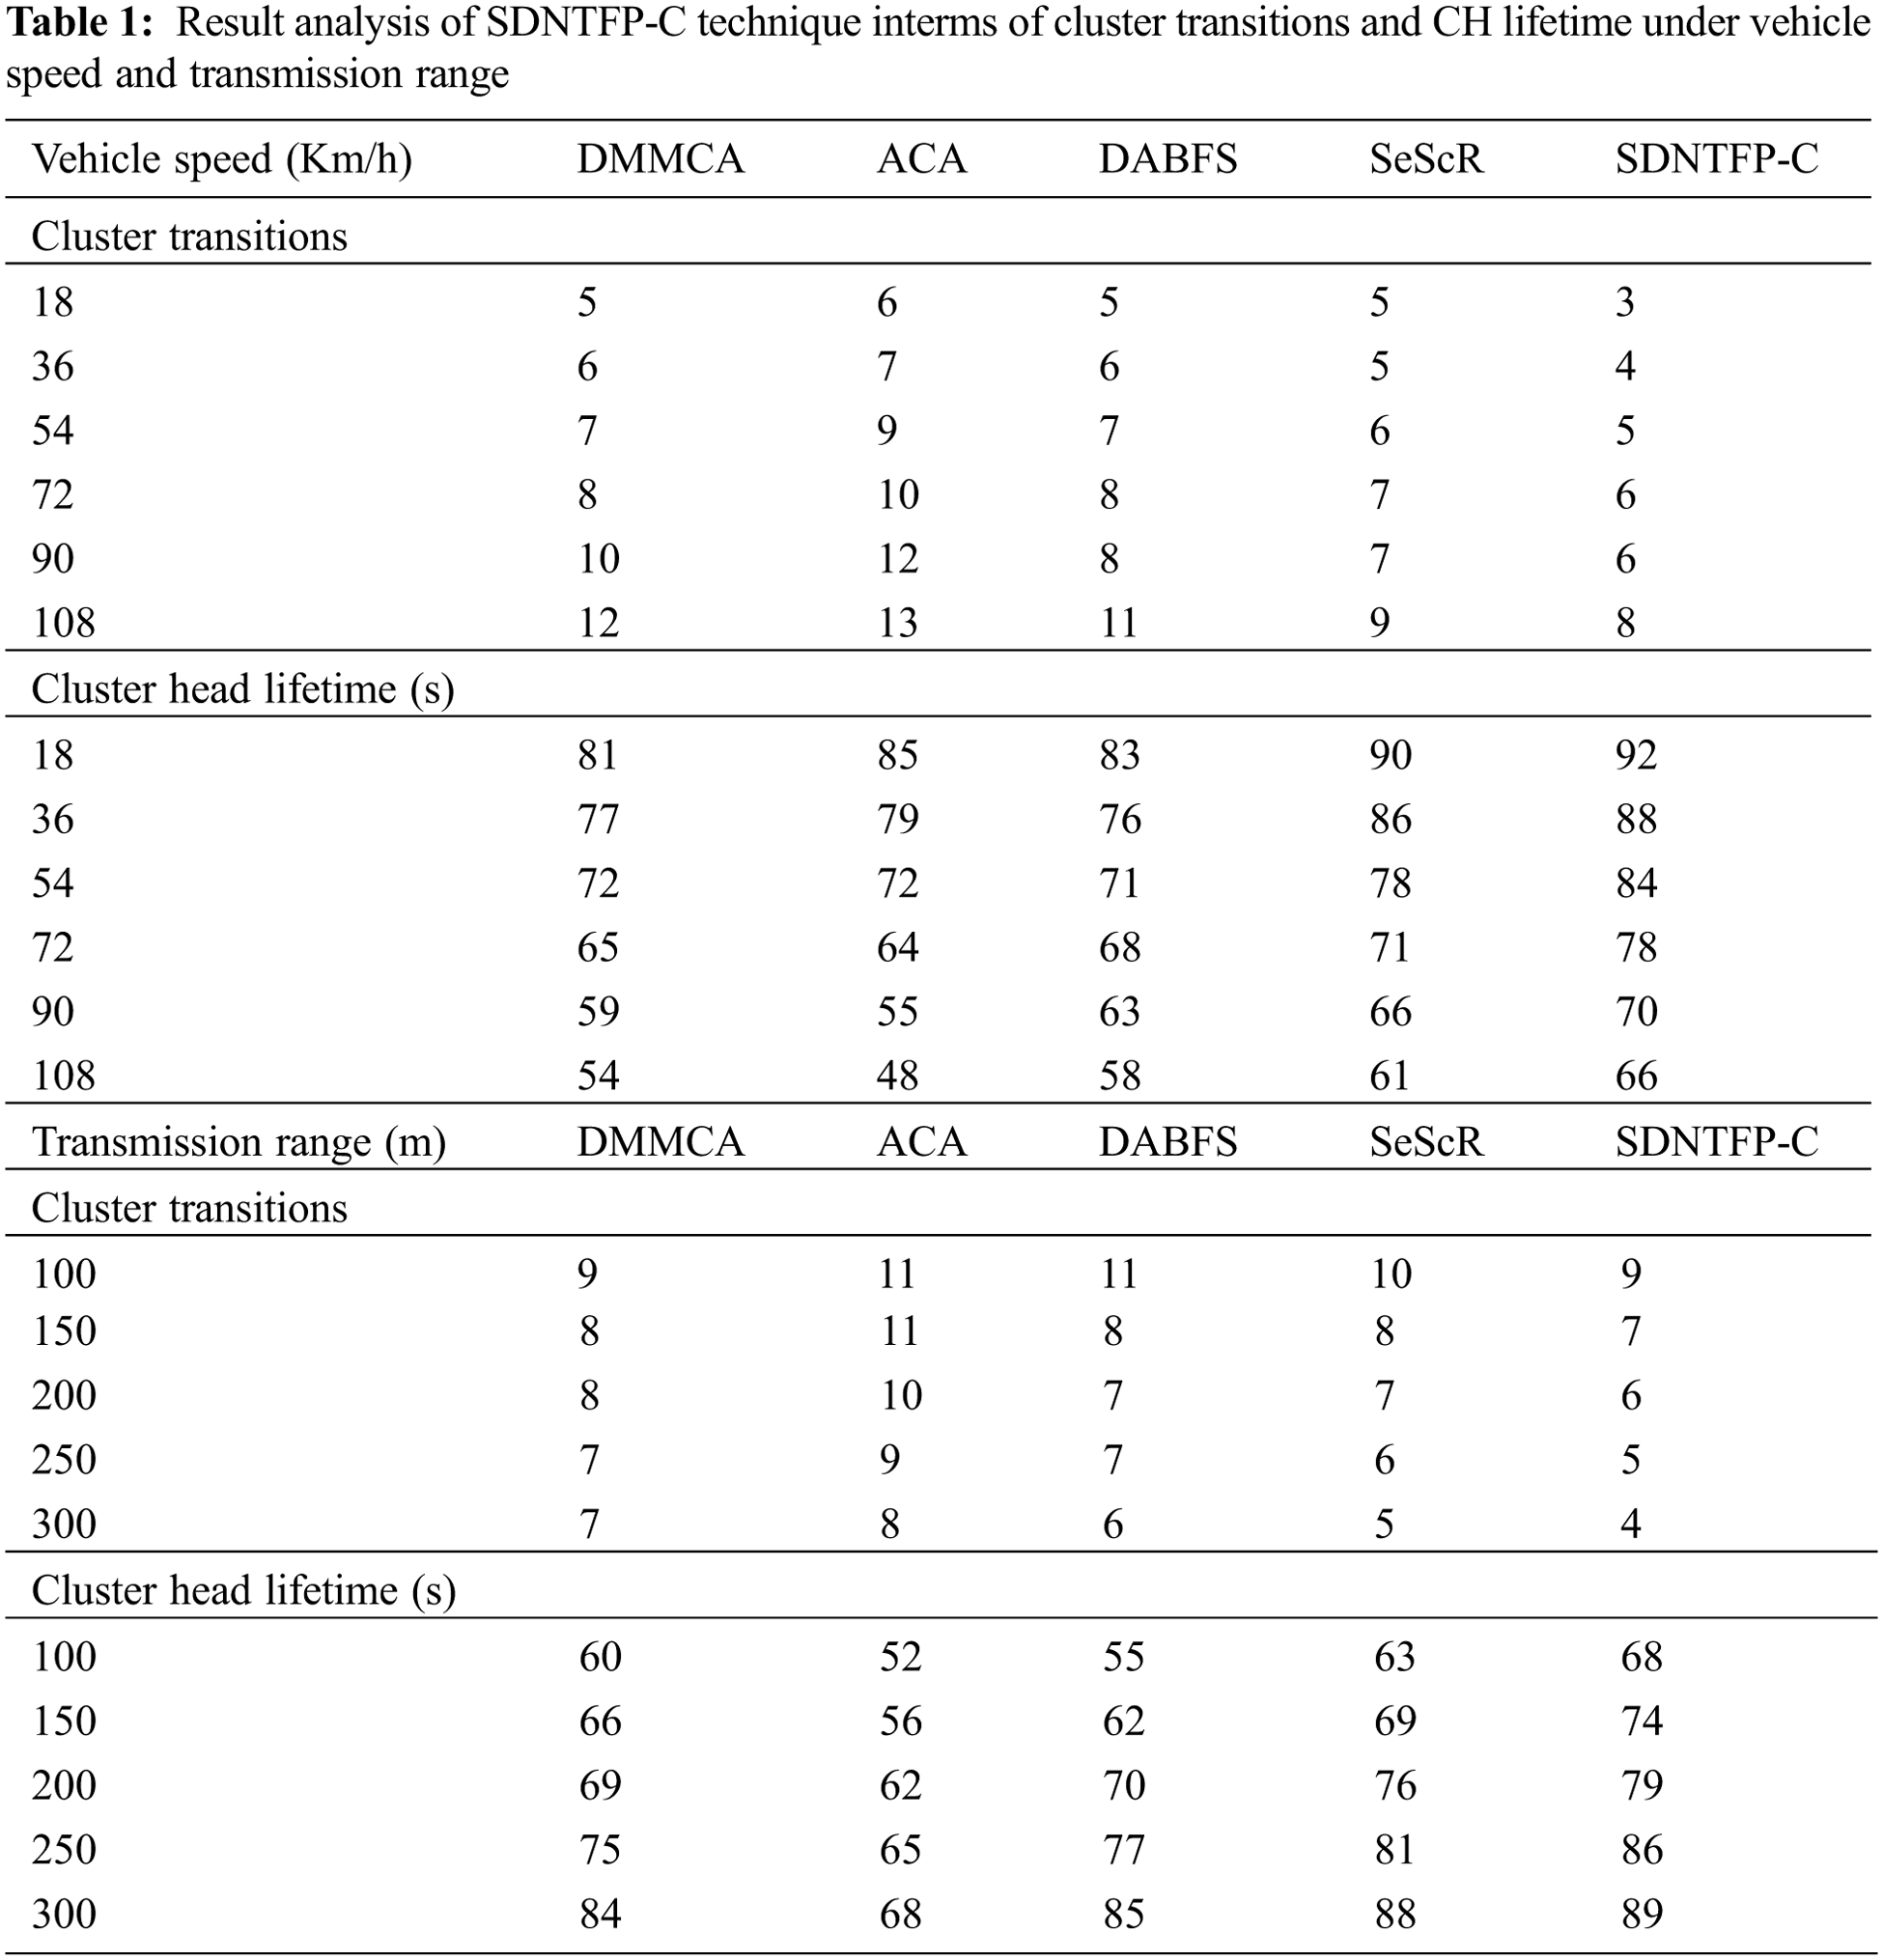
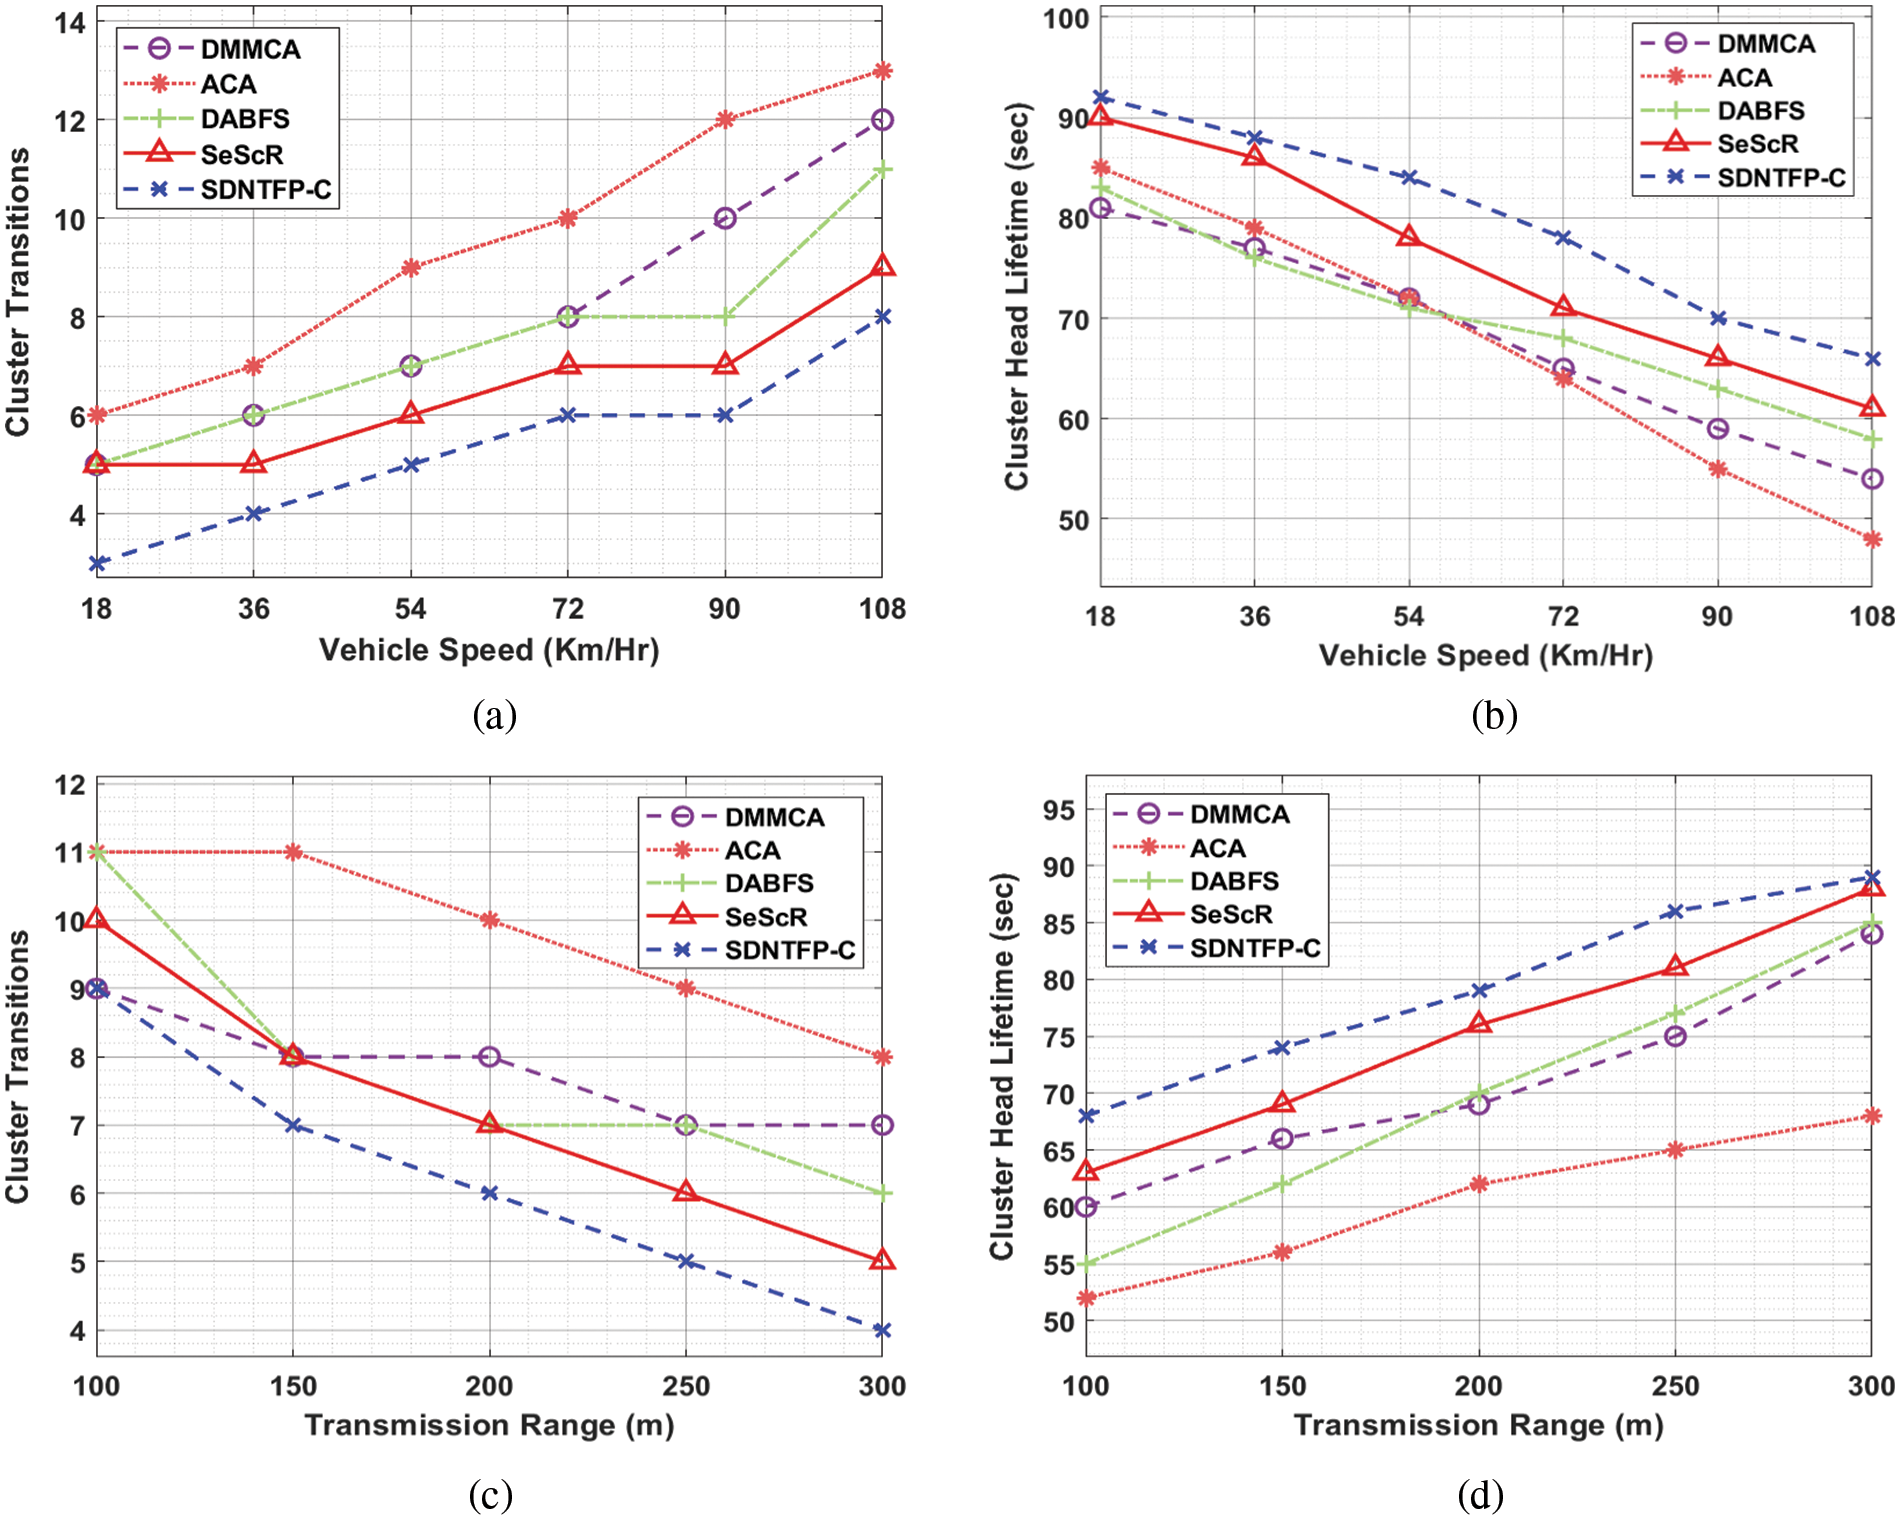
Figure 3: CTS and CHLT analysis of SDNTFP-C technique under distinct VS and TR
The experimental results stated that the SDNTFP-C model has accomplished maximal performance in terms of CTS and CHLT. On examining the results with respect to CTS, it is shown that the SDNTFP-C model has gained effectual outcomes with least CTS over the other methods. For instance, with VS of 18 km/h, the SDNTFP-C model has offered minimal CTS of 3 whereas the DMMCA, ACA, DABFS, and SeScR models have obtained maximum CTS of 5, 6, 5, and 5 respectively. In addition, with VS of 108 km/h, the SDNTFP-C model has provided a lower CTS of 8 whereas the DMMCA, ACA, DABFS, and SeScR models have attained higher CTS of 12, 13, 11, and 9 respectively.
Based on CHLT, the experimental values indicated that the SDNTFP-C model has demonstrated superior results over the other models. The simulation results reported the enhanced outcomes of the SDNTFP-C model with the maximum CHLT under all VS. For instance, with VS of 18 km/hr, the SDNTFP-C model has resulted in increased CHLT of 92 s whereas the DMMCA, ACA, DABFS, and SeScR models have reached reduced CHLT of 81, 85, 83, and 90 s respectively. In line with, with VS of 108 km/hr, the SDNTFP-C model has depicted a maximum CHLT of 66 s whereas the DMMCA, ACA, DABFS, and SeScR models have exhibited minimum CHLT of 54, 48, 58, and 61 s respectively. Similarly, the SDNTFP-C model has resulted in enhanced results in terms of CTS and CHLT under distinct TRs.
Tab. 2 and Fig. 4 illustrate the average transmission delay (ATD) and throughput (THRPT) examination of the SDNTFP-C approach with existing methods. The experimental results stated that the SDNTFP-C technique has accomplished maximal performance with respect to ATD and THRPT. On investigating the results with respect to ATD, it is demonstrated that the SDNTFP-C method has gained effectual outcomes with minimal ATD over the other methods. For instance, with VS of 18 km/hr, the SDNTFP-C model has offered minimal ATD of 31 ms whereas the MFCAR, T-DDRL, RSAR, M. Chahal, and SeScR techniques have reached higher ATD of 47, 36, 45, 51, and 36 ms respectively. Besides, with VS of 108 km/hr, the SDNTFP-C approach has provided minimal ATD of 84 ms whereas the MFCAR, T-DDRL, RSAR, M. Chahal, and SeScR approaches have achieved increased ATD of 114, 96, 121, 125, and 95 ms correspondingly.
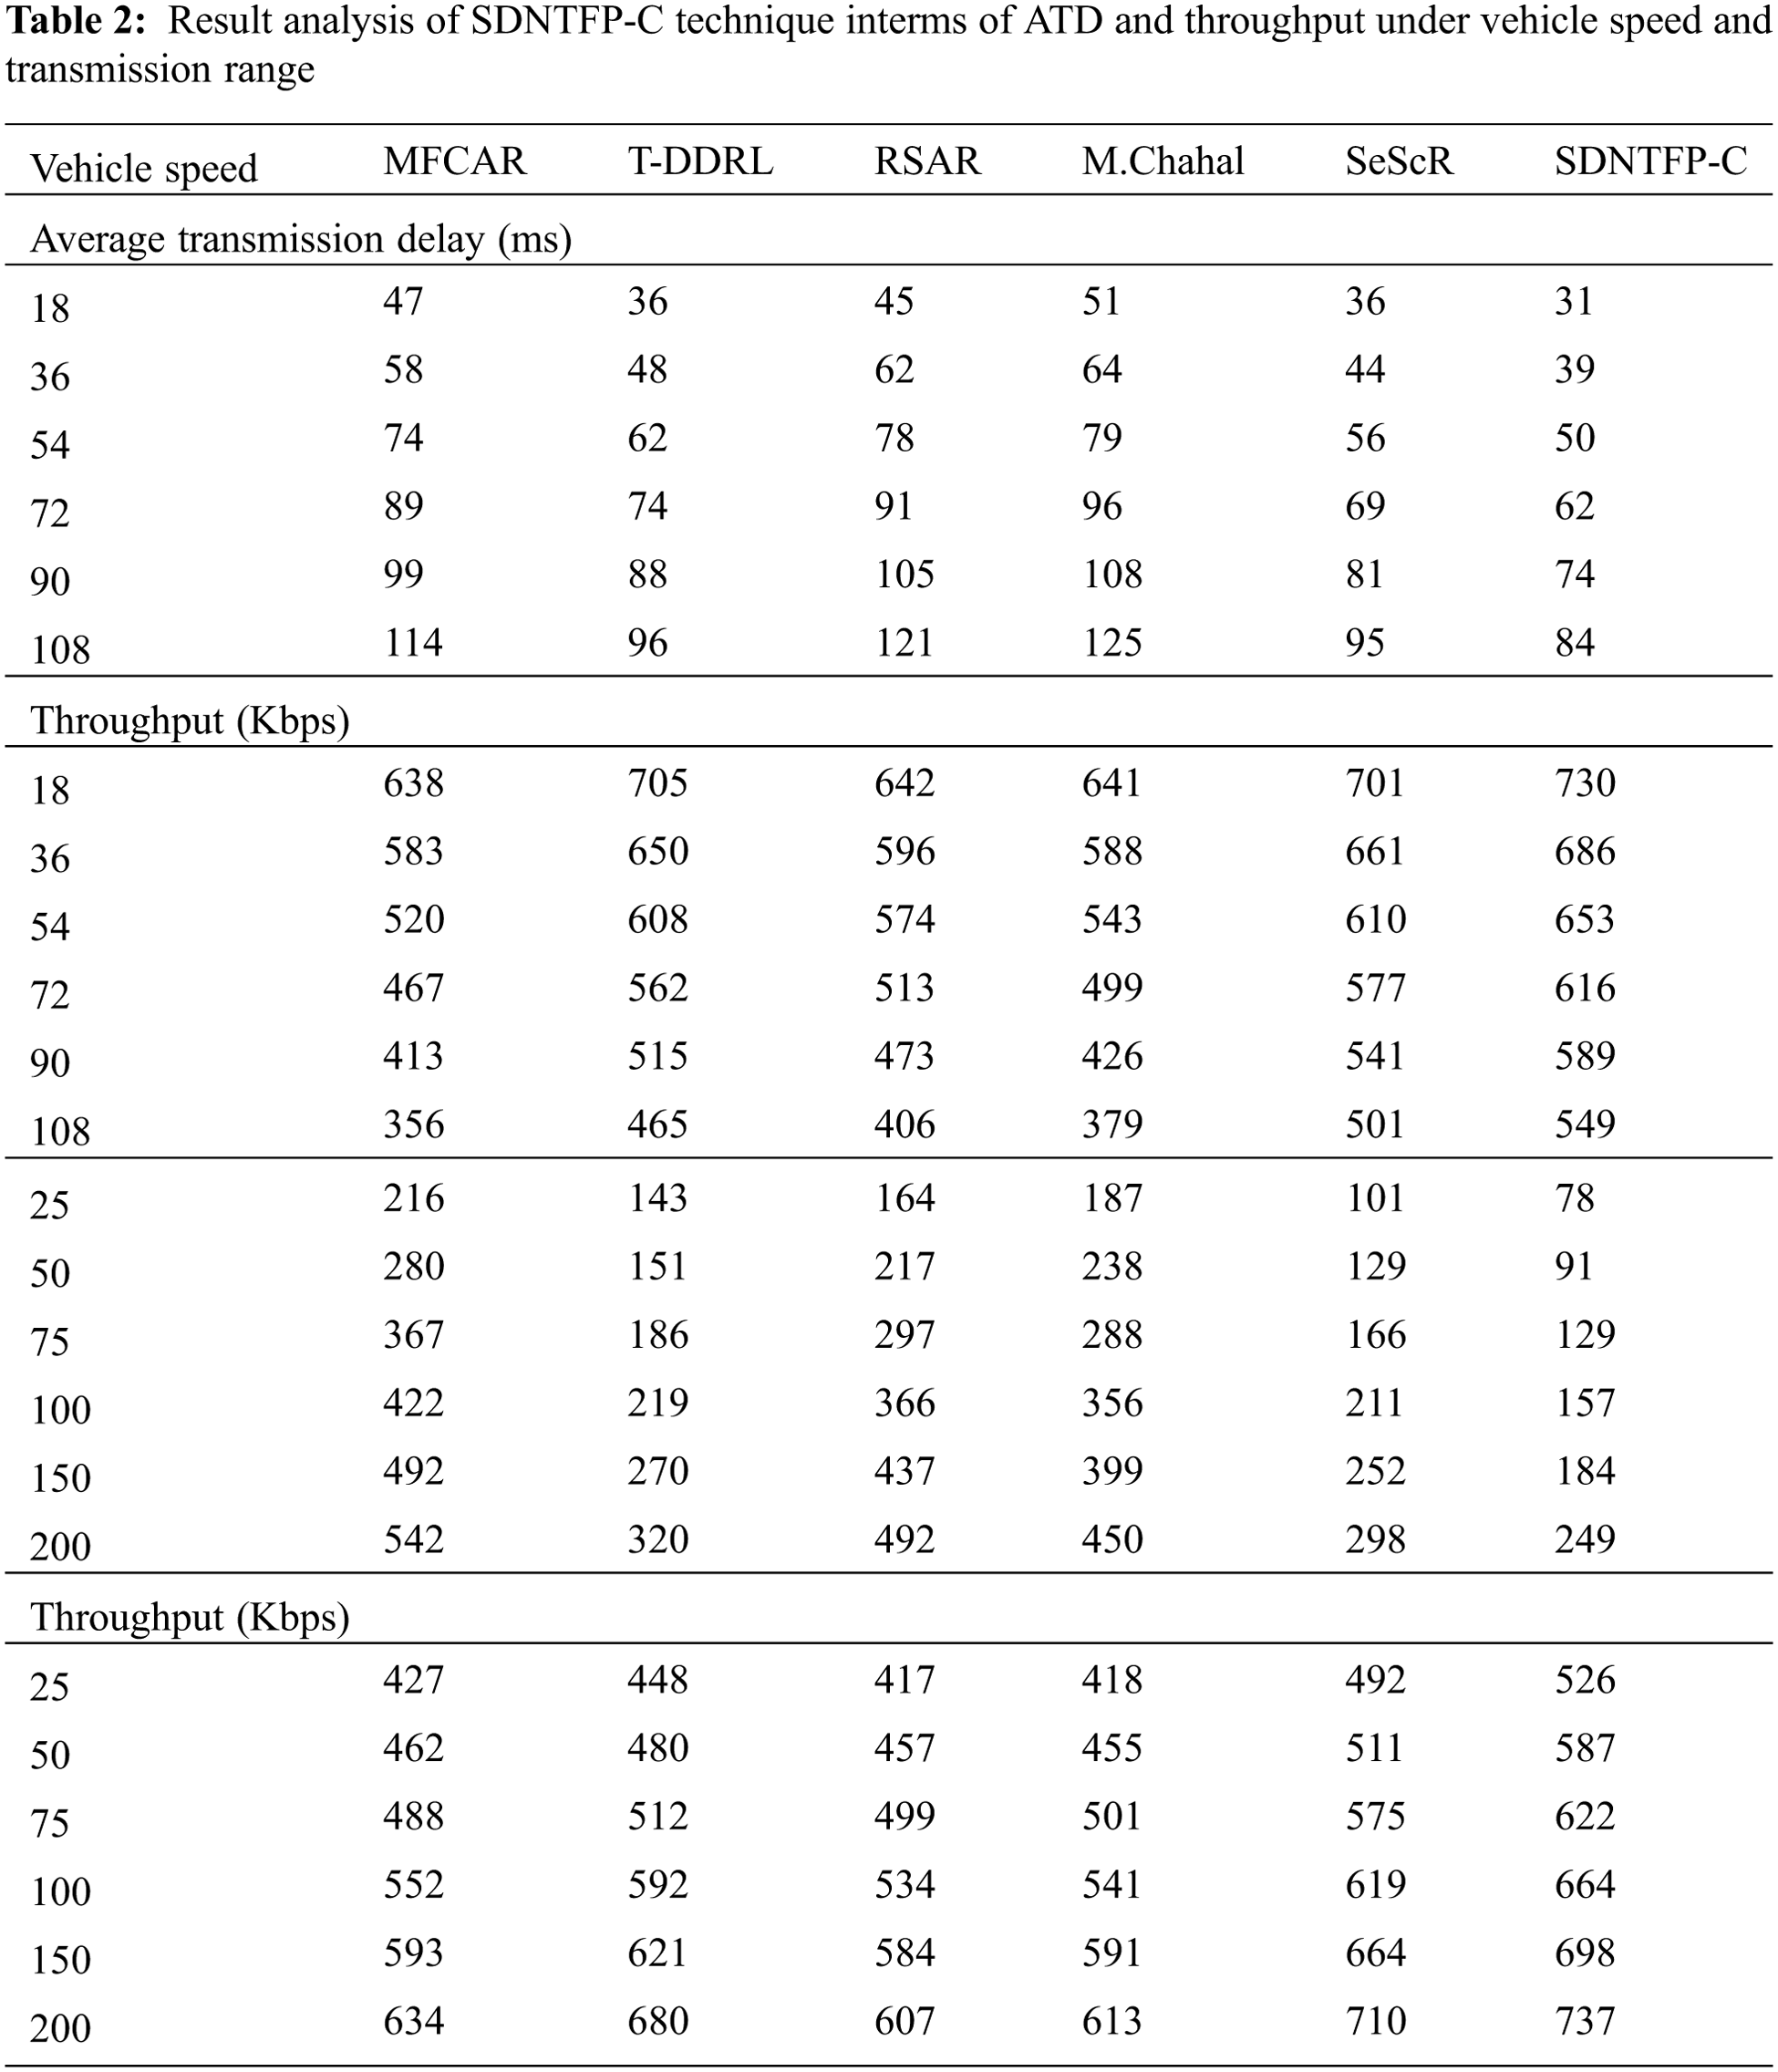
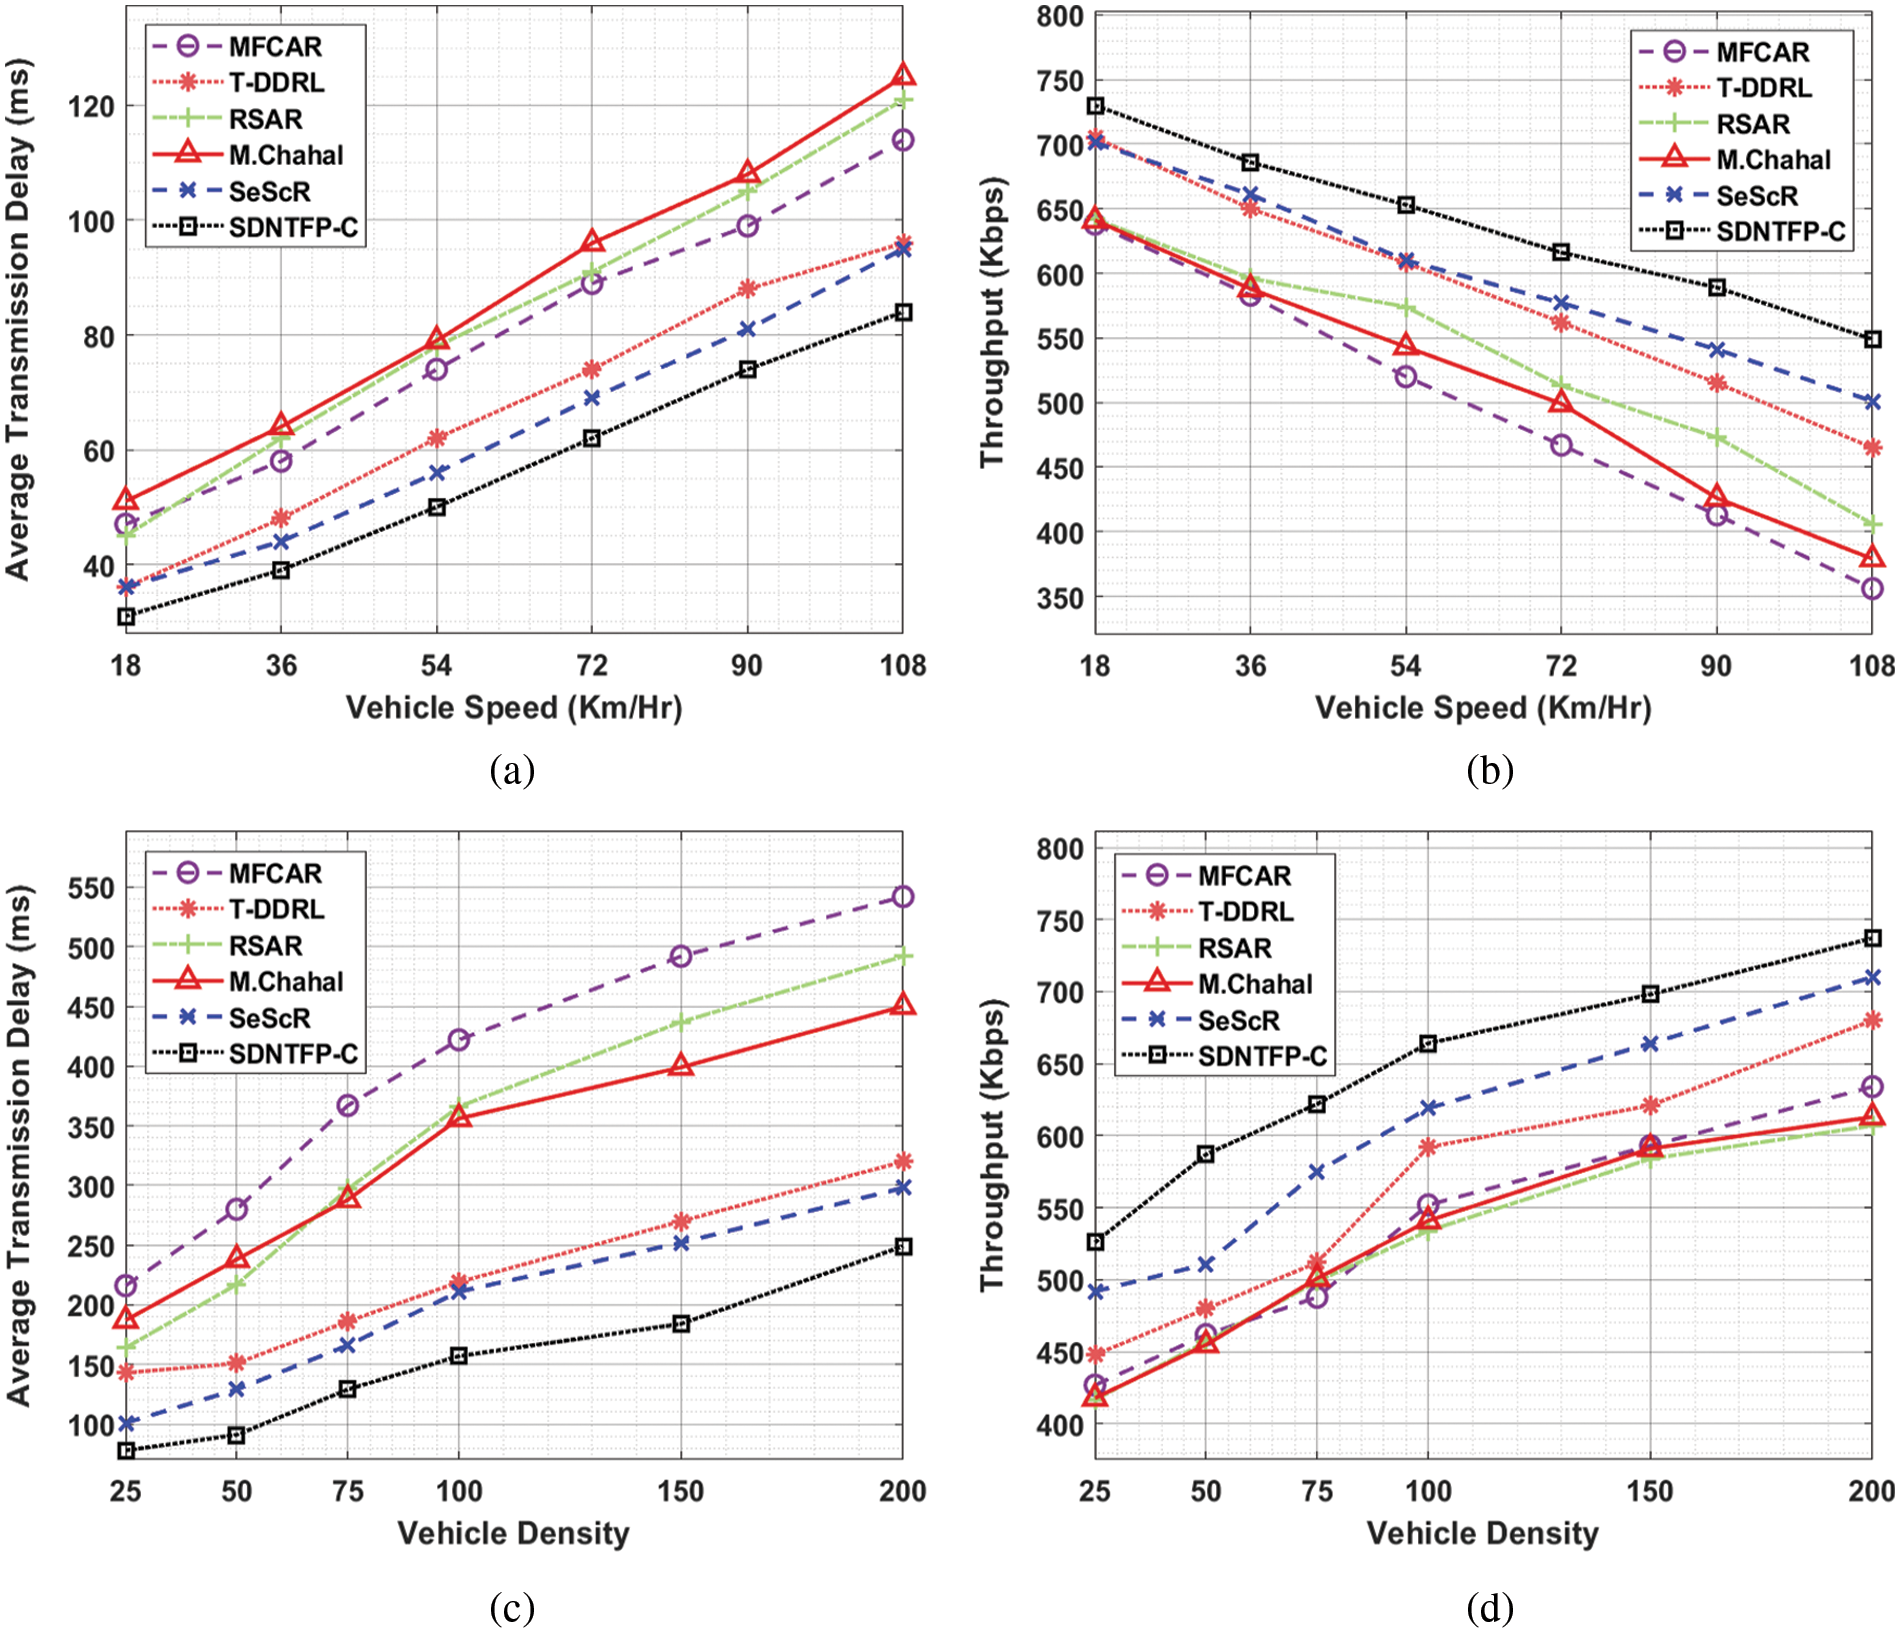
Figure 4: ADS and Throughput analysis of SDNTFP-C technique under distinct vehicle speed and density
According to THRPT, the experimental values referred that the SDNTFP-C model has demonstrated superior results over the other methods. The simulation outcomes reported the increased outcomes of the SDNTFP-C model with the maximum THRPT under all VS. For the sample, with VS of 18 km/hr, the SDNTFP-C methodology has resulted in an increased THRPT of 730 Kbps whereas the MFCAR, T-DDRL, RSAR, M.Chahal, and SeScR approaches have reached reduced THRPT of 638, 705, 642, 641, and 701 Kbps correspondingly. Likewise, with VS of 108 km/hr, the SDNTFP-C approach has depicted an increased THRPT of 549 Kbps whereas the MFCAR, T-DDRL, RSAR, M.Chahal, and SeScR models have outperformed reduced THRPT of 356, 465, 406, 379, and 501 Kbps correspondingly. Followed by, the SDNTFP-C model has resulted in enhanced results in terms of ATD and THRPT under distinct vehicle densities.
Fig. 5 illustrates the TFP results of the SDNTFP-C model with recent methods. The figure shows that the SDNTFP-C model has accomplished effectual predictive outcomes over the other methods. In addition, it can be noticed that the difference between actual and predicted values by the SDNTFP-C model is found to be minimum. Tab. 3 provides a brief TFP result analysis of the SDNTFP-C model with existing LSTM and Hierarchical Temporal Memory (HTM) models. Fig. 6 inspects the MSE inspection of the SDNTFP-C model with recent methods. The figure shows that the HTM model has shown poor performance with the increased MSE of 0.000094. In line with, the LSTM model has attained certainly a reduced MSE of 0.00003. However, the SDNTFP-C model has outperformed the other existing techniques by offering a minimal MSE of 0.00002.
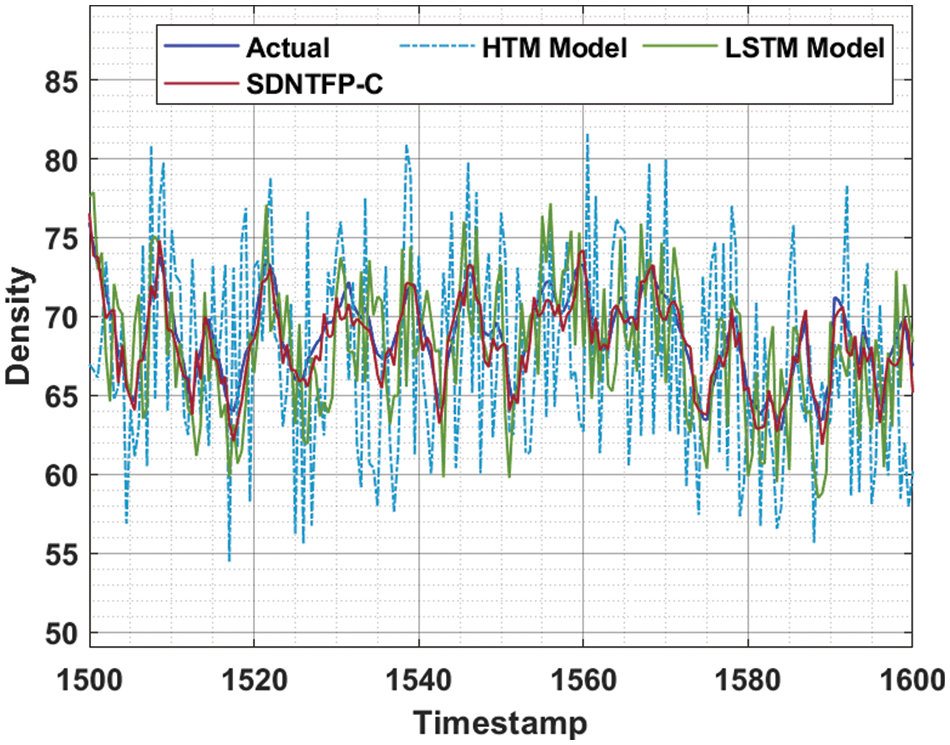
Figure 5: TFP analysis of SDNTFP-C technique with existing approaches
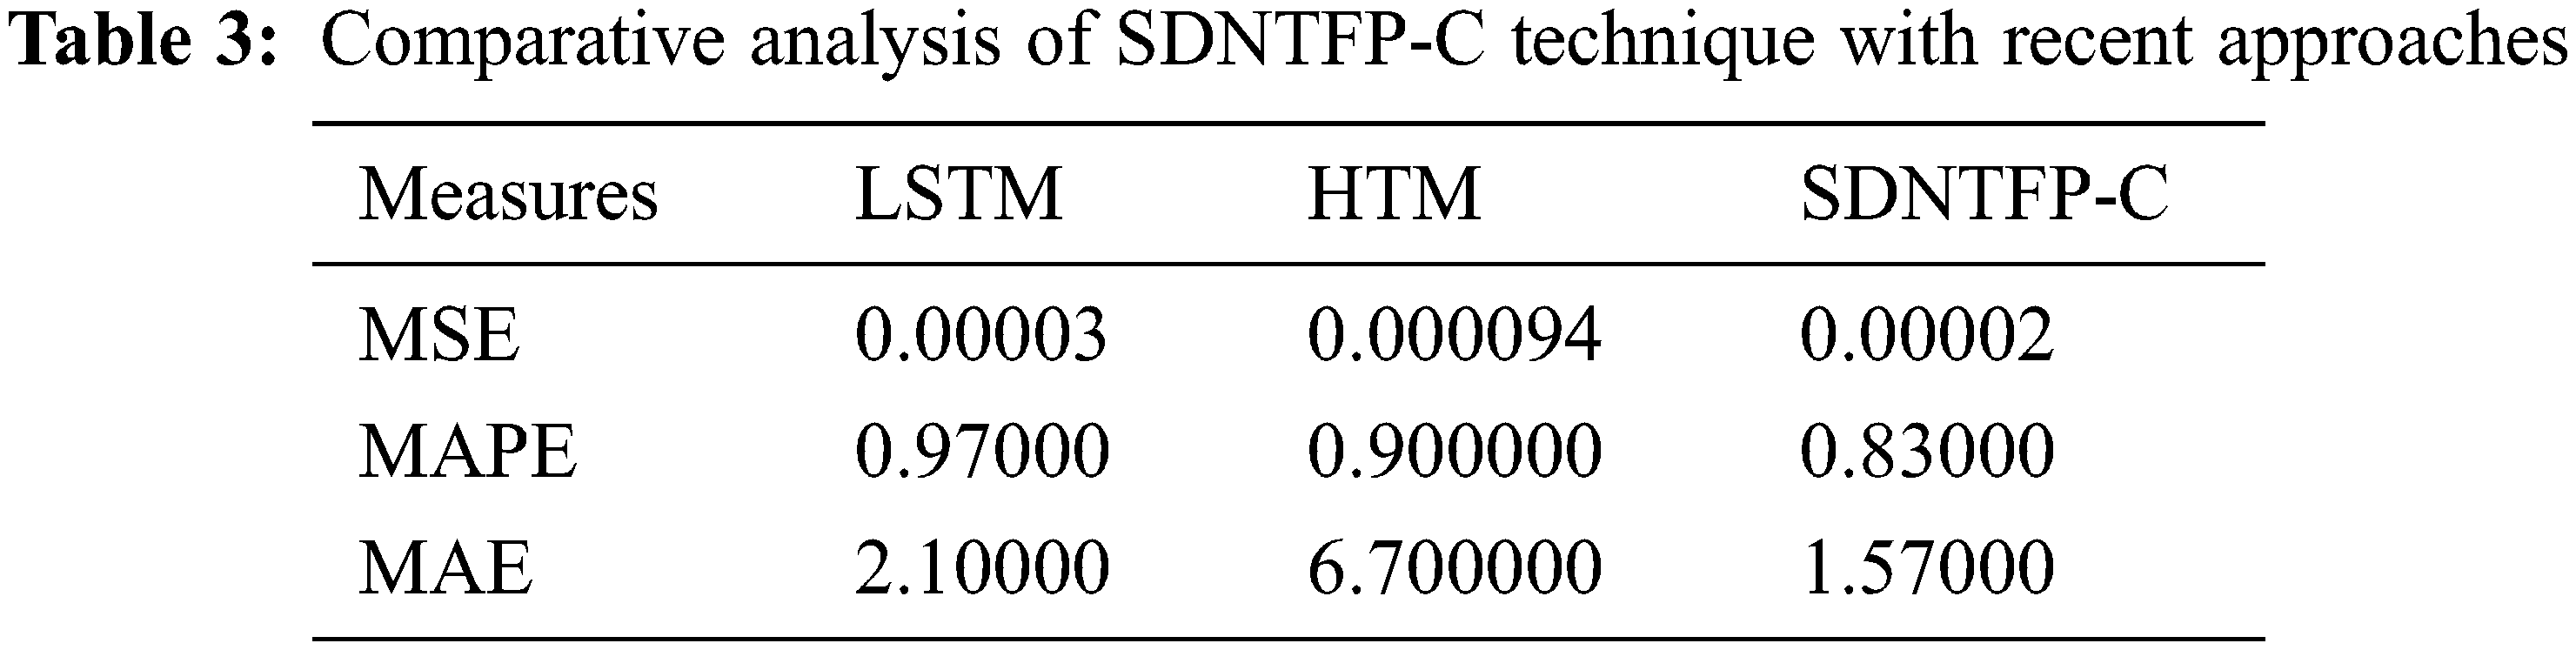
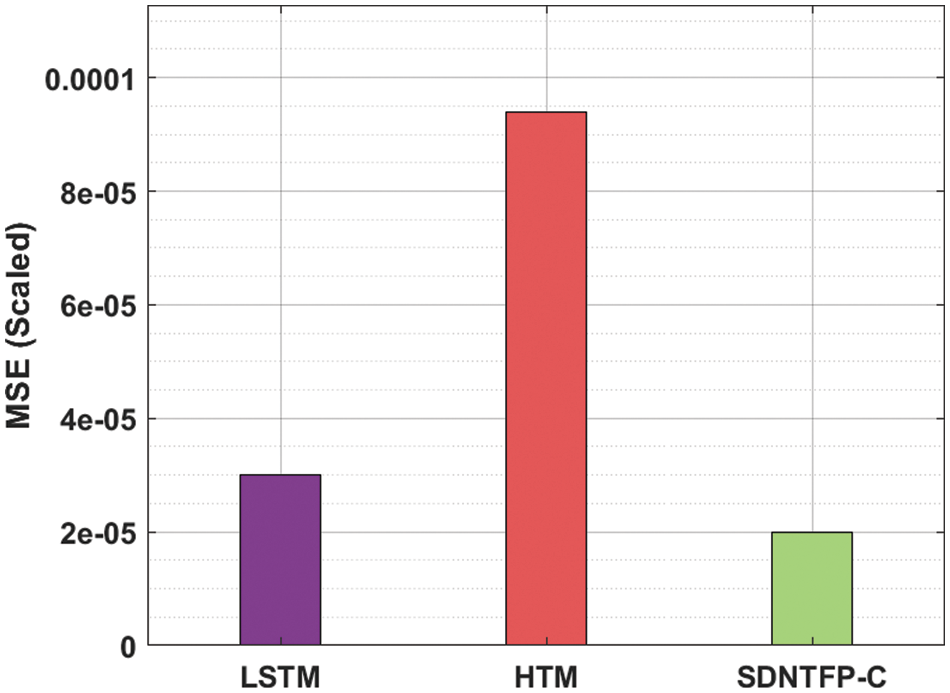
Figure 6: MSE analysis of SDNTFP-C technique with recent approaches
Fig. 7 examines the Mean Absolute Percentage Error (MAPE) inspection of the SDNTFP-C algorithm with recent methods. The figure exhibited that the HTM technique has outperformed the least performance with an increased MAPE of 0.900000. Also, the LSTM model has attained certainly a reduced MAPE of 0.97000. However, the SDNTFP-C model has outperformed the other existing algorithms by offering a lesser MAPE of 0.83000.
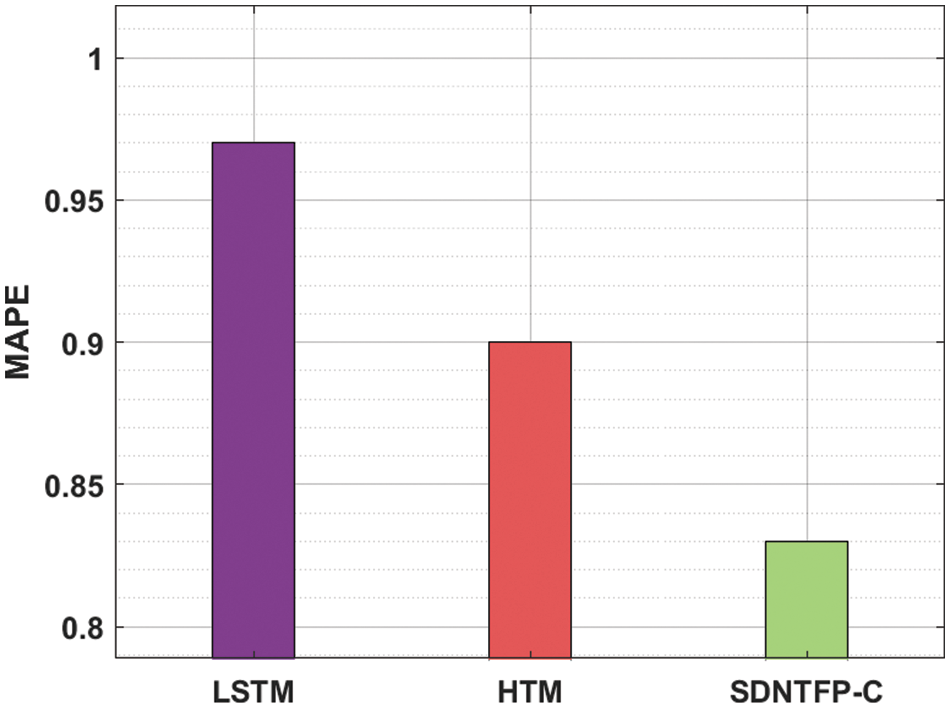
Figure 7: MAPE analysis of SDNTFP-C technique with recent approaches
Fig. 8 depicts the MAE inspection of the SDNTFP-C technique with recent methods. The figure demonstrated that the HTM approach has outperformed worse performance with the increased MAE of 6.700000. Besides, the LSTM technique has attained certainly reduced MAE of 2.10000. Finally, the SDNTFP-C model has demonstrated the other existing approaches by offering a reduced MAE of 1.57000. From the outcomes and discussion, it can be obvious that the SDNTFP-C model has able effectual performance over the other recent methods.
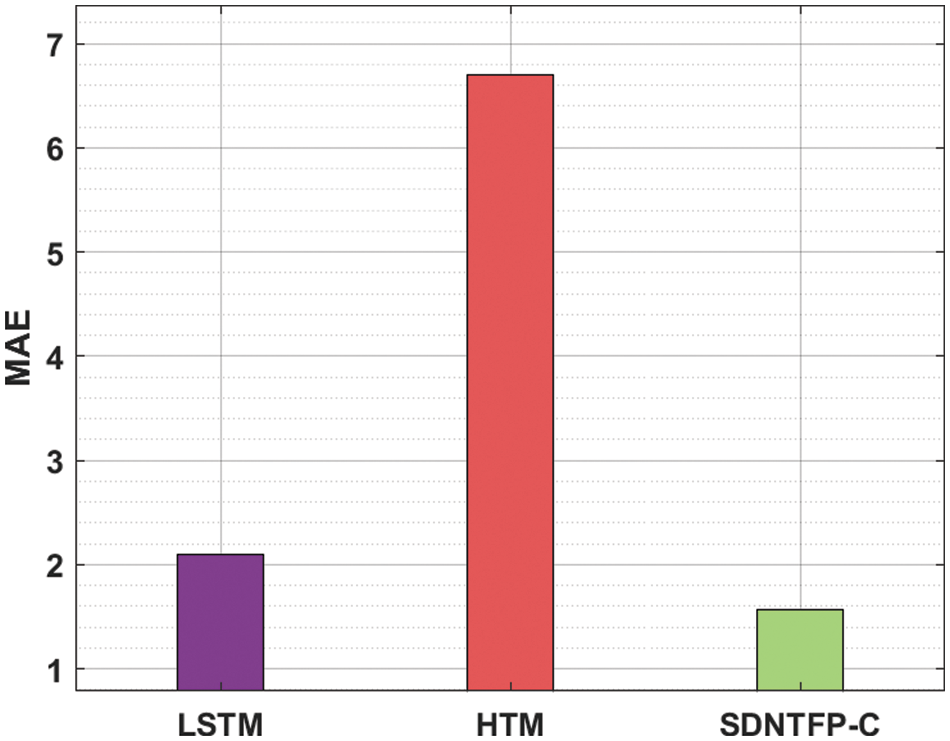
Figure 8: MAE analysis of SDNTFP-C technique with recent approaches
The SDNTFP-C technique was developed in this study for real-time traffic flow forecasting in clustered VANETs. The proposed SDNTFP-C approach consists of three primary processes: clustering via AOCA, prediction via HCNN-ABLSTM, and hyperparameter tuning using DOA. The suggested SDNTFP-C technique takes advantage of the SDN controller’s scalability, flexibility, and adaptability while including the DL models. To determine whether the SDNTFP-C approach improves outcomes, a rigorous comparison study with existing procedures is conducted. The experimental results analysis demonstrates that the offered strategy outperforms other previous approaches on a variety of evaluation metrics. In the future, the SDNTFP-C approach’s performance will be enhanced by the development of hybrid metaheuristics-based routing protocols for clustered VANETs.
Funding Statement: The authors received no specific funding for this study.
Conflicts of Interest: The authors declare that they have no conflicts of interest to report regarding the present study.
1. M. Chahal, S. Harit, K. K. Mishra, A. K. Sangaiah and Z. Zheng, “A survey on software-defined networking in vehicular ad hoc networks: Challenges, applications and use cases,” Sustainable Cities and Society, vol. 35, no. 4, pp. 830–840, 2017. [Google Scholar]
2. J. Bhatia, Y. Modi, S. Tanwar and M. Bhavsar, “Software defined vehicular networks: A comprehensive review,” International Journal of Communication Systems, vol. 32, no. 12, pp. e4005, 2019. [Google Scholar]
3. L. Zhao, G. Han, Z. Li and L. Shu, “Intelligent digital twin-based software-defined vehicular networks,” IEEE Network, vol. 34, no. 5, pp. 178–184, 2020. [Google Scholar]
4. J. Xie, F. R. Yu, T. Huang, R. Xie, J. Liu et al., “A survey of machine learning techniques applied to software defined networking (SDNResearch issues and challenges,” IEEE Communications Surveys & Tutorials, vol. 21, no. 1, pp. 393–430, 2018. [Google Scholar]
5. H. Trivedi, S. Tanwar and P. Thakkar, “Software defined network-based vehicular adhoc networks for intelligent transportation system: Recent advances and future challenges,” in Proc. Int. Conf. on Futuristic Trends in Network and Communication Technologies, Singapore, Springer, pp. 325–337, 2018. [Google Scholar]
6. H. Al Najada, I. Mahgoub and I. Mohammed, “Highway cluster density and average speed prediction in Vehicular Ad Hoc Networks (VANETs),” in Proc.2018 IEEE Symp. Series on Computational Intelligence (SSCI), Bangalore, India, pp. 96–103, 2018. [Google Scholar]
7. Z. Shu, J. Wan, J. Lin, S. Wang, D. Li et al., “Traffic engineering in software-defined networking: Measurement and management,” IEEE Access, vol. 4, pp. 3246–3256, 2016. [Google Scholar]
8. W. Qi, Q. Song, X. Wang, L. Guo and Z. Ning, “SDN-enabled social-aware clustering in 5G-VANET systems,” IEEE Access, vol. 6, pp. 28213–28224, 2018. [Google Scholar]
9. K. A. Darabkh, B. Z. Alkhader, K. Ala’F, F. Jubair and M. Abdel-Majeed, “ICDRP-F-SDVN: An innovative cluster-based dual-phase routing protocol using fog computing and software-defined vehicular network,” Vehicular Communications, vol. 34, no. 12, pp. 100453, 2022. [Google Scholar]
10. L. Zhao, Z. Bi, M. Lin, A. Hawbani, J. Shi et al., “An intelligent fuzzy-based routing scheme for software-defined vehicular networks,” Computer Networks, vol. 187, no. 2, pp. 107837–107856, 2021. [Google Scholar]
11. J. Bhatia, R. Dave, H. Bhayani, S. Tanwar and A. Nayyar, “SDN-based real-time urban traffic analysis in VANET environment,” Computer Communications, vol. 149, no. 3, pp. 162–175, 2020. [Google Scholar]
12. A. Nahar and D. Das, “SeScR: SDN-enabled spectral clustering-based optimized routing using deep learning in VANET environment,” in Proc. 19th Int. Symp. on Network Computing and Applications (NCA), Cambridge, MA, USA, IEEE, pp. 1–9, 2020. [Google Scholar]
13. S. Sanagavarapu and S. Sridhar, “SDPredictNet-A topology based SDN neural routing framework with traffic prediction analysis,” in Proc. 11th Annual Computing and Communication Workshop and Conf. (CCWCIEEE, NV, USA, IEEE, pp. 264–272, 2021. [Google Scholar]
14. A. Alioua, S. M. Senouci and S. Moussaoui, “dSDiVN: A distributed software-defined networking architecture for infrastructure-less vehicular networks,” in Proc. Int. Conf. on Innovations for Community Services, United States, Springer, Cham, pp. 56–67, 2017. [Google Scholar]
15. A. U. Khan and B. K. Ratha, “Time series prediction QoS routing in software defined vehicular ad-hoc network,” in Proc. 2015 Int. Conf. on Man and Machine Interfacing (MAMI), Bhubaneswar, India, pp. 1–6, 2015. [Google Scholar]
16. B. Dong, W. Wu, Z. Yang and J. Li, “Software defined networking based on-demand routing protocol in vehicle ad hoc networks,” in Proc. 12th Int. Conf. on Mobile Ad-Hoc and Sensor Networks (MSNIEEE, Hefei, China, pp. 207–213, 2016. [Google Scholar]
17. L. Abualigah, A. Diabat, S. Mirjalili, M. AbdElaziz and A. H. Gandomi, “The arithmetic optimization algorithm,” Computer Methods in Applied Mechanics and Engineering, vol. 376, no. 2, pp. 113609, 2021. [Google Scholar]
18. S. Khatir, S. Tiachacht, C. Le Thanh, E. Ghandourah, S. Mirjalili et al., “An improved artificial neural network using arithmetic optimization algorithm for damage assessment in FGM composite plates,” Composite Structures, vol. 273, no. 12, pp. 114287, 2021. [Google Scholar]
19. H. Zheng, F. Lin, X. Feng and Y. Chen, “A hybrid deep learning model with attention-based conv-LSTM networks for short-term traffic flow prediction,” IEEE Transactions on Intelligent Transportation Systems, vol. 22, no. 11, pp. 6910–6920, 2020. [Google Scholar]
20. A. K. Bairwa, S. Joshi and D. Singh, “Dingo optimizer: A nature-inspired metaheuristic approach for engineering problems,” Mathematical Problems in Engineering, vol. 2021, no. 2571863, pp. 1–12, 2021. [Google Scholar]
21. M. M. Althobaiti, “An intelligent cognitive computing based intrusion detection for industrial cyber-physical systems,” Measurement, vol. 186, no. 2, pp. 1–21, 2021. [Google Scholar]
22. N. O. Aljehane and R. F. Mansour, “Big data analytics with oppositional moth flame optimization based vehicular routing protocol for future smart cities,” Expert Systems, vol. 12718, pp. 1–18, 2021. [Google Scholar]
 | This work is licensed under a Creative Commons Attribution 4.0 International License, which permits unrestricted use, distribution, and reproduction in any medium, provided the original work is properly cited. |