DOI:10.32604/iasc.2023.028835
| Intelligent Automation & Soft Computing DOI:10.32604/iasc.2023.028835 | |
| Article |
Implementation of FPGA Based MPPT Techniques for Grid-Connected PV System
Department of Electrical and Electronics Engineering, Coimbatore Institute of Technology, Coimbatore, India
*Corresponding Author: Thamatapu Eswara Rao. Email: eswararao@cit.edu.in
Received: 18 February 2022; Accepted: 06 April 2022
Abstract: Global energy demand is growing rapidly owing to industrial growth and urbanization. Alternative energy sources are driven by limited reserves and rapid depletion of conventional energy sources (e.g., fossil fuels).Solar photovoltaic (PV), as a source of electricity, has grown in popularity over the last few decades because of their clean, noise-free, low-maintenance, and abundant availability of solar energy. There are two types of maximum power point tracking (MPPT) techniques: classical and evolutionary algorithm-based techniques. Precise and less complex perturb and observe (P&O) and incremental conductance (INC) approaches are extensively employed among classical techniques. This study used a field-programmable gate array (FPGA)-based hardware arrangement for a grid-connected photovoltaic (PV) system. The PV panels, MPPT controllers, and battery management systems are all components of the proposed system. In the developed hardware prototype, various modes of operation of the grid-connected PV system were examined using P&O and incremental conductance MPPT approaches.
Keywords: Grid connected PV system; perturb and observe (P&O); incremental MPPT; boost converter; battery
The demand for electrical energy has rapidly increased in the current scenario. The main problems associated with conventional energy sources (coal, nuclear, and gas plants) are pollution and the effect of greenhouse gases. An alternative solution to these problems and meeting requests is the use of non-conventional energy sources [1]. Renewable energy sources include solar, wind, fuel, hydropower and geothermal. Compared with all energy sources, photovoltaic (PV) systems play a key role in current distributed energy sources [2]. Photovoltaic (PV) systems are an important energy sources. Generally, renewable energy sources are pollution-free energy sources. The effectiveness of a PV system is affected by the efficiency of the PV panel and inverter. An efficiency improvement in photovoltaic power conversion using maximum power point tracking (MPPT) algorithms is required [3]. The MPPT is predicted by the PV cell output voltage regulation. The internal and load resistances must be equal to obtain the maximum output power of the PV array, which can be determined by controlling the duty cycle of the boost converter in the proposed system. The reference signal required for the direct current-direct current (DC-DC) converter was generated using the MPPT controller. There are different ways to maximize the PV system power, ranging from basic voltage relationships to complex sample-based analyses. Power conversion systems need to evaluate different options based on the applications and dynamics of irradiance. Common renewable energy sources include solar and wind energies with variable output characteristics [4]. This is because of the variability in atmospheric conditions such as changes in humidity, temperature, and pressure due to rain. Hence, batteries are normally used to store energy, which helps provide constant output from renewable energy sources.
2 Grid-Connected Photovoltaic System
The general concept of a grid-connected PV system is based on the use of solar panels. A direct current (DC) source was connected to the grid with a boost converter, a battery with a bidirectional buck-boost converter and a voltage source converter (VSC). The voltage produced by the solar panel is not constant because of changing climatic conditions [5]. The MPPT controller is used in the proposed system to generate maximum power, as shown in Fig. 1. MPPT techniques have been applied to each stage to improve the PV power [6].The most important point is that the voltage-source converter stage instantaneous current control technique is used to eliminate the harmonics.
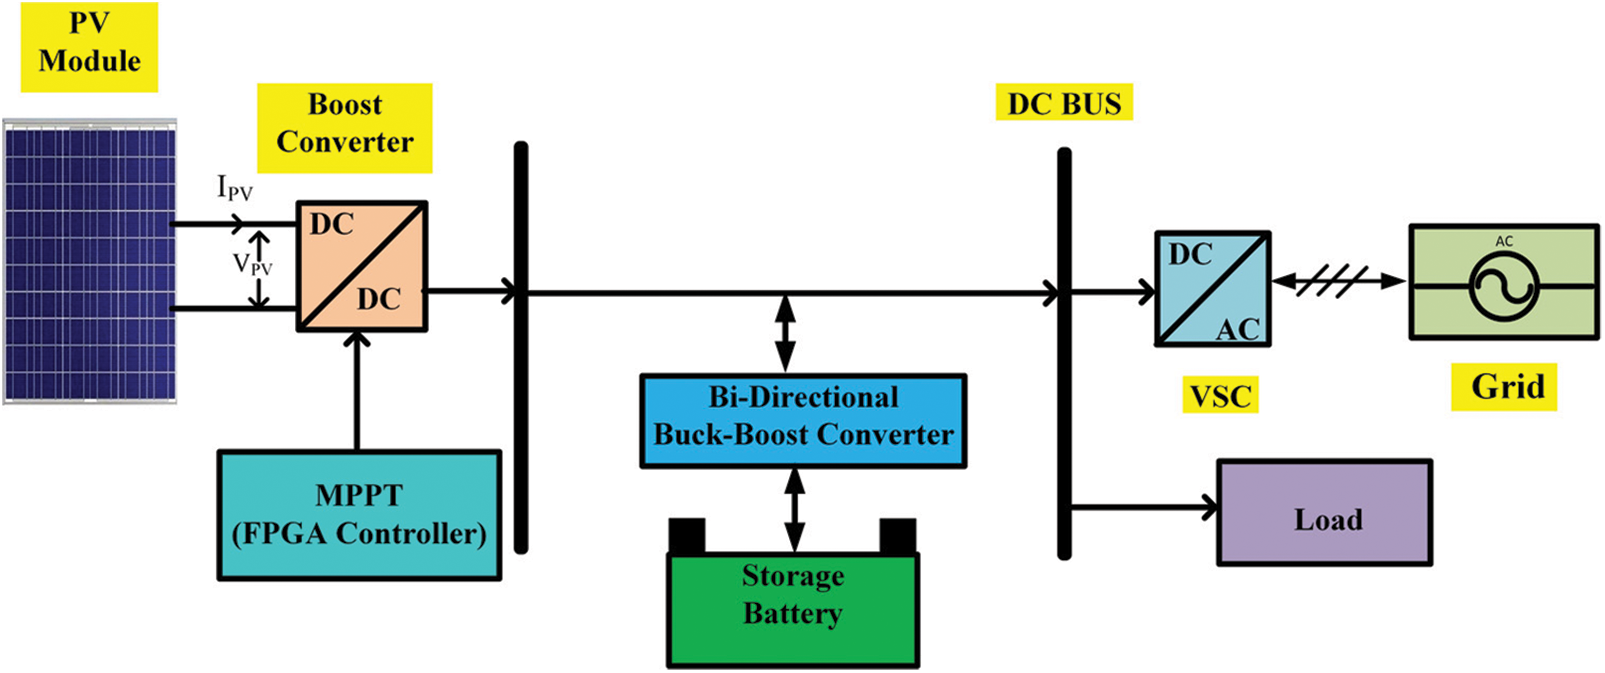
Figure 1: System architecture of proposed PV grid-connected system
2.1 Modeling of Solar Photovoltaic Cell
Solar energy is directly converted to electricity by a PV system, which has no negative impact on the environment. A PV cell, which is a simple P-N intersection device, is the most basic segment of a PV array. Fig. 2 depicts the electrical circuit of the solar cell. The circuit has a current source (photon flow), which is represented in (2), and the diode is parallel to it. The resistor is in series, which defines the internal resistance to the current flow and shunt resistance, which expresses the leakage current [7]. The current delivered to the load can be stated in (1).
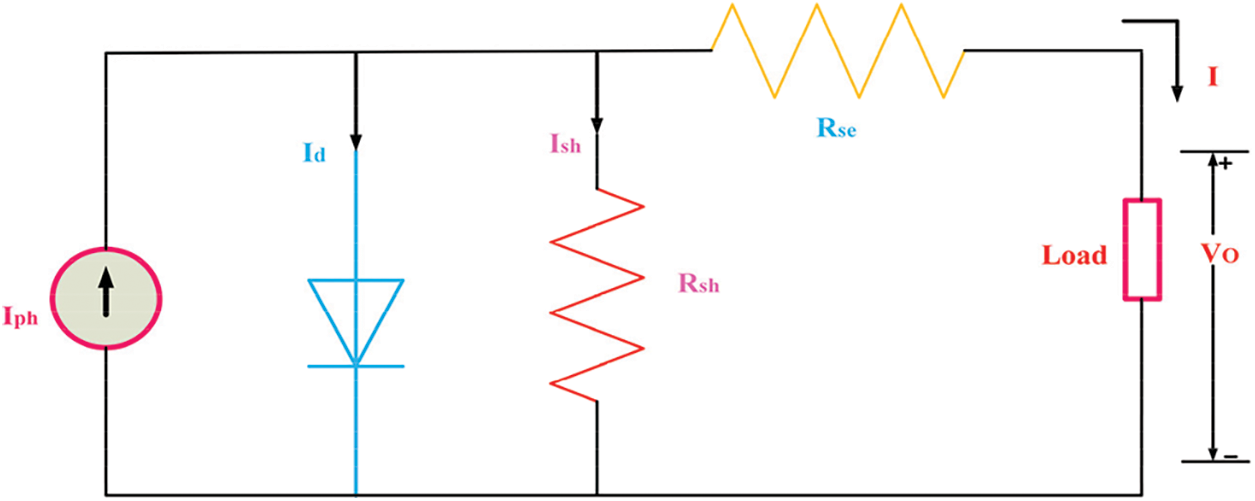
Figure 2: Electrical equivalent circuit of solar cell
As the total power produced by a single PV cell is extremely low, we used a combination of PV cells to satisfy the desired requirements [8].
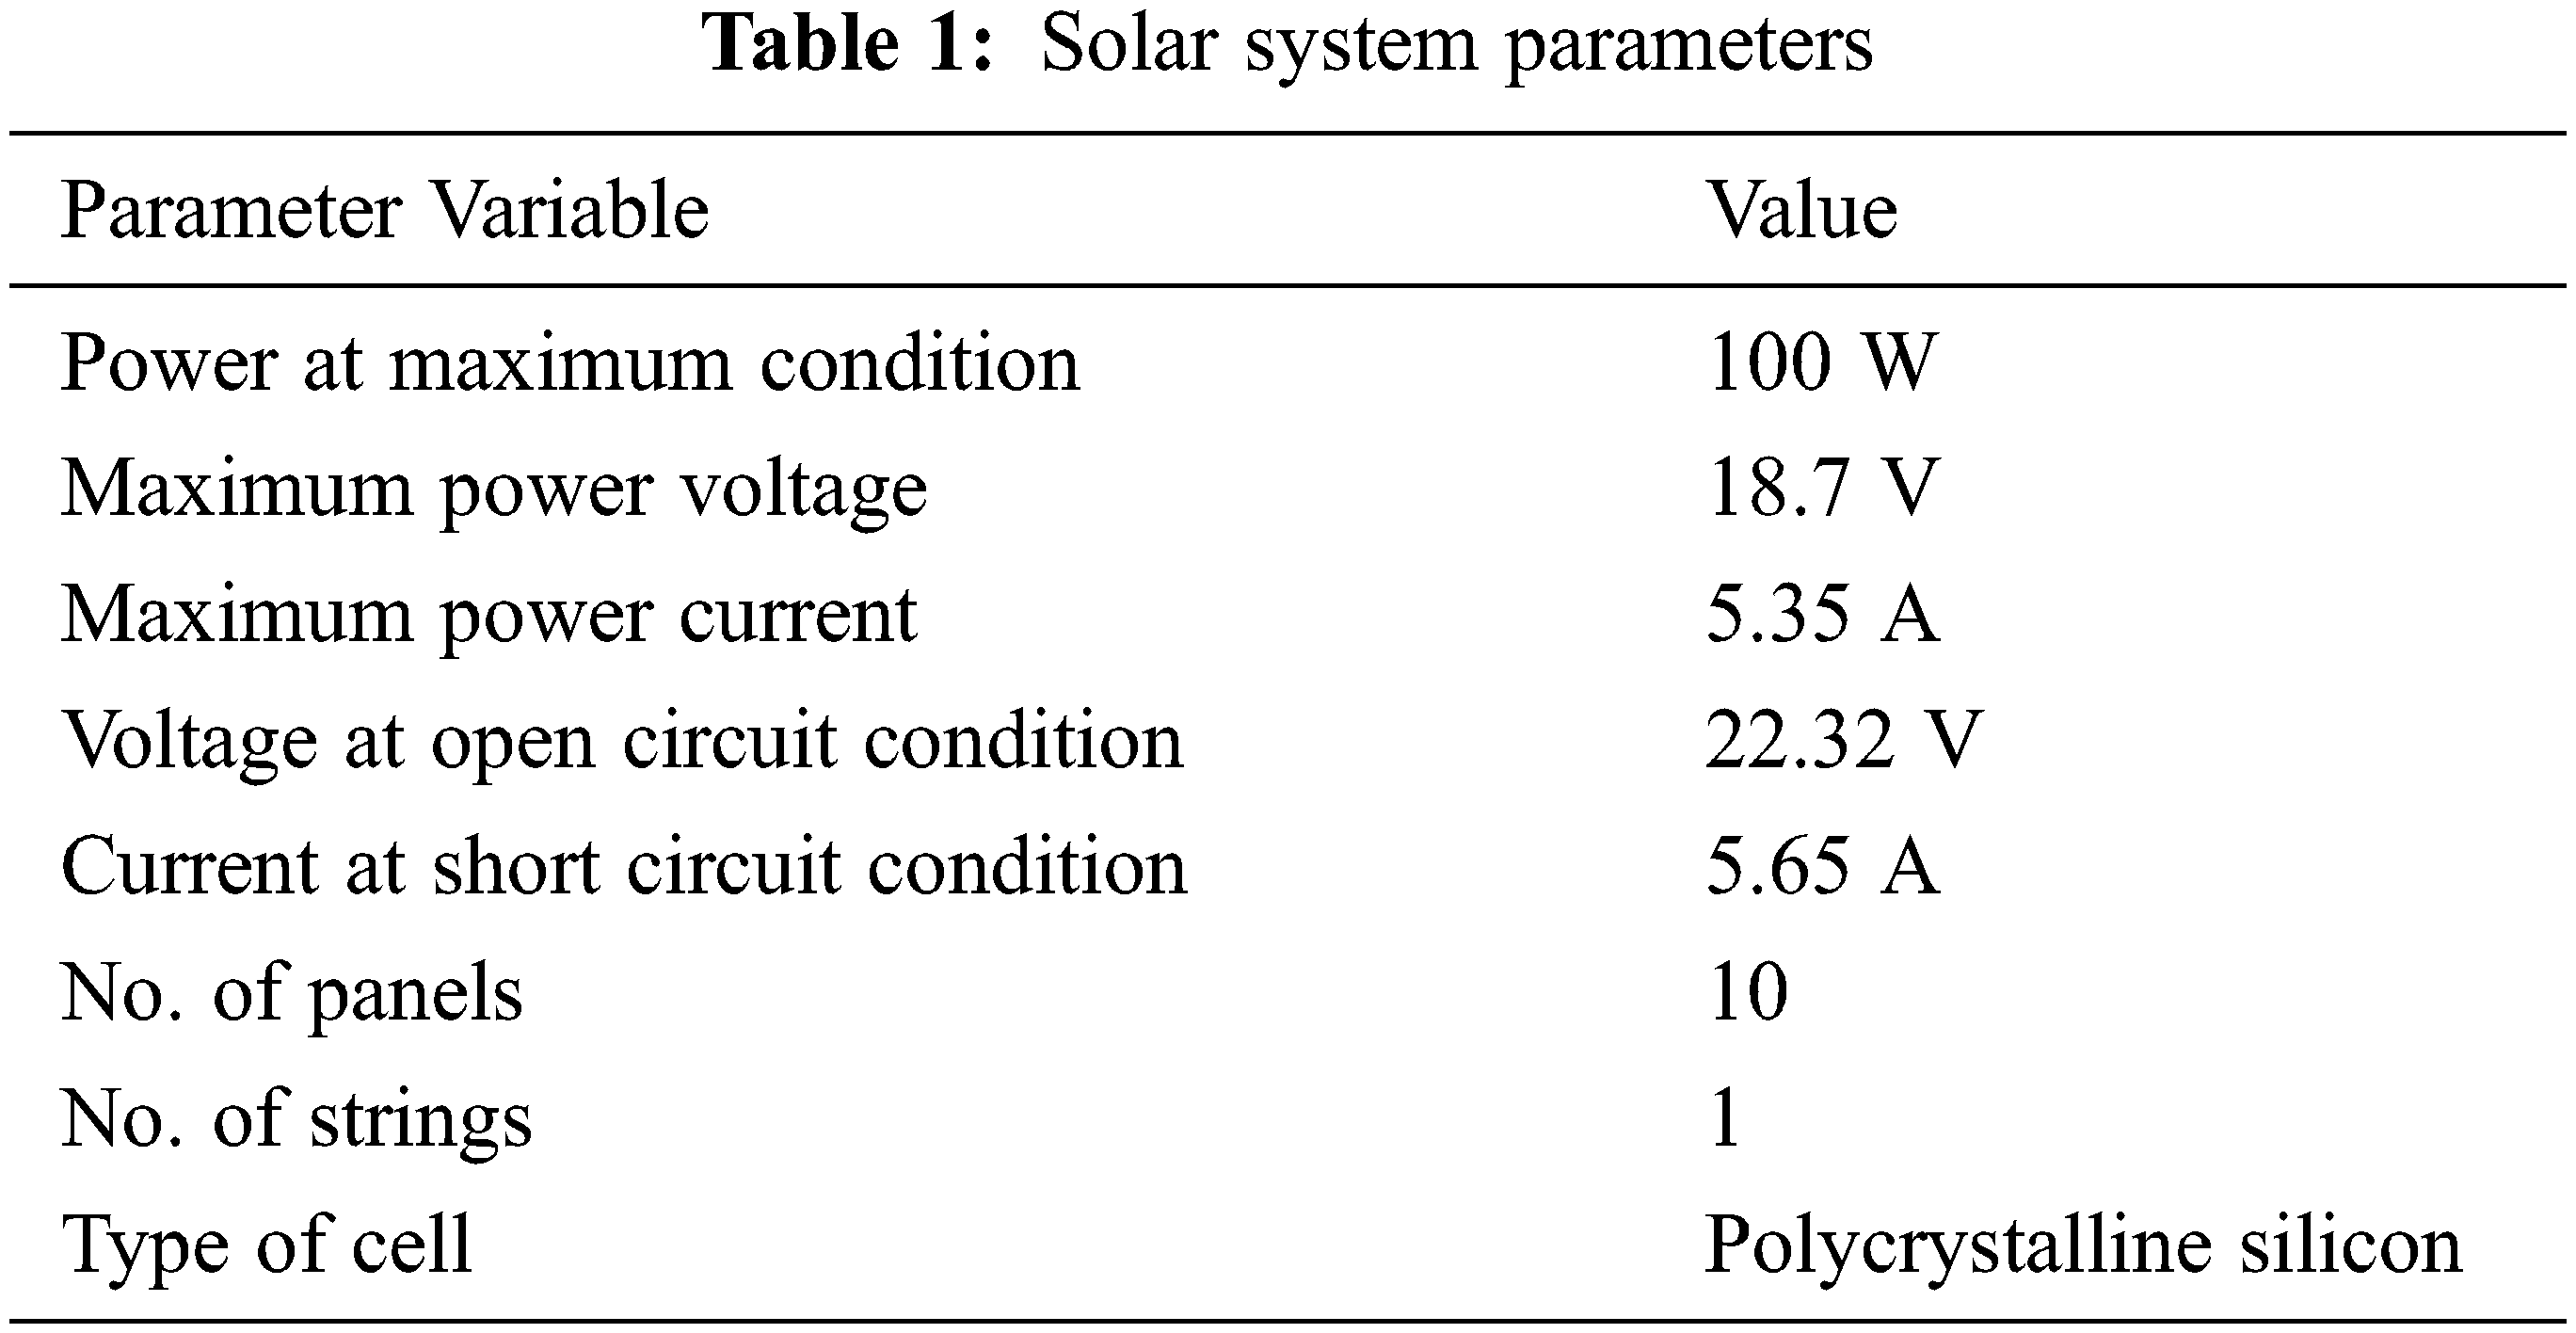
Small changes in the series resistance can affect the PV cell efficiency; however, variations in the shunt resistance do not. The shunt resistance is considered infinite for very small leakage currents to the ground, and can be treated as open. The power-voltage (P-V) and current-voltage (I-V) characteristics of the PV module are shown in Fig. 3 and the PV system parameters are listed in Tab. 1.
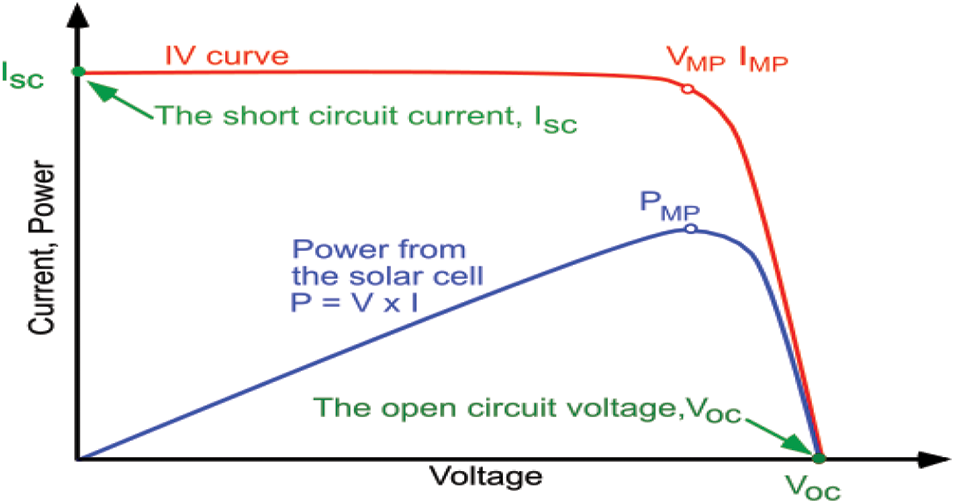
Figure 3: P-V & I-V characteristics of solar system
A DC-DC converter is an electronic circuit that changes the direct current (DC) source at one voltage level. This is a power converter class and is similar to a transformer in the source of alternating current (AC).It can step over the voltage level up or down. Various types of DC-DC converters can change the voltage level according to supply availability and load requirements [9,10].
The maximum power can be stated as shown in (3).
The boost converter function increases the voltage level and saves energy during switching [11]. During the off period of the switching element, the inductor energy disappears in the load shared with the supply [12,13].The ratio of the load-side voltage to the source-side voltage is called the switching-device assignment ratio.The boost converter specifications are listed in Tab. 2 and the hardware implementation of the boost converter is illustrated in Fig. 4.

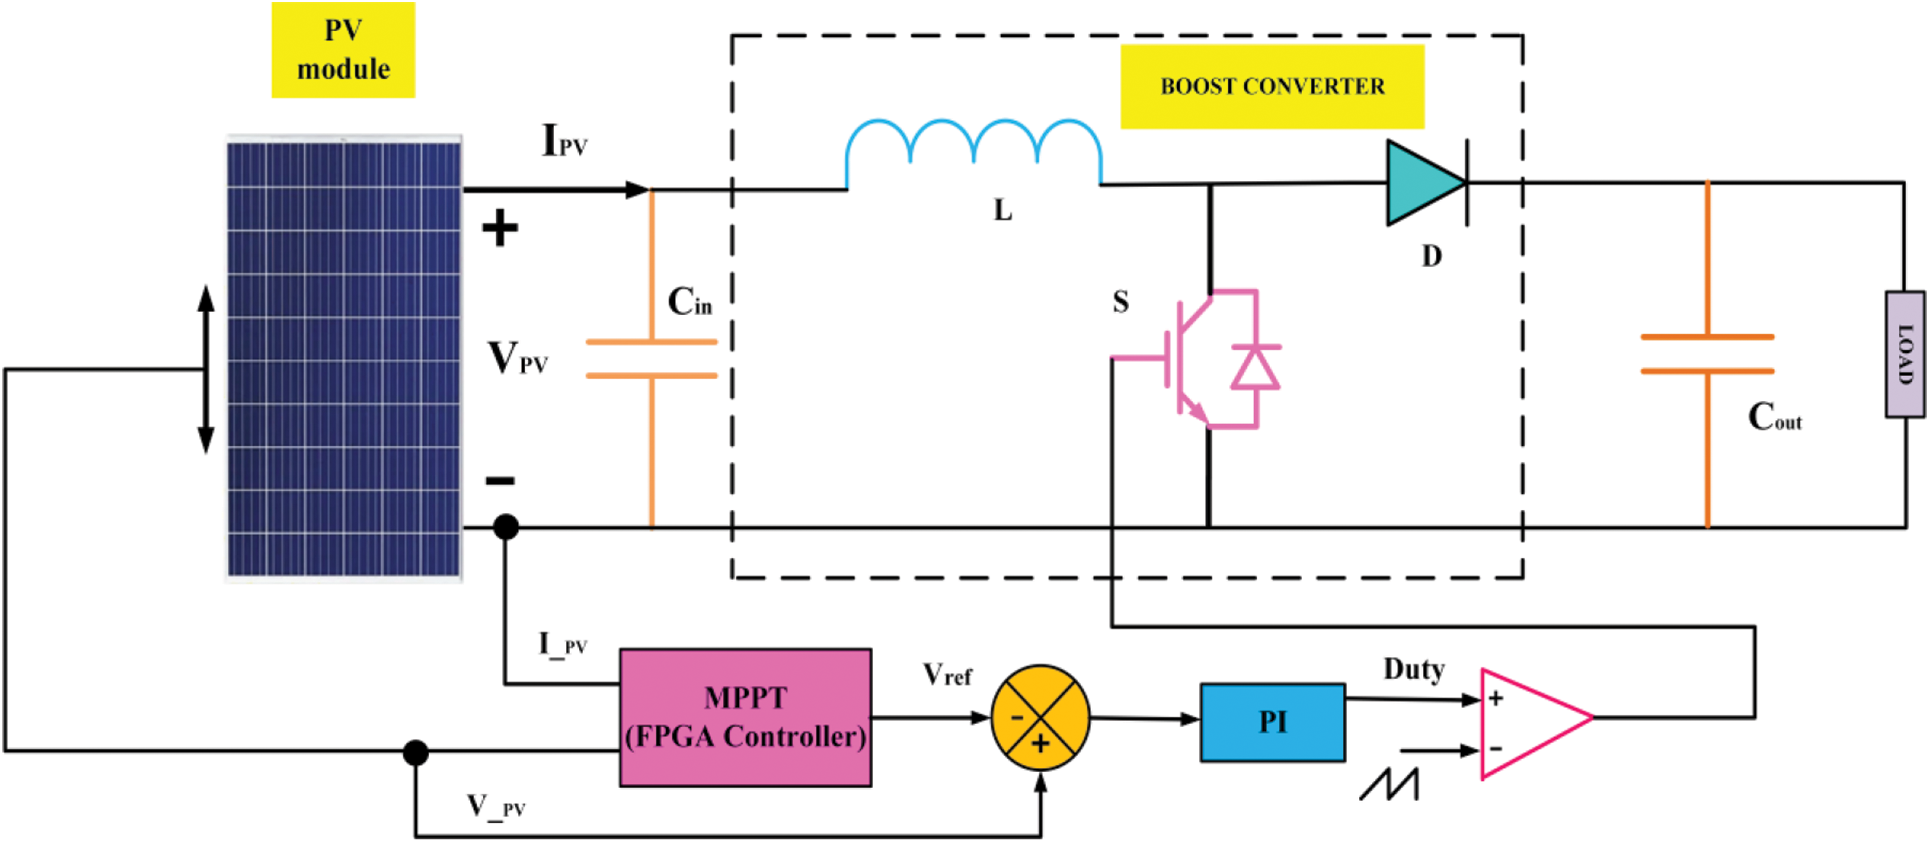
Figure 4: Hardware implementation for boost converter
Insulated-gate bipolar transistors (IGBTs), inductors, capacitors, field-programmable gate array (FPGA) controllers, IGBT driver circuits, voltage, and current sensors are among the components used in boost converter [14,15]. The voltage and current sensors sense the voltage and current, respectively, which are then fed into the FPGA controller and dumped using the MPPT algorithm. The duty cycle of the IGBT was adjusted using this algorithm to obtain the most power from the solar panel [16,17].
Typical optimization problems minimize or maximize objective functions that depend on complex and nonlinear characteristics with severe equality constraints. Because of this complexity, the controller design is suitable for completion through optimization algorithms. Electronic design through optimization algorithms is an established research field and promises to provide optimal solutions for high-complexity designs. In this study, two different MPPT algorithms are used for the maximum power tracking of a solar panel.
4.1 Field-Programmable Gate Array (FPGA) Controller
A field-programmable gate array (FPGA) controller was used in a grid-connected photovoltaic system to sense the voltage and current of the PV panel from the sensors and compare them with the actual reference values. The necessary action will be taken in the form of a gate pulse applied to the IGBT/metal oxide semiconductor field effect transistor (MOSFET) of the boost converter. As illustrated in Fig. 5, MPPT algorithms were built using an FPGA SPARTAN6 controller (SP6 LX9 Rev-1.0). The Xilinx Spartan-6 FPGA [18,19] is featured on SP6, an easy-to-use FPGA development board. It was designed for experimenting with FPGAs and researching system design. The Xilinx XC6SLX9 FPGA on this development board has a maximum of 100 user input and outputs.
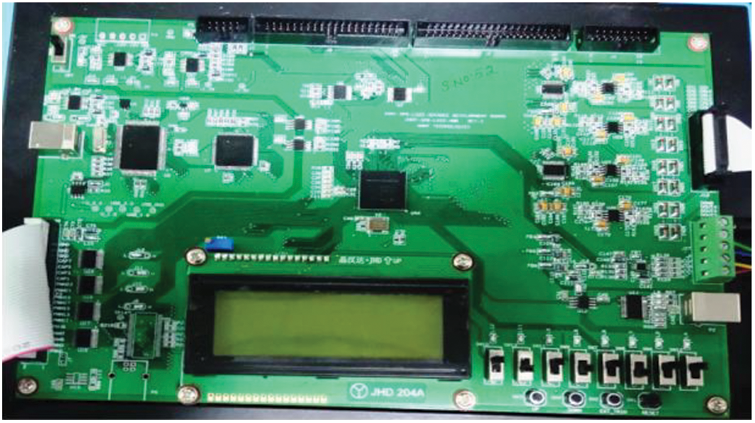
Figure 5: SPARTAN6 FPGA controller
4.2 Perturb and Observe Algorithm
Panel tracking involves placing a panel on a mount following the sun. It optimizes the output by following the sun across the sky to maximize the sunlight. This usually results in a 15% increase in winter and 35% increase in summer [20].The MPPT uses electronic tracking, which is typically digital. The controller looks at the output of the panel and compares it with the actual output [21]. You usually obtain a power increase of 20%–45% in summer and 10%–15% in winter [22]. Actual benefits can vary depending on the weather, temperature, battery conditions, and other factors. The tie-grid system has become popular because the price of the sun drops and electricity rates increase. Several brands of grid ties (i.e., no batteries) are available. All of these were built on MPPT [23].
Description:
The MPPT technique was used in the PV system to maximize the output power by tracking the continuous maximum temperature of the panel and irradiance representation of the P&O flow graphics, as shown in Fig. 6.
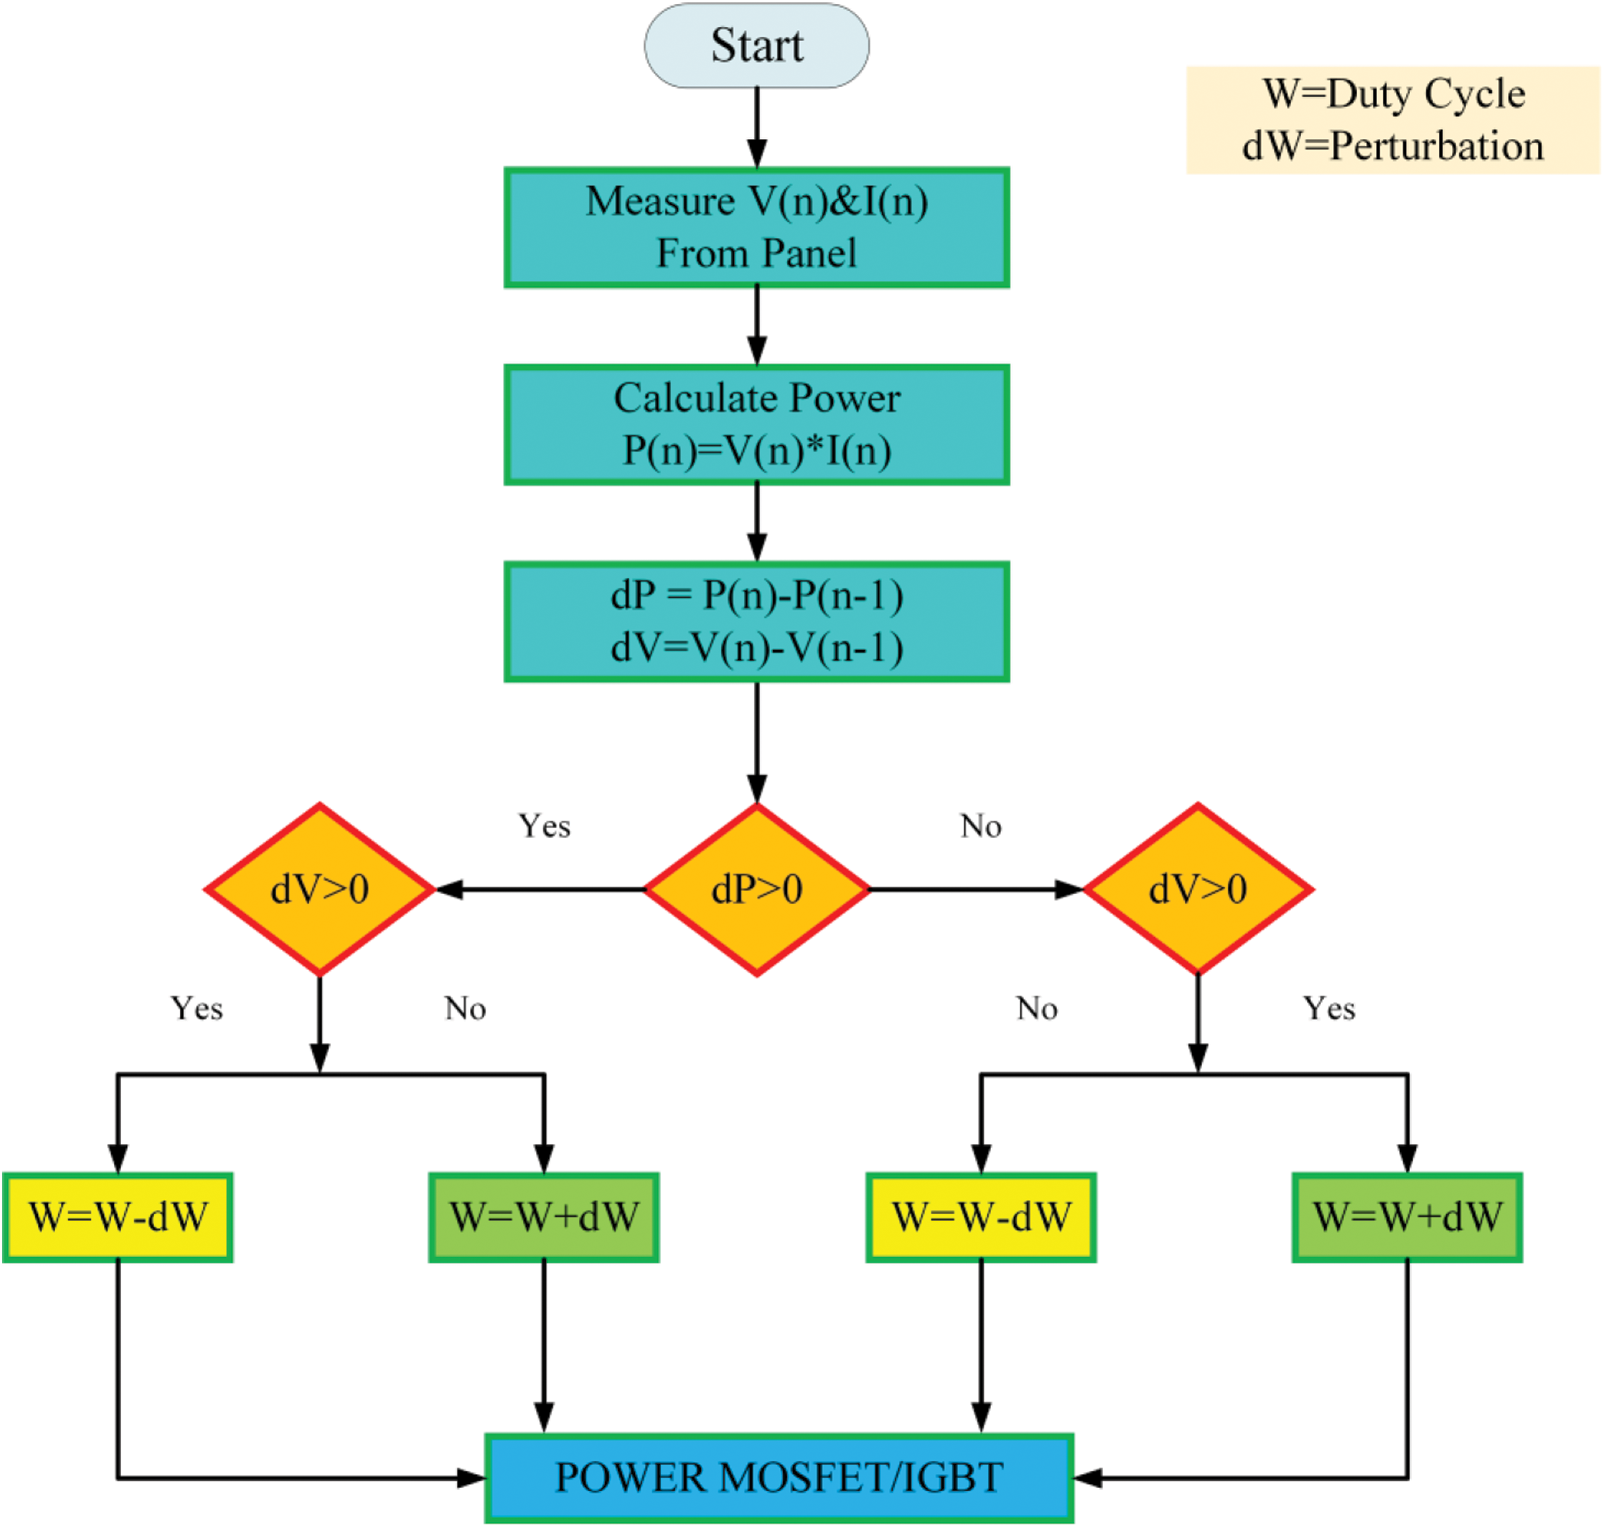
Figure 6: Flowchart of perturb & observe MPPT
STEP: 1 Measuring Voltage and Current
In this step, the voltage and current of the solar panel were measured, and the reference values of the voltage and current were set to a certain value.
STEP: 2 Estimation of Power
In this step, the power of the solar panel was estimated by multiplying the measured voltage and current.
STEP: 3 Difference with a reference value
In this step, the voltage and power value differences from the reference value are estimates of the metal oxide semiconductor field effect transistor (MOSFET)/IGBT.
STEP: 4 Differentiation of Power
In this step, two steps are executed based on the differentiated value of the power [24,25]. If the power differentiation is less than zero and if the voltage differentiation is less than zero, the duty cycle difference and addition are applied to the gate pulse of the MOSFET/IGBT.
4.3 Incremental Conductance Algorithm
To attain the maximum power point, this approach uses the current derivative slope in conjunction with voltage [26]. To achieve the maximum efficiency, the PV array must be modified. Maximum power point tracking techniques have been developed and are frequently utilised in systems, such as the method of mining observation and incremental conductance. Fig. 7 shows the incremental conductance flow diagram. Because of its simplicity and precision, the method of perturbation observation was used in this study for a PV array. The method begins with determining the initial reference voltage [27]. The two systems output powers were compared.
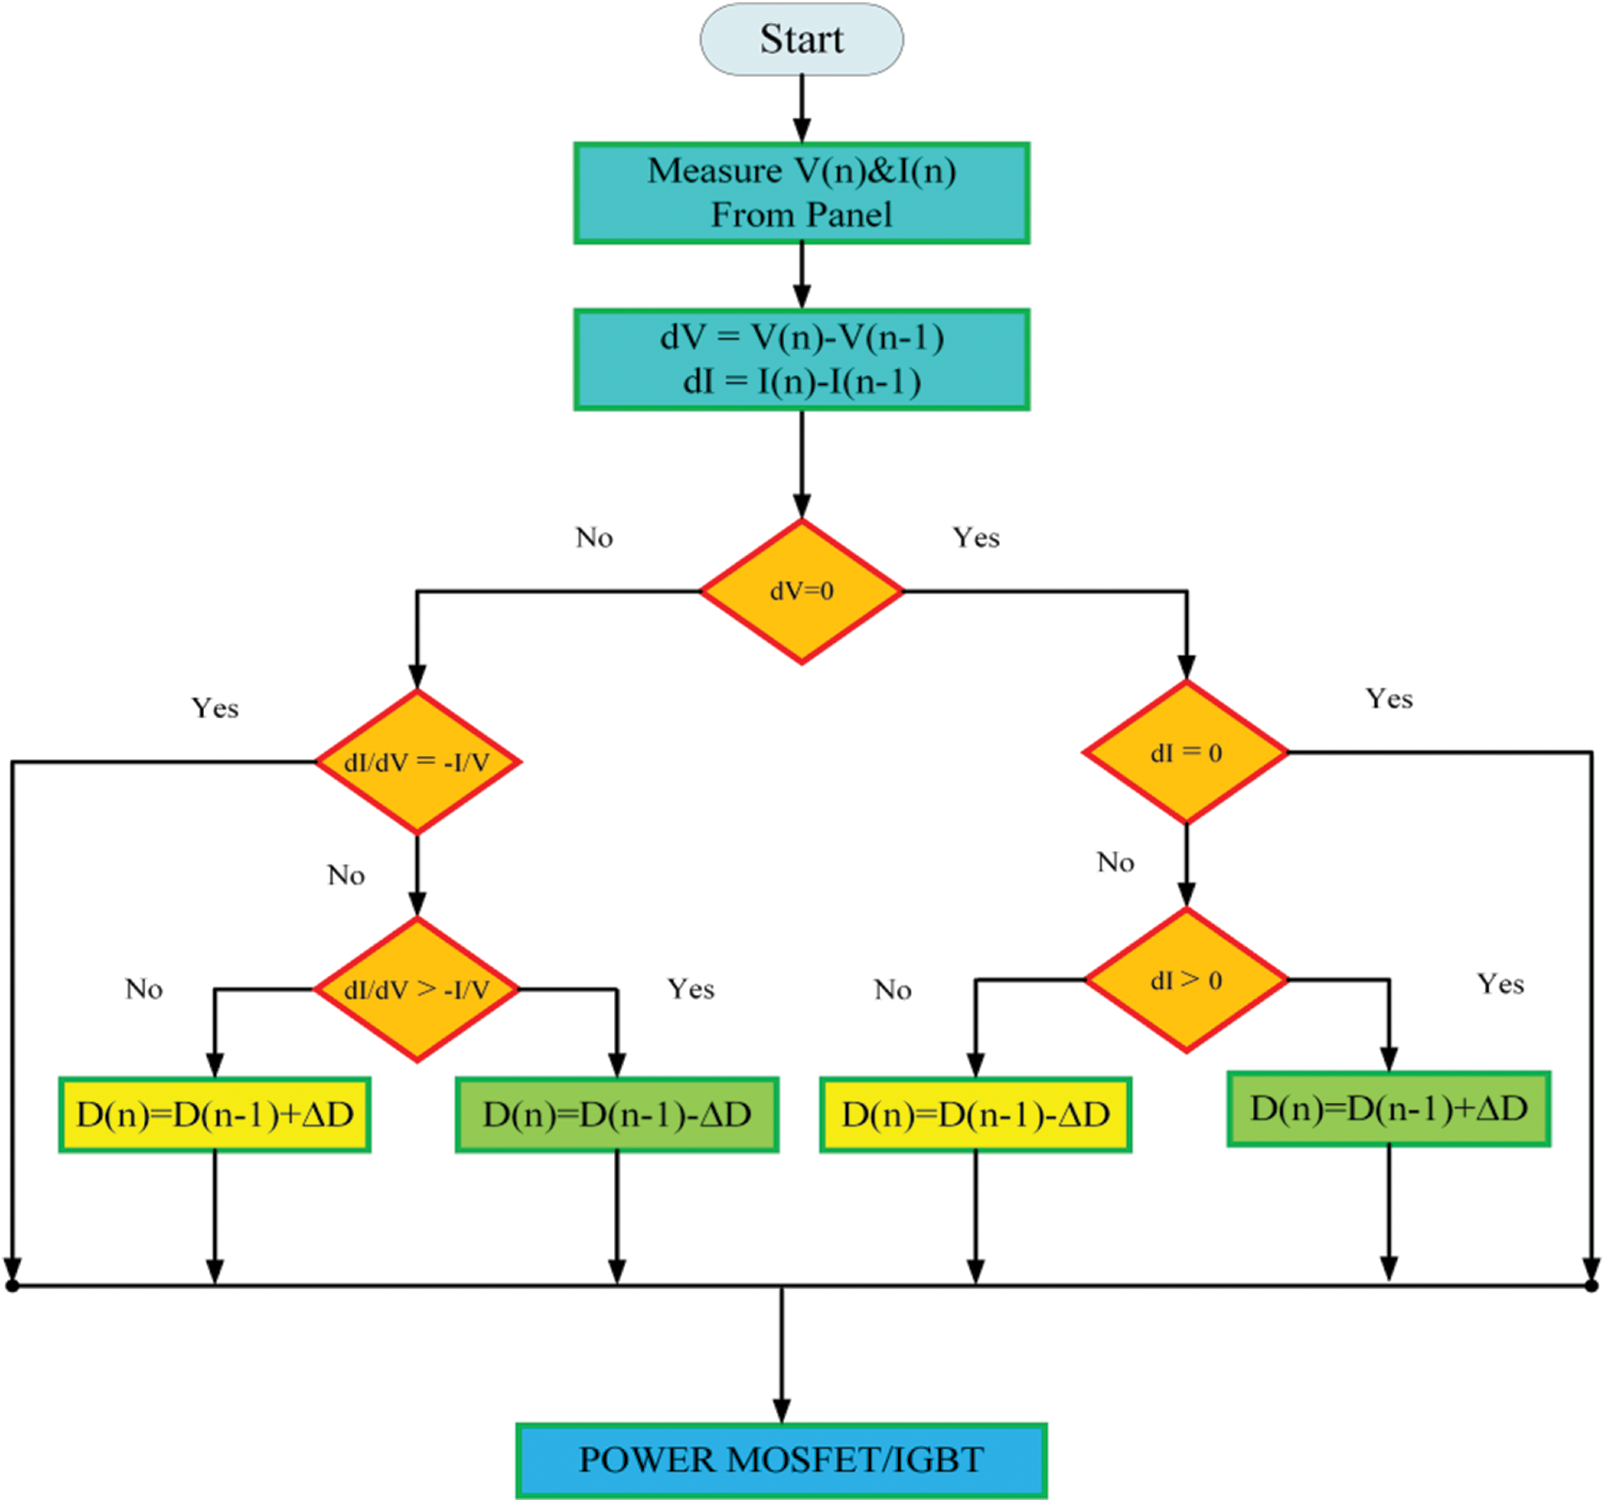
Figure 7: Flowchart of incremental conductance MPPT
4.4 Instantaneous Current Control Technique
The harmonic distortion of the grid current can be reduced using an instantaneous current control technique incorporated in a voltage source converter (VSC) [28]. The reference compensator current was obtained by subtracting the reference supply current from the load current, as shown in Fig. 8. The PWM current controller signal was obtained by subtracting the reference compensator current from the sensed compensator current. From the output of the pulse width modulation (PWM) current controller, that is, switching signals given to the firing angle of the voltage source converter in the grid-connected PV system, no shunt active filter is used for harmonic reduction; however, the technique of instantaneous current control is implemented to generate the firing angle of a VSC to reduce the total harmonic distortion of the grid current [29,30].
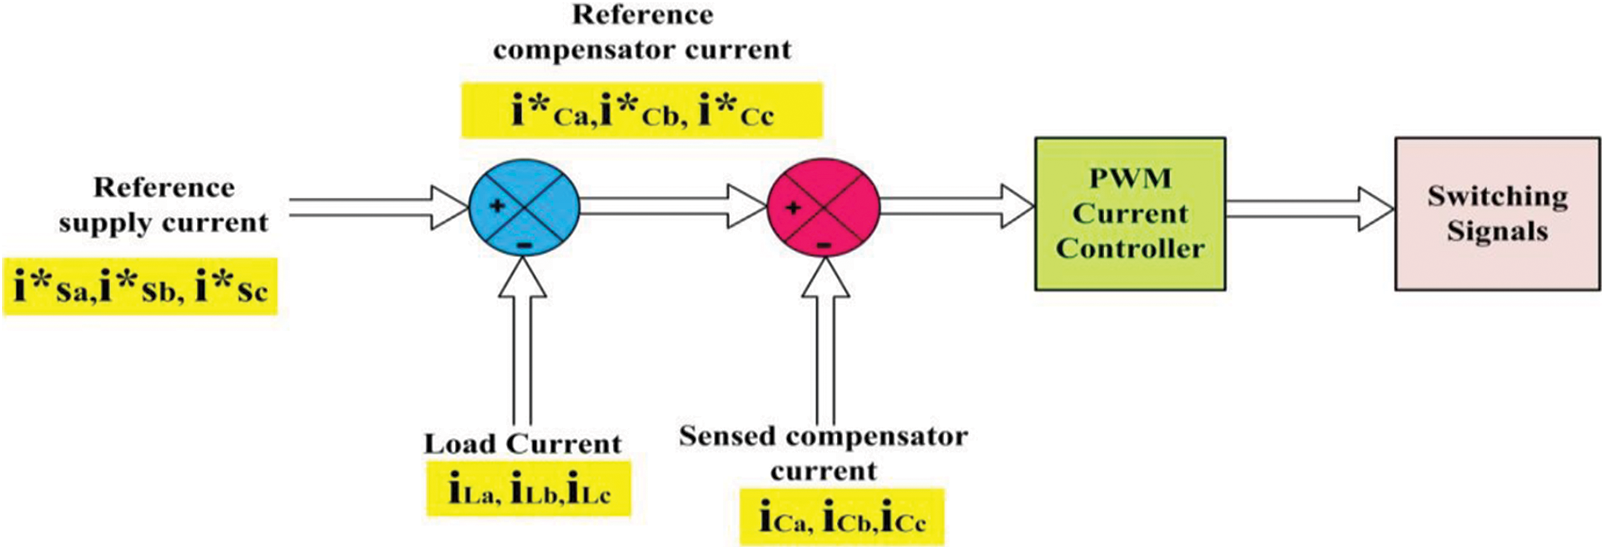
Figure 8: Basic structure of instantaneous current control technique
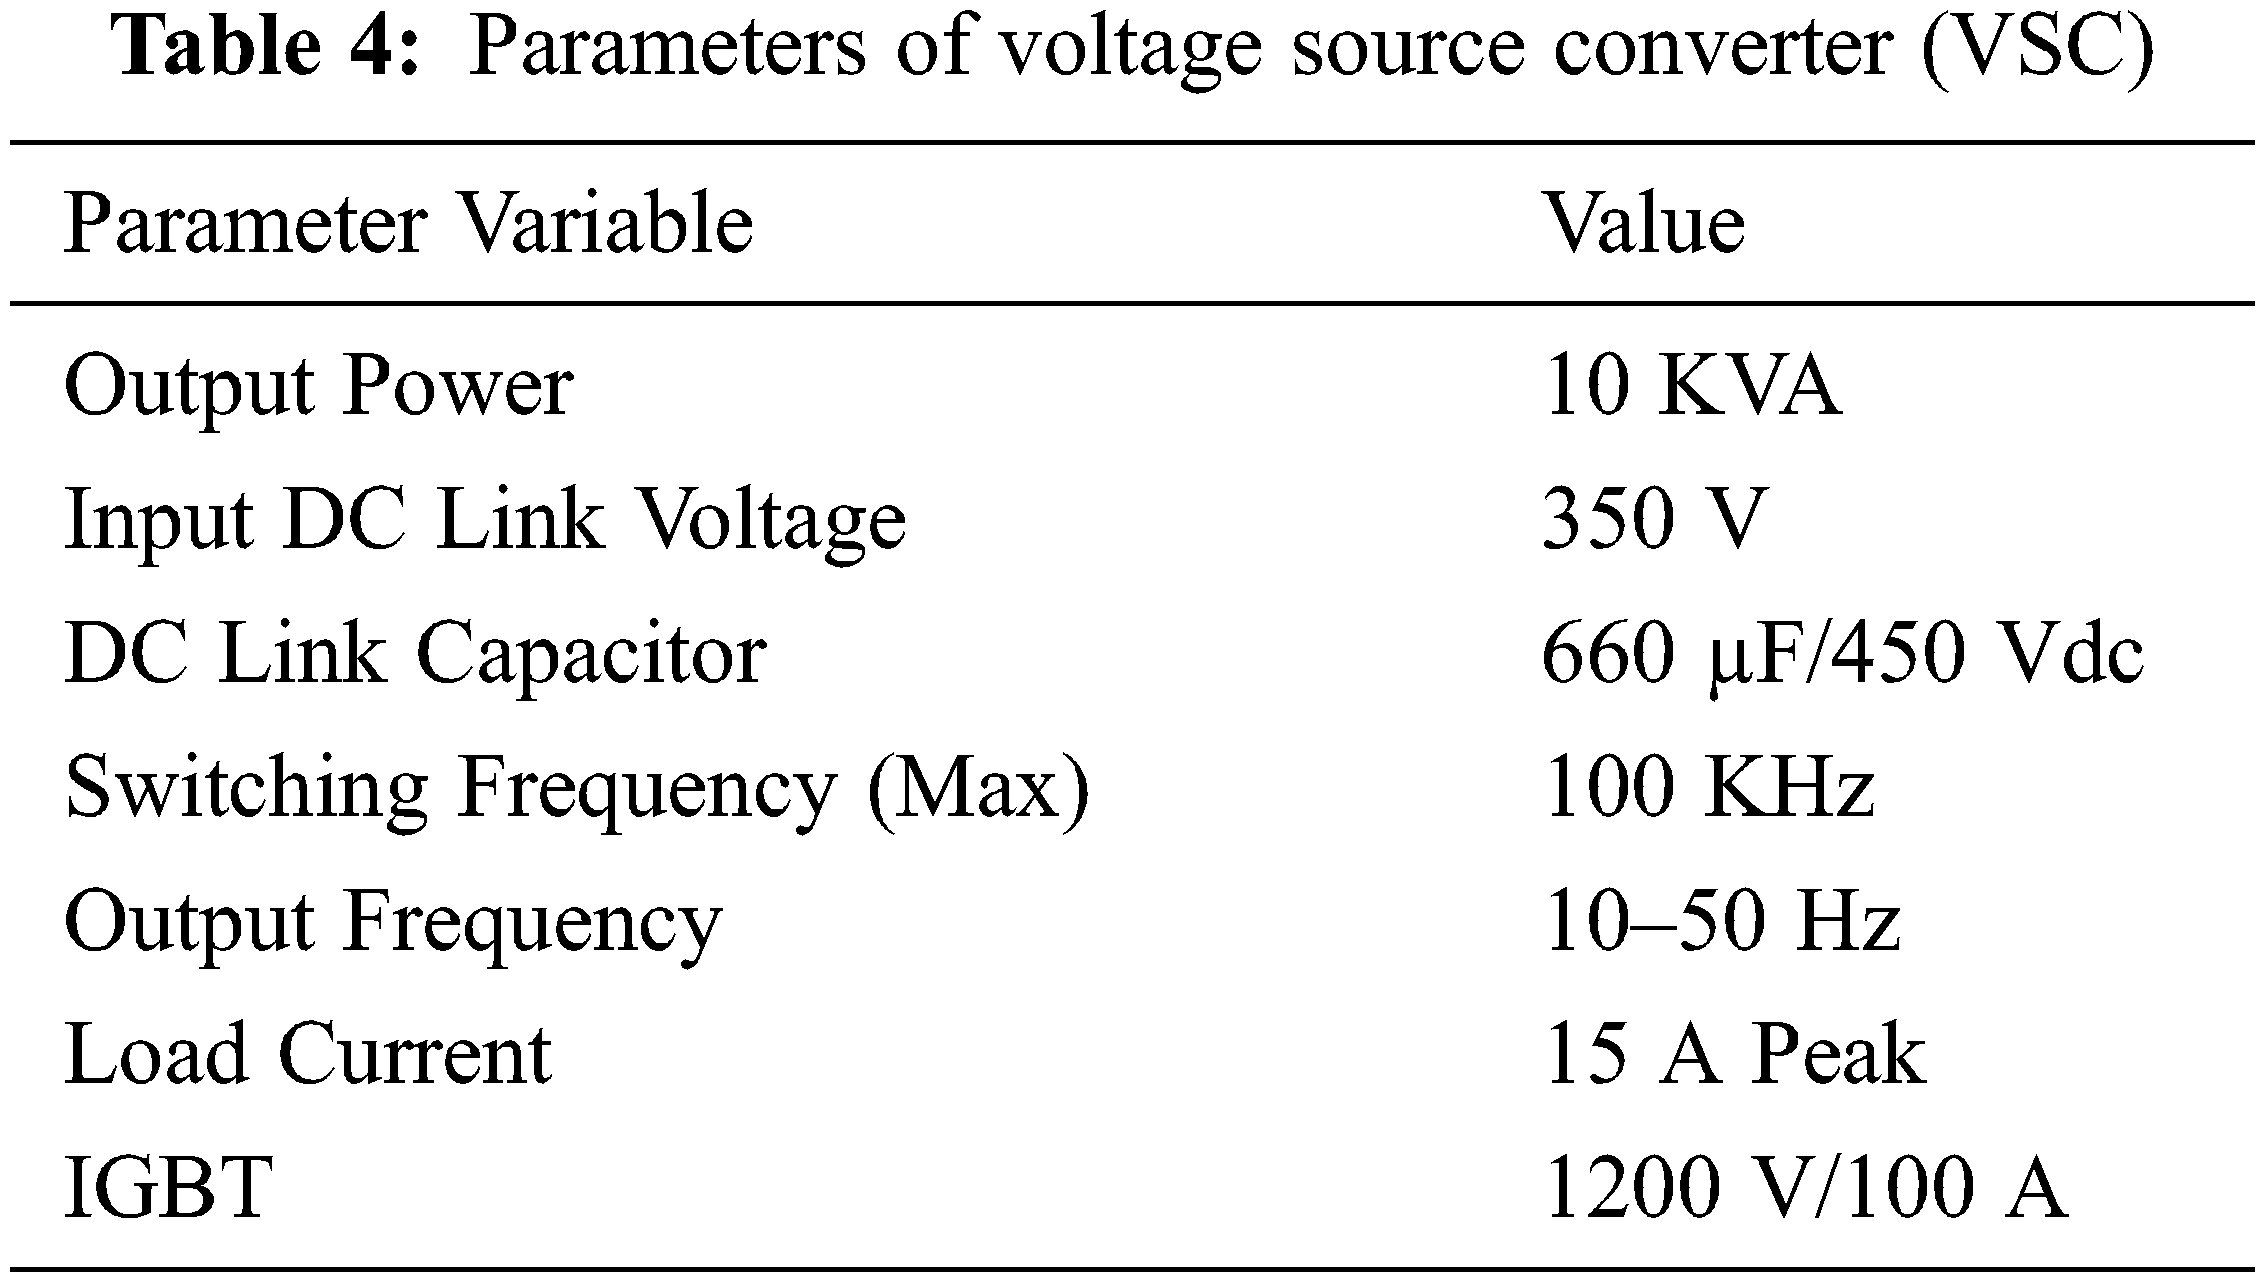
The line diagram of the PV array is associated with a grid through a DC-DC boost converter and a battery with a bidirectional buck-boost converter and 3-phase voltage source converter (VSC), as shown in Fig. 9.MPPT was implemented in a boost converter with an FPGA controller in the hardware. The hardware model consists of (a) a PV array with 1 kW at 1000 W/m2 irradiance, (b) boost converter, (c) battery with buck-boost bidirectional converter, (d) 3 phase VSC of 10 kVA, and (e) three-phase autotransformer as a utility grid. The parameters of the buck-boost converter are listed in Tab. 3.The parameters of the voltage source converter (VSC) and the battery are listed in Tabs. 4 and 5 respectively.
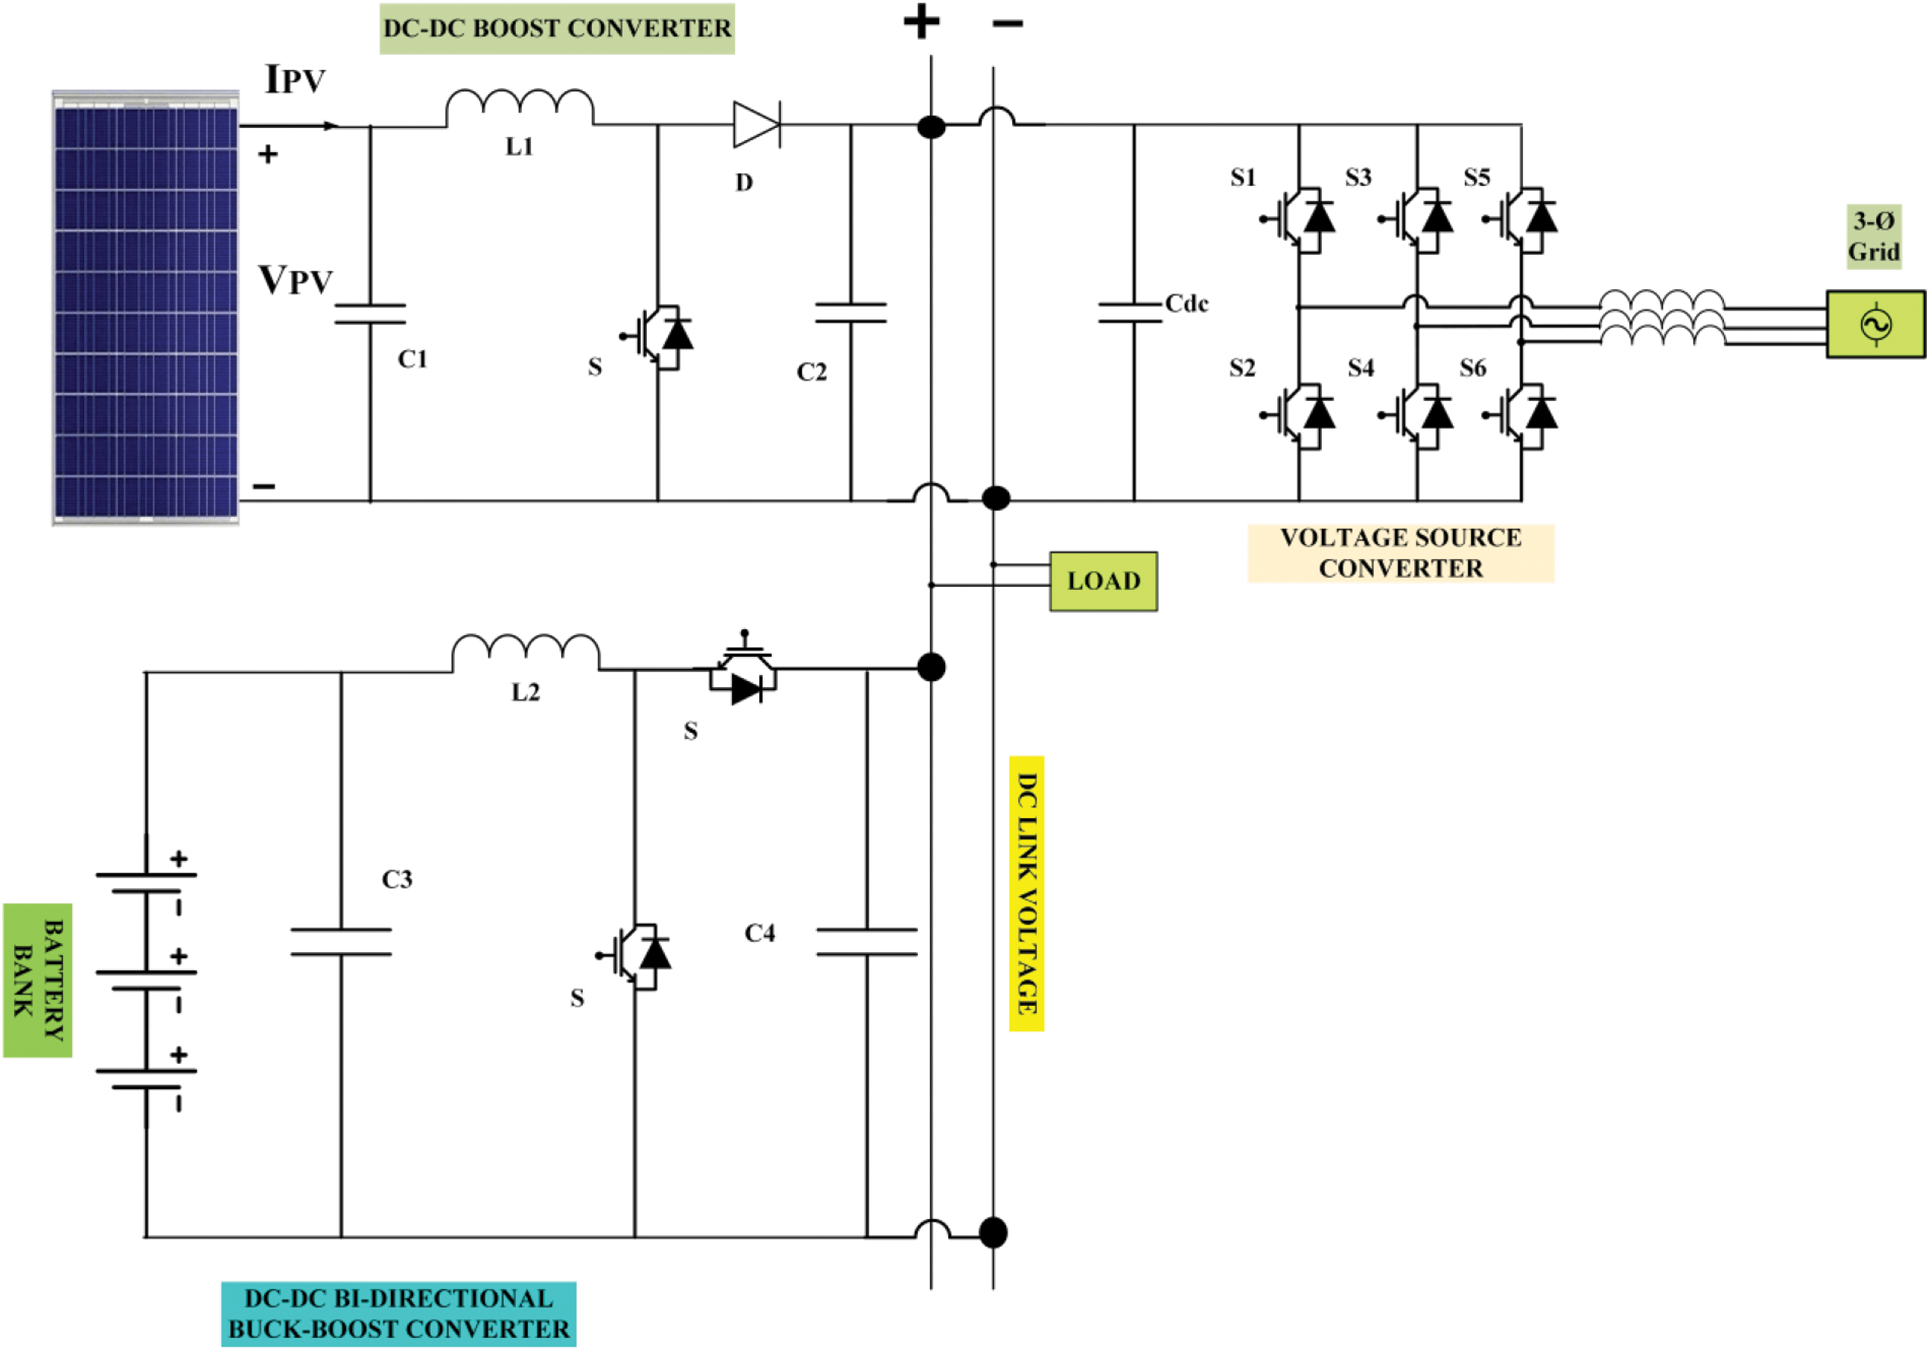
Figure 9: Proposed system line diagram


The hardware model of this research work is tested at different conditions.
• Maximum power tracking of solar PV with grid-connected system using P&O and INC algorithms.
• Comparison of settling time for both P&O, INC algorithms at constant load.
• Power management strategy for both P&O, INC algorithms at different load conditions.
• Improvement of total harmonic distortion (THD) in grid current using the instantaneous current control technique employed in a VSC on the grid side.
5.1 Maximum Power Tracking of the Solar PV with the Grid-Connected System using P&O, Incremental Conductance MPPT Algorithms
Fig. 10a shows that the maximum power tracking of the solar PV system by implementing the P&O MPPT algorithm under an irradiance varying from 1000 W/m2 to 700 W/m2 at 25°C at different load conditions of 1 indicates the no-load without MPPT, 2 indicates a load of 250 W without MPPT, 3 indicates a load of 250 W with MPPT, and a load of 500 W with MPPT indicates a condition of 4,7. A load of 1000 W with MPPT indicated a condition of 5,8. A load of 750 W with MPPT indicates a condition of 6,10. Furthermore, a load of 1250 W with MPPT indicates a condition of 9, as shown in Fig. 10a. The maximum power tracking from the solar PV system under the P&O MPPT condition was 852 W.Fig. 10b shows the maximum power tracking of the solar PV systems by implementing the incremental conductance MPPT algorithm. Under irradiance varying from 1000 W/m2 to 700 W/m2 at 25°C, under different load conditions, 1 indicates a no-load without MPPT, 2 indicates a load of 250 W without MPPT, 3 indicates a load of 250 W with MPPT, and a load of 500 W with MPPT indicates a condition of 4,7. A load of 1000 W with MPPT indicated a condition of 5,8. A load of 750 W with MPPT indicates a condition of 6,10. Moreover, a load of 1250 W with MPPT indicates a condition of 9, as shown in Fig. 10b.The maximum power tracking from the solar PV under the incremental conductance MPPT condition was 874 W.
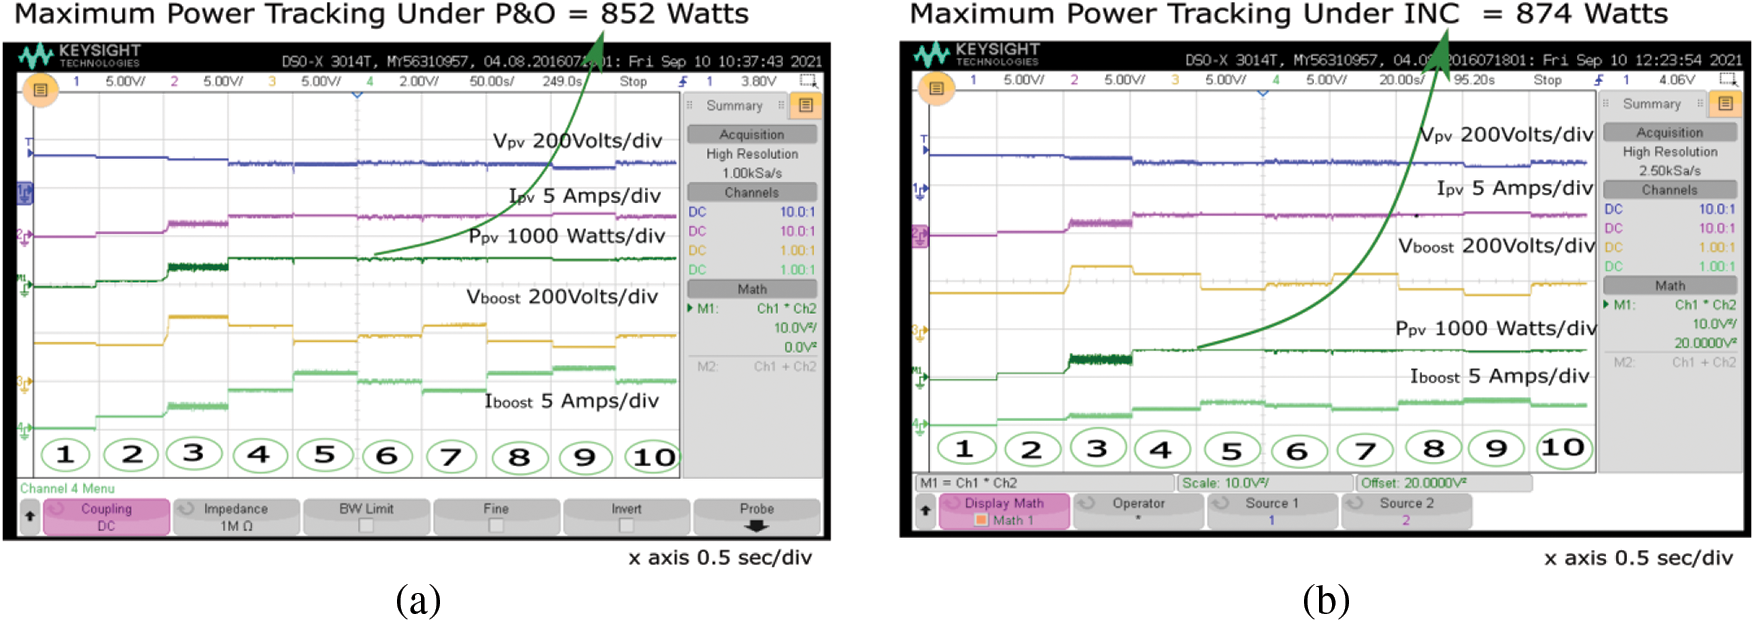
Figure 10: Comparison of maximum power tracking. (a) P&O, (b) incremental conductance
5.2 Comparison of Settling time for both the P&O and Incremental Conductance MPPT Algorithms at Constant Load
Fig. 11a shows that the maximum power tracking of the solar PV system under the P&O MPPT is 852 W in 0.37 s under a constant load of 500 W. Fig. 11b shows that the maximum power tracking of the solar PV system under incremental MPPT is 874 W is reached at 0.18 s under a constant load of 500 W. The settling time for the maximum power tracking of the solar PV system under the incremental conductance MPPT algorithm was shorter than that under the P&O MPPT algorithm.
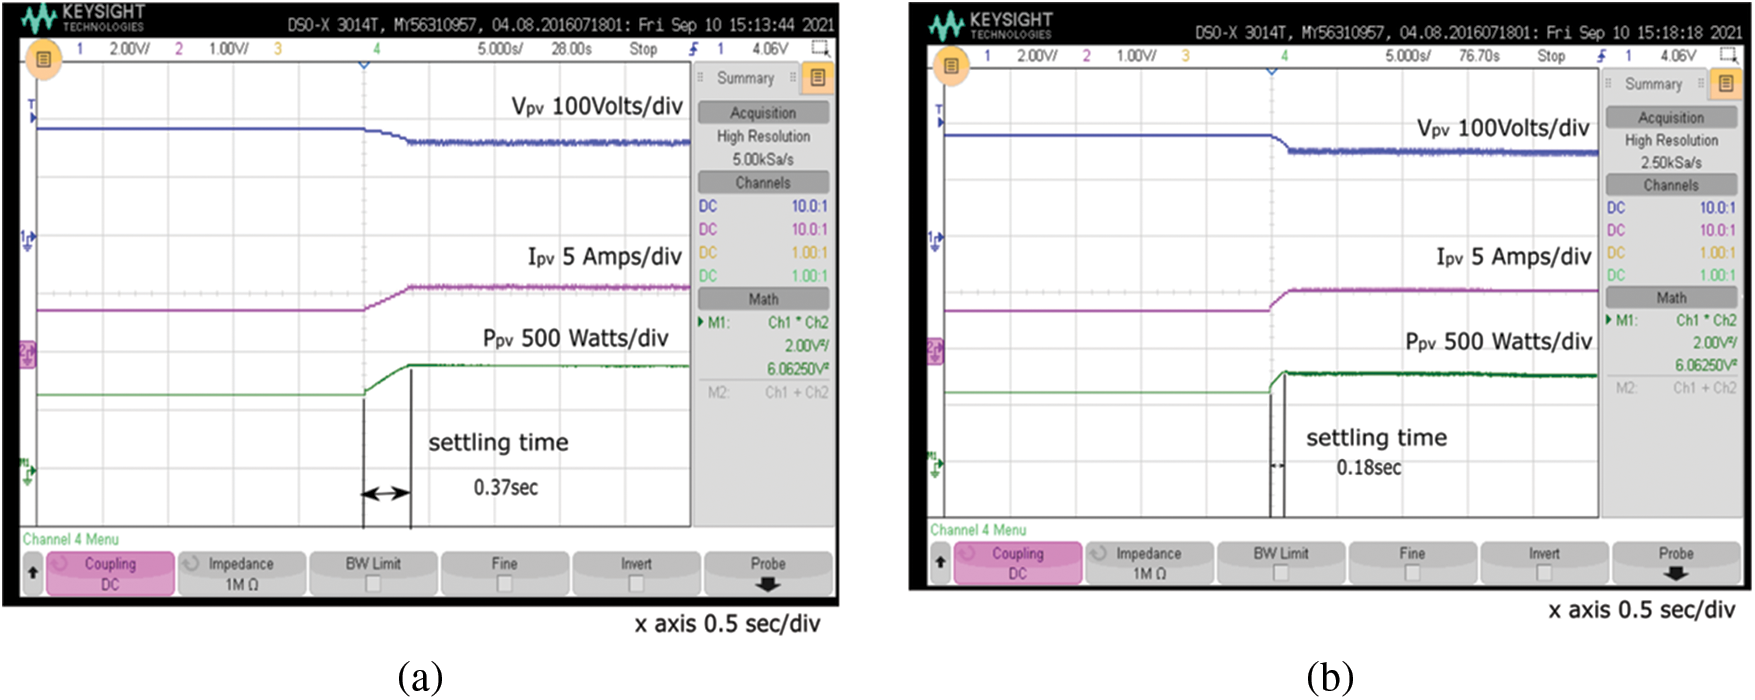
Figure 11: Comparison of settling time. (a) P&O, (b) incremental conductance
5.3 Power Management Strategy of both the P&O and Incremental Conductance MPPT Algorithms under Different Load Conditions at Irradiance Varying from 1000 W/m2 to 700 W/m2 and 25°C, for Solar PV Grid-Connected systems
A power management strategy was applied between the solar PV, battery, and grid under different loads using the P&O and incremental conductance MPPT algorithms. Figs. 12a–12c, show the power management strategy for a load demand of 1440 W using the incremental conductance MPPT algorithm. The total load demand of 1440 W supplied by the PV system was 551 W, the power supplied by the battery was 52 W, and the power supplied by the grid was 834 W. Under these conditions, the battery delivered power to the load, that is, the discharge condition.
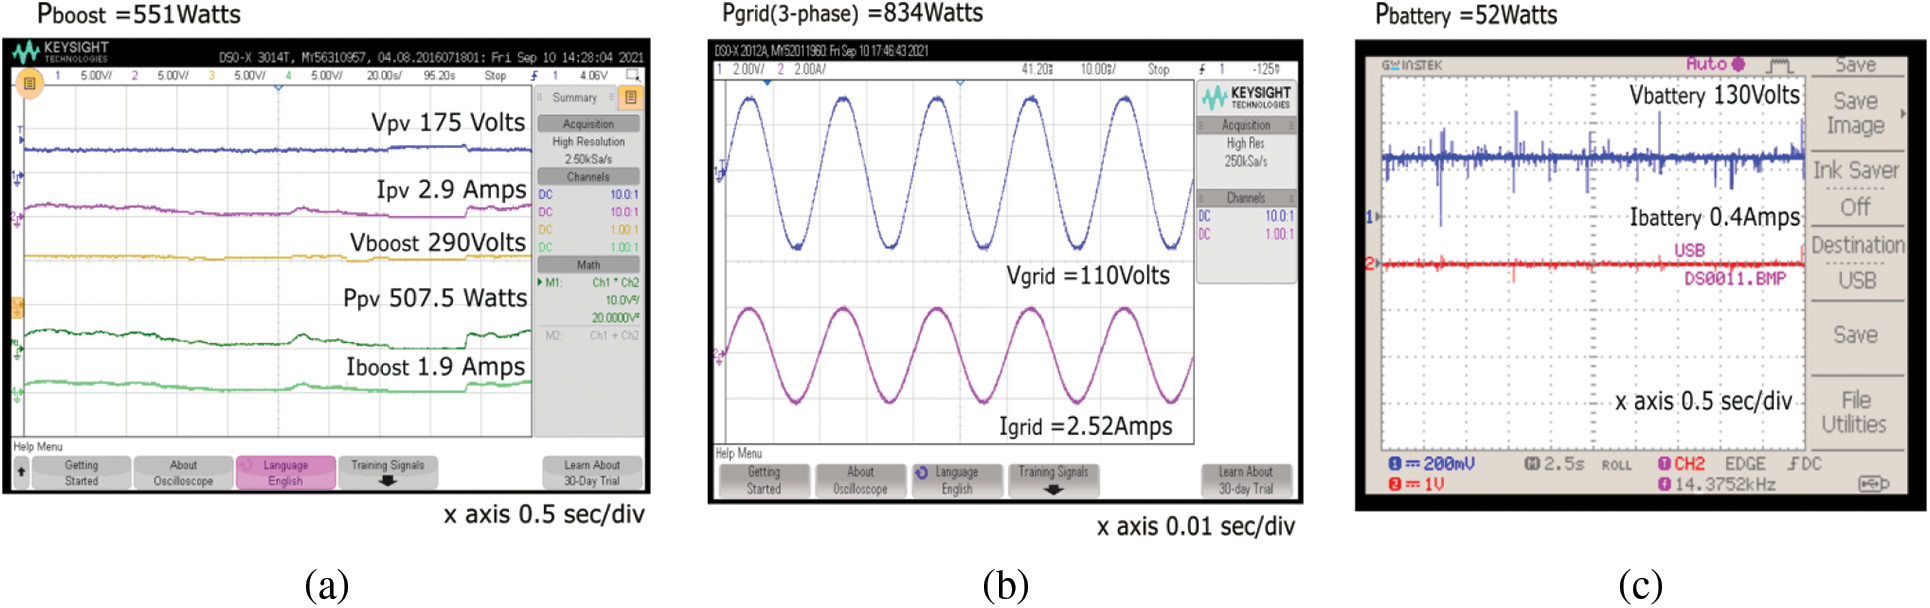
Figure 12: Power management strategy for a load of 1440 watts with incremental conductance MPPT algorithm. (a) PV system, (b) Grid, (c) Battery
Figs. 13a–13c show the power management strategy for a load demand of 310 W using the incremental conductance MPPT algorithm. The power supplied by the PV system was 522 W; however, the load demand was 310 W. Therefore, the excessive power delivered to the grid was −175 W (voltage and current were out of phase), and the battery charging with the power consumed from the PV was −39 W. This negative sign indicates the battery-consuming power from the PV system, that is, the charging condition. Figs. 14a–14c show the power management strategy for a load demand of 720 W using the P&O MPPT algorithm. The power supplied by the PV system was 450 W; however, the load demand was 720 W. Therefore, the power required by the grid was 264 W. Under these conditions, neither the battery was charged nor discharged. Figs. 15a–15c show the power management strategy for a load demand of 475 W using the P&O MPPT algorithm. The total load demand of 475 W supplied by the grid alone was 507 W. Under these conditions, the PV and battery were neither supplied nor consumed.
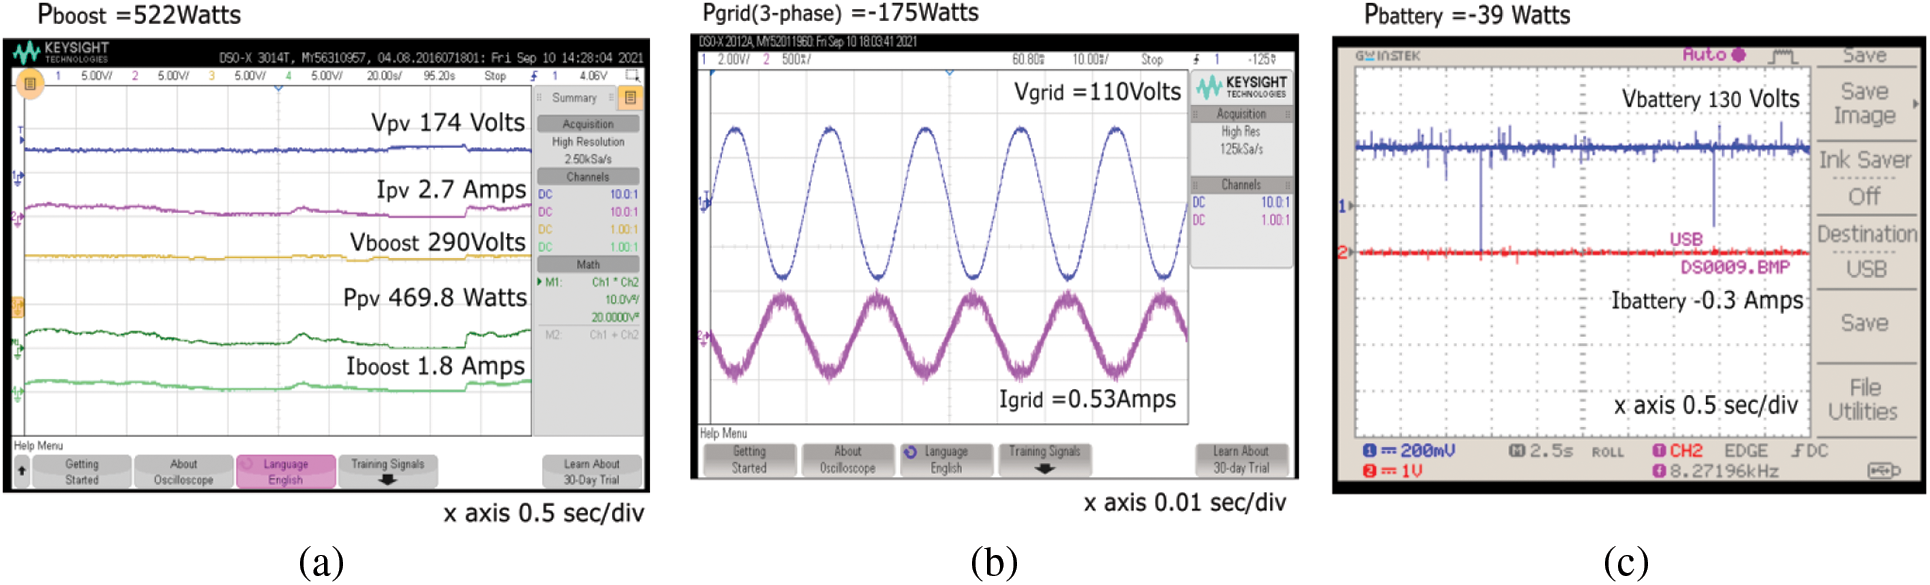
Figure 13: Power management strategy for a load of 310 watts with incremental conductance MPPT algorithm. (a) PV system, (b) Grid, (c) Battery
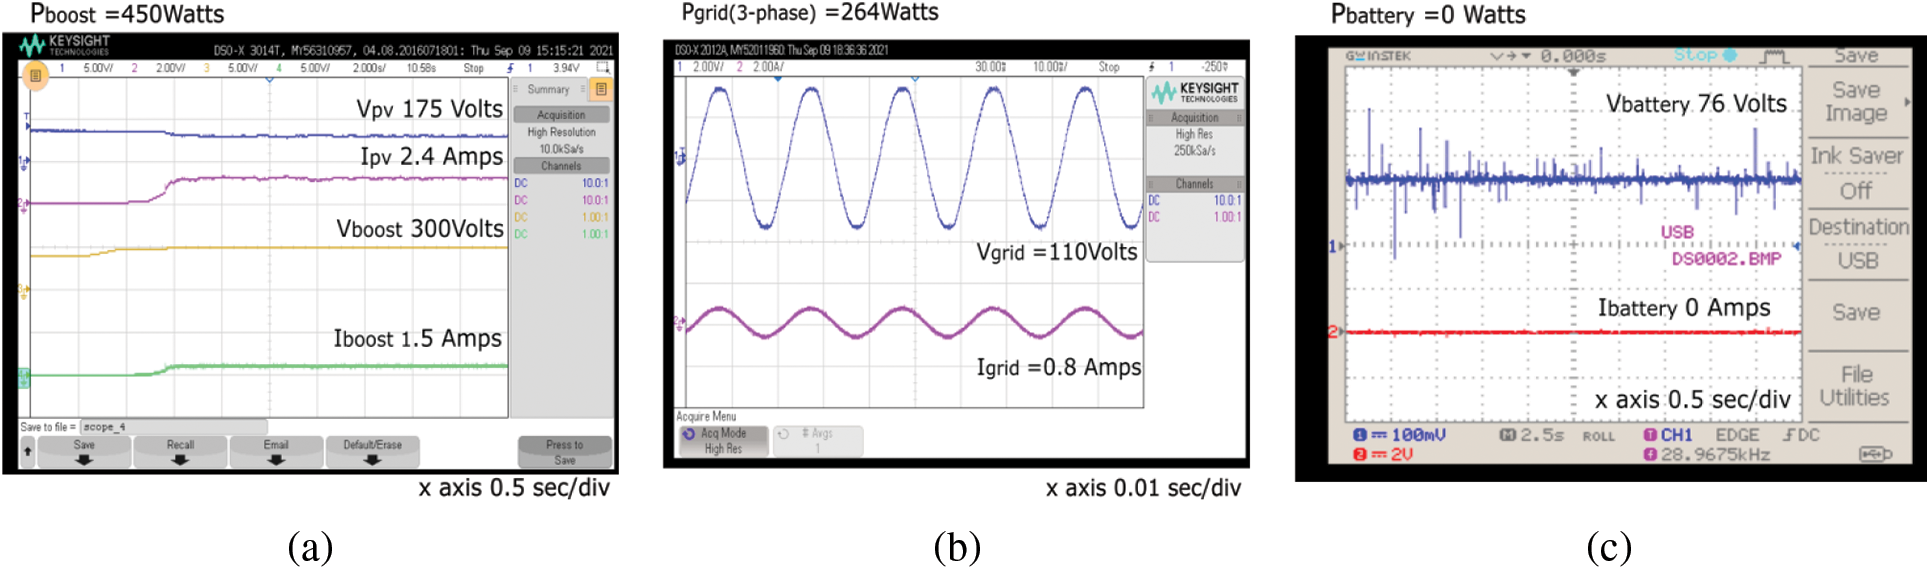
Figure 14: Power management strategy for a load of 720 watts with P&O MPPT algorithm. (a) PV system, (b) Grid, (c) Battery
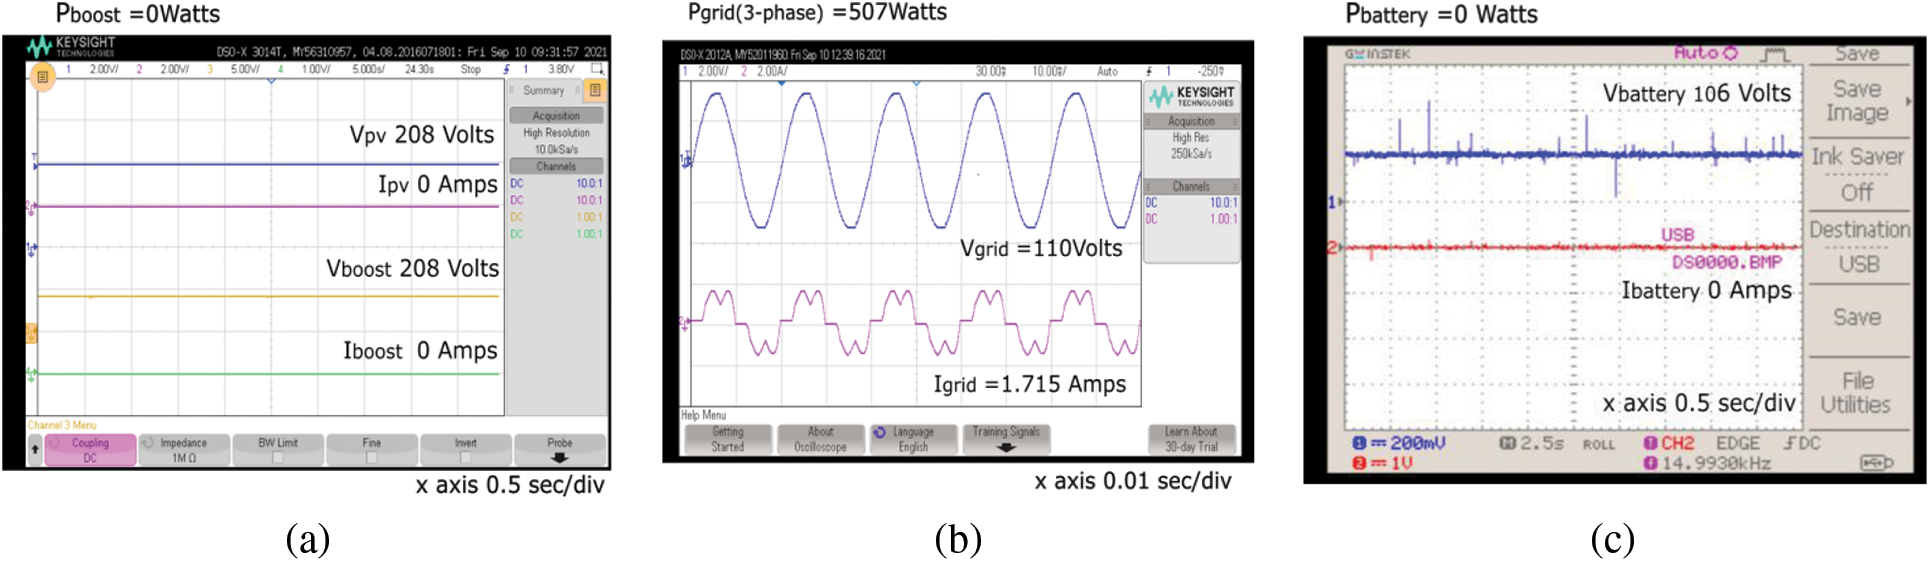
Figure 15: Power management strategy for a load of 475 watts with P&O MPPT algorithm. (a) PV system, (b) Grid, (c) Battery
5.4 Improvement of THD in Grid Current by using Instantaneous Current Control Technique Employed in a Voltage Source Converter (VSC) of Grid Side
Fig. 16a shows that the total harmonic distortion (THD) of the grid current without the instantaneous current control technique implemented in the firing angle of the voltage source converter at a constant load of 1230 W was 23.0%. Fig. 16b shows that the total harmonic distortion (THD) of the grid current without the instantaneous current control technique implemented in the firing angle of the voltage source converter at a constant load of 720 W was 55.6%. Fig. 16c shows that the total harmonic distortion (THD) of the grid current without the instantaneous current control technique implemented in the firing angle of the voltage source converter at a constant load of 310 W was 78.4%. Fig. 17a shows that the total harmonic distortion (THD) of the grid current with the instantaneous current control technique implemented at the firing angle of the voltage source converter at a constant load of 1230 W is 7.3%. Fig. 17b shows that the total harmonic distortion (THD) of the grid current with the instantaneous current control technique implemented in the firing angle of the voltage source converter at a constant load of 720 W is 1.1%. Fig. 17c shows that the total harmonic distortion (THD) of the grid current with the instantaneous current control technique implemented in the firing angle of the voltage source converter at a constant load of 310 W was 4.9%.
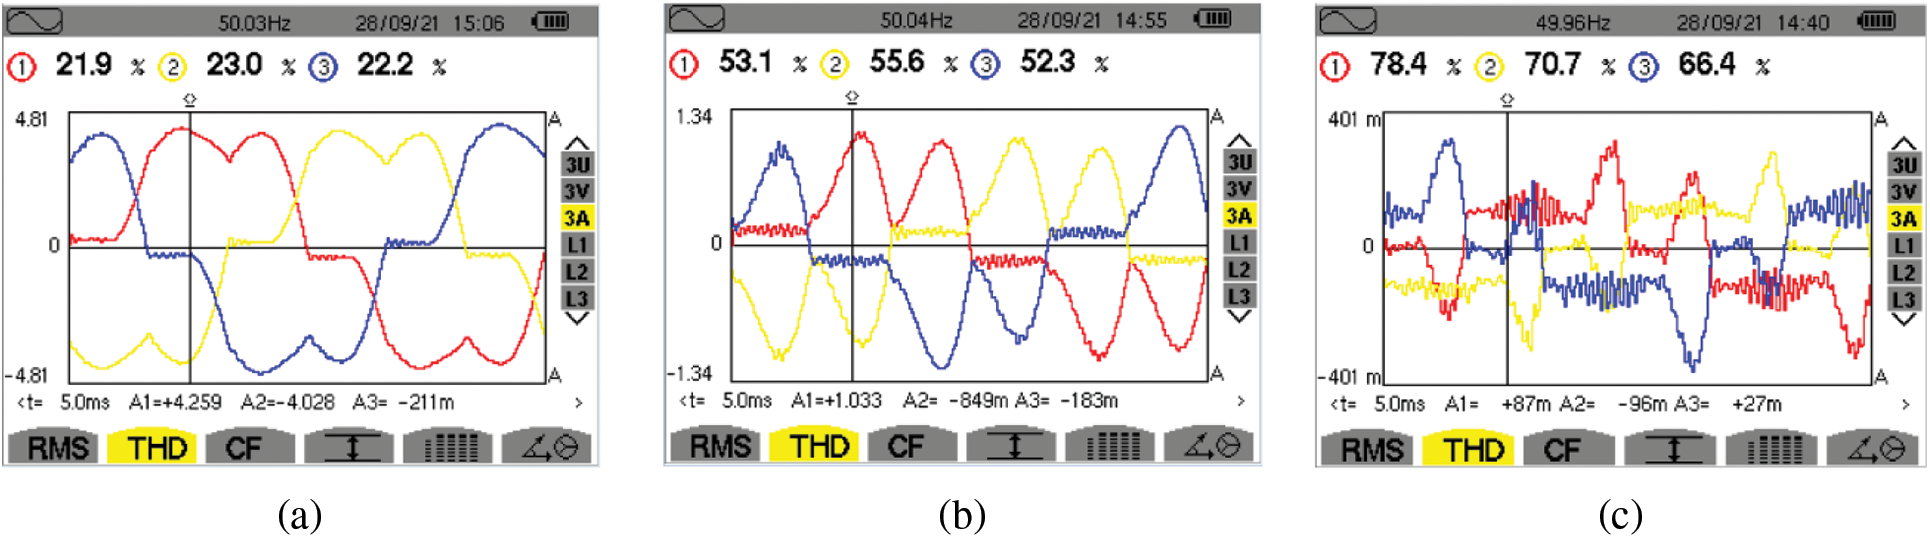
Figure 16: Grid current harmonic analysis with different loads without instantaneous current control technique in VSC. (a) 1230 watts, (b) 720 watts, (c) 310 watts
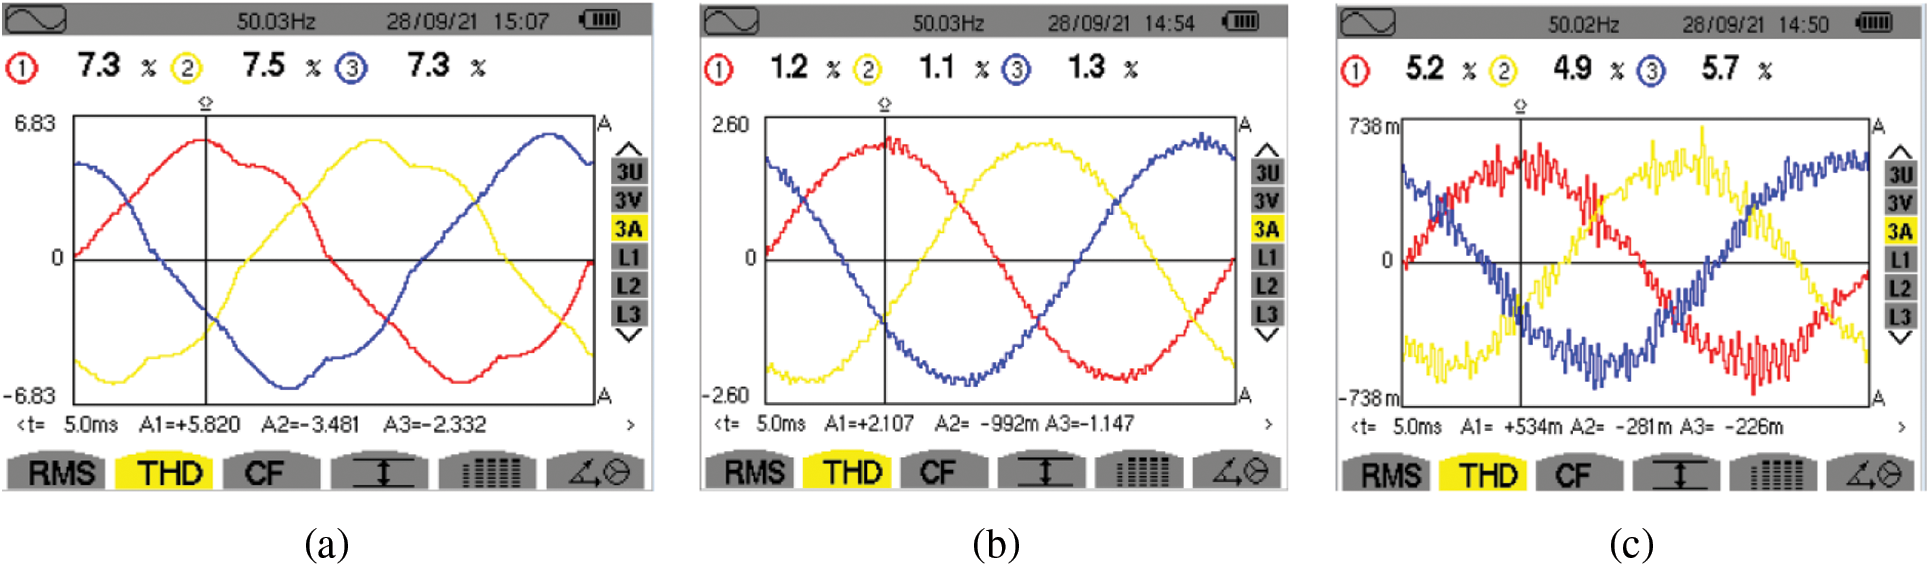
Figure 17: Grid current harmonic analysis with different loads with instantaneous current control technique in VSC. (a) 1230 watts, (b) 720 watts, (c) 310 watts
The experimental setup for the grid-connected solar PV system is shown in Fig. 18. A THD comparison of the grid current for different loads is presented in Tab. 6, and the power management strategy for the grid-connected PV systems for different loads is presented in Tab. 7.
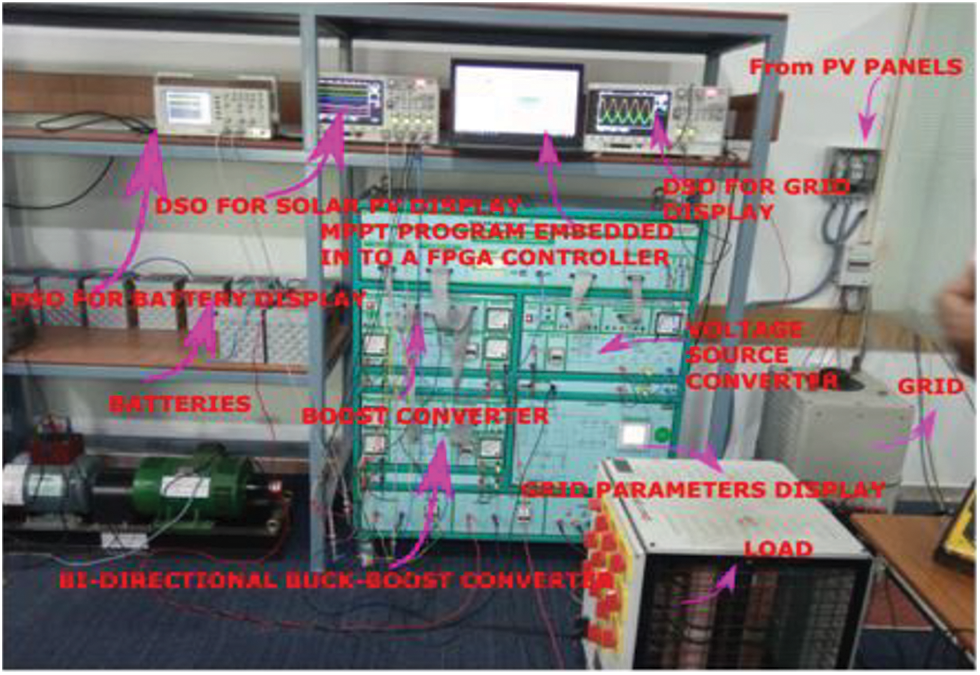
Figure 18: Experimental setup of the grid-connected PV system


A grid-connected photovoltaic system is the principal source of renewable energy for power plants. Hardware for a PV grid-connected system with an energy-management scheme using P&O and INC was implemented in this study. The incremental conductance method was used to extract the maximum power from the PV panel, and it had a shorter settling time to reach the steady-state maximum power than the P&O MPPT method. A review of related studies summarizes MPPT techniques as both classical and evolutionary algorithms. Among the classical techniques, P&O and INC are widely used because of their accuracy, simplicity, and low implementation cost. The proposed system with PO and INC techniques was verified in various aspects such as settling time, power management strategy, and THD improvement. By comparing the above results, the INC technique provides better performance than conventional P&O techniques.
Funding Statement: The authors received no specific funding for this study.
Conflicts of Interest: The authors declare that they have no conflicts of interest to report regarding this present study.
1. A. Suman, “Role of renewable energy technologies in climate change adaptation and mitigation: A brief review from Nepal,” Renewable and Sustainable Energy Reviews, vol. 151, no. 2, pp. 100–114, 2021. [Google Scholar]
2. S. Manit, H. Yoshihira, Y. Masahiro and O. Keiichi, “Temperature and irradiance dependences of the current and voltage at maximum power of crystalline silicon PV devices,” Solar Energy, Elsevier, vol. 131, no. 3, pp. 110–124, 2020. [Google Scholar]
3. A. Amjad, A. Khalid, P. Sanjeevikumar, T. Vineet, A. Salem et al., “Investigation of MPPT techniques under uniform and non-uniform solar irradiation condition-a retrospection,” IEEE Access, vol. 8, no. 2, pp. 368–392, 2020. [Google Scholar]
4. M. Madhukumar, T. Suresh and M. Jamil, “Investigation of photovoltaic grid system under non-uniform irradiance conditions,” Electronics, MDPI, vol. 9, no. 9, pp. 1–23, 2020. [Google Scholar]
5. M. Poornima, G. Tarush and G. Pratyush, “Evolution of MPPT algorithms in solar arrays,” Materials today Proceedings, Elsevier, vol. 37, no. 5, pp. 11–25, 2020. [Google Scholar]
6. D. Saptarshi, O. V. GnanaSwathika, N. Tewari, A. KrishnanVenkatesan, S. Umashankar et al., “Implementation of designed PV integrated controlled converter system,” IEEE Access, vol. 8, pp. 100905–100915, 2020. [Google Scholar]
7. V. Srinivasan, C. S. Boopathi and R. Sridhar, “A new meerkat optimization algorithm based maximum power point tracking for partially shaded photovoltaic system,” Ain Shams Engineering Journal, Elsevier, vol. 12, no. 4, pp.3791–3802, 2021. [Google Scholar]
8. M. Eltamaly, M. H. Farh and G. Abokhalil, “A novel PSO strategy for improving dynamic change partial shading photovoltaic maximum power point tracker,” Energy Sources, Taylor& Francis, pp. 1–15, 2020. [Google Scholar]
9. H. Rezk and A. Fathy, “Stochastic fractal search optimization algorithm based global MPPT for triple-junction photovoltaic solar system,” Energies, MDPI, vol. 13, no. 18, pp. 1–28, 2020. [Google Scholar]
10. K. V. G. Raghavendra, K. Zeb, M. Anand, T. N. V. Krishna, S. V. S. V. Prabhudevakumar et al., “A comprehensive review of DC–DC converter topologies and modulation strategies with recent advances in solar photovoltaic systems,” Electronics, MDPI, vol. 9, no. 1, pp. 1632–1642, 2019. [Google Scholar]
11. M. Eltamaly, M. A. Saud and A. G. Abokhalil, “A novel bat algorithm strategy for maximum power point tracker of photovoltaic energy systems under dynamic partial shading,” IEEE Access, vol. 8, pp. 10048–10060, 2020. [Google Scholar]
12. D. Chinmay, M. Kuntal and M. Roy, “Design of PV emulator fed MPPT controlled DC-DC boost converter for battery charging,” in First Int. Conf. on Smart Technologies for Power, Energy and Control (STPEC), Nagpur, India, IEEE, 2020. [Google Scholar]
13. S. Raghavendran, K. Sateesh kumar, A. Tirupathi and B. Chittibabu, “An improved three-level DC-DC boost converter for renewable energy systems with high gain,” in 3rd Int. Conf. on Energy, Power and Environment: Towards Clean Energy Technologies, Shillong, Meghalaya, India, IEEE, 2021. [Google Scholar]
14. A. Cahya Subrata, T. Sutikno, P. Sanjeevikumar and H. Satrian Purnama, “Maximum power point tracking in PV arrays with high gain DC-DC boost converter,” in 6th Int. Conf. on Electrical Engineering, Computer Science and Informatics (EECSI), Bandung, Indonesia, IEEE, 2019. [Google Scholar]
15. H. Benjamin, W. Wang and Y. Xue, “On the model granularity and temporal resolution of residential PV-battery system simulation,” Developments in the Built Environment, vol. 14, no. 4, pp. 1019–1032, 2021. [Google Scholar]
16. F. Blaabjerg, M. S. Bhaskar and P. Sanjeevikumar, “Non-isolated DC-DC converters for renewable energy applications,” CRC Press, vol. 18, no. 5, pp. 1219–1232, 2021. [Google Scholar]
17. D. Khodairsalem, M. Shaker, A. Munim and M. Abouelattaebrahim, “Application of modified MPPT algorithms: A comparative study between different types of solar cells,” Applied Solar Energy, vol. 56, no. 2, pp. 309–323, 2020. [Google Scholar]
18. A. Senthilvel, K. N. Vijeyakumar and B. Vinothkumar, “FPGA based implementation of MPPT algorithms for photovoltaic system under partial shading conditions,” Microprocessors and Microsystems, Elsevier, vol. 77, no. 5, pp. 1844–1859, 2020. [Google Scholar]
19. A. Ilyas, M. Rizwan Khan and M. Ayyub, “FPGA based real-time implementation of fuzzy logic controller for maximum power point tracking of solar photovoltaic system,” Optik, Elsevier, vol. 213, no. 5, pp. 4668–4679, 2020. [Google Scholar]
20. B. Ramu and N. Shanmugasundaram, “Performance investigation on novel MPPT controller in solar photovoltaicsystem,” Materials today Proceedings, Elsevier, vol. 37, no. 5, pp. 1467–1479, 2021. [Google Scholar]
21. P. Ankit and S. Bhattacharjee, “Performance analysis of a standalone PV system under dynamic weather and loading conditions-A case study,” in Fourth Int. Conf. on Inventive Systems and Control (ICISC), Coimbatore, India, IEEE, 2020. [Google Scholar]
22. A. Mohanty and R. Bidyadhar, “Modified P&O MPPT boost converter and voltage control inverter based island solar PV with power quality analysis under the varying load and changing weather condition,” in Int. Symp. on Sustainable Energy, Signal Processing and Cyber Security (ISSSC), Gunupur Odisha, India, IEEE, 2021. [Google Scholar]
23. B. Ratnakar Babu, M. Suresh and B. Praveen Kumar, “Hybrid, optimal, intelligent and classical PV MPPT techniques: A review,” Journal of Power and Energy Systems, IEEE, vol. 7, no. 1, pp. 9–33, 2021. [Google Scholar]
24. S. Bhattacharya and S. Samanta, “Modified incremental conductance MPPT algorithm for very fast changing atmospheric condition for solar electric vehicle application,” in 16th India Council Int. Conf. (INDICON), Rajkot, India, IEEE, 2020. [Google Scholar]
25. I. A. Smadi and R. AL-Qudah, “Explicit one-step model and adaptive maximum power point tracking algorithm for a photovoltaic module,” Computers &Electrical Engineering, Elsevier, vol. 85, no. 5, pp. 1264–1277, 2020. [Google Scholar]
26. D. Mustafić, D. Jokić, S. Lale and S. Lubura, “Implementation of incremental conductance MPPT algorithm in real time in matlab/simulink environment with humusoft MF634 board,” in 9th Mediterranean Conf. on Embedded Computing (MECO), Budva, Montenegro, IEEE, 2020. [Google Scholar]
27. M. Dileep Krishna and C. Ramulu, “Global maximum power point tracking technique based on adaptive salp swarm algorithm and P&O techniques for a PV string under partially shaded conditions,” Energy Sources, Taylor& Francis, pp. 1–18, 2020. [Google Scholar]
28. S. P. Engel, N. Soltau and R. W. Dedoncker, “Instantaneous current control for the three-phase dual-active bridge DC-DC converter,” in: Energy Conversion Congress and Exposition (ECCE). Raleigh, NC, USA: IEEE, pp. 3964–3969, 2021. [Google Scholar]
29. M. Rayane, G. Torres, J. Dai, J. Benchaib, A. Georges et al., “Understanding the role of VSC control strategies in the limits of power electronics integration in AC grids using modal analysis,” Electric Power Systems Research, Elsevier, vol. 192, no. 5, pp. 6930–6943, 2021. [Google Scholar]
30. R. Yin, S. Wang, S. Yuanyuan, B. Zhao, G. Wu et al., “Modeling and stability analysis of grid-tied VSC considering the impact of voltage feed-forward,” International Journal of Electrical Power & Energy Systems, Elsevier, vol. 135, no. 5, pp. 7483–7497, 2022. [Google Scholar]
 | This work is licensed under a Creative Commons Attribution 4.0 International License, which permits unrestricted use, distribution, and reproduction in any medium, provided the original work is properly cited. |