DOI:10.32604/iasc.2023.028889
| Intelligent Automation & Soft Computing DOI:10.32604/iasc.2023.028889 | |
| Article |
A Novel Outlier Detection with Feature Selection Enabled Streaming Data Classification
1Anna University, Chennai, 600025, India
2University College of Engineering, BIT Campus, Anna University, Tiruchirappalli, 620024, India
*Corresponding Author: R. Rajakumar. Email: rrkjournal@gmail.com
Received: 20 February 2022; Accepted: 29 March 2022
Abstract: Due to the advancements in information technologies, massive quantity of data is being produced by social media, smartphones, and sensor devices. The investigation of data stream by the use of machine learning (ML) approaches to address regression, prediction, and classification problems have received considerable interest. At the same time, the detection of anomalies or outliers and feature selection (FS) processes becomes important. This study develops an outlier detection with feature selection technique for streaming data classification, named ODFST-SDC technique. Initially, streaming data is pre-processed in two ways namely categorical encoding and null value removal. In addition, Local Correlation Integral (LOCI) is used which is significant in the detection and removal of outliers. Besides, red deer algorithm (RDA) based FS approach is employed to derive an optimal subset of features. Finally, kernel extreme learning machine (KELM) classifier is used for streaming data classification. The design of LOCI based outlier detection and RDA based FS shows the novelty of the work. In order to assess the classification outcomes of the ODFST-SDC technique, a series of simulations were performed using three benchmark datasets. The experimental results reported the promising outcomes of the ODFST-SDC technique over the recent approaches.
Keywords: Streaming data classification; outlier removal; feature selection; machine learning; metaheuristics
With the advancement in information technologies, huge volume of information is produced via sensor devices, social networks, and mobile phones. Streaming data is a series of information that arrives at the system in a changing and continuous manner. Streaming data has certain features like timely ordered, huge, potentially infinite, and rapidly changing in length [1]. Thus, the traditional mining approach should be enhanced to execute in the streaming platform, whereby the data change intermittently. Moreover, concept drift becomes very challenging in data stream [2]. Certain problems related to data stream mining include clustering, data stream classification, load shedding, sliding window computation, and frequent pattern mining [3]. The data arrives at a high speed and the conventional data mining (DM) approach could not manage those streaming information. Thus, the classification method must be adapted for handling the changes in information. Data stream classifiers might be ensemble models or single incremental models. The analysis of data stream using machine learning (ML) method to resolve prediction, regression, and classification issues is gaining considerable interest [4]. Frequent causes of nonstationary behaviour, named concept drift, are sensor or component aging, seasonality effect, user’s interest drift or operation mode changes, and thermal drift. While facing nonstationary environment, the problem of adopting ML model becomes crucial. Thus, it is essential to develop efficient solution to solve the issue that exists in the data stream [5].
Recently, anomaly detection in real-time computer networks become increasingly difficult task because of the continuous increase of high dimensional, high-volume, and high-speed data streams, where ground truth data is unavailable [6]. Effective detection scheme needs to be faster and should be able to deal with concept drift [7]. Various techniques for unsupervised online outlier detection were introduced for handling this circumstance to reliably identify malicious activities. The important application of ML has favoured the recognition of network-based attacks changes their behaviour autonomously and dynamically [8]. Especially, unsupervised outlier detection (OD) algorithm assist uncovers policy violation or noisy instance as indicator of attack by observing deviation in high-volume and high dimensional information without needing prior knowledge. But the ubiquity of constantly generated data stream across many fields in distinct applications possess a major problem to offline. Moreover, legitimate changes in data could take place over time, named concept drift that needs to update a model for counteracting less accurate prediction as time passes [9]. Currently, various OD solutions were introduced that is capable of computing anomaly scores while handling data stream [10].
Since none of the earlier works have focused on the outlier detection with feature selection (FS) process for streaming data classification, this study develops an outlier detection with FS technique for streaming data classification, named ODFST-SDC technique. Primarily, streaming data is pre-processed in two ways namely categorical encoding and null value removal. In addition, Local Correlation Integral (LOCI) is used which is significant in the detection and removal of outliers. Besides, red deer algorithm (RDA) based FS approach is employed to derive an optimal subset of features. Finally, kernel extreme learning machine (KELM) classifier is used for streaming data classification. The design of LOCI based outlier detection and RDA based FS shows the novelty of the work. For assessing the enhanced streamlining data classification results of the ODFST-SDC technique, a wide range of simulations were carried out against three benchmark datasets.
Benjelloun et al. [11] improved the ability to identify outliers of distance-based algorithm and micro-cluster-based algorithm (MCOD). This is by adding a layer named LiCS that categorizes k-nearest neighbor (KNN) of nodes according to the evolutionary conditions. This layer aggregates the result and utilizes a threshold count for classifying nodes. Yang et al. [12] designed a service selection model for selecting and configuring anomaly detection scheme (ADS) at run-time. In the initial phase, a genetic algorithm-based FS method and a time-series feature extractor (Tsfresh) are employed for swiftly extracting main feature that acts as representation for the data stream pattern. In addition, data stream and effectual algorithm are gathered as previous information. A faster classification method based extreme gradient boosting (XGBoost) is trained for recording data stream features to identify proper ADS dynamically at run-time.
Heigl et al. [13] proposed an approach for Unsupervised FS for Streaming Outlier Detection (UFSSOD) that is capable of performing unsupervised FS for the aim of OD on data stream. Moreover, it is capable of determining the number of top
Gu et al. [16] proposed a self organizing fuzzy inference ensemble architecture. Since the base learner of the presented method, the self organizing fuzzy inference scheme can bale to self-learn a transparent from data stream on chunk wise via human interpretable method. Amutha et al. [17] categorized anomalies in streaming PMU data by taking each feature with supervised and clustering ensemble methods into account. Now, the study utilizes random forest that is a supervised ensemble-based method. Then, the mode or average of each output of individual tree is stated as the final output for certain information. An architecture is presented for classifying and detecting the outliers in the streaming phasor measurement unit (PMU) data with the clustering approach.
In this study, a new ODFST-SDC model has been presented for streaming data classification. The proposed ODFST-SDC technique incorporates different processes namely pre-processing, LOCI based outlier removal, RDA based FS, and KELM based classification.
At the initial stage, the streaming data is pre-processed in such way that the categorical encoding and null value removal process is carried out. Secondly, the RDA is applied to indicate an optimal subset of features and finally, KELM model is utilized for streaming data classification. Fig. 1 demonstrates the overall workflow of proposed ODFST-SDC technique.
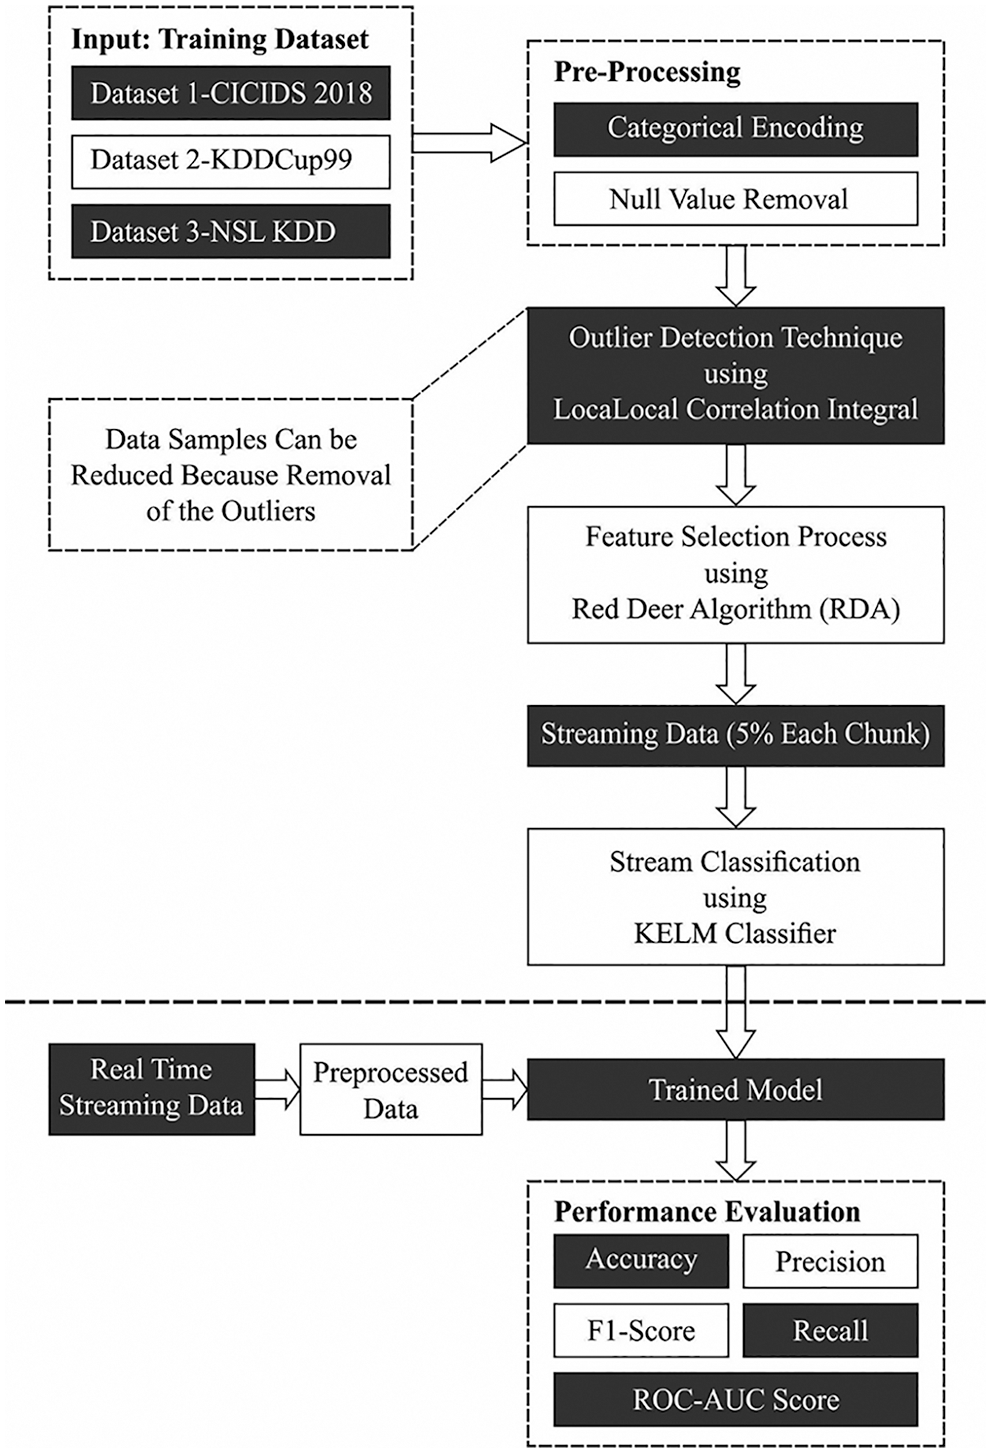
Figure 1: Overall process of ODFST-SDC technique
3.1 LOCI Enabled Outlier Detection
During the outlier removal process, the pre-processed streaming data is passed into the LOCI model which effectively detects and removes outliers. LOCI calculates a counting neighborhood to nn nearest observation, whereas the radius has equivalent to outermost observations. In the counting neighborhood, all observations have a sampling neighborhood of that the size has defined as the alpha input parameter. LOCI returns an outlier score dependent upon the standard deviation of sampling neighbourhood is named as multi-granularity deviation factor (MDEF). The LOCI operation is helpful to outlier detection from clusters and other multi-dimensional fields [18].
• Large sampling neighborhood: To all points and counting radius, the sampling neighborhood was chosen that huge sufficient to comprise sufficient samples. It can be select α = 1/2 from every exact computation, and it is classically utilized α = 1/16 from LOCI to robustness
• Full-scale: The MDEF value is studied to a wide range of sampling radii. In other terms, the maximal sampling radius is rmax ≈ α−1RP (that equals to maximal counting radius of RP). The minimal sampling radius
• Standard deviation based flagging: The point can be denoted as outlier when some
3.2 Design of RDA Based Feature Selection
Once the outliers are removed, the next step is to derive an optimum feature subset using RDA. The RDA is similar to other meta-heuristics, starts with an arbitrary population that is red deers (RDs) counterpart. An optimum RDs from the population is selected and dubbed the “male Red Deers (MRD)”, but the remainder was dubbed “hinds” [19]. The iterative performance of technique was projected. To mathematical process the RDA begins with Eq. (1) whereas a primary population to the RDs are generated:
Afterward, the fitness of all the members from the population is computed based on Eq. (2):
MRDs are attempt for boosting their grace by roaring under this stage. Thus the outcome, the roaring procedure can succeed/fail. When the main function of neighbors is MRD, it can be exchanged by the forecasting when it can be superior to the preceding MRD. The subsequent data is offered for keeping males up to speed on its status. The subsequent formula is presented:
where
The fighting procedure is modeled by the succeeding 2 mathematical equations:
The 2 novel solutions established by fighting procedure are
where
The count of hinds of a harem is computed as:
where
The count of hinds from the
It can be picked a harem at arbitrary (call it k) and allows the male commander for mating with
where
where
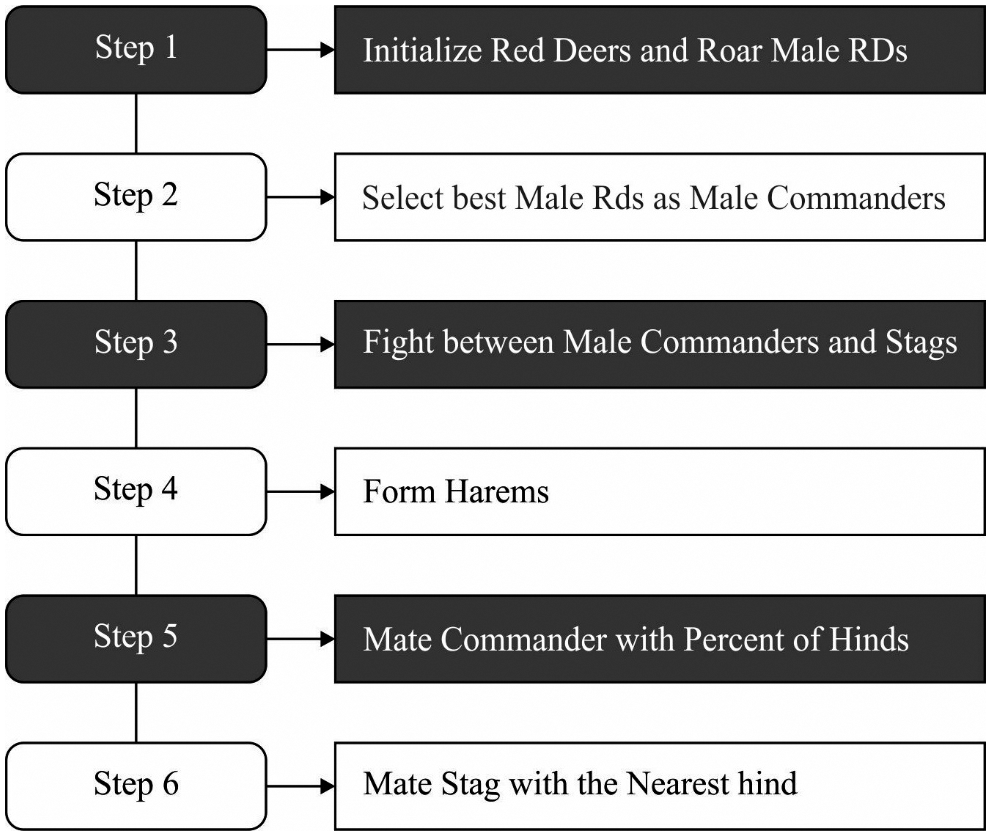
Figure 2: RDA flowchart
The RDA aims to choose a set of features from any dataset with the size of
where
3.3 Process Involved in KELM Based Classification
At the final classification process, the chosen features are applied to the KELM model to classify streaming data. Extreme learning machine (ELM) is established as a general classification model which needs minimum human interference [21]. Assume that dataset
where
where
The resultant weight vector of ELM is evaluated by minimizing the function provided as:
relating to
where
whereas
In this section, the experimental validation of the ODFST-SDC model is carried out using three benchmark datasets namely CICIDS 2018 (https://www.kaggle.com/solarmainframe/ids-intrusion-csv), KDDCup 1999 (https://www.kaggle.com/galaxyh/kdd-cup-1999-data), and NSL KDD (https://www.kaggle.com/hassan06/nslkdd) datasets. The proposed model is simulated using Python tool.
In this study, the CICIDS 2018 dataset with three classes (with 1000 instances each) is employed namely benign, FTP-Brute Foreca, and SSH-Brute force. After outlier removal process, the number of instances under benign, FTP-Brute Foreca, and SSH-Brute force classes becomes 992, 874, and 987. Besides, the ODFST-SDC model has offered 21 chosen features out of 80 features. They are Dst Port, Protocol, Flow Duration, Tot Fwd Pkts, Tot Bwd Pkts, TotLen Fwd Pkts, TotLen Bwd Pkts, Fwd Pkt Len Max, Fwd Pkt Len Min, Fwd Pkt Len Mean, Fwd Pkt Len Std, Bwd Pkt Len Max, Bwd Pkt Len Min, Bwd Pkt Len Mean, Bwd Pkt Len Std, Flow Byts/s, Flow Pkts/s, Flow IAT Mean, Flow IAT Std, Flow IAT Max, Flow IAT Min.
Besides, the KDD-Cup 1999 dataset holds samples under four classes namely normal, denial of service (DoS), Probe, and root to local (R2L). Each class label comprises a total of 750 instances. Once the outliers are removed, the number of instances becomes 638, 575, 748, and 720 namely normal, DoS, Probe, and R2L classes respectively. Besides, the number of chosen features is 5 out of 41 and they are protocol_type, service, flag, src_bytes, dst_bytes, and land. Finally, the NSL-KDD dataset also includes four classes namely normal, DoS, Probe, and R2L. Each class label comprises a total of 750 instances. After outlier removal process, the number of instances under normal, DoS, probe, and R2L classes becomes 624, 671, 540, and 440 respectively. In addition, a set of 17 features are elected out of 42 features. They are protocol_type, service, flag, src_bytes, dst_bytes, land, wrong_fragment, urgent, hot, num_failed_logins, logged_in, num_compromised, root_shell, su_attempted, num_root, num_file_creations, num_shells.
Fig. 3 represents the convergence curve examination of the ODFST-SDC model on three datasets. The figures reported that the ODFST-SDC model has exhibited effective convergence on all the applied datasets. Once the outlier removal process is carried out data, the streaming data is split into
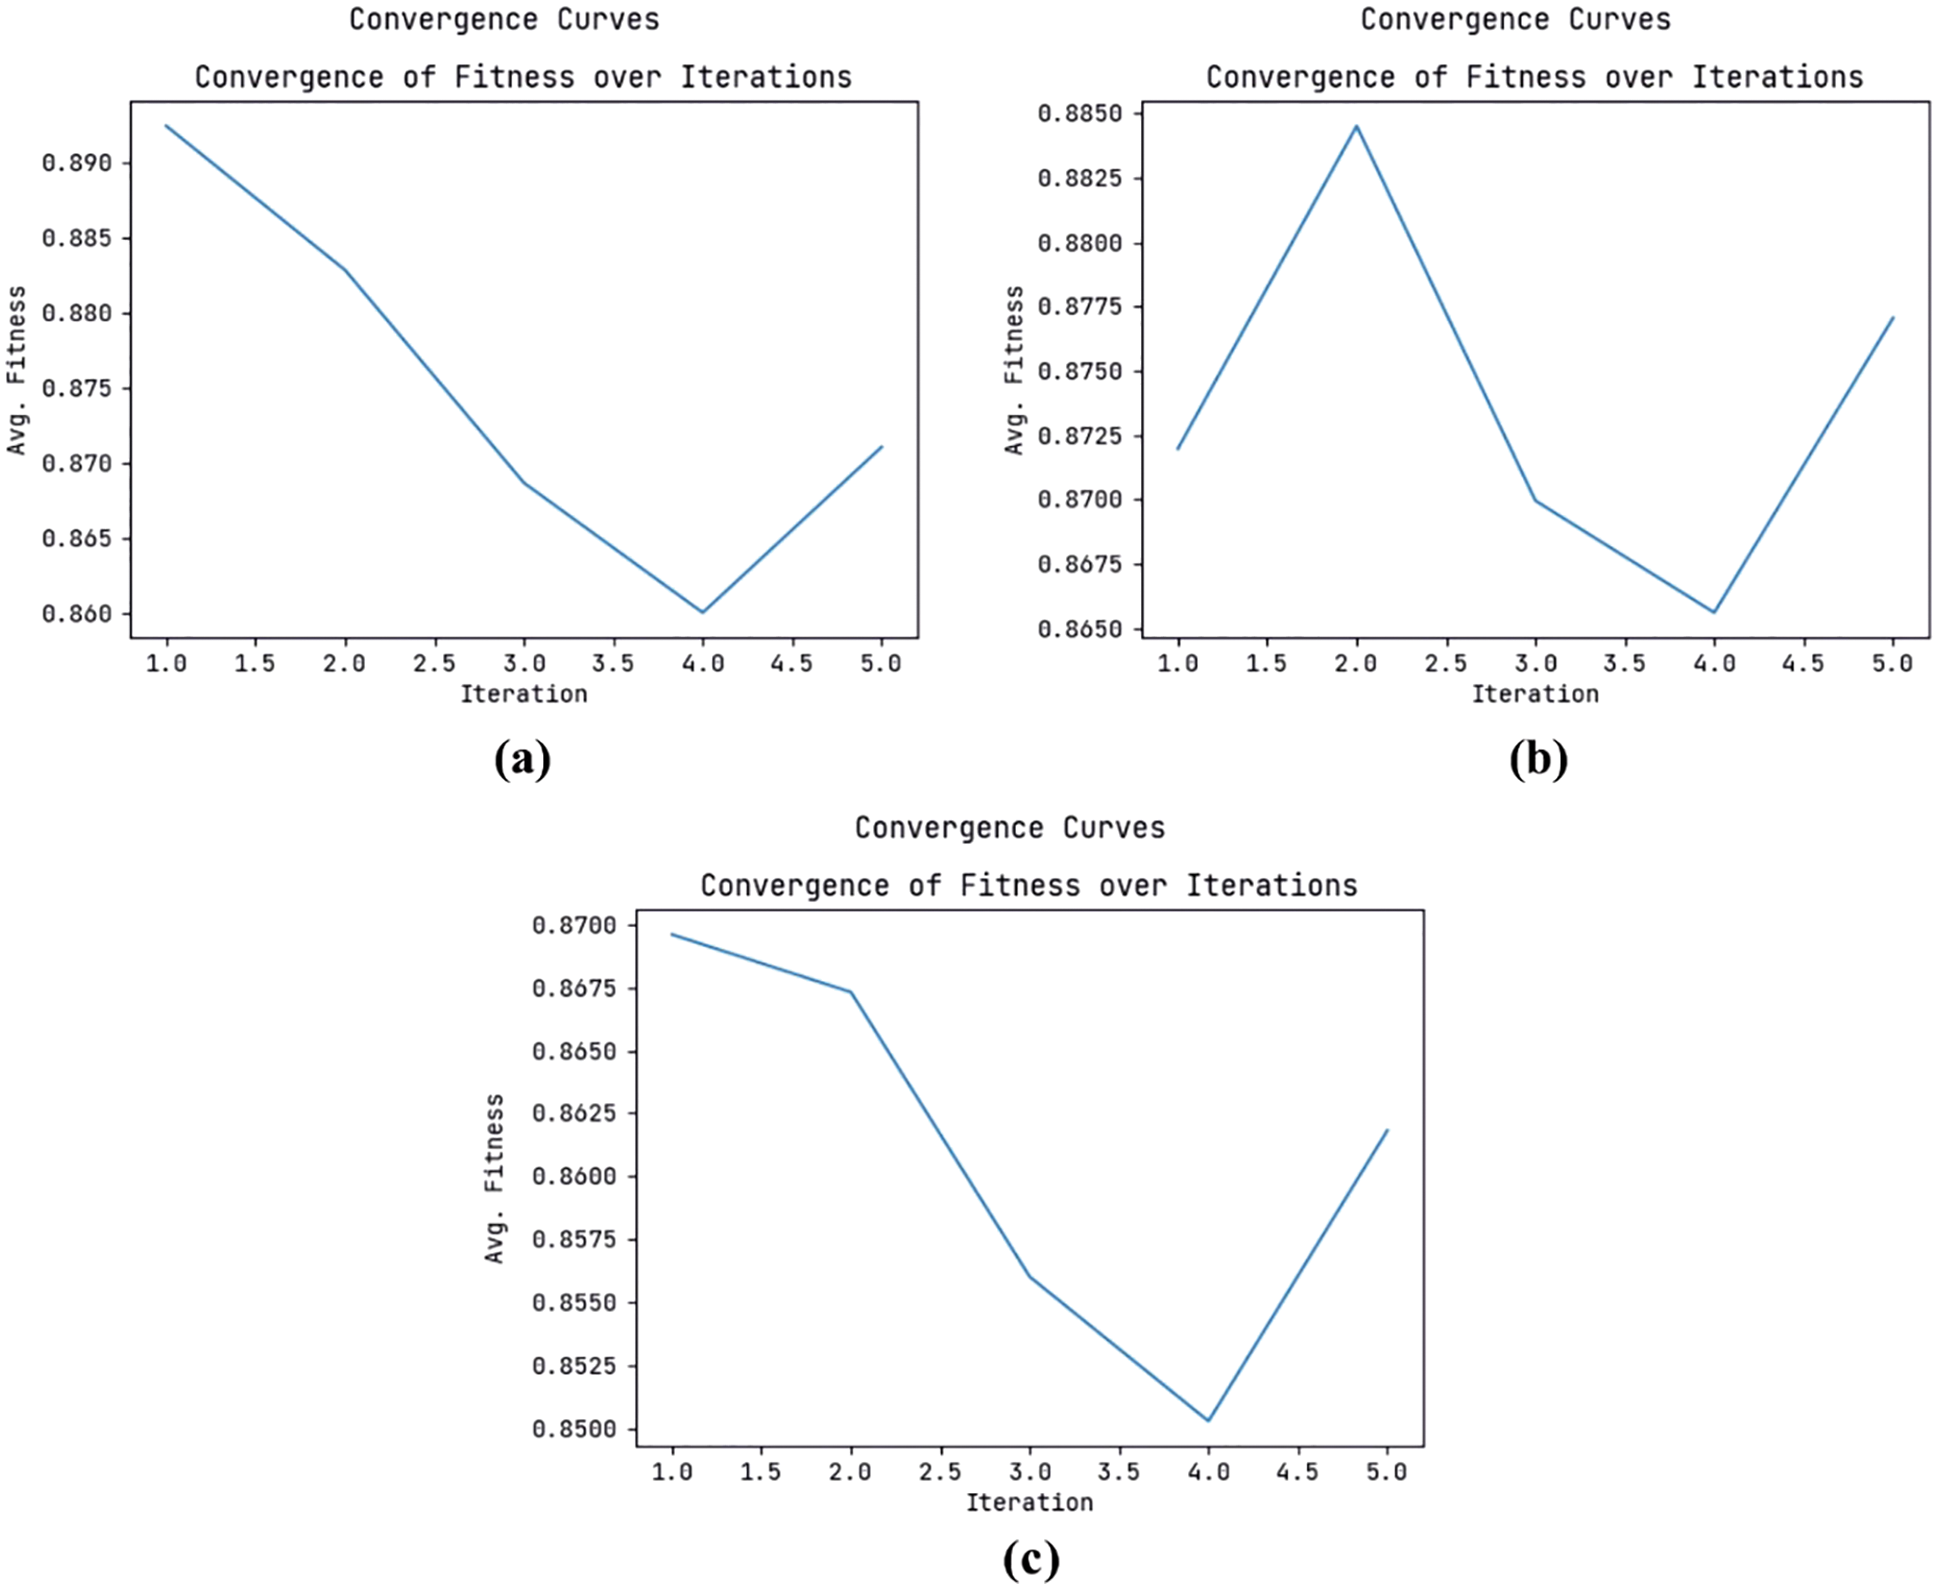
Figure 3: Convergence analysis (a) CICIDS 2018 Dataset (b) KDDCup 99 Dataset (c) NSL-KDD Dataset
The confusion matrices created by the ODFST-SDC model under three distinct dataset is portrayed in Fig. 4. Fig. 4a displays that the ODFST-SDC model has classified the CICIDS 2018 dataset with R884, 847, and 987 instances under benign, FTP-BruteForce, and SSH-BruteForce classes respectively. Fig. 4b illustrates that the ODFST-SDC model has classified the KDDCup 99 dataset with 626, 574, 736, and 718 instances under normal, dos, probe, and r2l classes respectively. Fig. 4c reports that the ODFST-SDC model has classified the NSL-KDD dataset with ROC values of 583, 611, 511, and 438 instances under normal, dos, probe, and r2l classes respectively.
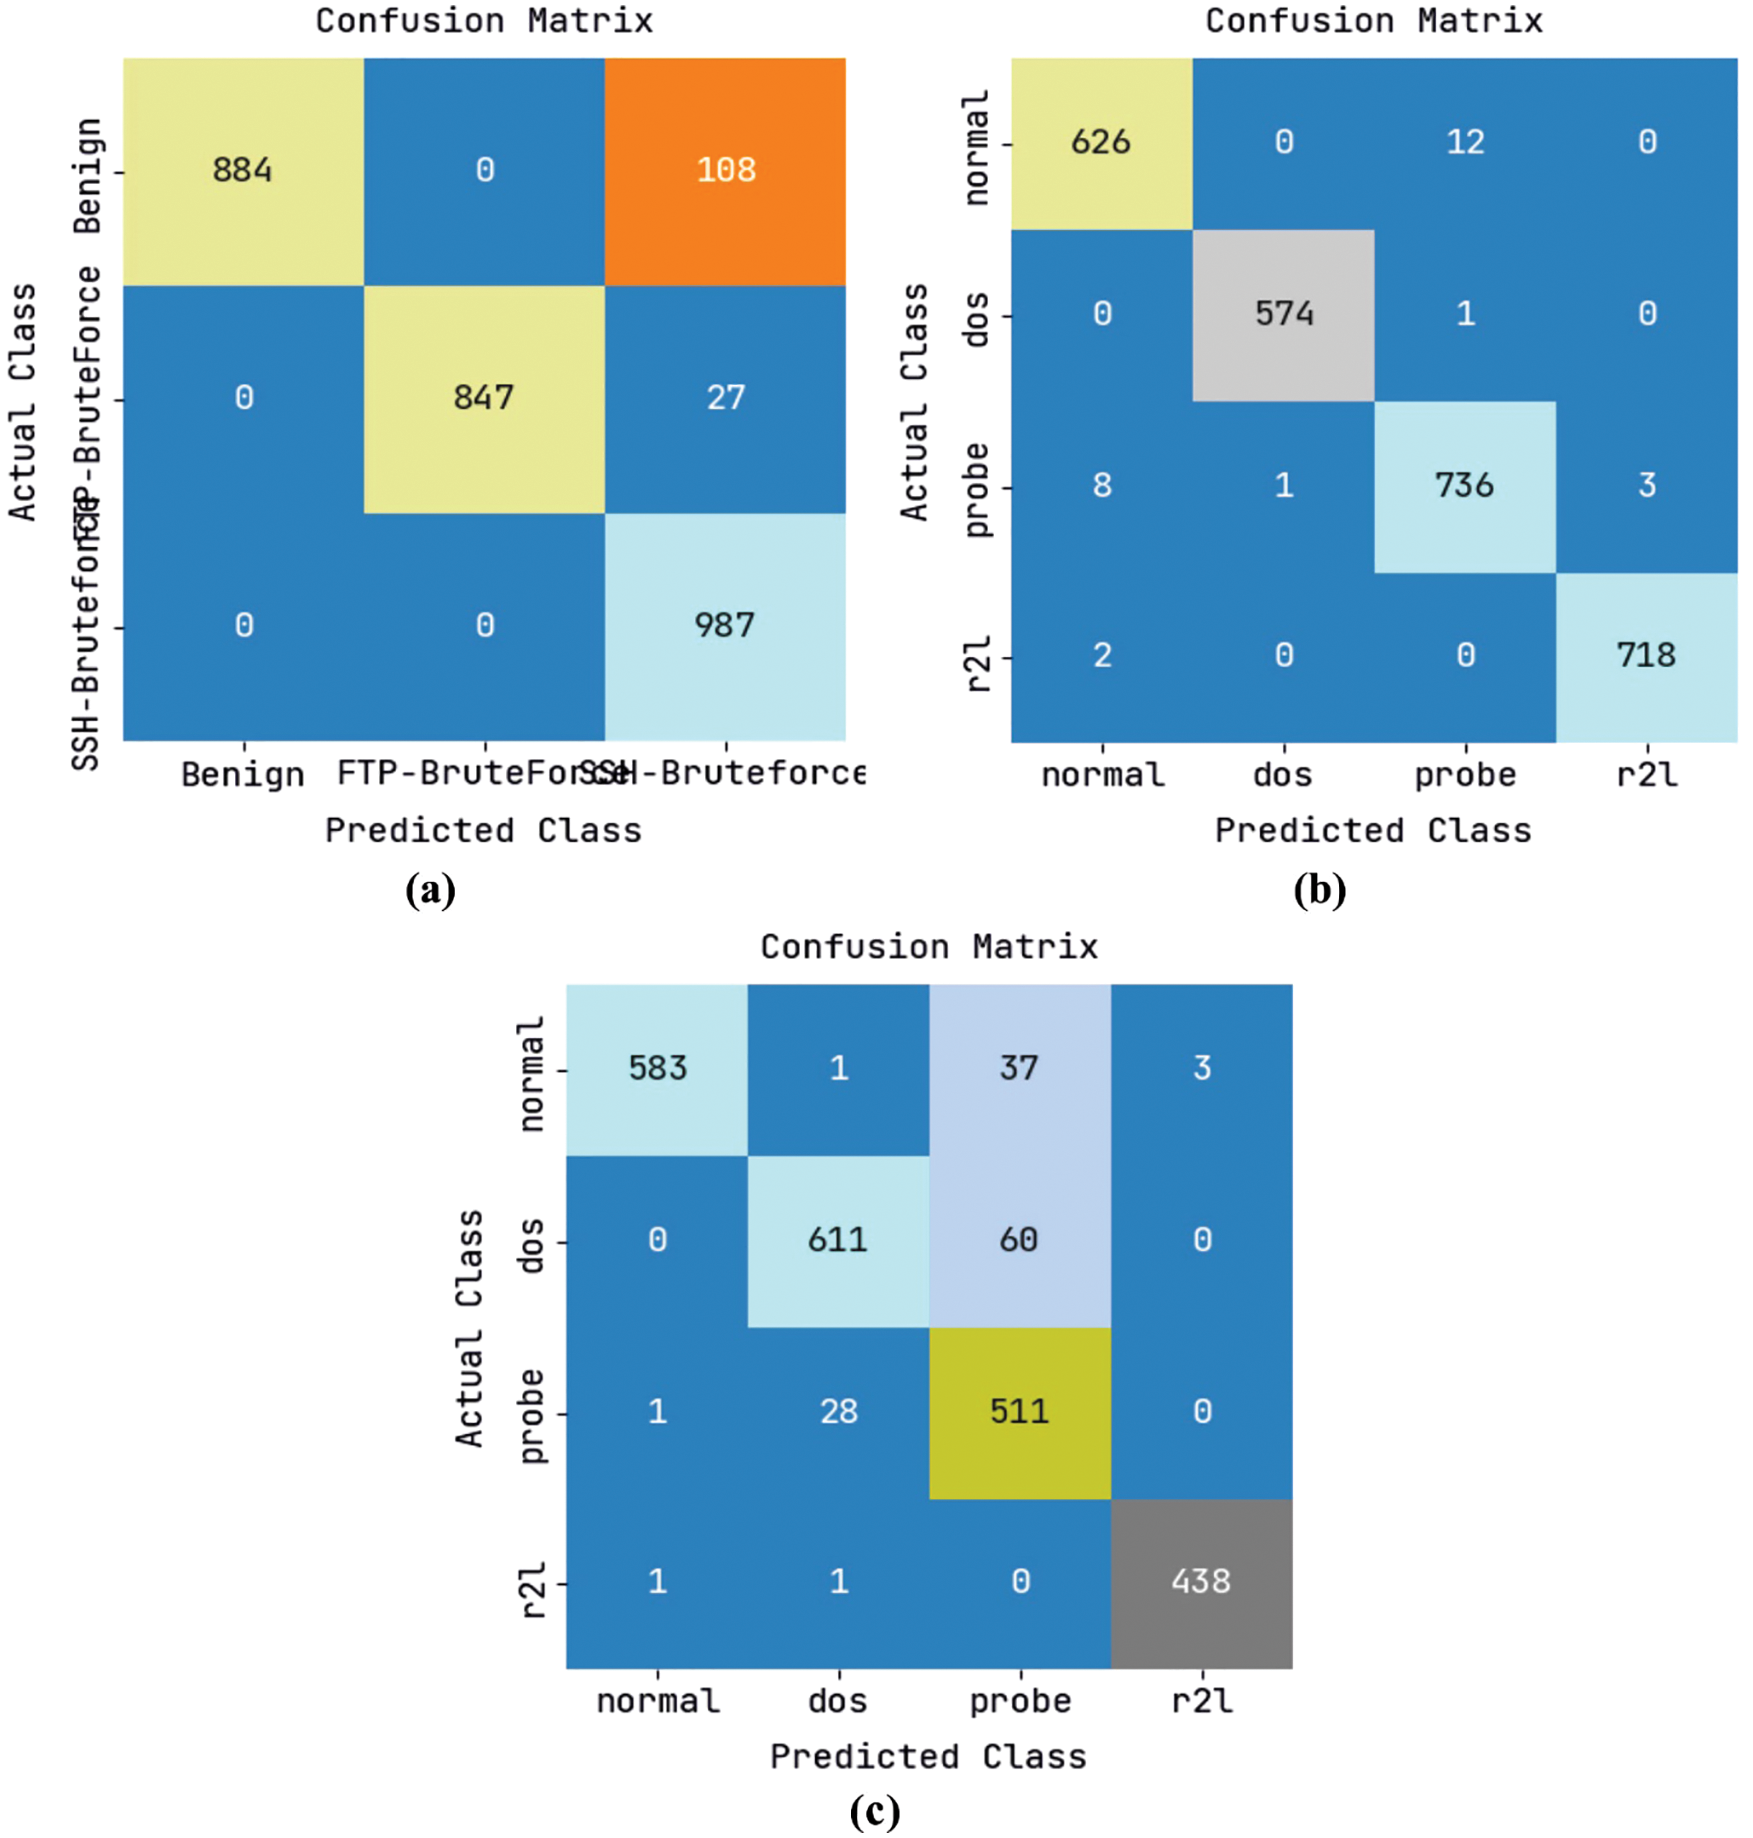
Figure 4: Confusion matrix (a) CICIDS 2018 dataset (b) KDDCup 99 dataset (c) NSL-KDD dataset
A comprehensive precision-recall curve inspection of the ODFST-SDC model under three distinct datasets is portrayed in Fig. 5. The results indicated that the ODFST-SDC model has the ability to classify streaming data under all datasets. It is noticed that the precision-recall values attained by the ODFST-SDC model are found to be high in all datasets.
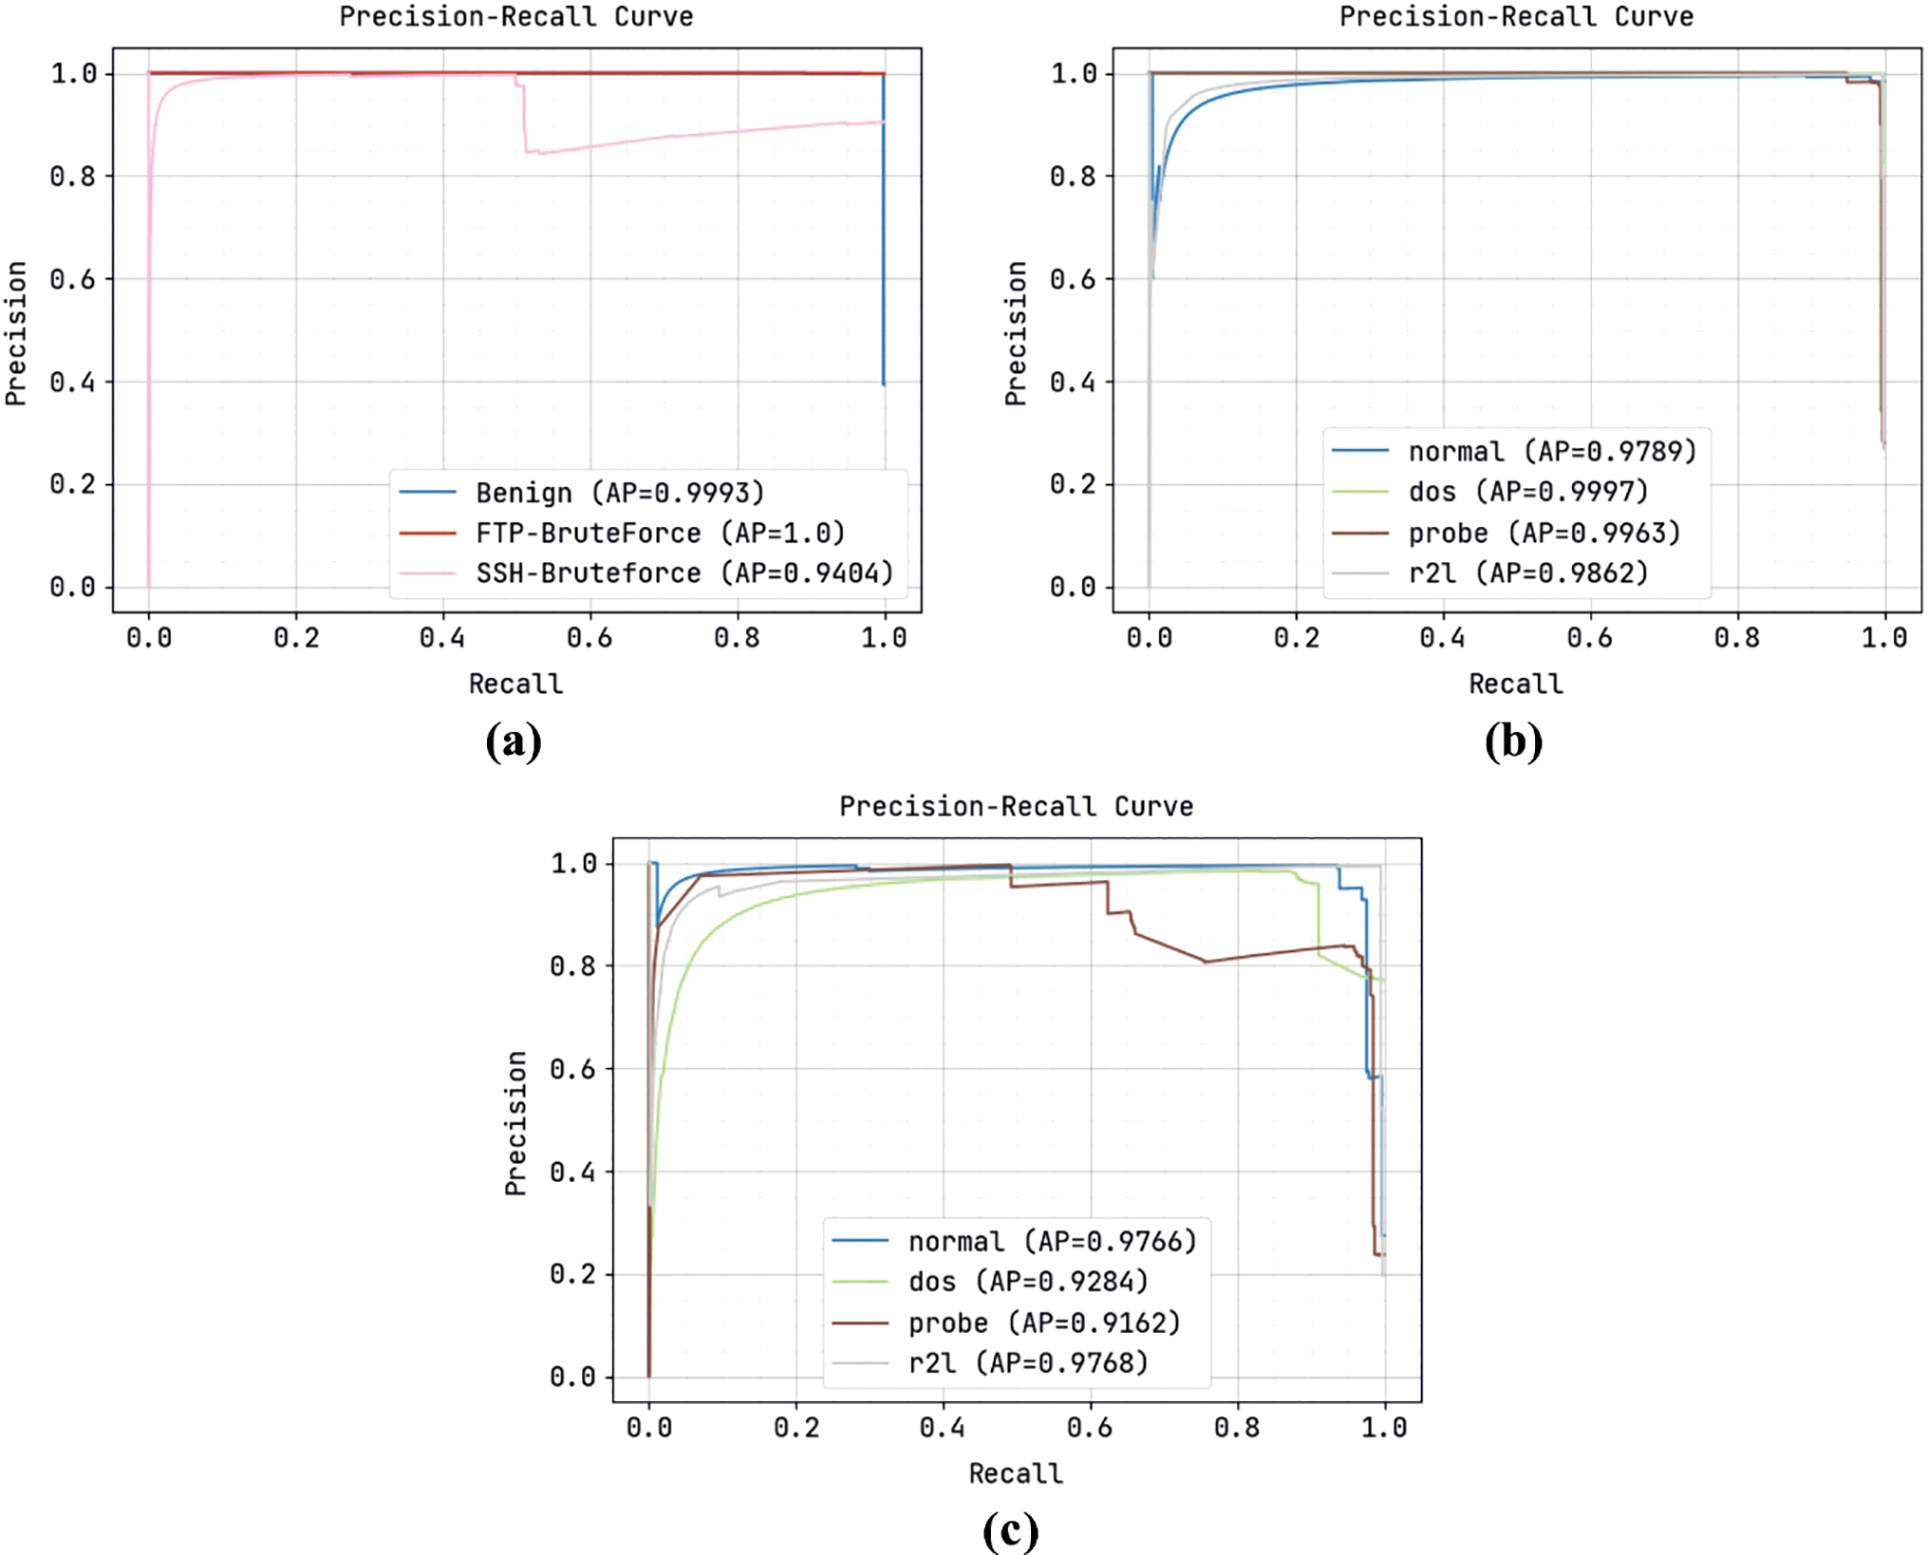
Figure 5: Precision recall curve (a) CICIDS 2018 dataset (b) KDDCup 99 dataset (c) NSL-KDD dataset
Fig. 6 illustrates a set of ROC curves generated by the ODFST-SDC model on the classification of three distinct datasets. Fig. 6a shows that the ODFST-SDC model has classified the CICIDS 2018 dataset with ROC values of 0.9991, 1.0, and 0.9735 under benign, FTP-BruteForce, and SSH-BruteForce classes respectively. Fig. 6b displays that the ODFST-SDC model has classified the KDDCup 99 dataset with ROC values of 0.9984, 0.9999, 0.996, and 0.9975 under normal, dos, probe, and r2l classes respectively. Fig. 6c indicates that the ODFST-SDC model has classified the NSL-KDD dataset with ROC values of 0.9892, 0.9851, 0.966, and 0.9957 under normal, dos, probe, and r2l classes respectively.
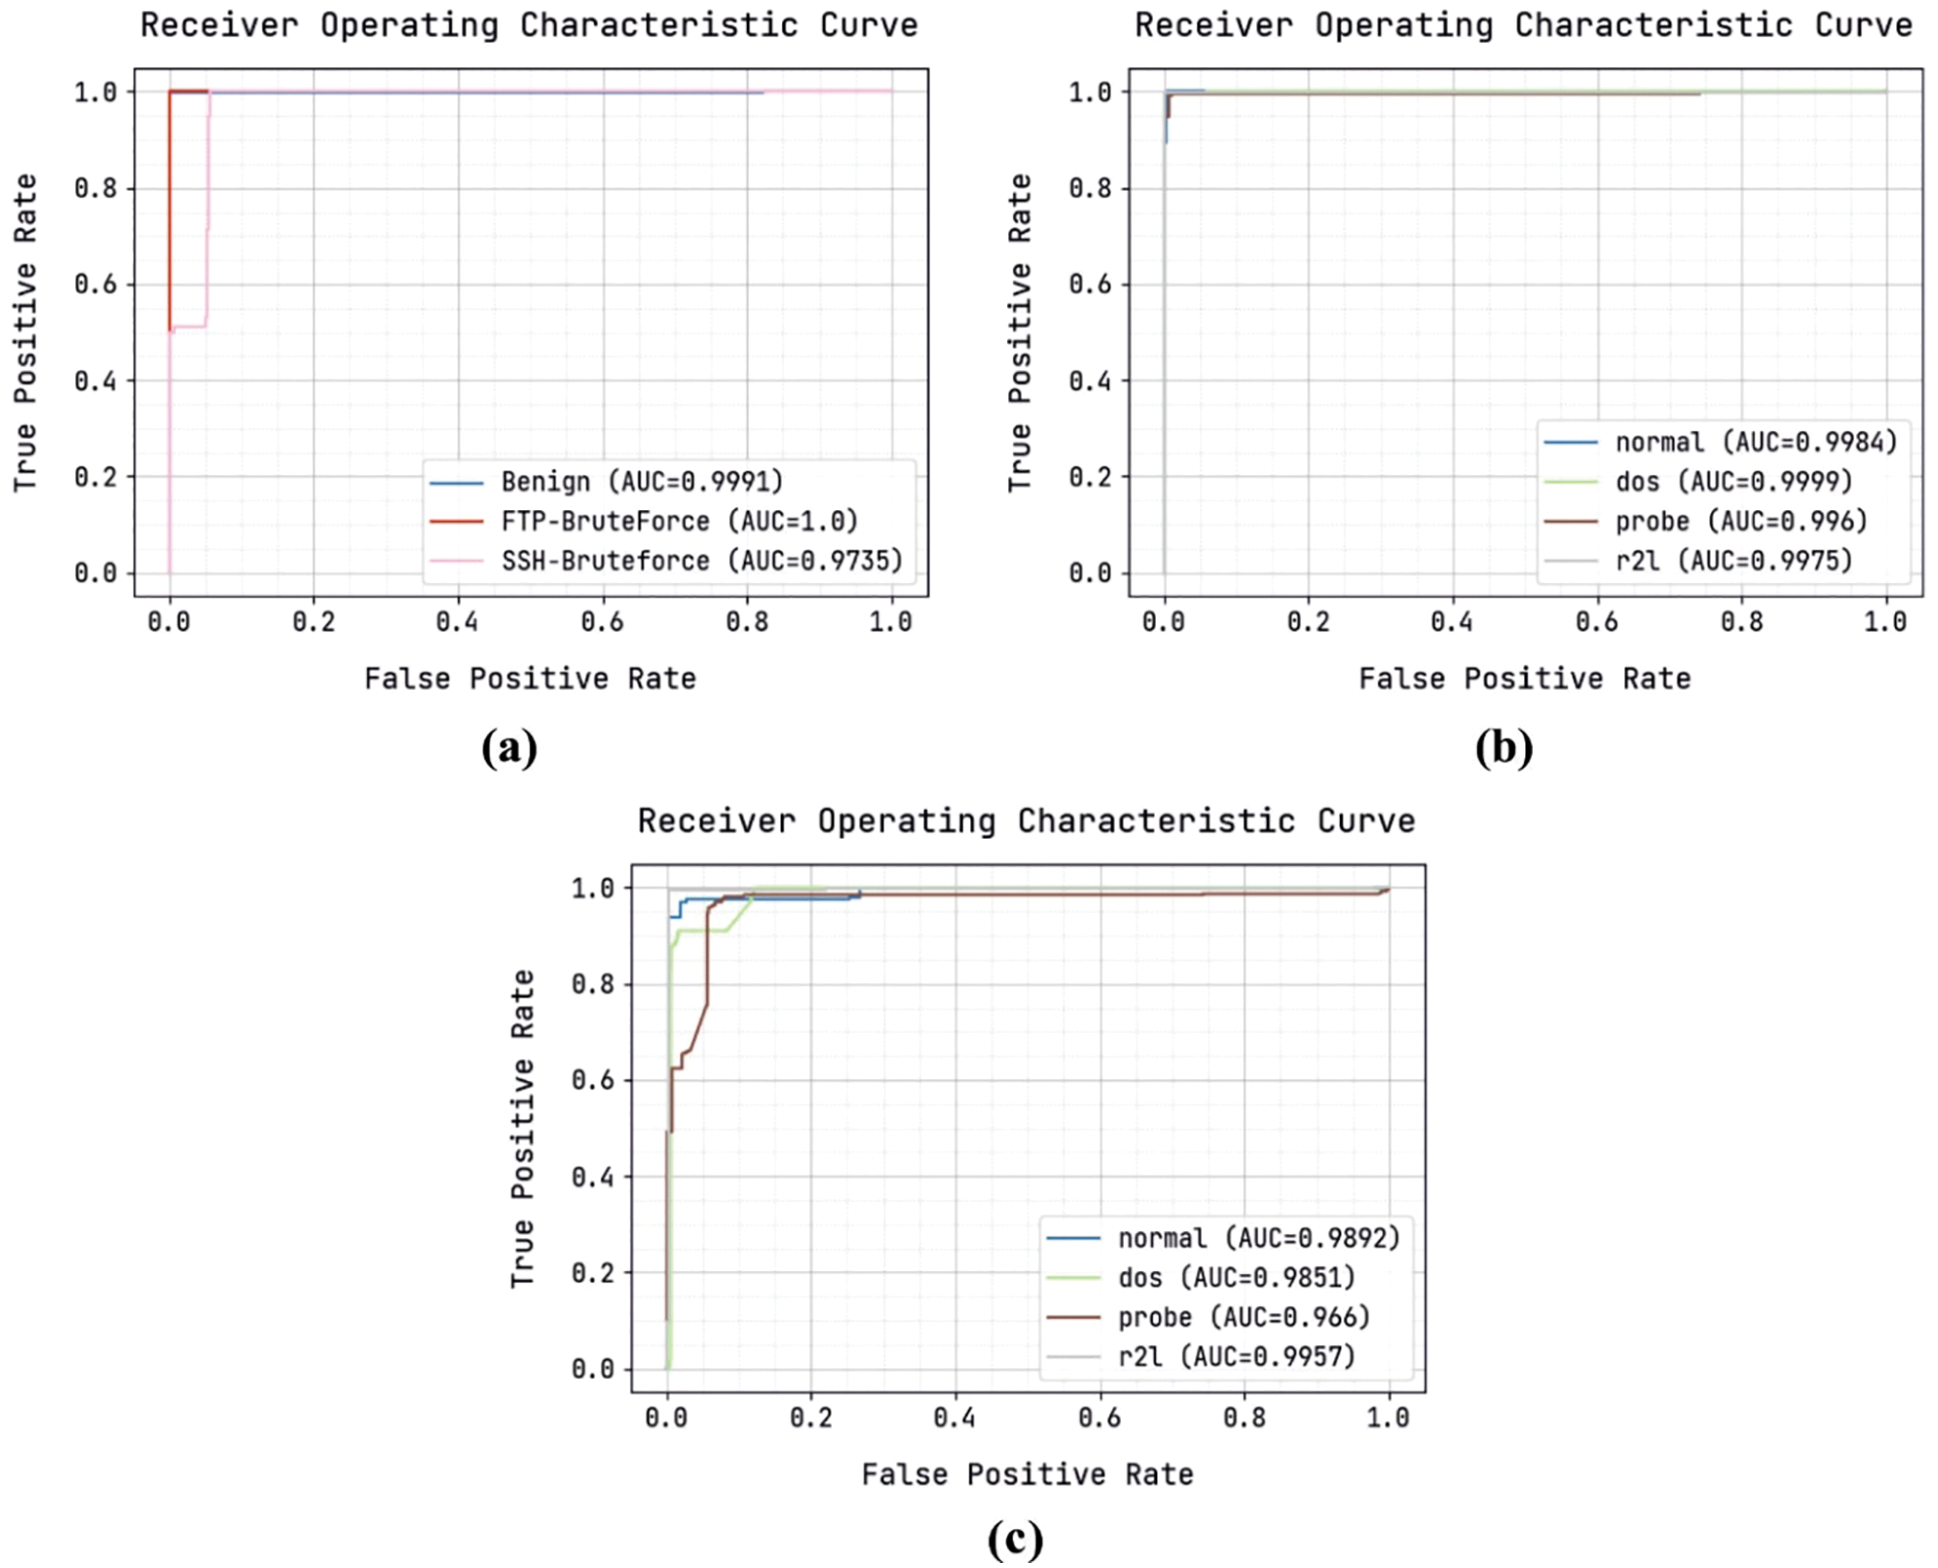
Figure 6: ROC analysis (a) CICIDS 2018 dataset (b) KDDCup 99 dataset (c) NSL-KDD dataset
Tab. 1 reports the overall classification outcomes offered by the ODFST-SDC model on three benchmark datasets interms of different measures. Fig. 7 depicts the
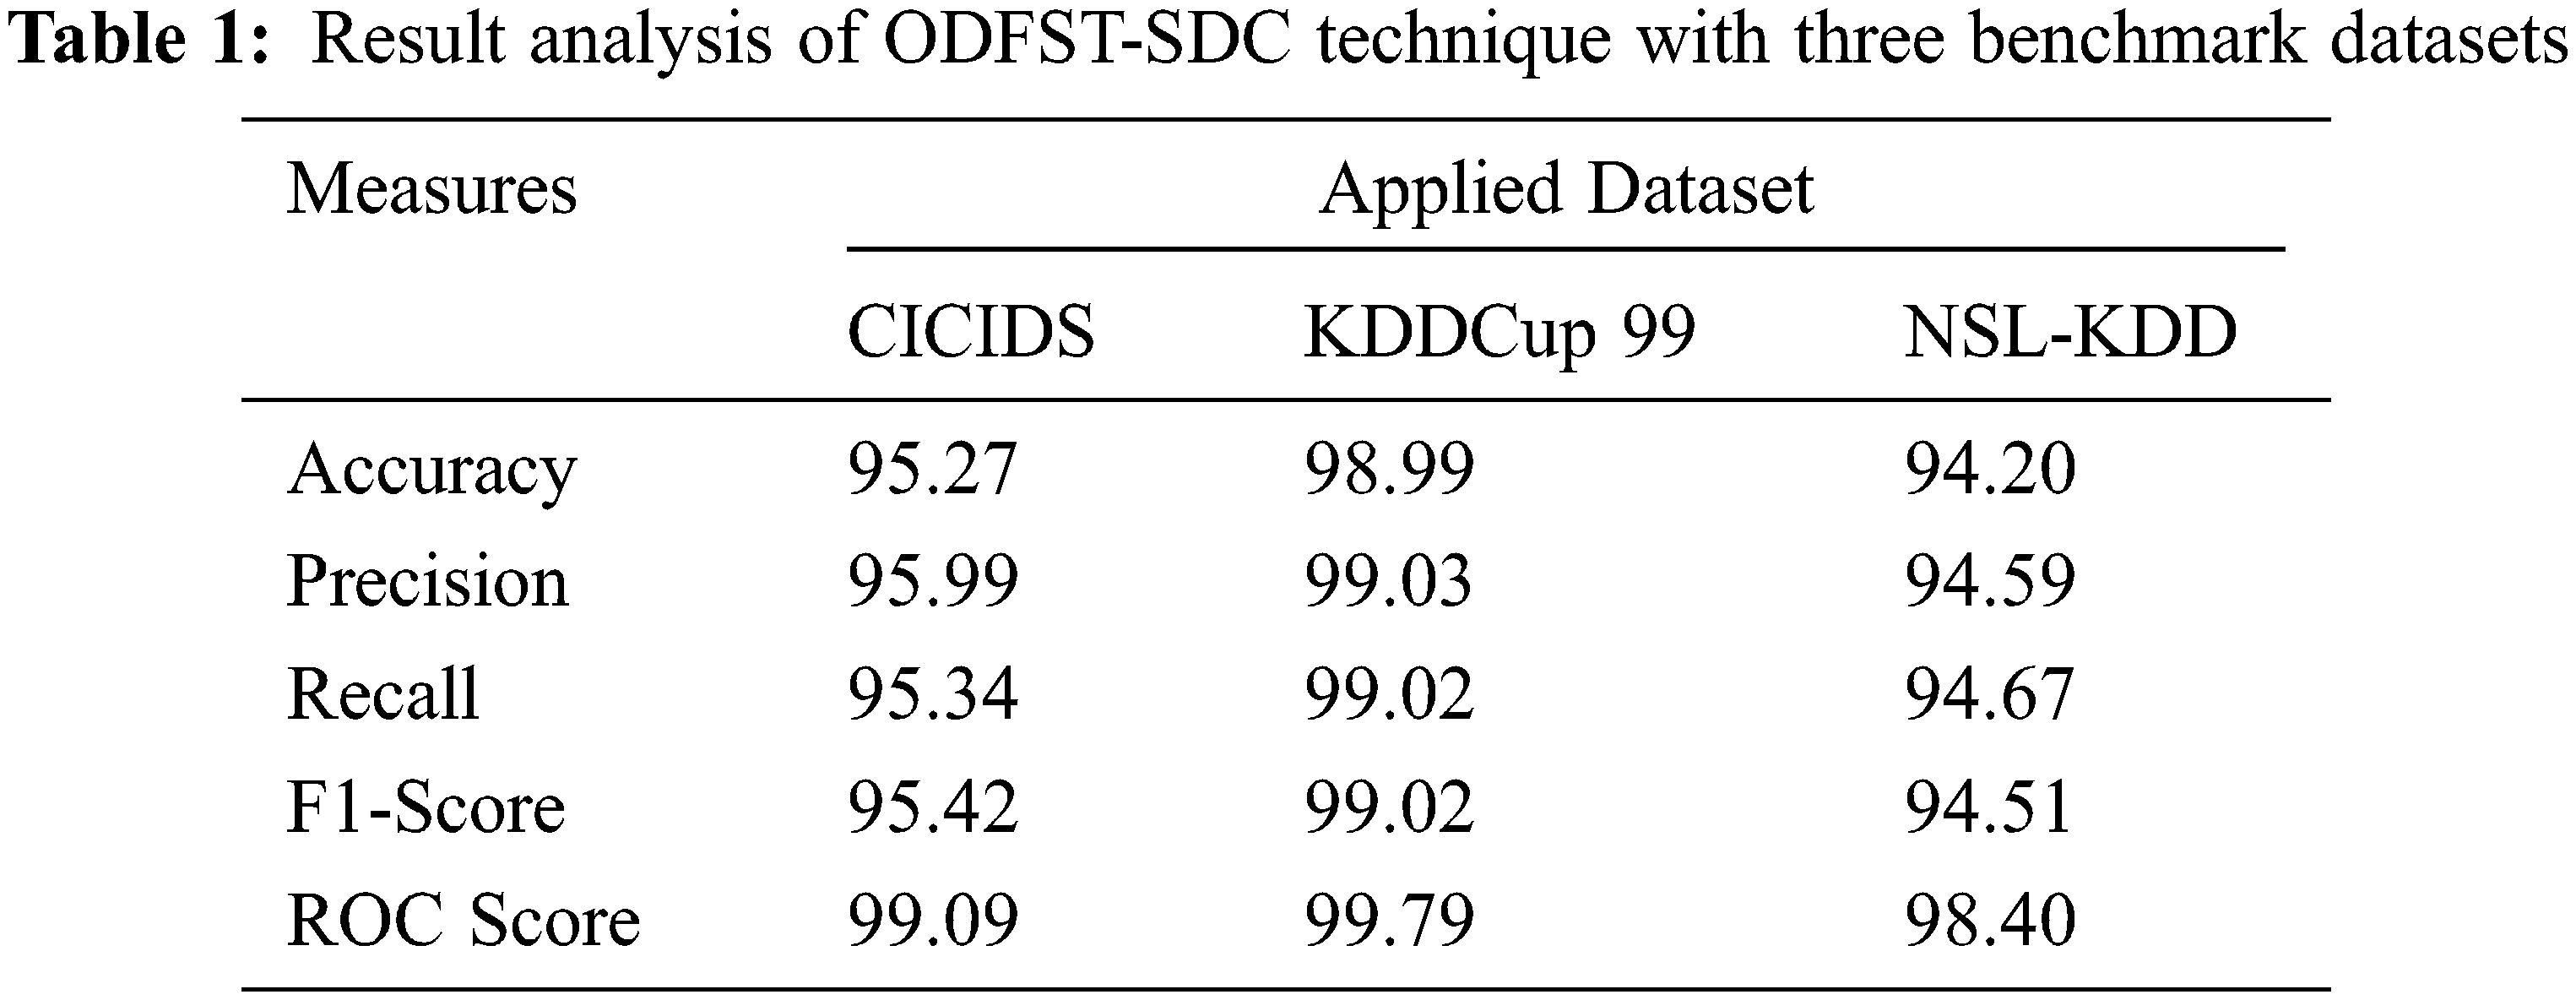
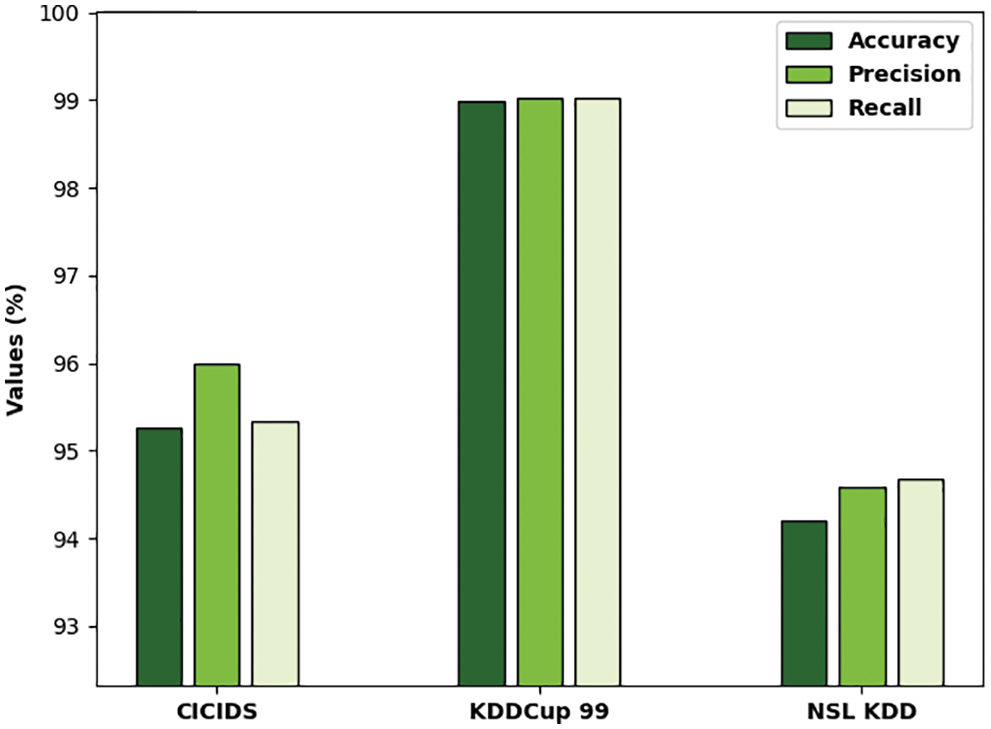
Figure 7: Result analysis of ODFST-SDC technique interms of distinct measures
Fig. 8 portrays the
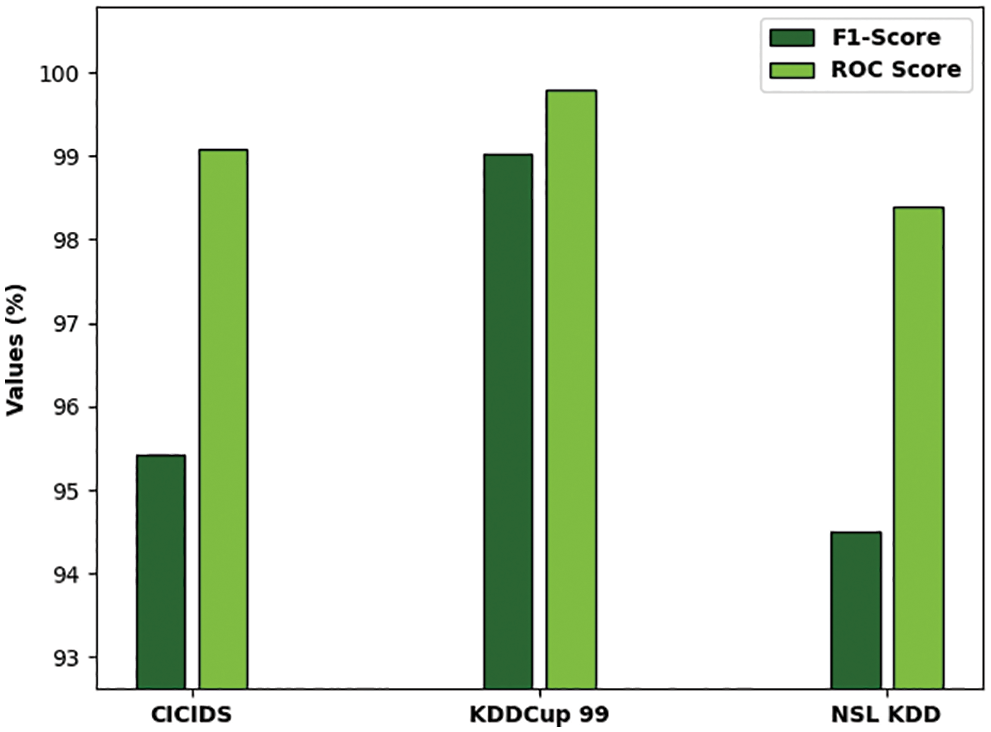
Figure 8:
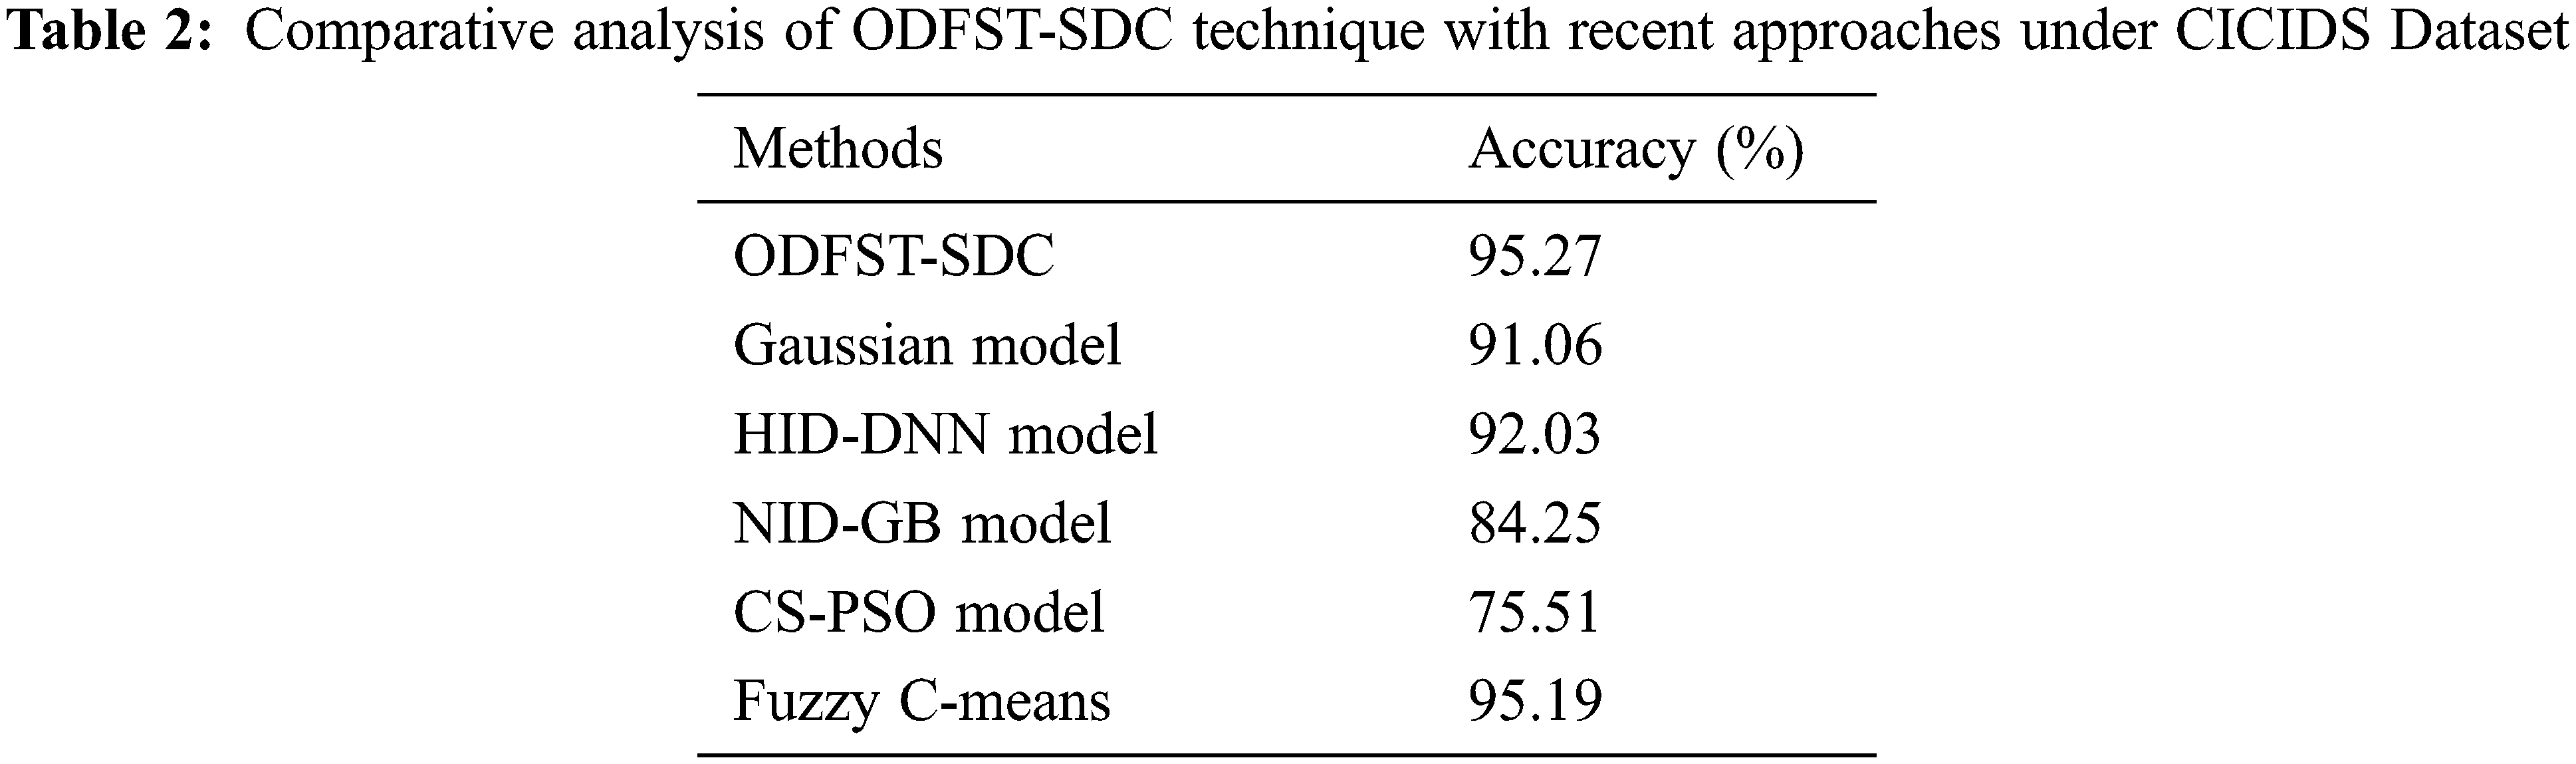
Tab. 2 offers a detailed comparative
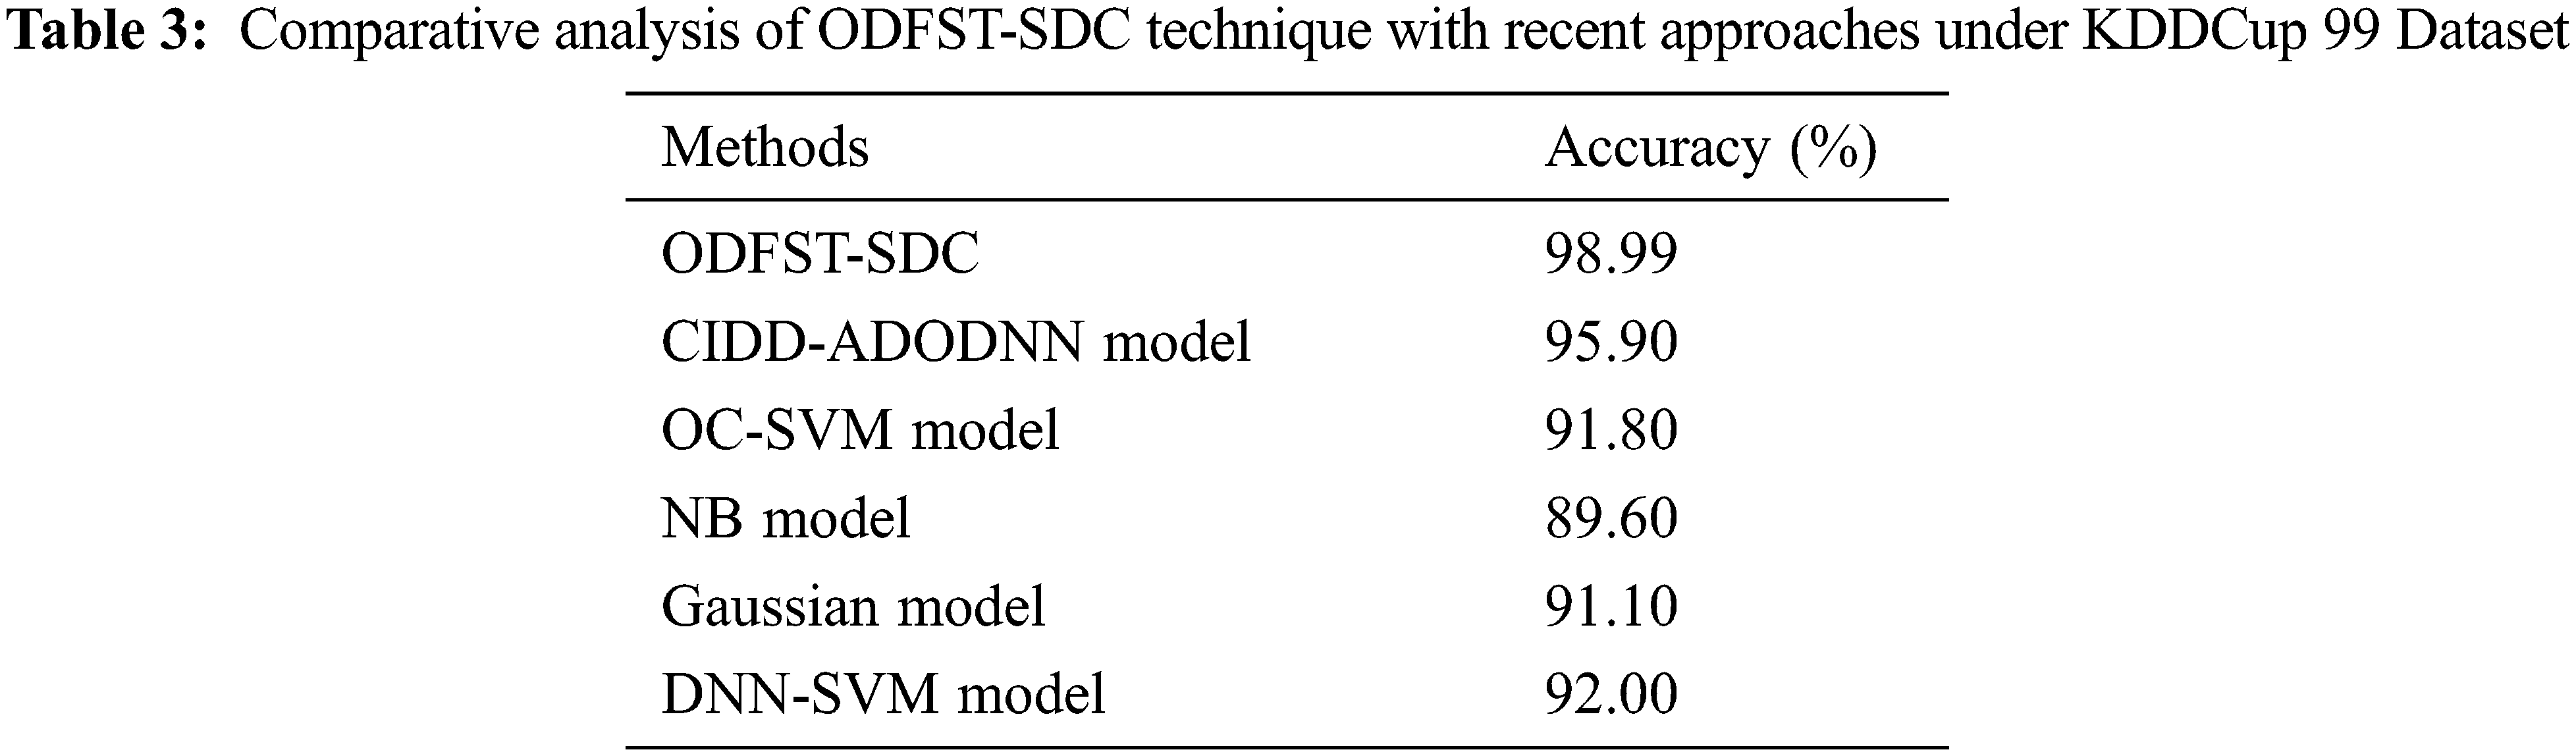
Tab. 3 provides a comprehensive comparison
Tab. 4 exhibit a brief comparative
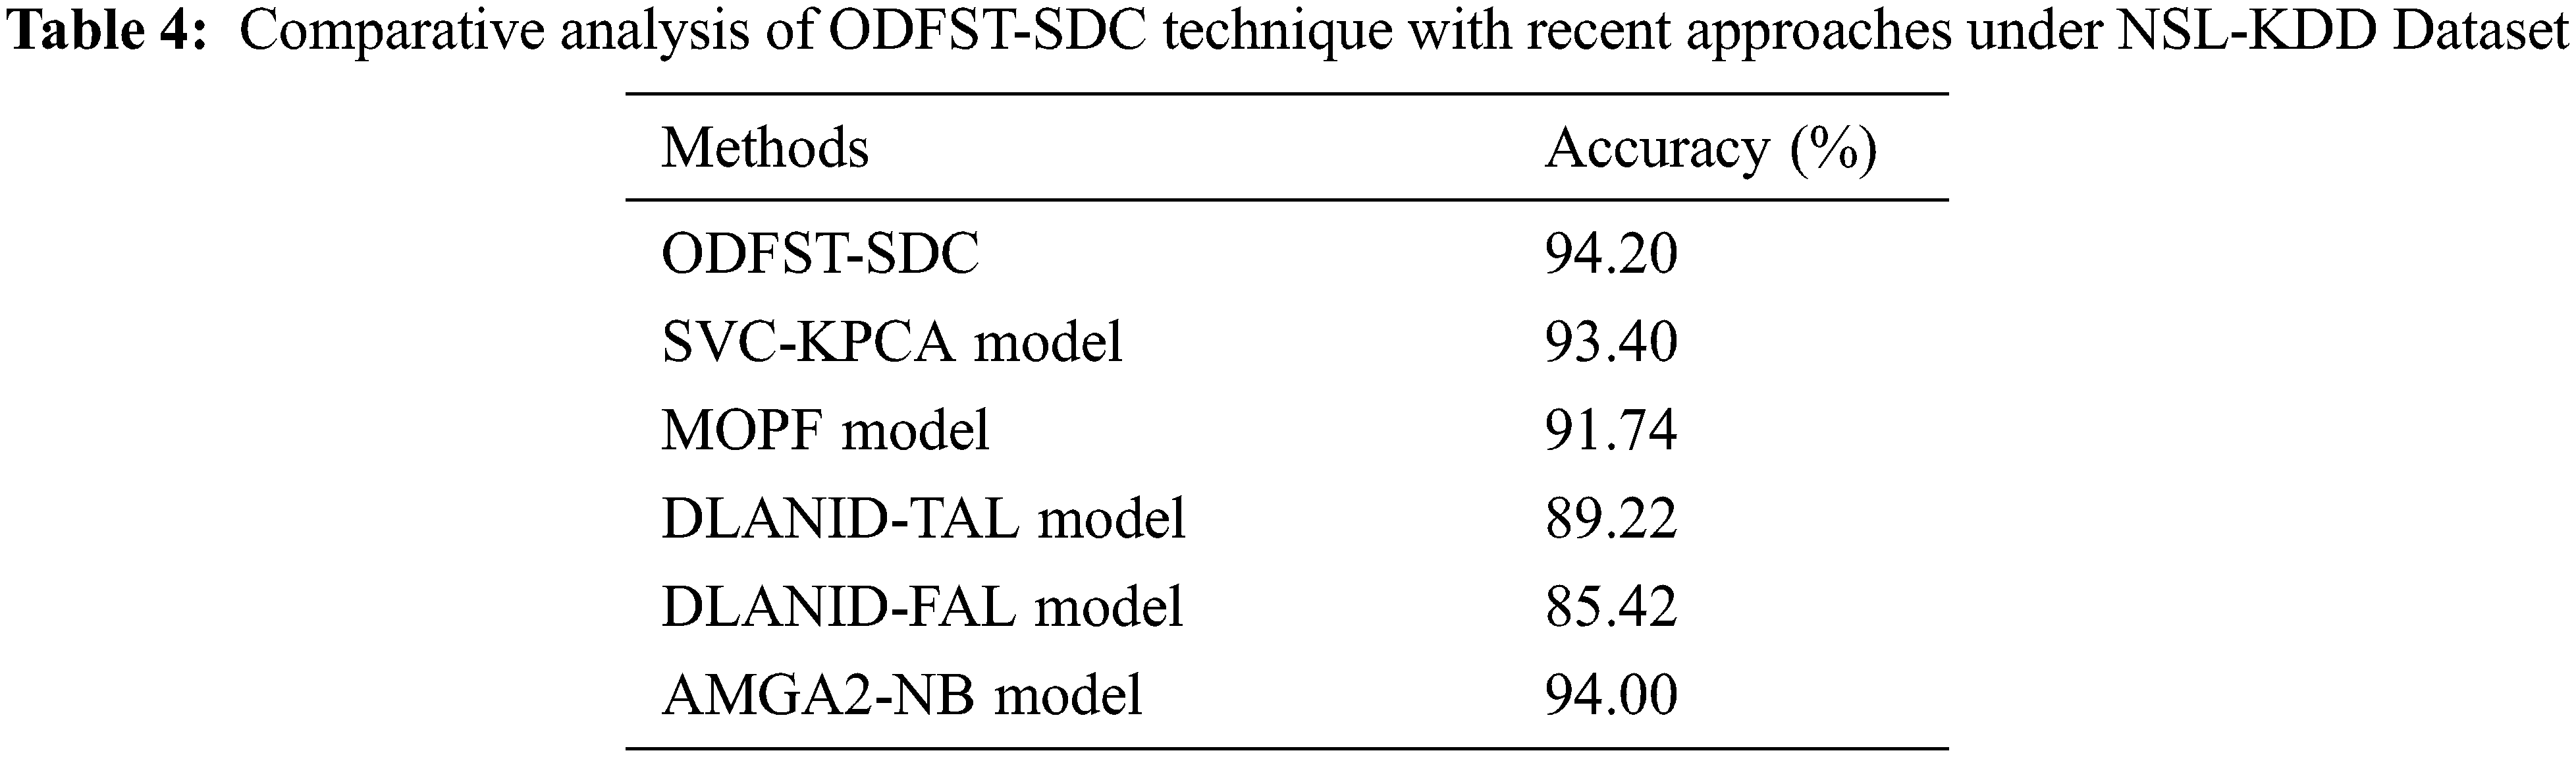
Along with that, the MOPF and SVC-KPCA models have portrayed certainly enhanced
In this study, a novel ODFST-SDC approach was developed for streaming data classification. The proposed ODFST-SDC technique incorporates different processes namely pre-processing, LOCI based outlier detection, RDA based FS, and KELM based classification. Firstly, the streaming data is pre-processed in such way that the categorical encoding and null value removal process is carried out. Next, the RDA is applied to choose an optimal subset of features and finally, KELM method is utilized for streaming data classification. The application of LOCI based outlier removal and RDA based election of features help to considerably improve the streaming data classification outcomes. For assessing the enhanced streamlining data classification results of the ODFST-SDC technique, a wide range of simulations were carried out against three benchmark datasets. The experimental results reported the promising outcomes of the ODFST-SDC technique over the recent approaches with maximum accuracy of 94.20% on NSL-KDD dataset. In future, concept drift problem can be handled in the streaming data classification process.
Funding Statement: The authors received no specific funding for this study.
Conflicts of Interest: The authors declare that they have no conflicts of interest to report regarding the present study.
1. H. Hu, M. Kantardzic and T. S. Sethi, “No free lunch theorem for concept drift detection in streaming data classification: A review,” WIREs Data Mining and Knowledge Discovery, vol. 10, no. 2, pp. 1, 2020. [Google Scholar]
2. A. L. Amutha, R. A. Uthra, J. P. Roselyn and R. G. Brunet, “Streaming data classification using hybrid classifiers to tackle stability-plasticity dilemma and concept drift,” in 2020 IEEE 4th Conf. on Information & Communication Technology (CICT), Chennai, India, pp. 1–10, 2020. [Google Scholar]
3. W. Sun, G. Z. Dai, X. R. Zhang, X. Z. He and X. Chen, “TBE-Net: A three-branch embedding network with part-aware ability and feature complementary learning for vehicle re-identification,” IEEE Transactions on Intelligent Transportation Systems, pp. 1–13, 2021. https://doi.org/10.1109/TITS.2021.3130403. [Google Scholar]
4. W. Sun, L. Dai, X. R. Zhang, P. S. Chang and X. Z. He, “RSOD: Real-time small object detection algorithm in UAV-based traffic monitoring,” Applied Intelligence, vol. 92, no. 6, pp. 1–16, 2021. [Google Scholar]
5. M. Rashid, A. Hamid and S. A. Parah, “Analysis of streaming data using big data and hybrid machine learning approach,” in Handbook of Multimedia Information Security: Techniques and Applications, Springer, Cham, pp. 629–643, 2019. [Google Scholar]
6. S. K. Punia, M. Kumar, T. Stephan, G. G. Deverajan and R. Patan, “Performance analysis of machine learning algorithms for big data classification: ML and AI-based algorithms for big data analysis,” International Journal of E-Health and Medical Communications, vol. 12, no. 4, pp. 60–75, 2021. [Google Scholar]
7. I. Kontopoulos, A. Makris and K. Tserpes, “A deep learning streaming methodology for trajectory classification,” International Journal of Geo-Information, vol. 10, no. 4, pp. 250, 2021. [Google Scholar]
8. R. F. Mansour, S. Al-Otaibi, A. Al-Rasheed, H. Aljuaid, I. V. Pustokhina et al., “An optimal big data analytics with concept drift detection on high-dimensional streaming data,” Computers, Materials & Continua, vol. 68, no. 3, pp. 2843–2858, 2021. [Google Scholar]
9. S. Priya and R. A. Uthra, “Deep learning framework for handling concept drift and class imbalanced complex decision-making on streaming data,” Complex Intelligent Systems, vol. 27, no. 4, pp. 2886, 2021. [Google Scholar]
10. M. Heigl, K. A. Anand, A. Urmann, D. Fiala, M. Schramm et al., “On the improvement of the isolation forest algorithm for outlier detection with streaming data,” Electronics, vol. 10, no. 13, pp. 1534, 2021. [Google Scholar]
11. F.-Z. Benjelloun, A. Oussous, A. Bennani, S. Belfkih and A. Ait Lahcen, “Improving outliers detection in data streams using LiCS and voting,” Journal of King Saud University - Computer and Information Sciences, vol. 33, no. 10, pp. 1177–1185, 2021. [Google Scholar]
12. Z. Yang, I. A. Abbasi, E. E. Mustafa, S. Ali and M. Zhang, “An anomaly detection algorithm selection service for IoT stream data based on Tsfresh tool and genetic algorithm,” Security and Communication Networks, vol. 2021, pp. 1–10, 2021. [Google Scholar]
13. M. Heigl, E. Weigelt, D. Fiala and M. Schramm, “Unsupervised feature selection for outlier detection on streaming data to enhance network security,” Applied Sciences, vol. 11, no. 24, pp. 12073, 2021. [Google Scholar]
14. X. Gu, “An explainable semi-supervised self-organizing fuzzy inference system for streaming data classification,” Information Sciences, vol. 583, no. 1, pp. 364–385, 2022. [Google Scholar]
15. J. R. Bertini Junior and M. do C. Nicoletti, “An iterative boosting-based ensemble for streaming data classification,” Information Fusion, vol. 45, no. 2, pp. 66–78, 2019. [Google Scholar]
16. X. Gu, P. Angelov and Z. Zhao, “Self-organizing fuzzy inference ensemble system for big streaming data classification,” Knowledge-Based Systems, vol. 218, no. 2, pp. 106870, 2021. [Google Scholar]
17. A. L. Amutha, R. A. Uthra, J. P. Roselyn and R. G. Brunet, “Classification of anomalies in multivariate streaming phasor measurement unit data using supervised and clustering ensemble techniques,” in 2021 5th Int. Conf. on Electronics, Communication and Aerospace Technology (ICECA), Coimbatore, India, pp. 1460–1466, 2021. [Google Scholar]
18. S. Papadimitriou, H. Kitagawa, P. B. Gibbons and C. Faloutsos, “LOCI: Fast outlier detection using the local correlation integral,” in Proc. 19th Int. Conf. on Data Engineering (Cat. No.03CH37405), Bangalore, India, pp. 315–326, 2003. [Google Scholar]
19. A. M. Fathollahi-Fard, M. Hajiaghaei-Keshteli and R. Tavakkoli-Moghaddam, “Red deer algorithm (RDAA new nature-inspired meta-heuristic,” Soft Computing, vol. 24, no. 19, pp. 14637–14665, 2020. [Google Scholar]
20. R. A. Zitar, L. Abualigah and N. A. Al-Dmour, “Review and analysis for the red deer algorithm,” Journal of Ambient Intelligence and Humanized Computing, vol. 20, no. 10, pp. 1, 2021. [Google Scholar]
21. K. Kardani and A. Bolhassani, “Cppsite 2.0: An available database of experimentally validated cell-penetrating peptides predicting their secondary and tertiary structures,” Journal of Molecular Biology, vol. 433, no. 11, pp. 166703, 2021. [Google Scholar]
22. R. Panigrahi, S. Borah, A. K. Bhoi, M. F. Ijaz, M. Pramanik et al., “A consolidated decision tree-based intrusion detection system for binary and multiclass imbalanced datasets,” Mathematics, vol. 9, no. 7, pp. 751, 2021. [Google Scholar]
23. Z. Chiba, N. Abghour, K. Moussaid, A. El omri and M. Rida, “Intelligent approach to build a deep neural network based IDS for cloud environment using combination of machine learning algorithms,” Computers & Security, vol. 86, no. 3, pp. 291–317, 2019. [Google Scholar]
 | This work is licensed under a Creative Commons Attribution 4.0 International License, which permits unrestricted use, distribution, and reproduction in any medium, provided the original work is properly cited. |