DOI:10.32604/iasc.2023.028996
| Intelligent Automation & Soft Computing DOI:10.32604/iasc.2023.028996 | |
| Article |
Multilevel Augmentation for Identifying Thin Vessels in Diabetic Retinopathy Using UNET Model
1Faculty of Computer Science and Engineering, Sathyabama Institute of Science and Technology, Chennai, 600119, India
2Department of Computer Science and Engineering, St. Joseph’s Institute of Technology, Chennai, 600119, India
*Corresponding Author: A. Deepak Kumar. Email: a.deepakkumar.8@gmail.com
Received: 22 February 2022; Accepted: 12 April 2022
Abstract: Diabetic Retinopathy is a disease, which happens due to abnormal growth of blood vessels that causes spots on the vision and vision loss. Various techniques are applied to identify the disease in the early stage with different methods and parameters. Machine Learning (ML) techniques are used for analyzing the images and finding out the location of the disease. The restriction of the ML is a dataset size, which is used for model evaluation. This problem has been overcome by using an augmentation method by generating larger datasets with multidimensional features. Existing models are using only one augmentation technique, which produces limited features of dataset and also lacks in the association of those data during DR detection, so multilevel augmentation is proposed for analysis. The proposed method performs in two phases namely integrated augmentation model and dataset correlation (i.e. relationships). It eliminates over fitting problem by considering relevant dataset. This method is used for solving the Diabetic Retinopathy problem with a thin vessel identification using the UNET model. UNET based image segmentation achieves 98.3% accuracy when compared to RV-GAN and different UNET models with high detection rate.
Keywords: Image segmentation; diabetic retinopathy; image augmentation; semantic segmentation; CNN
Diabetic retinopathy (DR) disease affects the human eye that causes the damage of blood vessels at the retina. Initially no symptoms present in the eye. Early symptoms of DR include issues like color perception, floaters, fuzziness and so on. DR is categorized into four stages namely Mild NR (Non-proliferative Retinopathy), moderate NR, Severe NR and Proliferative DR. The tiny bulges will develop over the Blood Vessels (BV) which leads blood leak from these vessels. The BV gets swell due to problem in blood circulation. This problem happens during the second stage of DR. Third stage of DR is a blockage in BV and the retina gets minimum blood. In this stage the development of BV is high which leads to vision problems. The last stage of the DR is a high severity problem because of enormous BV growth and fluid leakage from eye. The fake BV identification is a challenging process which will be addressed by using advanced methodologies and techniques. The major process of DR over BV is image segmentation. The blood vessels are narrow with low contrast. Fig. 1 shows the normal eye of the human. Diabetic Retinopathy eye is represented in Fig. 2.
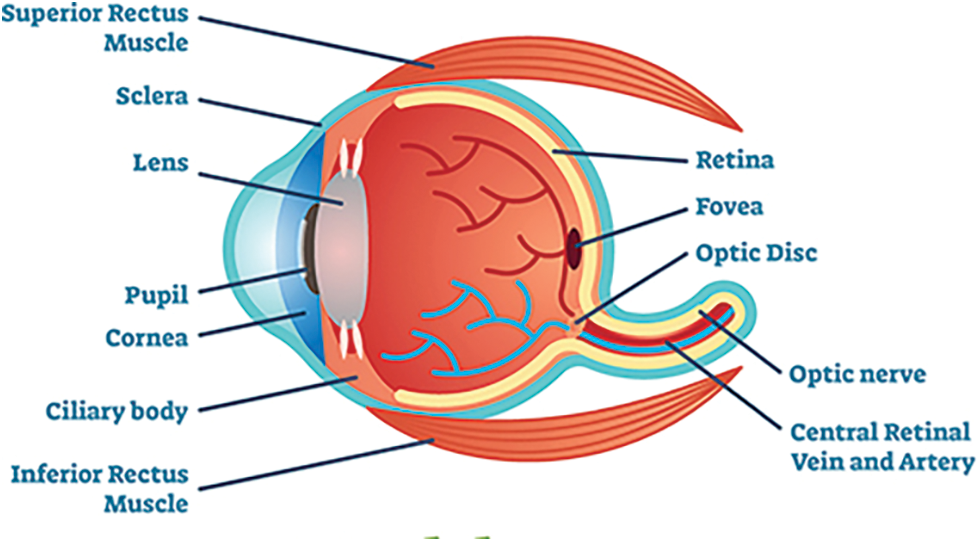
Figure 1: Normal human eye
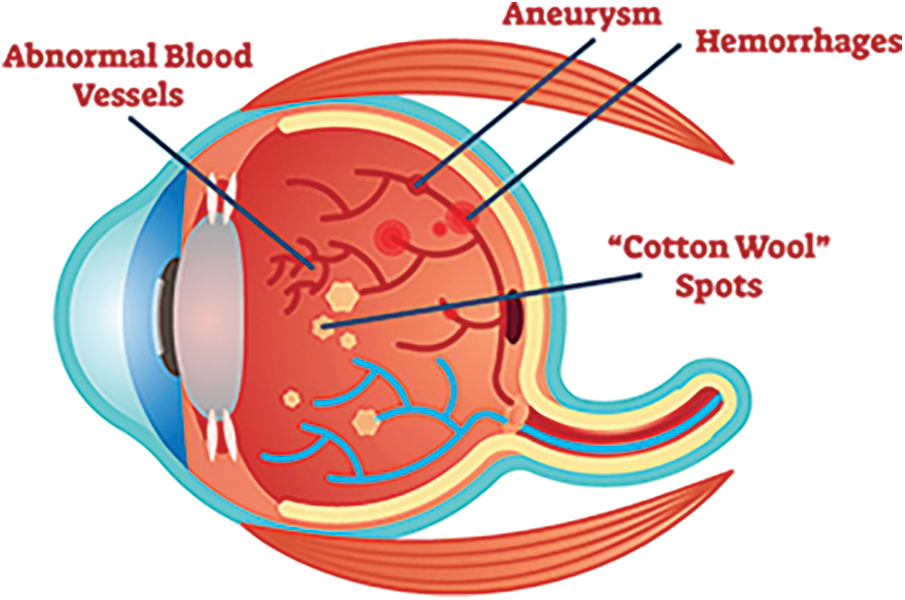
Figure 2: Diabetic retinopathy eye
The hessian matrix-based process is applied for BV segmentation by targeting green channels in the retinal image [1]. Microaneurysms presence is identified in the early stage which is a complex task in the medical domain. This leads to the high blood sugar level and microvascular problem. Deep learning methods are applied over fundus images for detecting the microaneurysm existence using image segmentation techniques [2]. Ophthalmologists use tools to diagnoses DR using segmentation of blood vessels on retinal images. Early detection prevents the patients by giving treatment whereas later detection causes blindness. The blood vessels are examined based on the curvature degree of vessels [3].
Computer based diagnosis provides the solution of DR detection with the support of deep learning. The problem faced by the learning models are insufficient training data and improper annotation. This problem is addressed by performing some tasks such as lesion-based segmentation, joint based segmentation and transfer learning-based identification [4]. Blood Vessels (BV) segmentation with automated solution needed for assisting the abnormal detection operation. There are two stages of the segmentation processes are carried out namely pre and post processing methods with improved result [5]. Machine learning methods reduced the user involvement during the vessel’s segmentation. The reliability problems arise due to the huge number of fake branches with a thin size. The loss function optimization is also a problem which will be addressed using a balancing level. An automatic Color Equalization (CE) method achieves clear, smooth retinal vessels and eliminates the false negative in the vessel’s branches [6].
Vessel segmentation is done in two modes namely interactive mode or manual mode which takes longer time to process. ELEMENT segmentation model extracts the features and classified the pixels across various regions and eliminates the inconsistencies in rapid rate. Blood flow restriction is identified based on the background organizations of the vessels by identifying the restriction point for assessing the blockage levels [7]. Unsupervised method with integrated model is implemented by selecting correct features on vessels during the segmentation. An intensity level transformation is applied for enhancing the details of the blood vessels. The threshold levels are fixed over the region parameters by eliminating the irrelevant vessels from the image. The contrast variations and enhancement are balanced by applying hybrid transformation models with thin vessels in a single pixel level [8].
The distances among the test patches are compared with the existing measures and also identify the center of the clusters. K-Means algorithms are used to fix the number of patches through manual effort [9]. DR is classified into various types Proliferative DR, mild, normal, moderate and severe. Traditional DR diagnosis faces problem during the encoding process in order to identify the underlying features to improve the accuracy rate. An ensemble based approach helps to identify the features with different levels [10]. The existing techniques uses DR detection without considering augmentation, so it leads to the accuracy problem. The main objective of the proposed model is to identify the thin blood vessels using integrated augmentation with correlation analysis.
Diabetic Retinopathy suffers minimal dataset problem which is solved by implementing augmentation process with deep learning. The images are collected from different sources and performed the preprocessing operation such as conversion, feature standardization, visible region enhancement and brightness control. The preprocessed images are as same as the collected images, so it will be enhanced by performing augmentation. The traditional algorithms use only a specific augmentation method which provides result with moderate performance and accuracy. The hybrid algorithms implemented over retinal images improves result with small variations because of using less number of augmentation methods for model evaluation. The proposed model uses large number of augmentation techniques for generating large number of datasets which will help the model for better prediction and accuracy. The thin vessels are identified based on various transformation over entire image region. The augmented datasets and related masks are used for UNET model evaluation. UNET has three layers namely encoding layer, bridge layer and decoding layer. The fully connected layer takes the result from decoding layer and produces the segmented result. Deep learning needs a large amount of data to achieve good accuracy to handle overfitting problems. Image collection is a tedious task because of various reasons includes labeling of images, expensive, legal issues and so on. The proposed augmentation model solves this process by generating the datasets itself which is used for improving the result of the segmentation. Fig. 3 provides a complete flow of the proposed segmentation process.
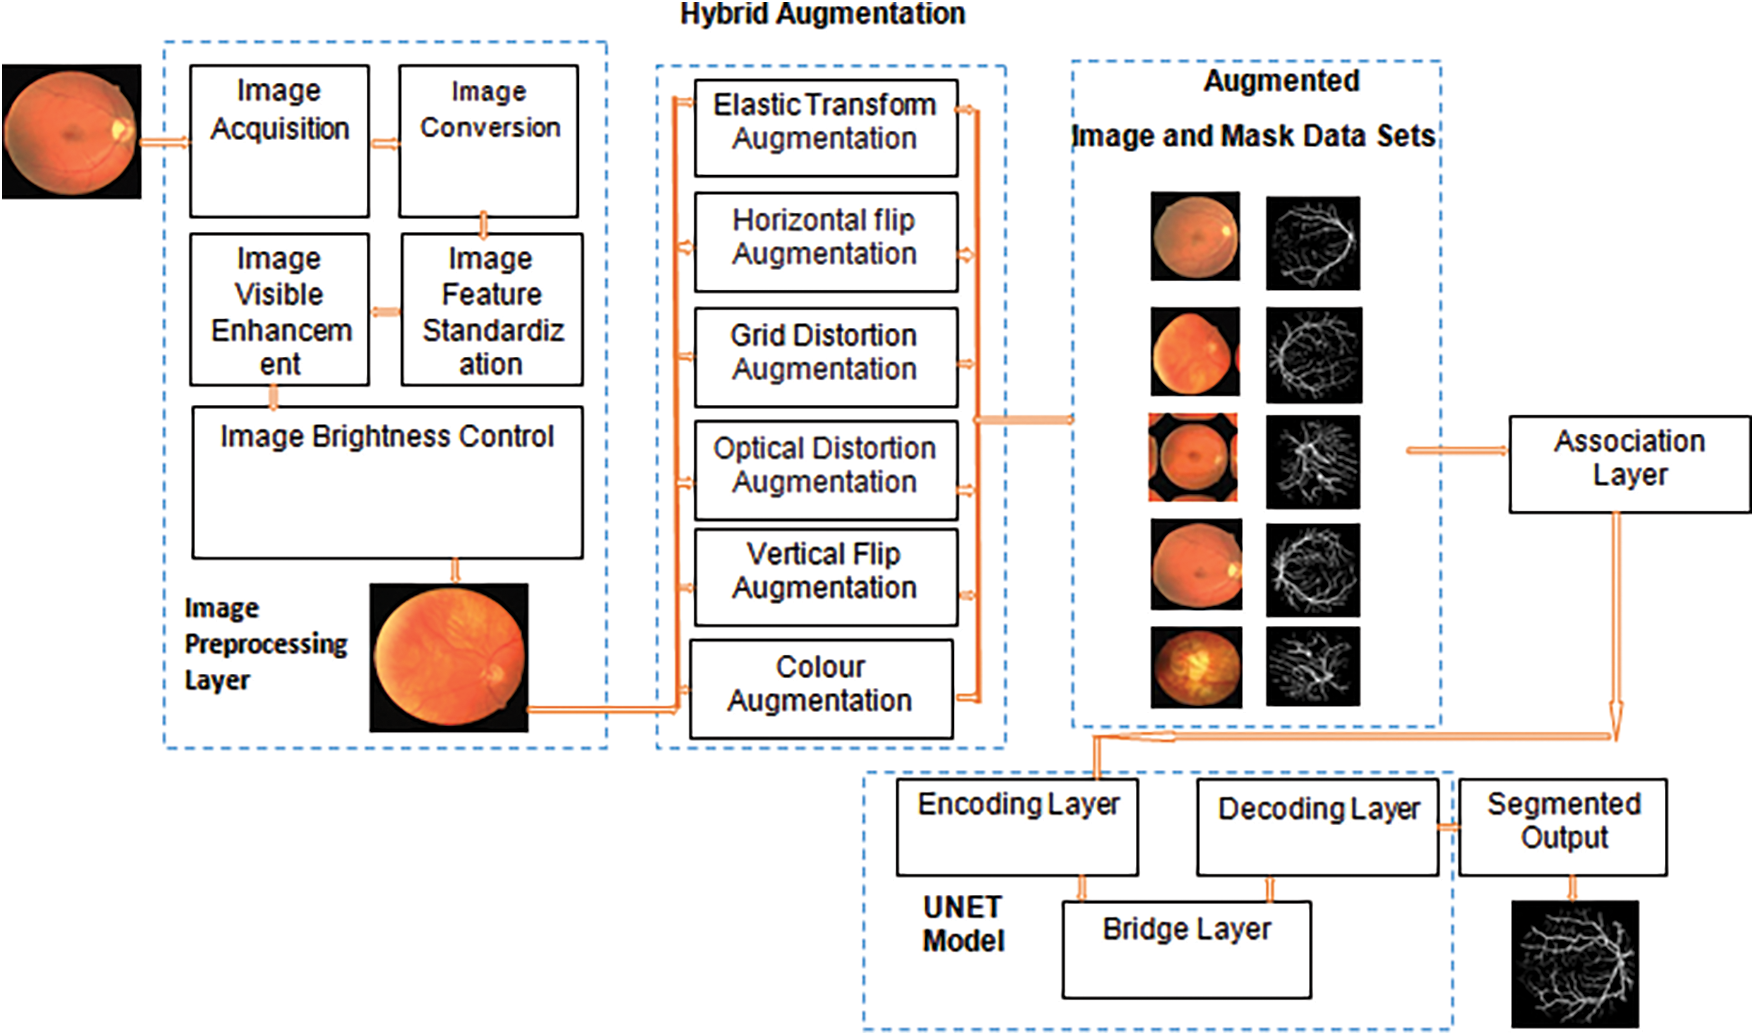
Figure 3: Hybrid augmentation model
Traditional augmentation methods are basic in nature which performs the operation like resizing the image, reflecting on the image and changing of RGB image channels. AlexNet, ResNet, Inception and EfficenceNet use these types of augmentation and achieve good performance. Thin BV segmentation process require different forms of augmentation so that, the detection of DR in early stage is feasible. The comparison of base augmentation and AutoAugment augmentation model accuracy comparison [11] is shown in Fig. 4. The algorithm1 provide the steps for associated augmentation process. The algorithm gets input image from respective sources and performs preprocessing operations. The hyper parameters are identified by performing an image augmentation process. UNET model incorporated associated augmented image for analysis and returns segmented result.
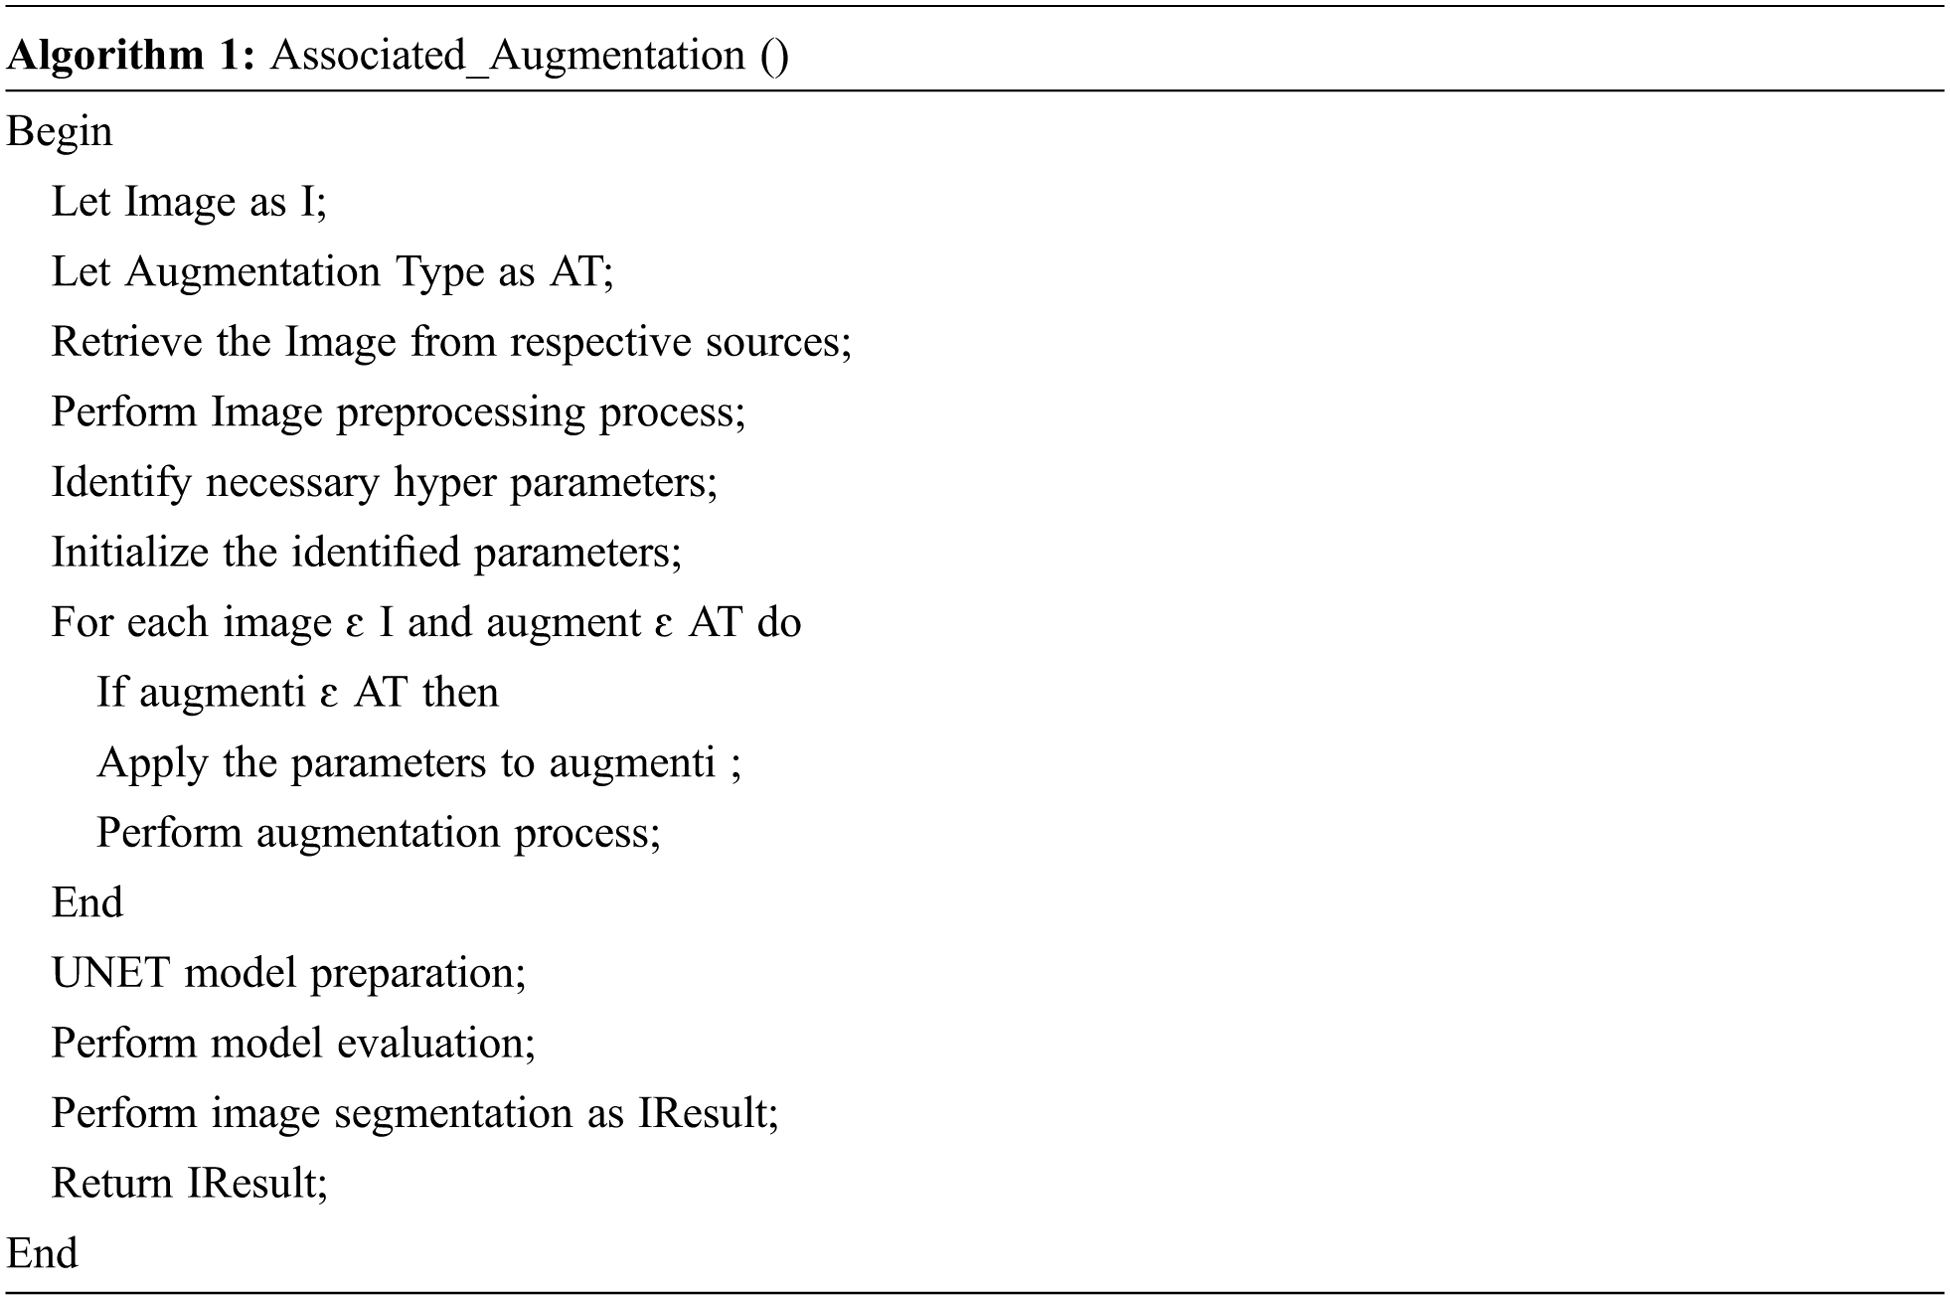
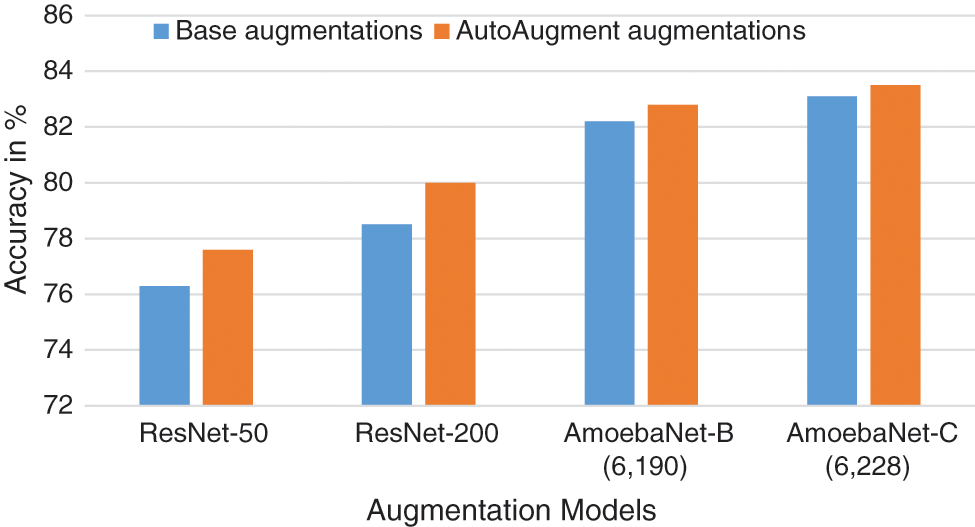
Figure 4: Base augmentation vs. autoaugment augmentation
Horizontal flip augmentation method flip columns and rows in a horizontal manner. It generates 8 images for a single image as an input i.e. total image = 9 [1 (original image) + (8 augmented image)]. The flip is carried out based on vertical dimension with 9 images like horizontal flip augmentation. GridDistortion is a method counts the number of grid cells in the image distortion that limit in the range of the [−0.03 and +0.03]. OpticalDistortion performs the augmentation task with the distortion limit and shift limit in 0.05 and 0.05 respectively. ElasticTransform method uses the filter parameters as alpha, sigma and affinity levels in 1, 50 and 50 respectively. This augmentation process provides a large amount of data sets which is used by UNET. The fake vessels are also identified and eliminated from the datasets in order to achieve a better model efficiency. The proposed architectural model is shown in Fig. 5.
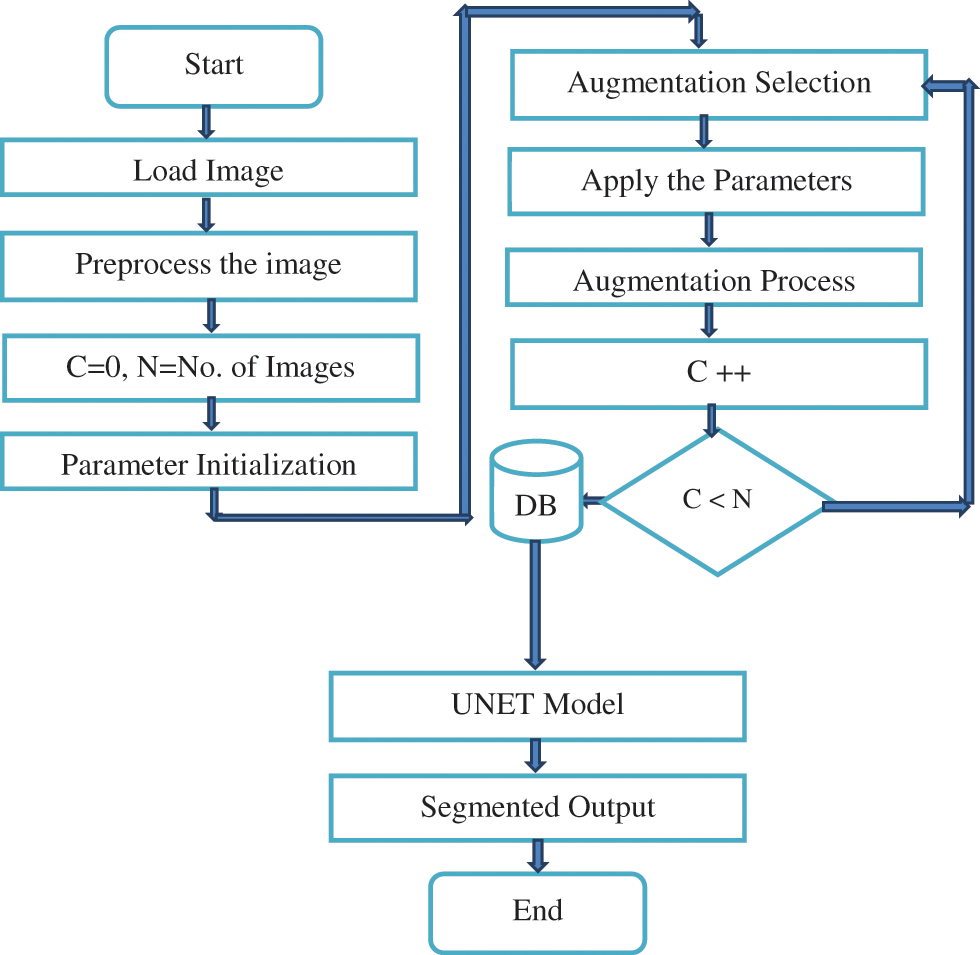
Figure 5: Architecture of Proposed Model
An augmentation process in machine learning that helps to reduce the over fitting problem during the training phase. The additional images are added in the image sets in order to improve the model accuracy. An individual augmentation produces the image samples which are suitable for non-medical applications. The medical domain needs high dimensional data so multiple augmentation models are integrated for generating more images with different features related to the operations. The integration of various augmentations lead to further over-fitting because of independent datasets. This problem can be overcome by discovering the relationship between the augmented datasets in order to keep quality of image datasets for model evaluation. Joint probability (JP) distribution model is used for identifying and analyzing ensemble date set. If I and J are independent data sets the probability model is expressed in Eq. (1)
The equation is rewritten by satisfying the probability conditions
The correlation coefficient are is calculated in Eqs. (2) to (8),
If the r[I,J] > 0 then the relation among the images are strongly associated otherwise no relation is associated. This correlation analysis provides a high-quality approach for selecting efficient dataset from the augmented sets.
The augmentation of the proposed model is done in various types namely flip, distortion and color etc. The hyper parameters are identified and selected for performing the augmentation process with specified intervals and probability (p) value. The analysis with various parameters and its values are done with respect to the type of augmentation. Horizontal filling uses the Hue, Sat, Val and the corresponding probability values as 20, 25, 20 and 0.6 respectively. The image, mask, bounding box and 0.6 probability values are used for vertical flip augmentation. An optical distortion-based approach uses distortion limit is 0.04, shift limit is 0.06, interpolation is 1 and p is 0.7. Grid based model takes the steps size is 5, distortion limit is 0.3 and p is 0.6. The proposed augmentation is formulated as follows,
The color augmentation with the correlation analysis is done in Eqs. (9) to (11)
Correlation analysis of horizontal flip is carried out in Eqs. (12) to (14)
Similarly the vertical, optical and grid based techniques are analyzed in Iresult3, Iresult4 and Iresult5 respectively. A complete augmented datasets are represented in Eq. (15).
The relevant images are selected and formed as a dataset without any duplication and noise. These images are used for further UNET models for thin vessel identification.
The DRIVE datasets are used for BV segmentation with the consideration of attributes like width, pattern of the branch, angles, length etc. FGADR dataset provides the pixel-oriented DR annotations and labels with 1842 images and 1000 images respectively. HRF contains 45 images with 15 clusters i.e., subsets. These subsets hold three images namely glaucoma, healthy and DR images with the size of 3304 × 2336 with training and testing (80 and 20) ratio [12,13]. CHASE_DB1 datasets are collected from school students right and left eyes. The image size is 999 × 960 pixels. The annotations are done by the human manually [14]. The STARE dataset uses the images size with 700 × 605 with two groups namely images and annotations [15]. DRIVE datasets provide 20 images and 20 masks which are augmented using various methods and also it identifies the relationship for improving the detection rate. Figs. 6 and 7 gives the final augmented datasets in the image level and mask level respectively.
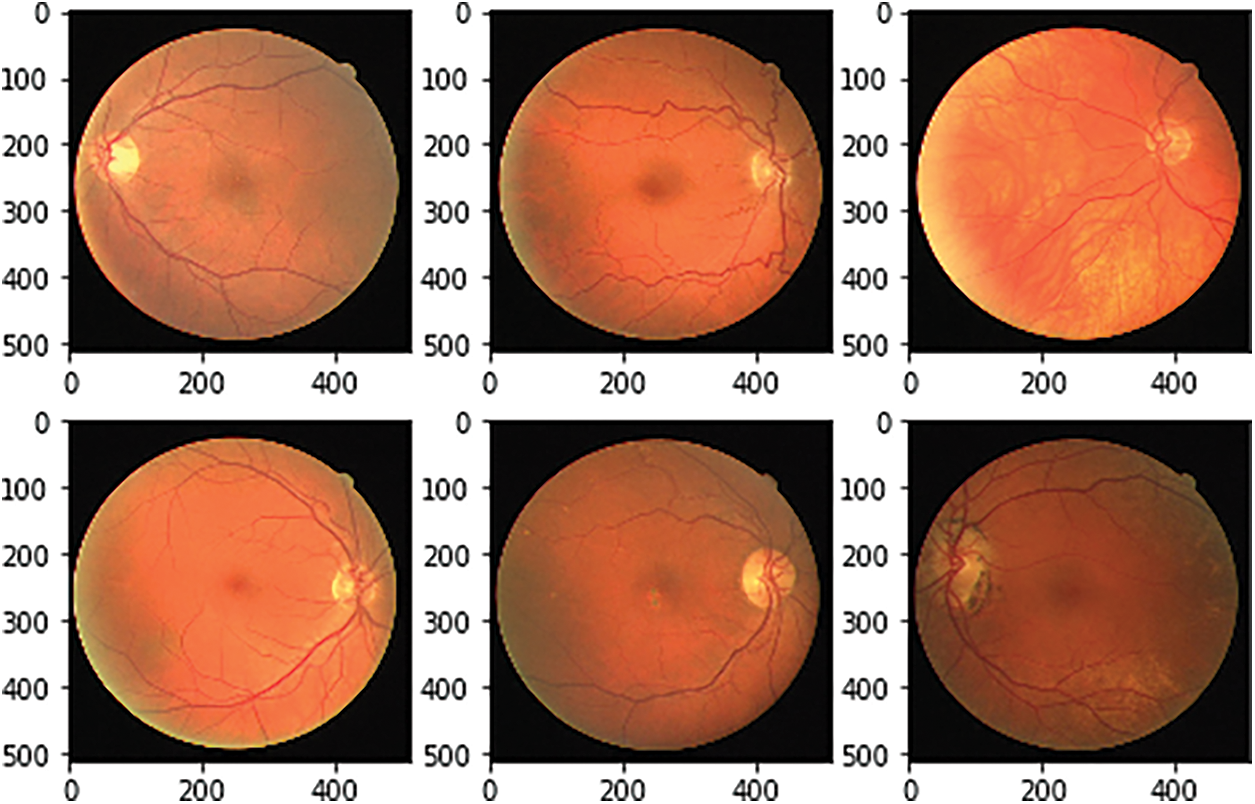
Figure 6: Associated image augmentation
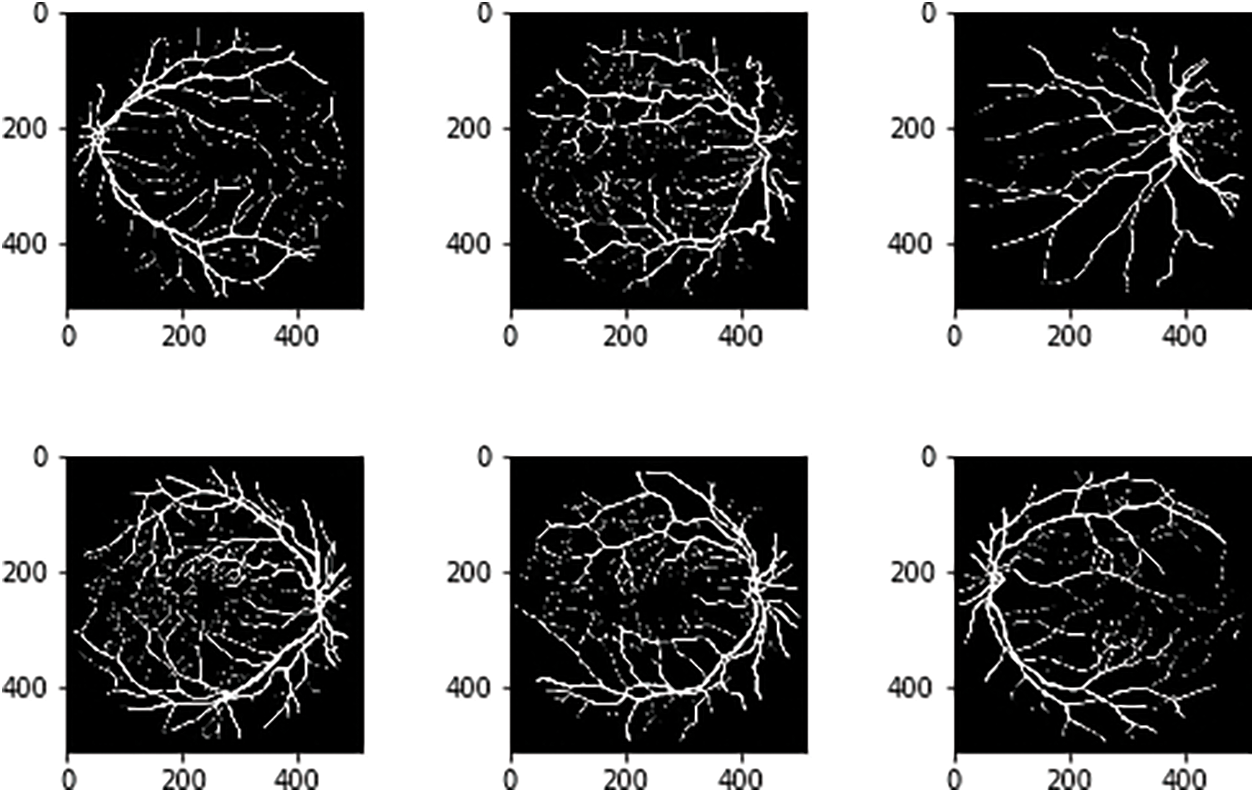
Figure 7: Associated image mask
Degenerative diseases on retina identification and determination are the major issue in segmentation with micro-macro vascular structures which is addressed using RV-GAN. The localization of these vessels are fixed using decoders and generators in order to eliminate the fidelity loss [16]. RV images and corresponding labeling process during segmentation needs the manual task which produces the inconsistent labels. This problem is solved by using Study GL (Group Learning) with a high level of reliability without any noise [17]. SA-UNet is a spatial Attention model that uses less number of annotated images with different attention maps and refinement of features [18]. The DUNet model identifies the local vessel features with high output resolution using an up-sampling process in an automated manner [19,20]. The spatial information get lost due to the sequence of strides and pooling operation in the UNET model. The CE-Net model protects the spatial features with multidimensional analysis [21–23]. Various models are analyzed based on the parameters like AUC (Area Under the Curve), F1-score, Accuracy and MioU. AUC is a measurement of the 2D area under the ROC (receiver operating characteristic) curve [24,25]. F1-Score is a performance parameter which performs classification processes. An accuracy is a percentage of exact prediction. Mean IoU (Intersection over Union) measurement is used over semantic segmentation with pixel level. This analysis helps to improve the prediction at maximum level. The existing models are used without image augmentation which produce less accuracy with limited dataset size. This problem can be overcome by using image augmentation for achieving maximum accuracy with large datasets. AUC analysis and F1-score analysis is represented in Figs. 8 and 9 respectively. Fig. 10 presents the accuracy analysis and Fig. 11 depicts mIoU analysis over various models.
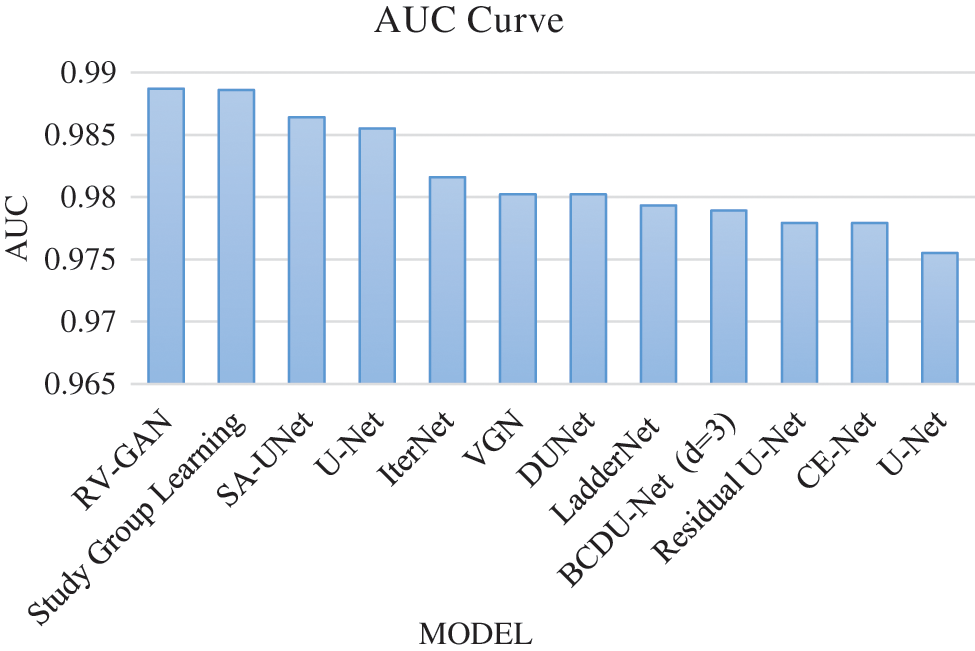
Figure 8: AUC curve model analysis
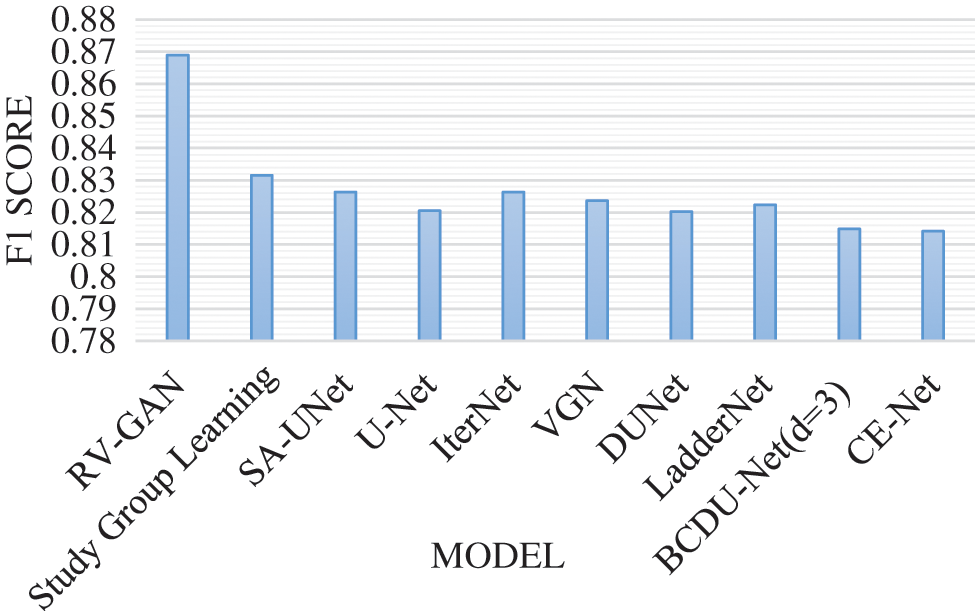
Figure 9: F1-score model analysis
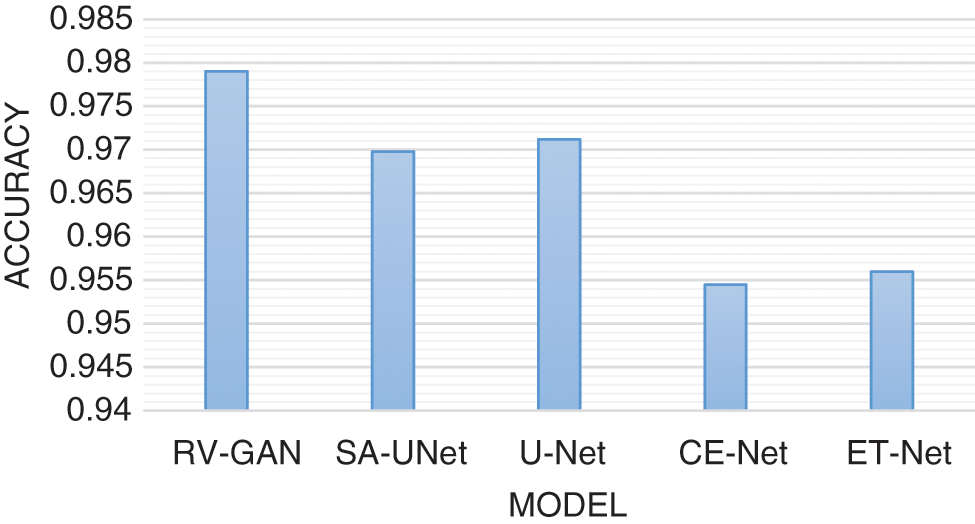
Figure 10: Accuracy model analysis
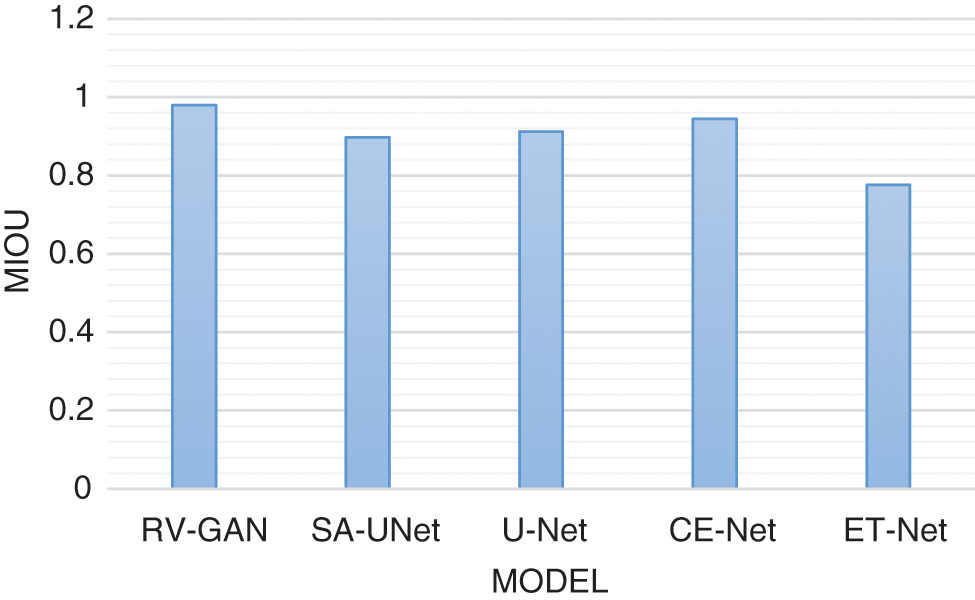
Figure 11: mIoU model analysis
The experimental environment uses the Amazon Web Service (AWS) instances with customized configuration for analyzing proposed models. Various computing instances are offered by AWS such as general instances, computing instances, memory level instances, storage level instances and accelerated computing level instances. This model uses an Accelerated Computing (AC) type because of high end GPU support. AC handles heavy workload such as biomedical applications, machine learning applications and so on. p3.16xlarge instance produces a high computing power which is suitable for machine learning applications. It uses maximum 8 NVIDIA type V100 GPUs, 100 Gbps maximum throughput at network level. The delivery rate of the instance is measured by the cloud 1 PetaFlop of precision (i.e. per instance level). The DR augmented data sets are handled by using these configuration instances with rapid model response. Tab. 1 represents the evaluation of model environment setup for BV analysis.

The proposed augmented based image segmentation model provides a better identification of thin vessels in DR images. The ensemble approach suffers over fitting problem because of the large data set, so it is addressed using association integration technique. It identifies the relationship based on the attributes and retains the correlated images for performing prediction processes. Machine learning parameters such as accuracy, F1_score, precision, sensitivity and specificity are used for making the proposed model more efficient and reliable. These parameters are represented in the Eqs. (16) to (20).
Three datasets of augmentation models are used the proposed analysis namely CHASE_DB1, DRIVE and STARE. According to STARE datasets the proposed model achieves 84.6% of accuracy, 89% of sensitivity, 89.5% of specificity and F1 score is 92.1%. CHASE_DB1 datasets-based analysis attains the 89.6% accuracy when compared to the existing model. The model accomplished 89.7% of accuracy which is higher than the other models. This analysis is done with augmentation of images data over various attributes but it suffers lower identification level, so that it will be improved by implementing an association-based approach. The relationships of augmented images are identified and used for the prediction process. Tab. 2 provides the datasets accuracy and performance parameters analysis.

RV-GAN, SA-UNet, VGN, Residual U-net, U-net, CE-Net, LadderNet models are analyzed with final dataset (i.e. augmented with image relationship). These models use the dataset from various image sources with suitable augmentation but it is restricted to specific augmentation methods. The RV segmentation for thin vessels needs more augmented images. The integration of various augmentation methods are applied to these models and evaluated the accuracy. The accuracy level of these models are not improved in acceptable level because of the large number of images, so the irrelevance exists in the final datasets. The red boxes in Fig. 12 indicates the false thin vessels after performing multilevel augmented process over the dataset.
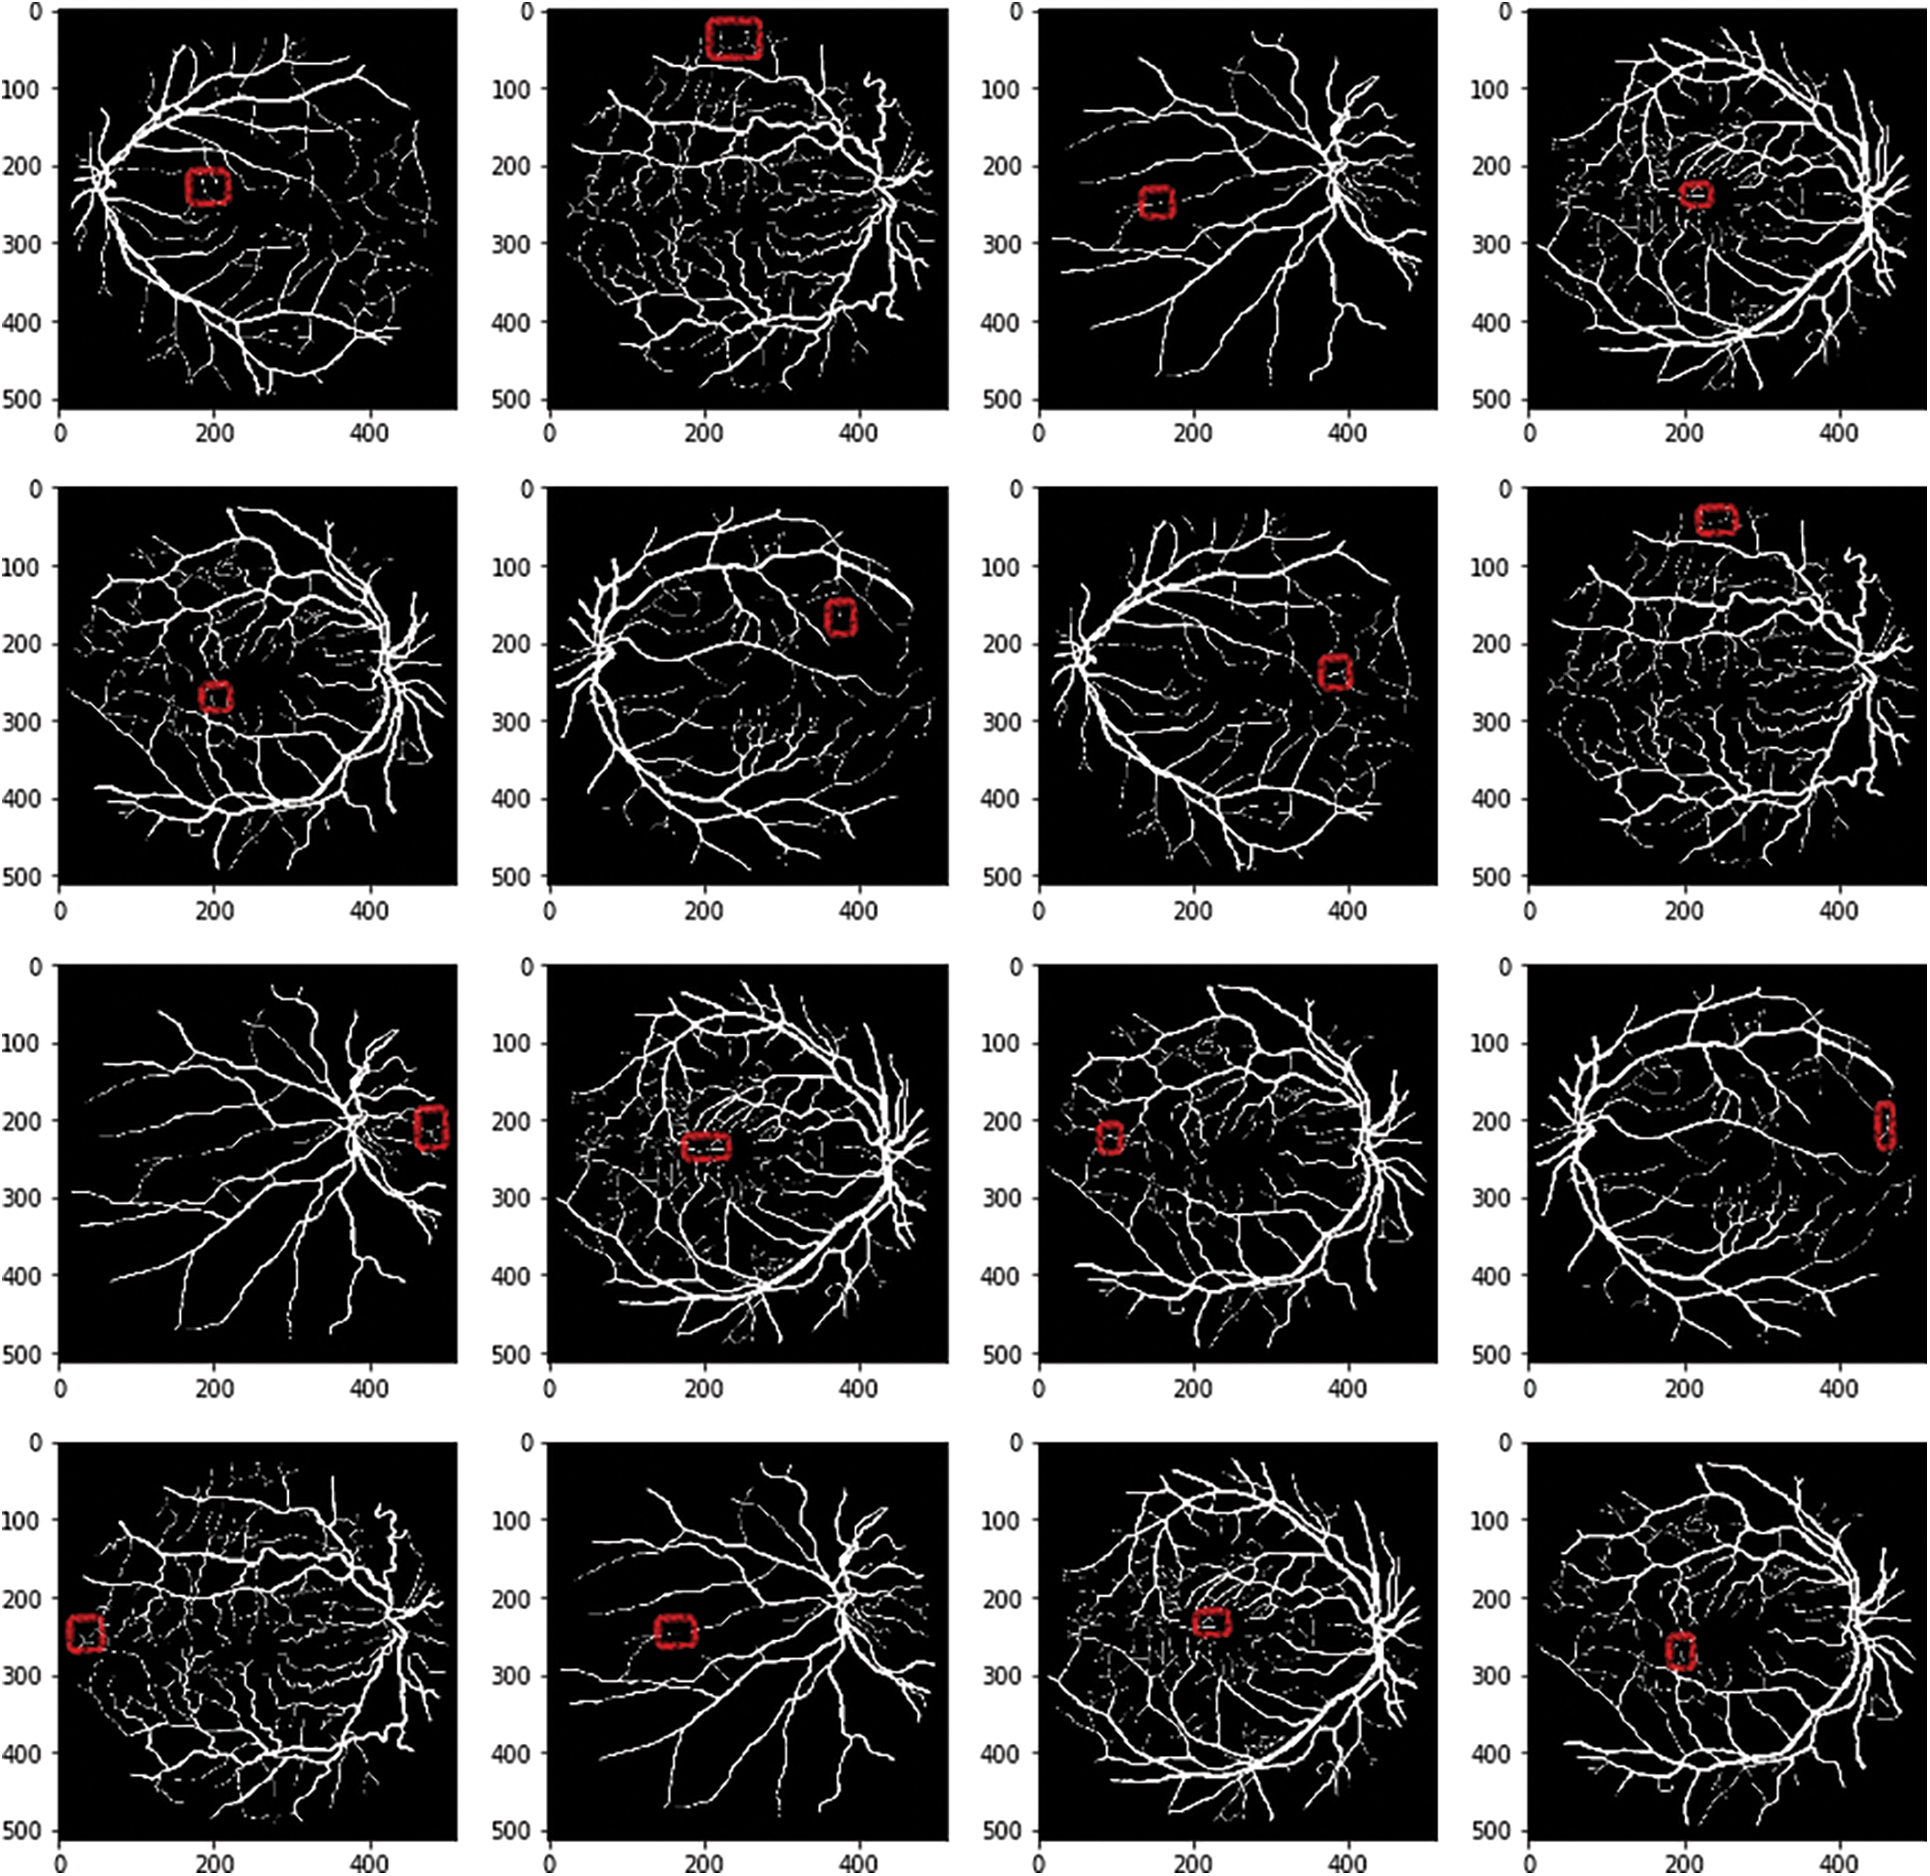
Figure 12: Thin vessels identification
The accuracy level is improved by considering the association between the augmented image sets. This dataset is applied to the UNET model and achieves 84.12% accuracy. The Accuracy, Specificity and Sensitivity comparative analysis in represented in Figs. 13–16 provides the F1 score analysis and Kappa analysis is shown Fig. 17.
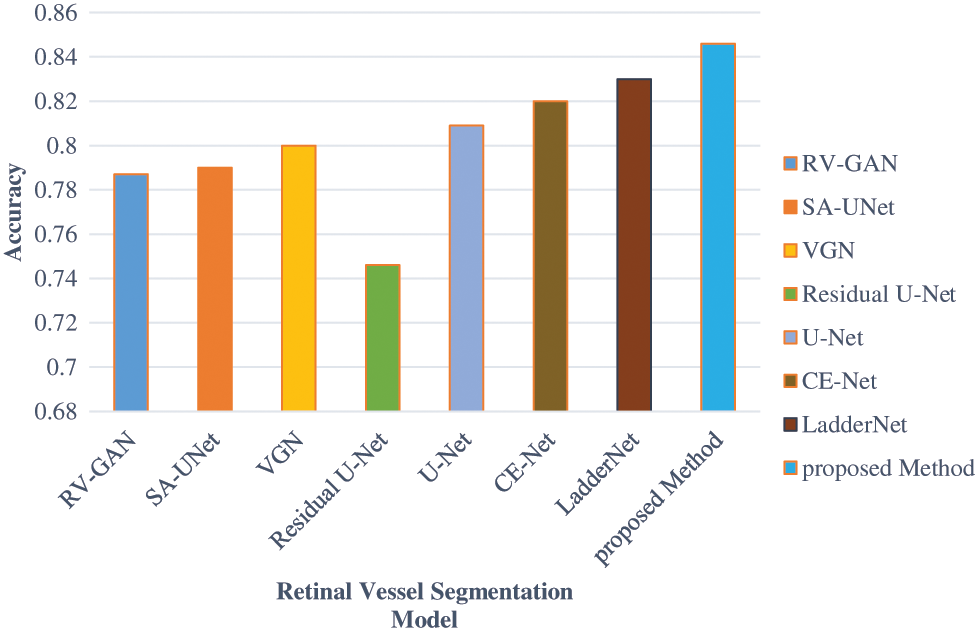
Figure 13: Comparison of accuracy analysis of BV segmentation
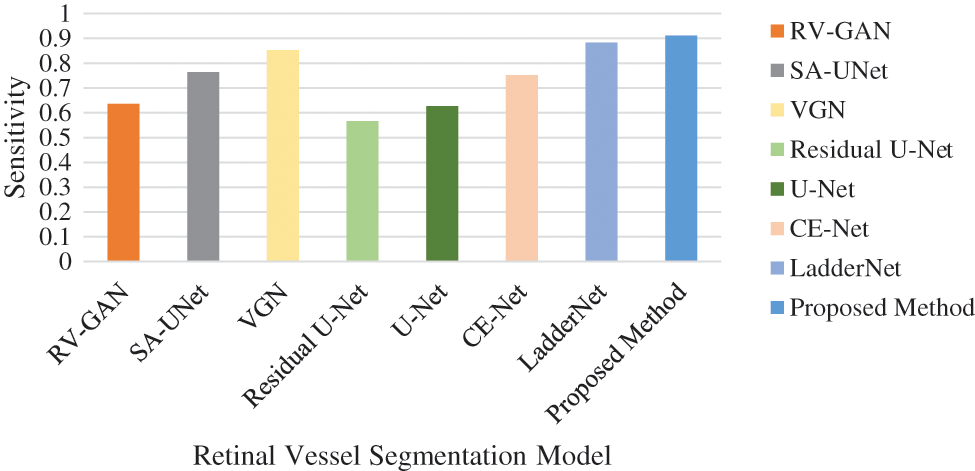
Figure 14: Comparison of sensitivity analysis
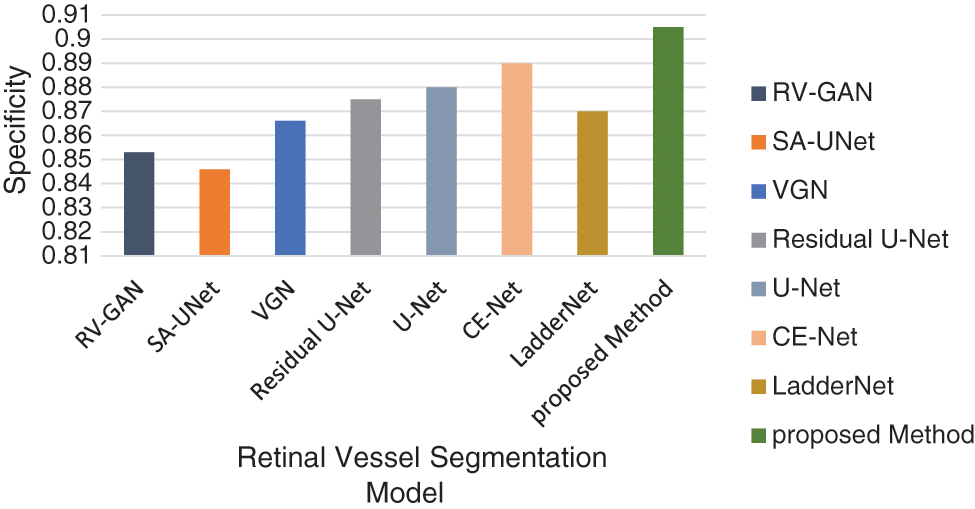
Figure 15: Comparison of specificity model analysis
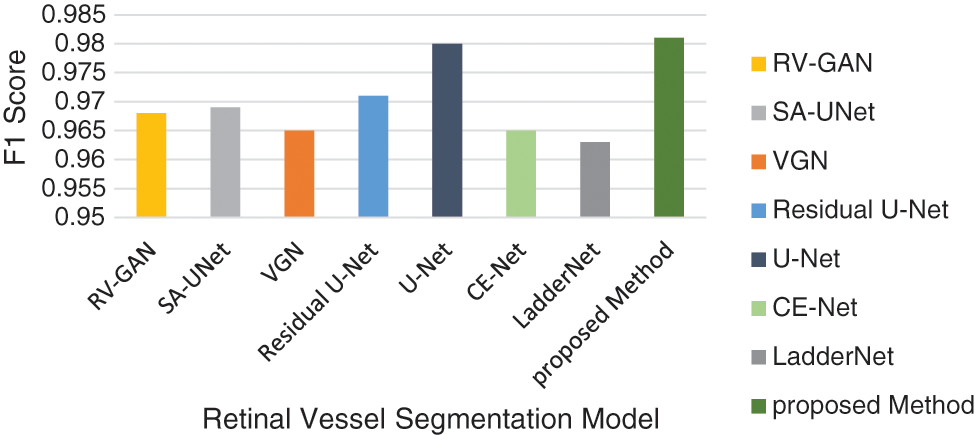
Figure 16: F1-score model analysis
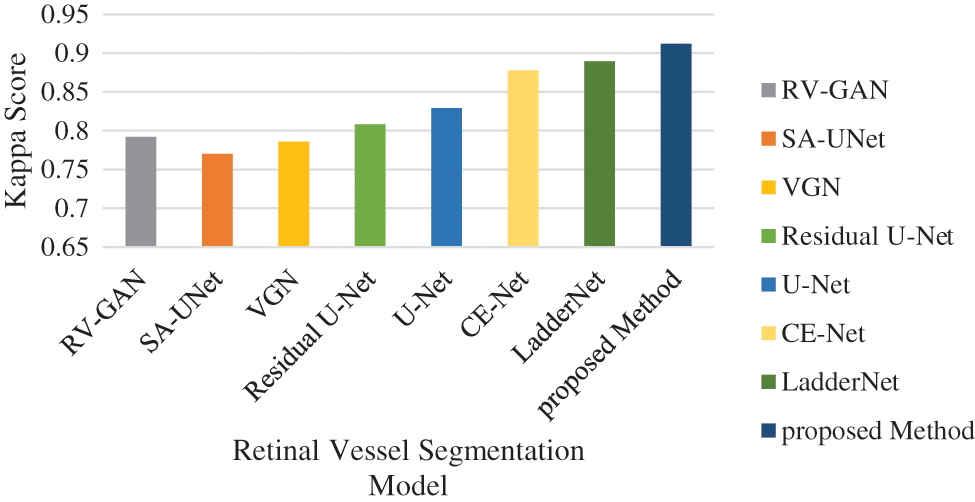
Figure 17: Kappa score analysis
The accuracy analysis of various models are assessed and compared with the proposed model. LadderNet and CE-Net has achieved 82.7% and 83.5% which are close to the proposed result. The sensitivity analysis is 90% in the proposed analysis which is better than VGN and LadderNet. The proposed result has higher specificity than other segmentation models. The F1-Score of Proposed and U-NET models are close to each other which performs a similar segmentation process. The kappa score has been gradually increased from SA-Unet to the proposed method and achieved the improvement in the segmentation process in DR.
An integrated multilevel augmentation technique generates large datasets from the relevant sources. The DRIVE datasets are used for analyzing and identifying the blood vessels. It has produced 20 training images and 20 related masks which are enhanced by applying augmentation models. These images are preprocessed in order to maintain related features for further image segmentation. Two phases of image analysis are done namely multi-level augmentation and image features association. A correlation analysis has been done for detecting the strong relationship between the augmented image set. The dataset analysis is carried out based on different datasets such as FGADR, HRF, CHASE_DB1 and STARE. Various models with specific augmentation models have been performed and identified the need of the multilevel augmentation process. The UNET model has been used for identifying thin vessels from source of truth with high level of parameters. The proposed hybrid model attains maximum detection rate when compared to the existing models and also achieves high reliability in DR detection.
Funding Statement: The authors received no specific funding for this study.
Conflicts of Interest: The authors declare that they have no conflicts of interest to report regarding the present study.
1. N. Memari, A. R. Ramli, M. Saripan, S. Mashohor and M. Moghbel, “Retinal blood vessel segmentation by using matched filtering and fuzzy c-means clustering with integrated level set method for diabetic retinopathy assessment,” Journal of Medical and Biological Engineering, vol. 39, no. 5, pp. 713–731, 2019. [Google Scholar]
2. L. Qiao, Y. Zhu and H. Zhou, “Diabetic retinopathy detection using prognosis of microaneurysm and early diagnosis system for non-proliferative diabetic retinopathy based on deep learning algorithms,” IEEE Access, vol. 8, pp. 104292–104302, 2020. [Google Scholar]
3. A. Krestanova, J. Kubicek and M. Penhaker, “Recent techniques and trends for retinal blood vessel extraction and tortuosity evaluation: A comprehensive review,” IEEE Access, vol. 8, pp. 197787–197816, 2020. [Google Scholar]
4. Y. Zhou, B. Wang, L. Huang, S. Cui and L. Shao, “A benchmark for studying diabetic retinopathy: Segmentation, grading, and transferability,” IEEE Transactions on Medical Imaging, vol. 40, no. 3, pp. 818–828, 2020. [Google Scholar]
5. A. Imran, J. Li, Y. Pei, J. J. Yang and Q. Wang, “Comparative analysis of vessel segmentation techniques in retinal images,” IEEE Access, vol. 7, pp. 114862–114887, 2019. [Google Scholar]
6. K. B. Park, S. H. Choi and J. Y. Lee, “M-gan: Retinal blood vessel segmentation by balancing losses through stacked deep fully convolutional networks,” IEEE Access, vol. 8, pp. 146308–146322, 2020. [Google Scholar]
7. E. O. Rodrigues, A. Conci and P. Liatsis, “ELEMENT: Multi-modal retinal vessel segmentation based on a coupled region growing and machine learning approach,” IEEE Journal of Biomedical and Health Informatics, vol. 24, no. 12, pp. 3507–3519, 2020. [Google Scholar]
8. M. Alhussein, K. Aurangzeb and S. I. Haider, “An unsupervised retinal vessel segmentation using hessian and intensity based approach,” IEEE Access, vol. 8, pp. 165056–165070, 2020. [Google Scholar]
9. H. Xia, F. Jiang, S. Deng, J. Xin and R. Doss, “Mapping functions driven robust retinal vessel segmentation via training patches,” IEEE Access, vol. 6, pp. 61973–61982, 2018. [Google Scholar]
10. S. Qummar, F. G. Khan, S. Shah, A. Khan, S. Shamshirband et al., “A deep learning ensemble approach for diabetic retinopathy detection,” IEEE Access, vol. 7, pp. 150530–150539, 2019. [Google Scholar]
11. C. Shorten and T. M. Khoshgoftaar, “A survey on image data augmentation for deep learning,” Journal of Big Data, vol. 6, no. 1, pp. 1–48, 2019. [Google Scholar]
12. Y. Zhou, B. Wang, L. Huang, S. Cui and L. Shao, “A benchmark for studying diabetic retinopathy: segmentation, grading, and transferability,” IEEE Transactions on Medical Imaging, vol. 40, no. 3, pp. 818–828, 2020. [Google Scholar]
13. M. Prakash and K. K. Dhawan, “Fault tolerance-genetic algorithm for grid task scheduling using check point,” in Sixth IEEE Int. Conf. on Grid and Cooperative Computing, China, pp. 676–680, 2007. [Google Scholar]
14. C. H. Yang, J. H. Ren, H. C. Huang, L. Y. Chuang and P. Y. Chang, “Deep hybrid convolutional neural network for segmentation of melanoma skin lesion,” Computational Intelligence and Neuroscience, vol. 2021, pp. 1–5, 2021. [Google Scholar]
15. V. Sindhu and P. Mohan, “A survey on task scheduling and resource allocation methods in fog based iot applications,” in Int. Conf. on Communication and Intelligent Systems, India, pp. 89–97, 2020. [Google Scholar]
16. S. A. Kamran, K. F. Hossain, A. Tavakkoli, S. L. Zuckerbrod, K. M. Sanders et al., “RV-GAN: Segmenting retinal vascular structure in fundus photographs using a novel multi-scale generative adversarial network,” in Int. Conf. on Medical Image Computing and Computer-Assisted Intervention, France. Springer, Cham, pp. 34–44, 2021. [Google Scholar]
17. U. Gowshika, D. Shaloom Immulicate and S. Sathiya Priya, “Analysis of defect in dental using image processing,” International Journal of Applied Engineering Research, vol. 10, no. 9, pp. 8125–8129, 2015. [Google Scholar]
18. L. Pan, Z. Zhang, S. Zheng and L. Huang, “MSC-Net: Multitask learning network for retinal vessel segmentation and centerline extraction,” Applied Sciences, vol. 12, no. 1, pp. 1–10, 2022. [Google Scholar]
19. Q. Jin, Z. Meng, T. D. Pham, Q. Chen, L. Wei et al., “DUNet: A deformable network for retinal vessel segmentation,” Knowledge-Based Systems, vol. 178, pp. 149–162, 2019. [Google Scholar]
20. Z. Gu, J. Cheng, H. Fu, K. Zhou, H. Hao et al., “Ce-net: Context encoder network for 2d medical image segmentation,” IEEE Transactions on Medical Imaging, vol. 38, no. 10, pp. 2281–2292, 2019. [Google Scholar]
21. R. Priscilla, B. Prabha, A. Kavitha and C. Arun, “An efficient on-demand virtual machine migration in cloud using common deployment model,” Computer Systems Science and Engineering, vol. 42, no. 1, pp. 245–256, 2022. [Google Scholar]
22. S. K. Lakshmi, M. Vijayakumar and C. Arun, “An efficient ensemble model for forecasting time series analysis of crypto currency data using machine learning,” in 2021 IEEE Int. Conf. on Innovative Computing, Intelligent Communication and Smart Electrical Systems (ICSES), India, pp. 346–350, 2021. [Google Scholar]
23. S. K. Lakshmi, J. D. Rose and B. Prabha, “Automatic feature extraction and traffic management using machine learning and open cv model,” in 2021 IEEE Int. Conf. on Innovative Computing, Intelligent Communication and Smart Electrical Systems (ICSES), India, pp. 380–384, 2021. [Google Scholar]
24. P. Mohan and S. K. Chelliah, “An authentication technique for accessing de-duplicated data from private cloud using one time password,” International Journal of Information Security and Privacy, vol. 11, no. 2, pp. 1–10, 2017. [Google Scholar]
25. B. Kuppuraj and C. Saravanakumar, “An enhanced security measure for multimedia images using hadoop cluster,” International Journal of Operations Research and Information Systems, vol. 12, no. 3, pp. 1–10, 2021. [Google Scholar]
 | This work is licensed under a Creative Commons Attribution 4.0 International License, which permits unrestricted use, distribution, and reproduction in any medium, provided the original work is properly cited. |