DOI:10.32604/iasc.2023.029036
| Intelligent Automation & Soft Computing DOI:10.32604/iasc.2023.029036 | |
| Article |
A Parallel Approach for Sentiment Analysis on Social Networks Using Spark
1Vel Tech Rangarajan Dr. Sagunthala R&D Institute of Science and Technology, Chennai, 600062, India
2University College of Engineering, Anna University (B. I. T Campus), Tiruchirappalli, 620024, India
*Corresponding Author: M. Mohamed Iqbal. Email: mmohamediqbalphd2@gmail.com
Received: 23 February 2022; Accepted: 29 March 2022
Abstract: The public is increasingly using social media platforms such as Twitter and Facebook to express their views on a variety of topics. As a result, social media has emerged as the most effective and largest open source for obtaining public opinion. Single node computational methods are inefficient for sentiment analysis on such large datasets. Supercomputers or parallel or distributed processing are two options for dealing with such large amounts of data. Most parallel programming frameworks, such as MPI (Message Processing Interface), are difficult to use and scale in environments where supercomputers are expensive. Using the Apache Spark Parallel Model, this proposed work presents a scalable system for sentiment analysis on Twitter. A Spark-based Naive Bayes training technique is suggested for this purpose; unlike prior research, this algorithm does not need any disk access. Millions of tweets have been classified using the trained model. Experiments with various-sized clusters reveal that the suggested strategy is extremely scalable and cost-effective for larger data sets. It is nearly 12 times quicker than the Map Reduce-based model and nearly 21 times faster than the Naive Bayes Classifier in Apache Mahout. To evaluate the framework’s scalability, we gathered a large training corpus from Twitter. The accuracy of the classifier trained with this new dataset was more than 80%.
Keywords: Social networks; sentiment analysis; big data; spark; tweets; classification
Analysis of Public Opinion mining [1], often known as sentiment analysis, is a subset of data mining. It focuses on extracting the polarity of sentiment from a given text. The material is frequently written in plain English. Sentiment analysis on social media is the process of categorizing data on social media platforms such as Twitter [2], Facebook, IMBD, and Tumblr based on its sentiments. Sentiment research is becoming increasingly popular in marketing and business, as public opinion can provide crucial information to policymakers in order to maximize profits. Authors in [3–6] are modeled Sentiment analysis as a classification problem that is typically addressed using supervised and unsupervised learning approaches. To improve accuracy [7,8], a lot of effort is being done into different learning algorithms, data retrieval, and preprocessing methods. Data gathering, data preprocessing, feature extraction and construction of feature vectors, and classification are the major components of opinion mining (Supervised or Unsupervised).
Various websites allow for a variety of review structures to be used. Some websites allow users to expressly highlight the benefits and drawbacks, sometimes alongside the overview, while in other situations there will be no constraints on how users submit reviews, allowing them to write whatever they want and express their sentiments. Even though there are numerous review websites available, analyzing user comments from social media websites such as Twitter and Facebook is critical due to the wide range of audiences available. A new parallel method to classify social network tweets is proposed in this paper. In this proposed work, Using the Twitter 4J API [9], we gathered our own data set from the Twitter social network for training purposes.
In this proposed work, we have divided our work into the following sections. In Section 2 related works for sentiment analysis are discussed. In Section 3 Proposed method is described. In Section 4 our proposed Spark-based Parallel Naive bayes algorithm and its workflow are discussed. In Section 5 data sets and experimental results of our proposed method are discussed. Finally in Section 6 conclusion and future work are discussed.
This section contains the results of ongoing research on Opinion Mining and Sentiment Analysis. In their paper, B. Liu et al. [10] suggested an opinion mining model based on the MapReduce architecture and the Naive Bayes Classifier. They used the Cornell University movie review dataset and the Stanford SNAP Amazon movie review dataset to evaluate the algorithm, and it was shown to be 82 percent accurate. This accuracy is higher than that of other articles’ tweet classifications, which could be related to the higher and better structure of the text in movie reviews. [10] also assumes that all of the classes’ prior probabilities are equal. For the vast majority of training datasets, this assumption is false, and prior probability must be estimated explicitly. Li [11] used a MapReduce version of the Naive Bayes algorithm in his PhD thesis to analyse tweet sentiment and its influence on the stock market depending on demographics. The statistics required for Naive Bayes classifier training were calculated using two map reduce tasks. The training time complexity is O(C.V)/n, where C is the number of classes, V is the vocabulary size, and n is the number of cluster nodes. The framework he provided was simply for training the Naive Bayes classifier; he did not report on the testing phase or the classifier’s accuracy. MapReduce Naive Bayes are also available in Apache Mahout 3. It’s also capable of multiclass classification. To construct feature vectors, several jobs are used, as well as multiple MapReduce processes to train the Naive Bayes classifier. [12] used Korean language sentiment analysis that was unsupervised and based on dictionaries. From Twitter and Topsy, they gathered a massive amount of unstructured data. Four map functions were employed to assess the data once it had been preprocessed. Step-by-step polarity preprocessing analysis, syntactic word analysis, morpheme analysis, and prohibitive word analysis were done by these routines. The reduction function was used to add up the negative and positive scores of the input sentence. If a tweet’s positive score was higher than its negative score, it was classified as positive, and vice versa. If a Tweet’s positive score equaled its negative score, it was advanced to the next processing stage. MongoDB was used to store the lexical dictionaries used in these analyses, as well as the final labels of tweets. By involving more slave nodes, the proposed system was able to maintain its stability as the data size grew. The accuracy for the positive, negative, and neutral datasets is 70%, 15%, and 14%, respectively. In [13], DOM was presented as a mobile application for Thai public sentiment analysis. Hadoop underpins DOM. For data analysis, it employs the MapReduce framework, while storage is handled by MongoDB. Unstructured data is gathered and saved in MongoDB on the server side of the application. The map reduction job is used to do subject categorization and lexicon-based sentiment analysis, which divides data into three categories: positive, negative, and neutral. The data that has been analysed is kept in a database. A user can query about a specific topic on the client side and receive pre-analyzed data. Experiments were conducted with a total of 12 GB of data collected. When the DOM findings were compared to human annotations, the average accuracy for long and short text was determined to be 76.32 percent. Supervised sentiment analysis using MapReduce was also proposed in [14]. For identifying the sentiment of large corpora, it suggested employing WordMap, a lexicon dictionary, and natural language processing rules in MapReduce operations. That paper’s planned work isn’t backed up by experiments or findings. [15] utilised MapReduce and HBase to create a vocabulary database specifically for Twitter sentiment analysis. HBase is a Hadoop-based distributed database system. The tweets were then classified using this lexicon and the Adaptive Logistics Regression method. The stated accuracy ranges between 72 and 74 percent. The strategies described above are based on the Map-Reduce Framework, which stores all intermediate results on a disc. As a result, both the map and reduce processes demand additional disc access, resulting in longer execution times. This issue can be solved by storing intermediate results in Main Memory rather than on discs. As a result, we have unitized Spark [16] Parallel Framework in our system and suggested a new Spark parallel Opinion categorization algorithm.
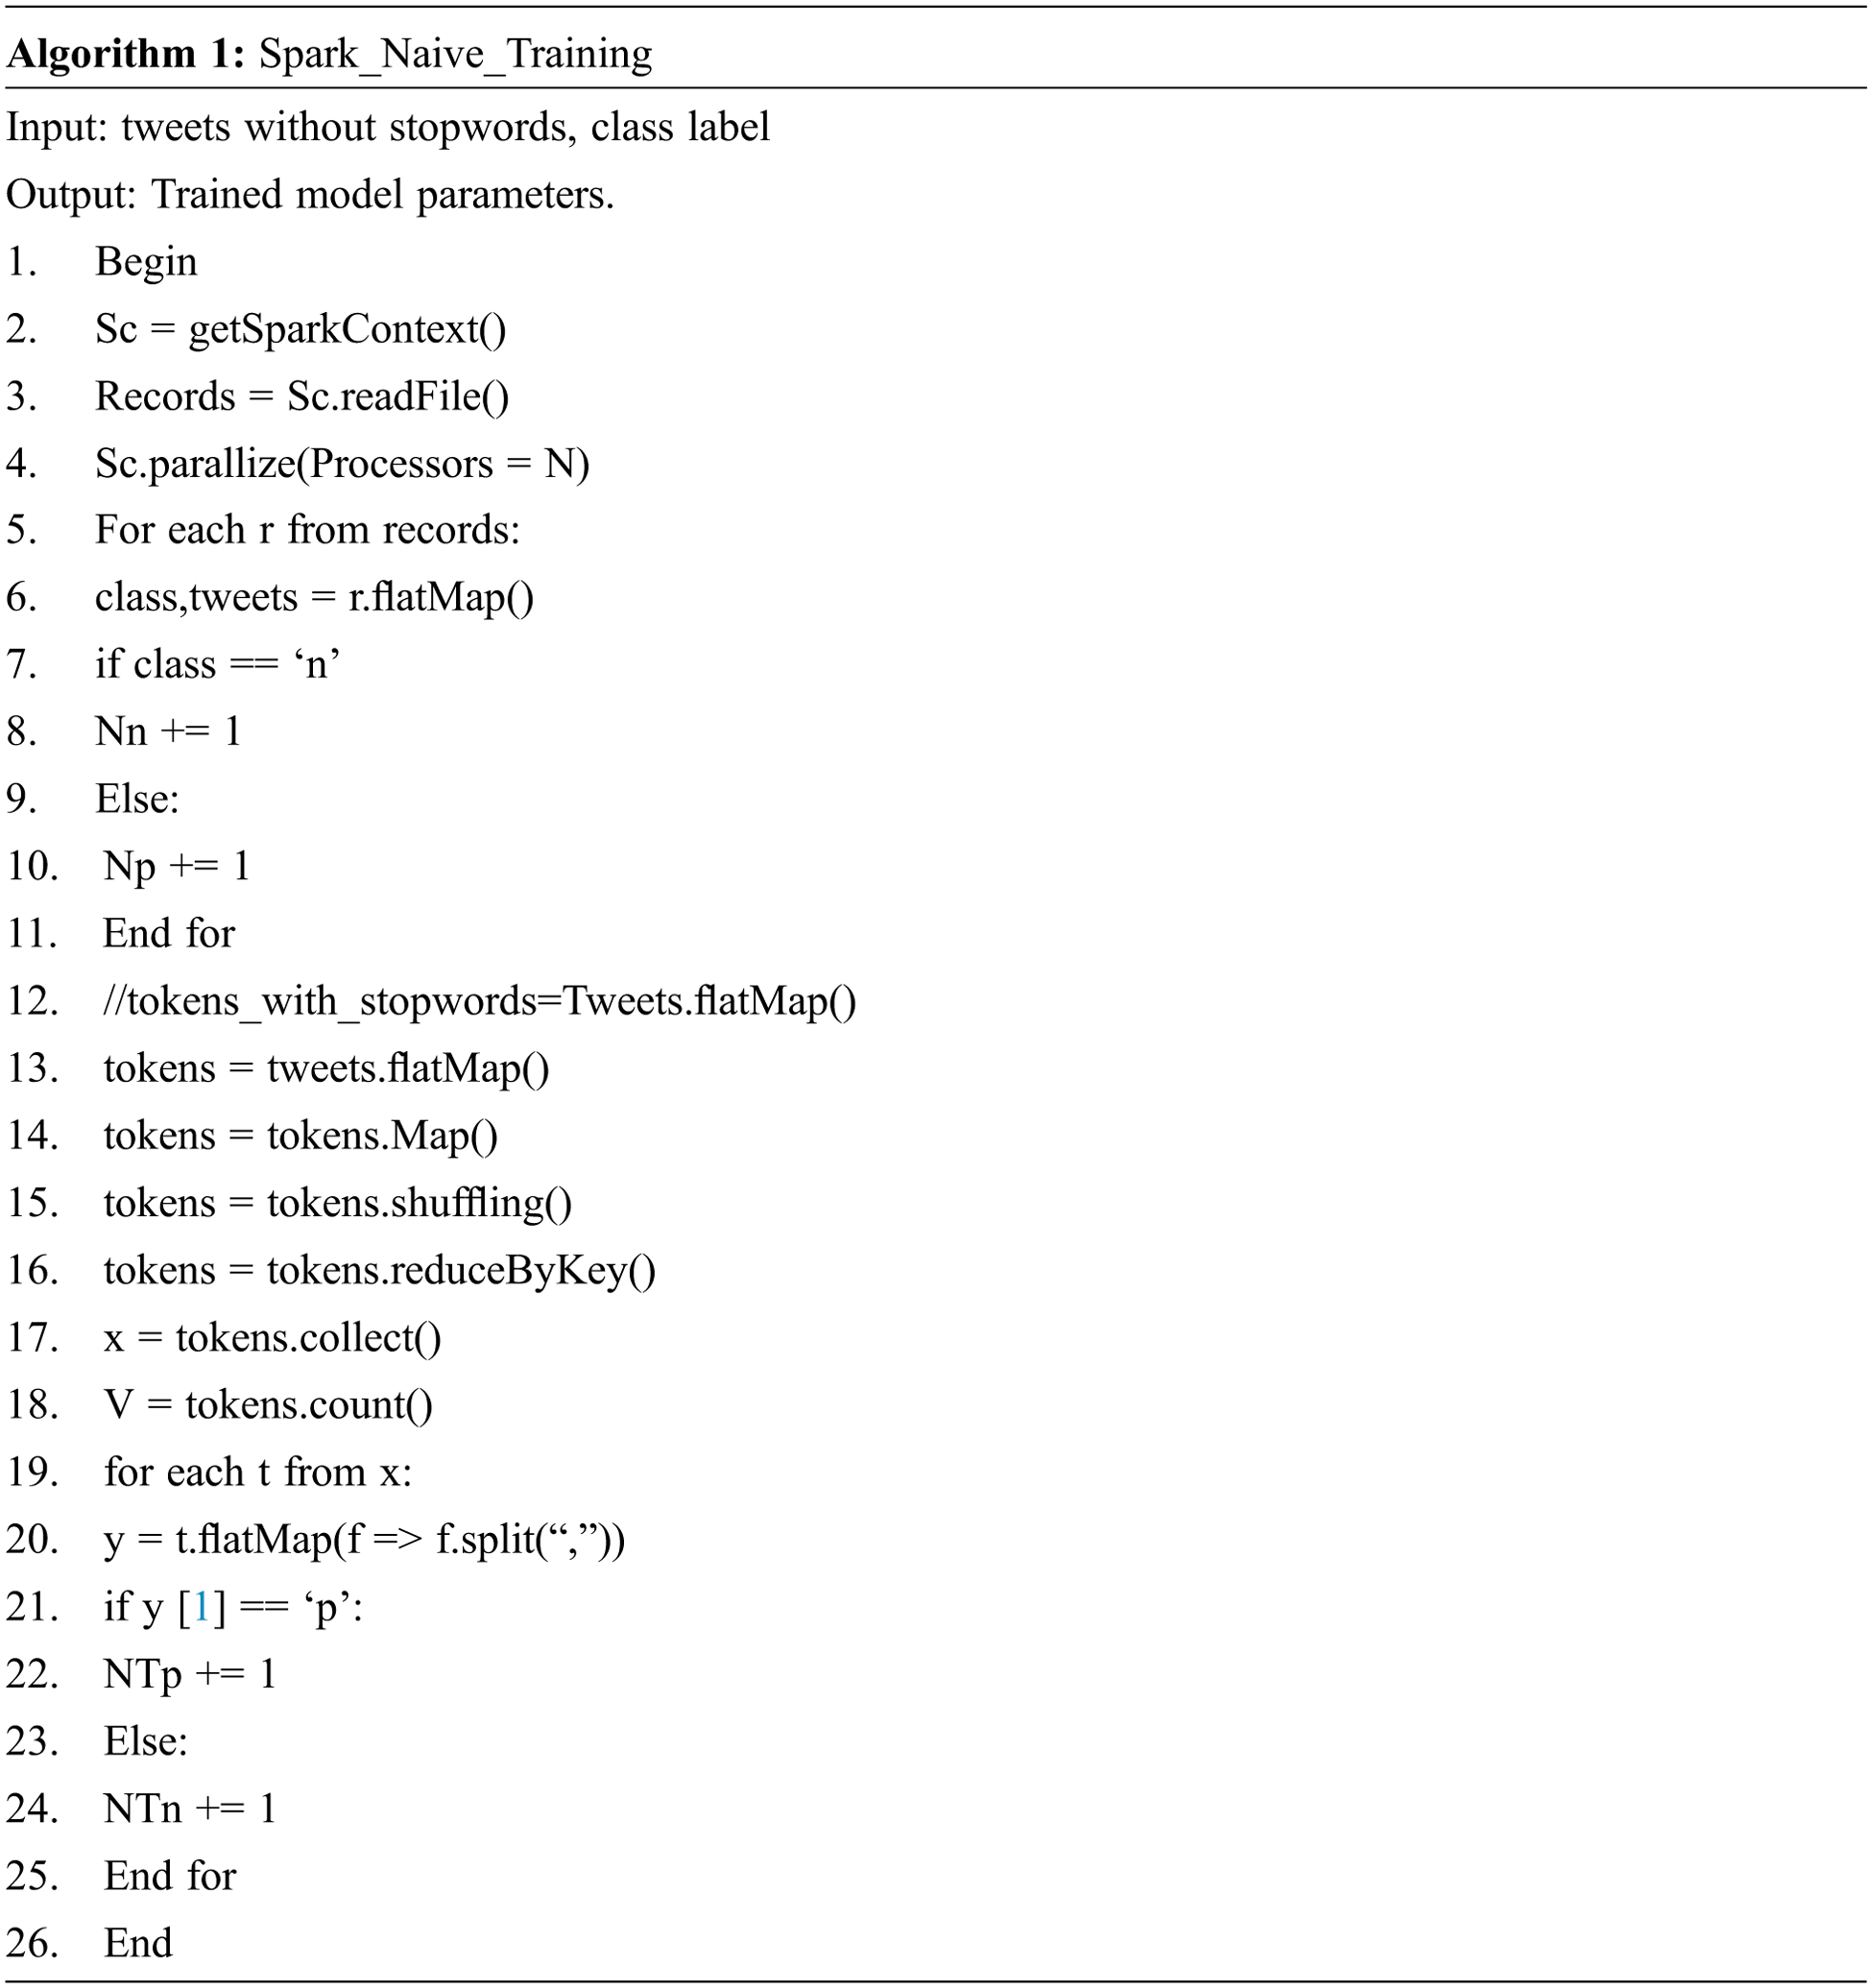
Daily data generated from every social network website is enormous. A parallel approach is required to analyze the vast data. So, a Spark-based parallel Naive Bayes classifier is proposed to classify the tweets collected from Twitter social network websites. The main aim of this work is to organize the tweets from Twitter social network websites into positive and negative polarities
3.1 Tweets Classification Process
The proposed tweets classification process is described in Fig. 1. The tweets collected from Twitter social network are given to the proposed system. Initially, the filtering process removes redundant tweets from the data sets. Here, cosine [17] similarity is utilized to find the redundant tweets. The removal of stop words and the stemming process is performed during the pre-processing stage. Then, the pre-processed tweets are divided into training and testing data sets. The proposed Spark-based Naïve Bayes classifier is trained using training data sets. During the training process, the following statistics have been calculated.

Figure 1: The architecture of proposed Tweets classification method
Finally, the trained model and the calculated statistics classify the testing tweets into positive and negative categories.
Naive Bayes classifier [18] is a probabilistic classifier. To classify a given text document D, Naive Bayes predicts the class by solving the following equations (Eqs. (1) to (5)). The class with the highest probability is assigned to document D.
where in Eq. (1),
4 Proposed Spark-Based Naive Bayes Classifier
In this section, we propose a Spark-based Parallel Naive Bayes classifier. We perform binary classification to classify the data positively or negatively. We use Multinomial Naive Bayes as it provides reasonable accuracy for text classification. The statistics

Figure 2: Training phase of the proposed method with a simple example
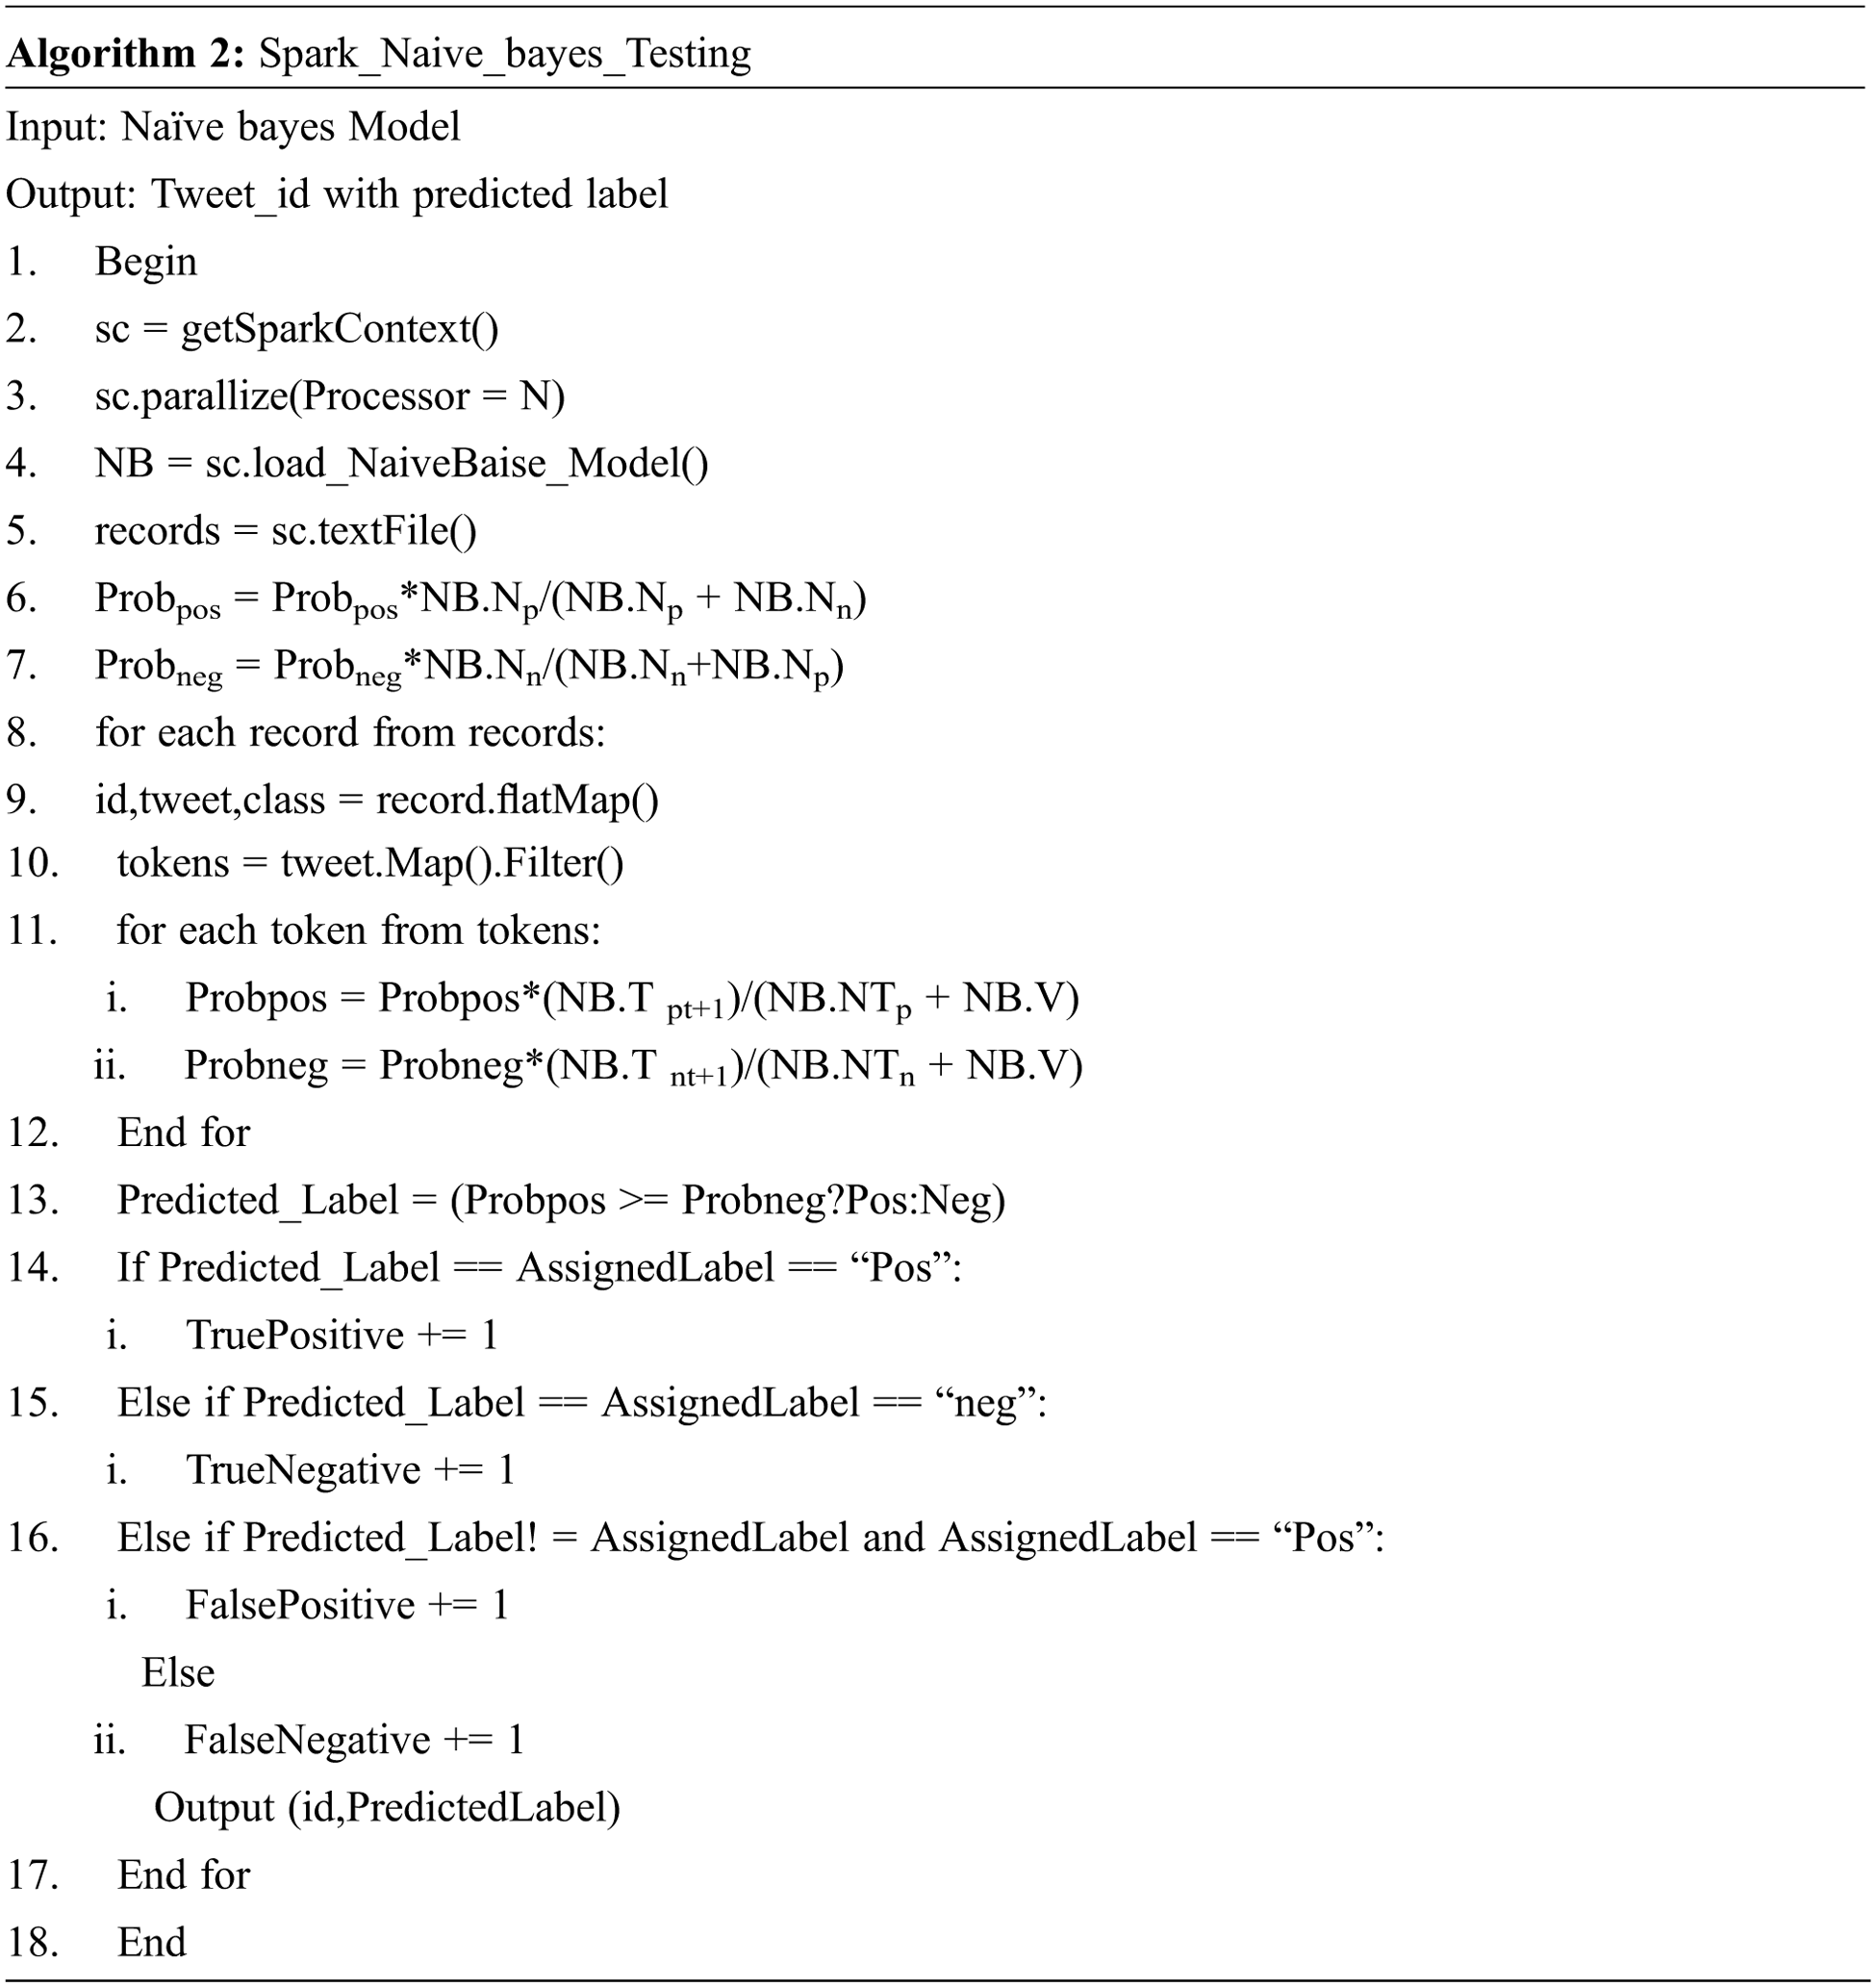
The process of the testing phase of Naive Bayes on Spark environment is described in Algorithm 2. Each processor loads the trained model in memory, the path of the model should be provided as an input by the driver program. Each processor is assigned a test instance to be classified; our testing algorithm predicts a class and prints tweet id and its predicted label in a separate text file in the file system. Reading input tweets and parallelizing the process are described in lines 1–4. Prior probabilities of positive and negative classes are calculated in lines 5,6. Pre-processing of testing tweets is performed in lines 7–9. The possibility of each class for every tweet is calculated in lines 10 to 13. The class for every tweet is finally predicted in line 14. The counters such as TruePositive, TrueNegative, FalsePostive and FalseNegative are calculated from lines 15 to 22 to calculate the accuracy of the proposed method.
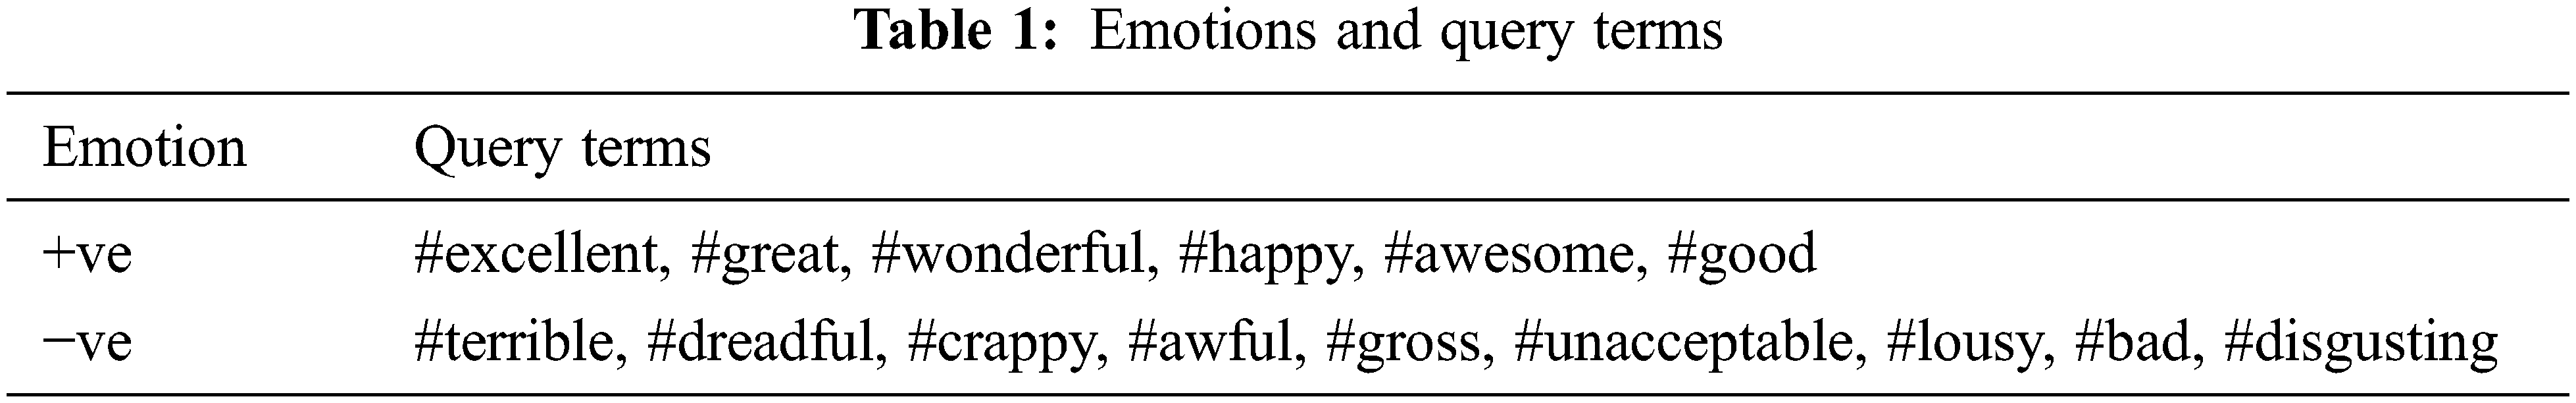
We created our training dataset because most of the training datasets for sentiment analysis are limited. We used the Twitter API to look for tweets with hashtags synonymous with “Good” and “Bad.” The information is gathered throughout December 2020. Roget’s Thesaurus is used to find synonyms for “Good” and “Bad.” Tweets containing synonyms for good were classified as positive, whereas tweets containing bad ones are classified as negative.
Tab. 1 lists the hashtags are used and the emotions that they evoked. These hashtags are chosen based on the number of tweets generated using these hashtags. To avoid data biassing, all of these hashtags are deleted from the tweets before it is used for training. Only English-language tweets are included in our sample. We also looked over the data to see whether there were any instances of negation, such as ‘not #good.’ There are no such cases found; instead of ‘not #good,’ people use #notgood to communicate negative sentiment. A total of 1 GB of data was collected, with 1122341 negative tweets and 3376458 positive tweets. There were 44, 98, 799 tweets, with 90% of the tweets being used to train the model and 10% testing the trained model. Prior probability cannot be assumed to be equal because the quantity of tweets in both categories is not equal.
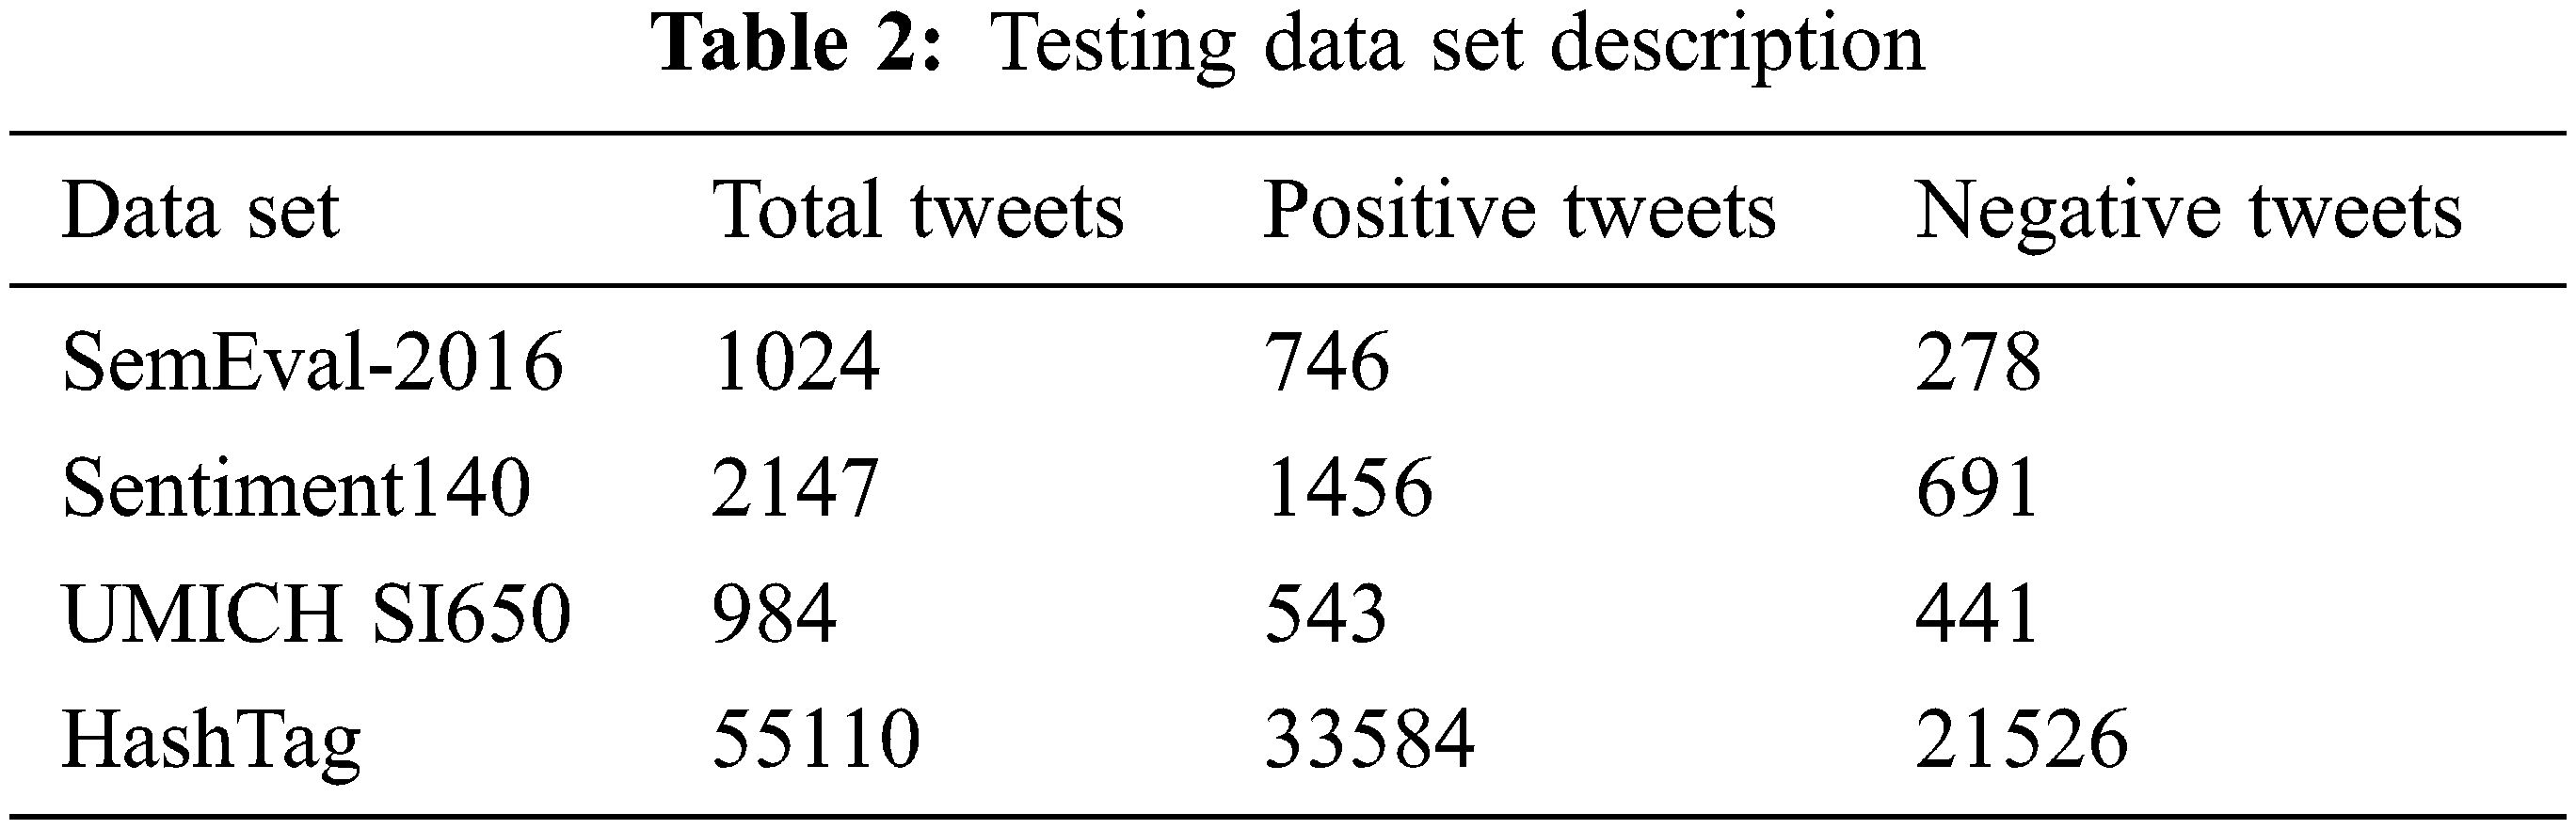
To test the classification accuracy of the proposed method, the following data sets are utilized.
SemEval-2016 Task4
The tweets in this data collection covered a variety of themes, including Sony, Taylor Swift, Trump, Teen Wolf, and others.
Sentiment140
This data set covered various topics, including Google, Kindle 2, San Francisco etc.
UMICH SI650
Kaggle’s Sentiment Classification. The topics of the tweets included The Da Vinci Code, Harry Potter, Mission Impossible, and others.
After integrating these test datasets, the final test dataset comprised 2809 positive and 1346 negative tweets. 10% of our HashTag data collection is incorporated for model testing in addition to these data sets. The number of favorable and negative tweets in each data set is listed in Tab. 2. We’re using a different count for positive and negative tweets in Tab. 2.
This section explains how the suggested approach is evaluated and compared to other current methods in terms of efficiency. The studies are run in a Spark environment with a cluster of 2,4,6,8 nodes. Each node is equipped with the same hardware: an Intel i5 3.1 GHz processor, 16 GB RAM, and a 1 TB hard drive. The version of Spark we used was spark 1.6. The time it takes for our suggested algorithm to run on a single computer is compared to the time it takes in different cluster sizes.
This work uses three metrics to assess the model’s performance: Precision, Recall, and F1 measure. The equations that are used to calculate these metrics are as follows in Eqs. (6) to (8):
Tab. 3 demonstrates the suggested technique’s precision, recall, and F score on four testing data sets. It is evident from this table that the proposed model has a precision and F score of greater than 80%. And, except for the hashtag data collection, recall on all data sets is over 80% accurate. The graph in Fig. 3 shows that the suggested Naive Bayes model offers good precision, recall, and F measure accuracy. The proposed Spark Naive Bayes technique produces good accuracy (above 80%) for all data sets and graphical representations of those accuracy values. Because Naive Bayes is a statistical model, its Spark version has the same accuracy as the sequential version. We also compared the accuracy of the proposed method to that of other machine learning algorithms such as SVM, Decision tree, and K-NN, which were all tested on the UMICH S1650 and Sentiment140 data sets and also the proposed method yields good results than those machine learning methods. The Fig. 4 illustrates these comparison measures
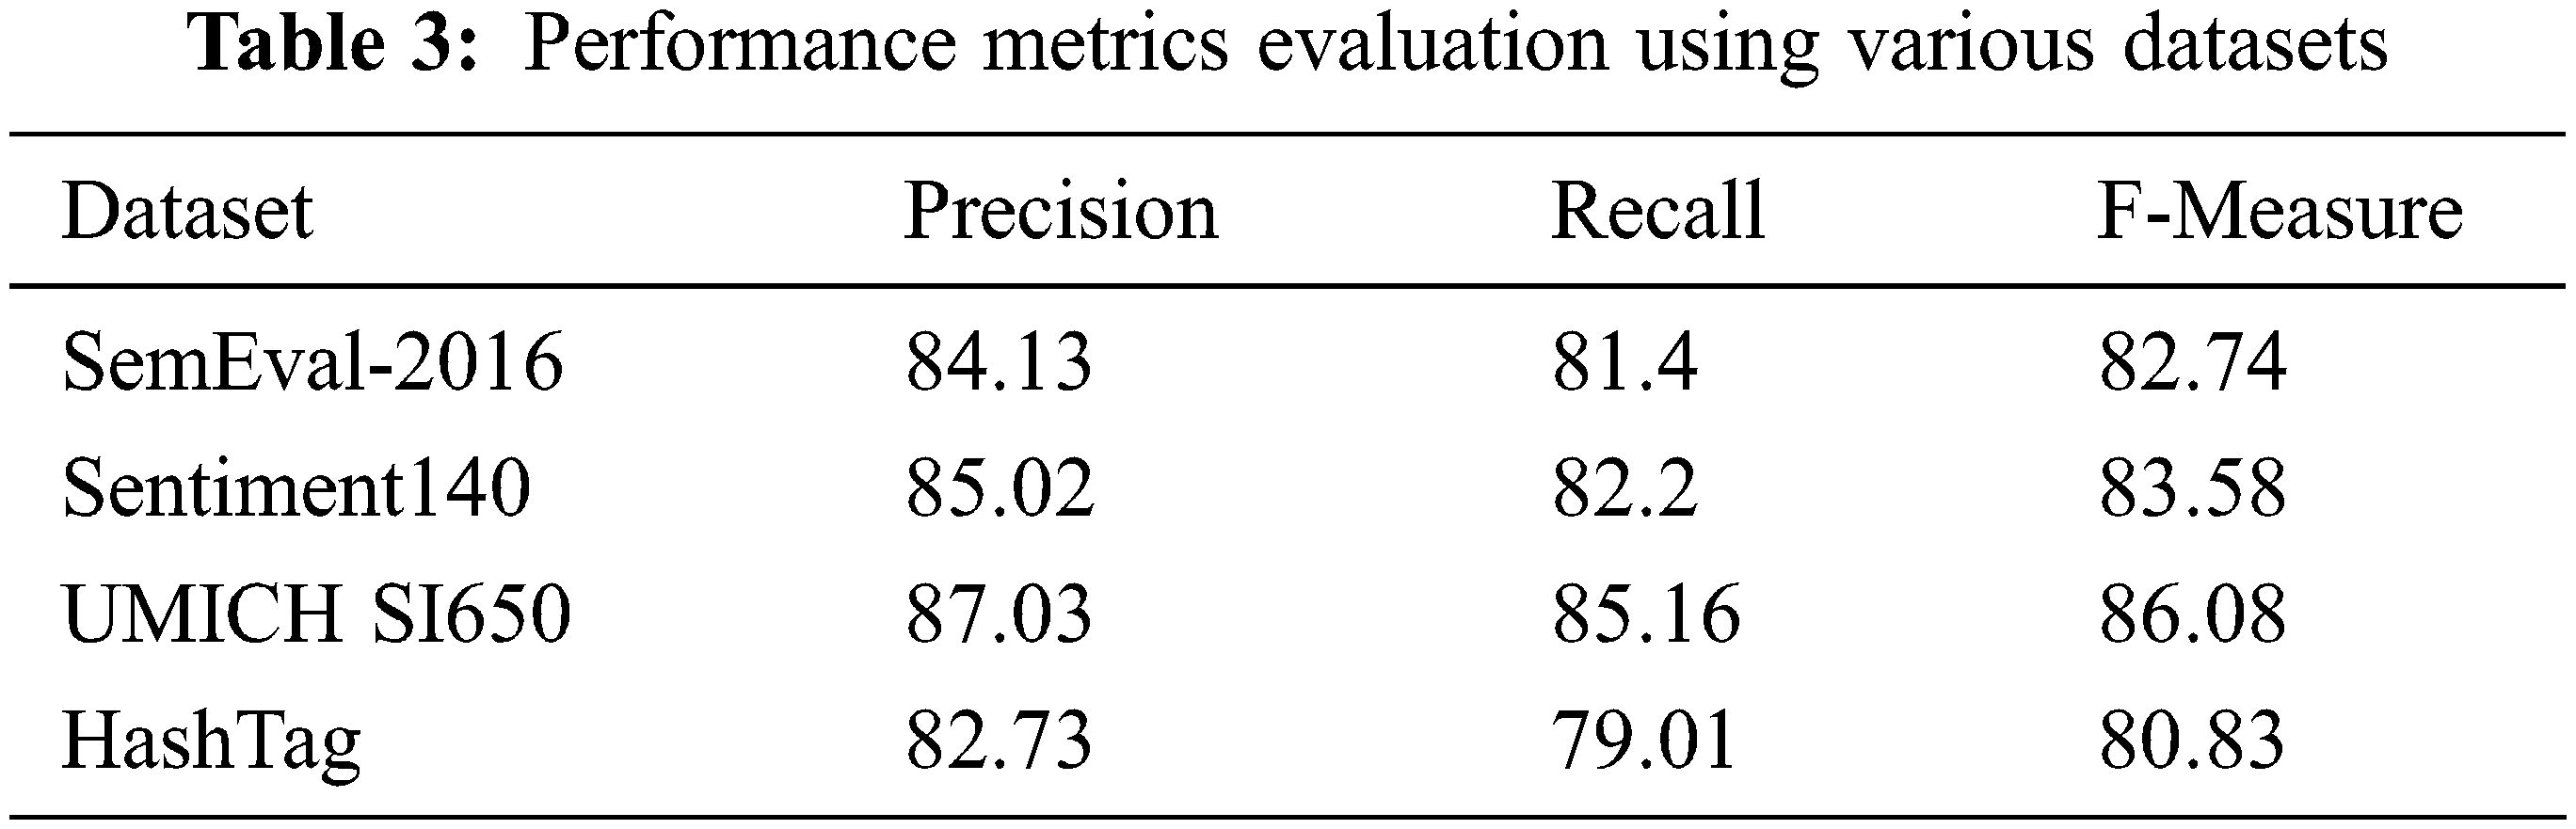

Figure 3: Performance metrics comparison using various datasets
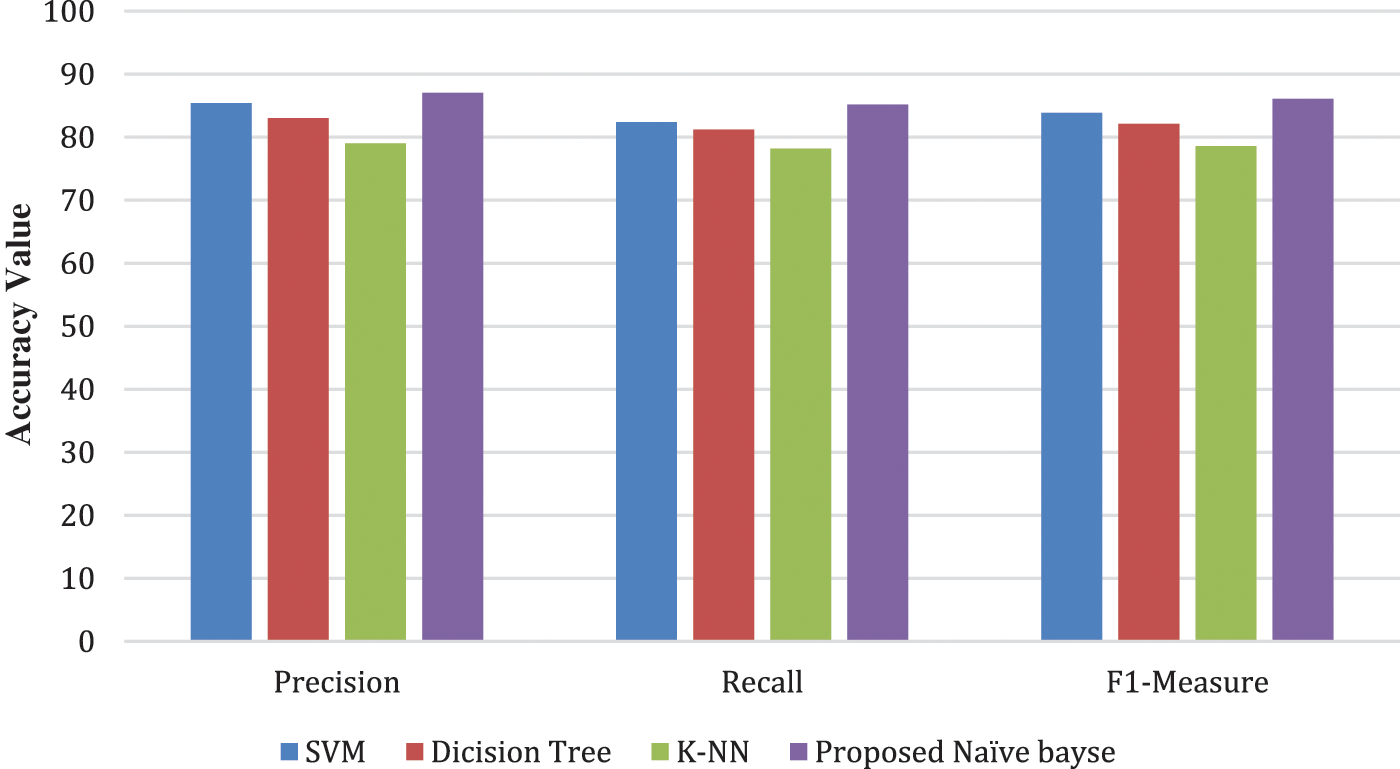
Figure 4: Performance metrics comparison of proposed vs. existing approaches
The main goal of this suggested project is to create an efficient model that can classify input tweets in parallel. The proposed spark model’s training time on an 8-node cluster with various data sets is discussed and comparisons to other parallel Naive Bayes models. It is explained in the Tab. 4. The proposed speedup over an existing parallel naive Bayes model is also demonstrated. The proposed Spark-based model is nearly 9 to 12 times quicker than Li [11] MapRed, as seen in Tab. 4. We’ve set up two map-reduce jobs to execute his model on our data collection. Our model is compared against Apache Mahout Naive Bayes. Tab. 4 also shows the total time taken by Mahout to train the Naive Bayes Classifier. The training time on three different methods are also represented graphically in Fig. 5. This time only includes creating feature vectors (or pre-processing) and training the Naive Bayes Classifier; it does not include the time spent converting the data into Hadoop’s Sequence File, which is the required file format for Mahout and also this time is measured on 8 node clusters. Compared to Mahout’s approach, our algorithm achieves a speedup of 16 to 21. Mahout used roughly 7 MapReduce jobs to construct feature vectors and 3 jobs to train the Naive Bayes model, which took longer.
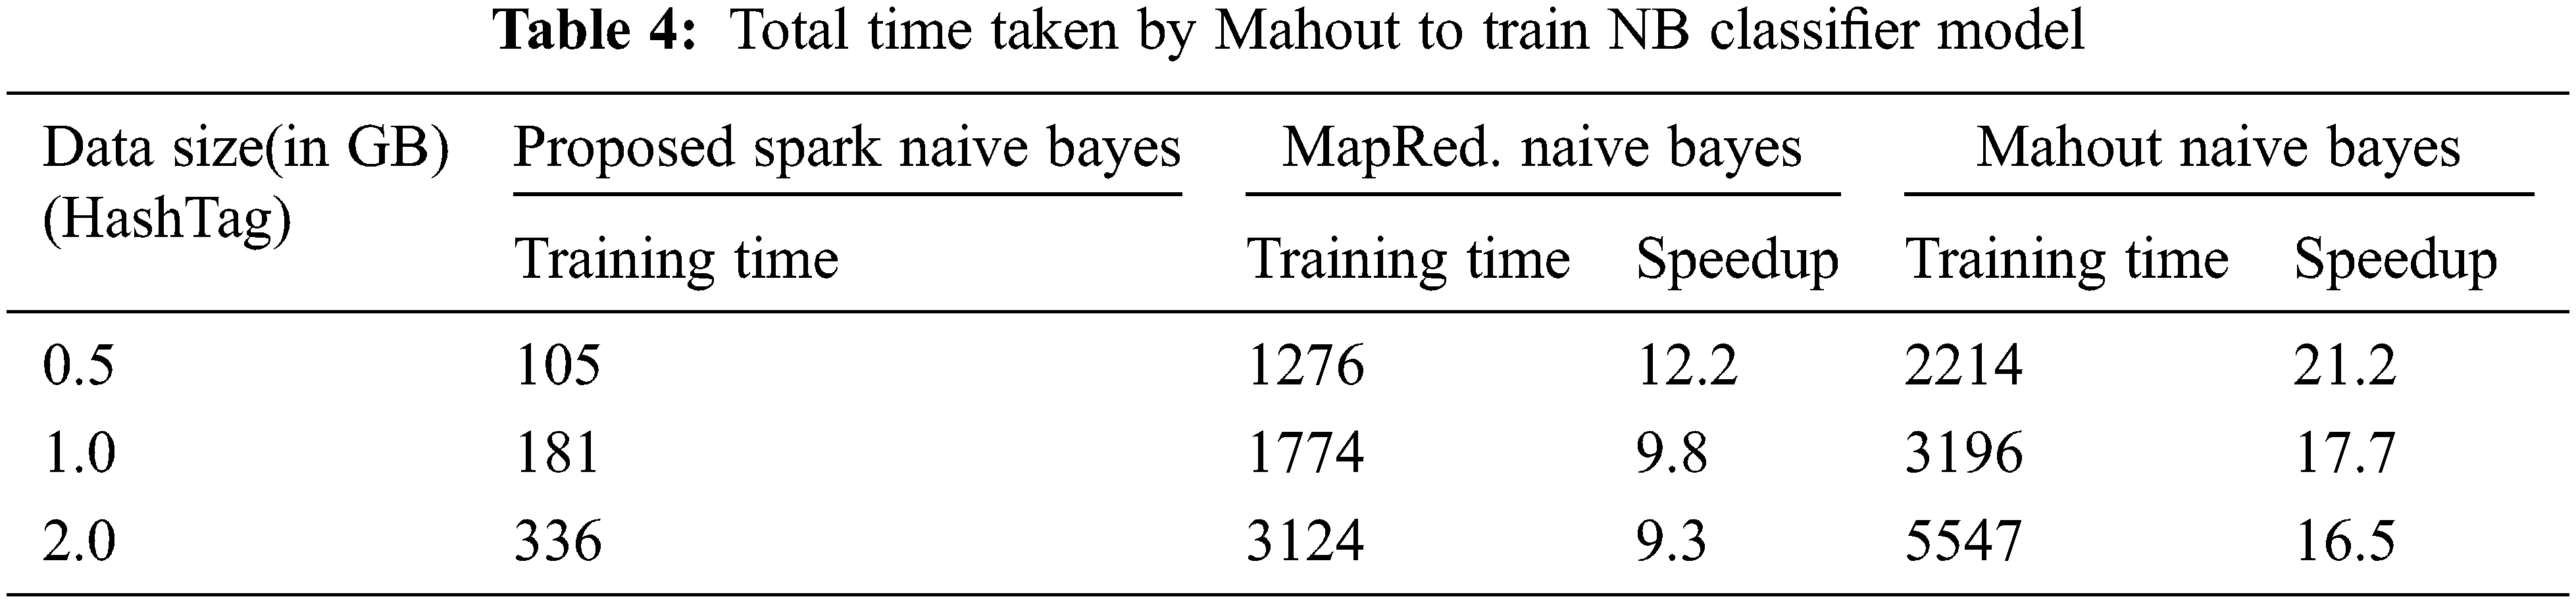
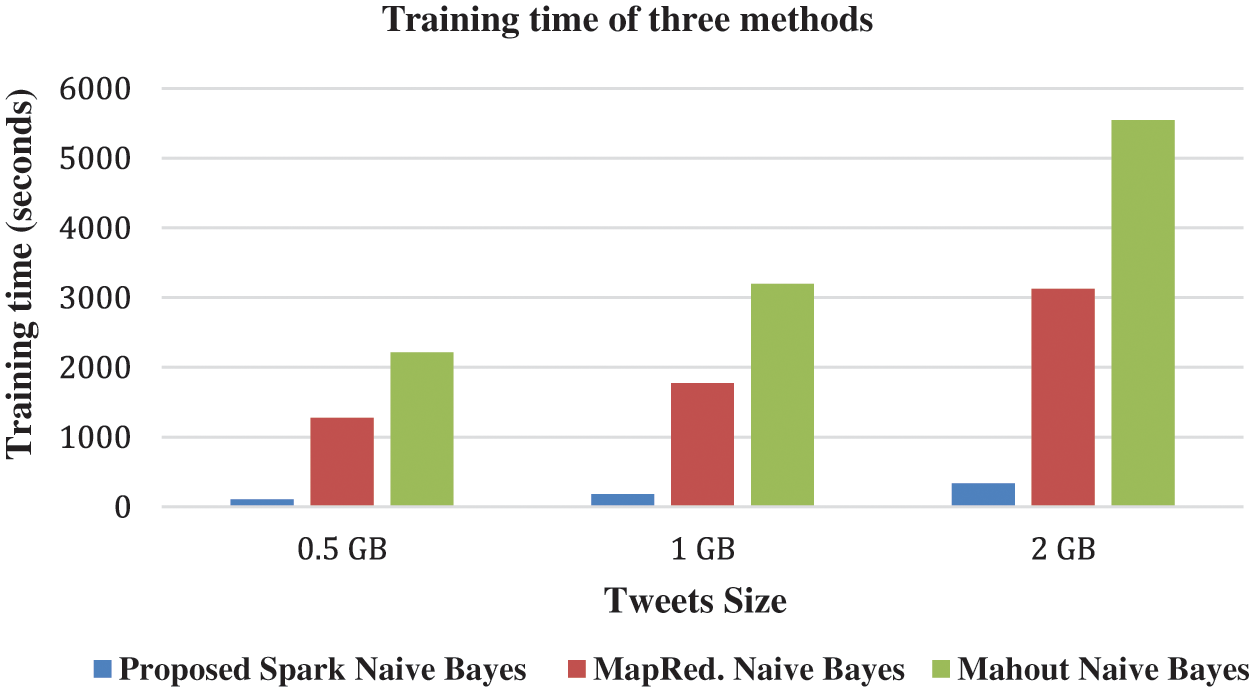
Figure 5: Training time of three methods on three different size tweets
The training time of the proposed model on various sizes of data sets and Spark clusters is shown in Tab. 5, where 4 different clusters are built in this work, including 2 nodes, 4 node, 6 node, and 8 node clusters, and 0.25 GB to 2 GB Hash Set data sets are trained on these clusters. From this Tab. 5, it is deduced that increasing the size of the clusters from 2 to 8 reduces the training time of the proposed Spark Model (See Fig. 6).
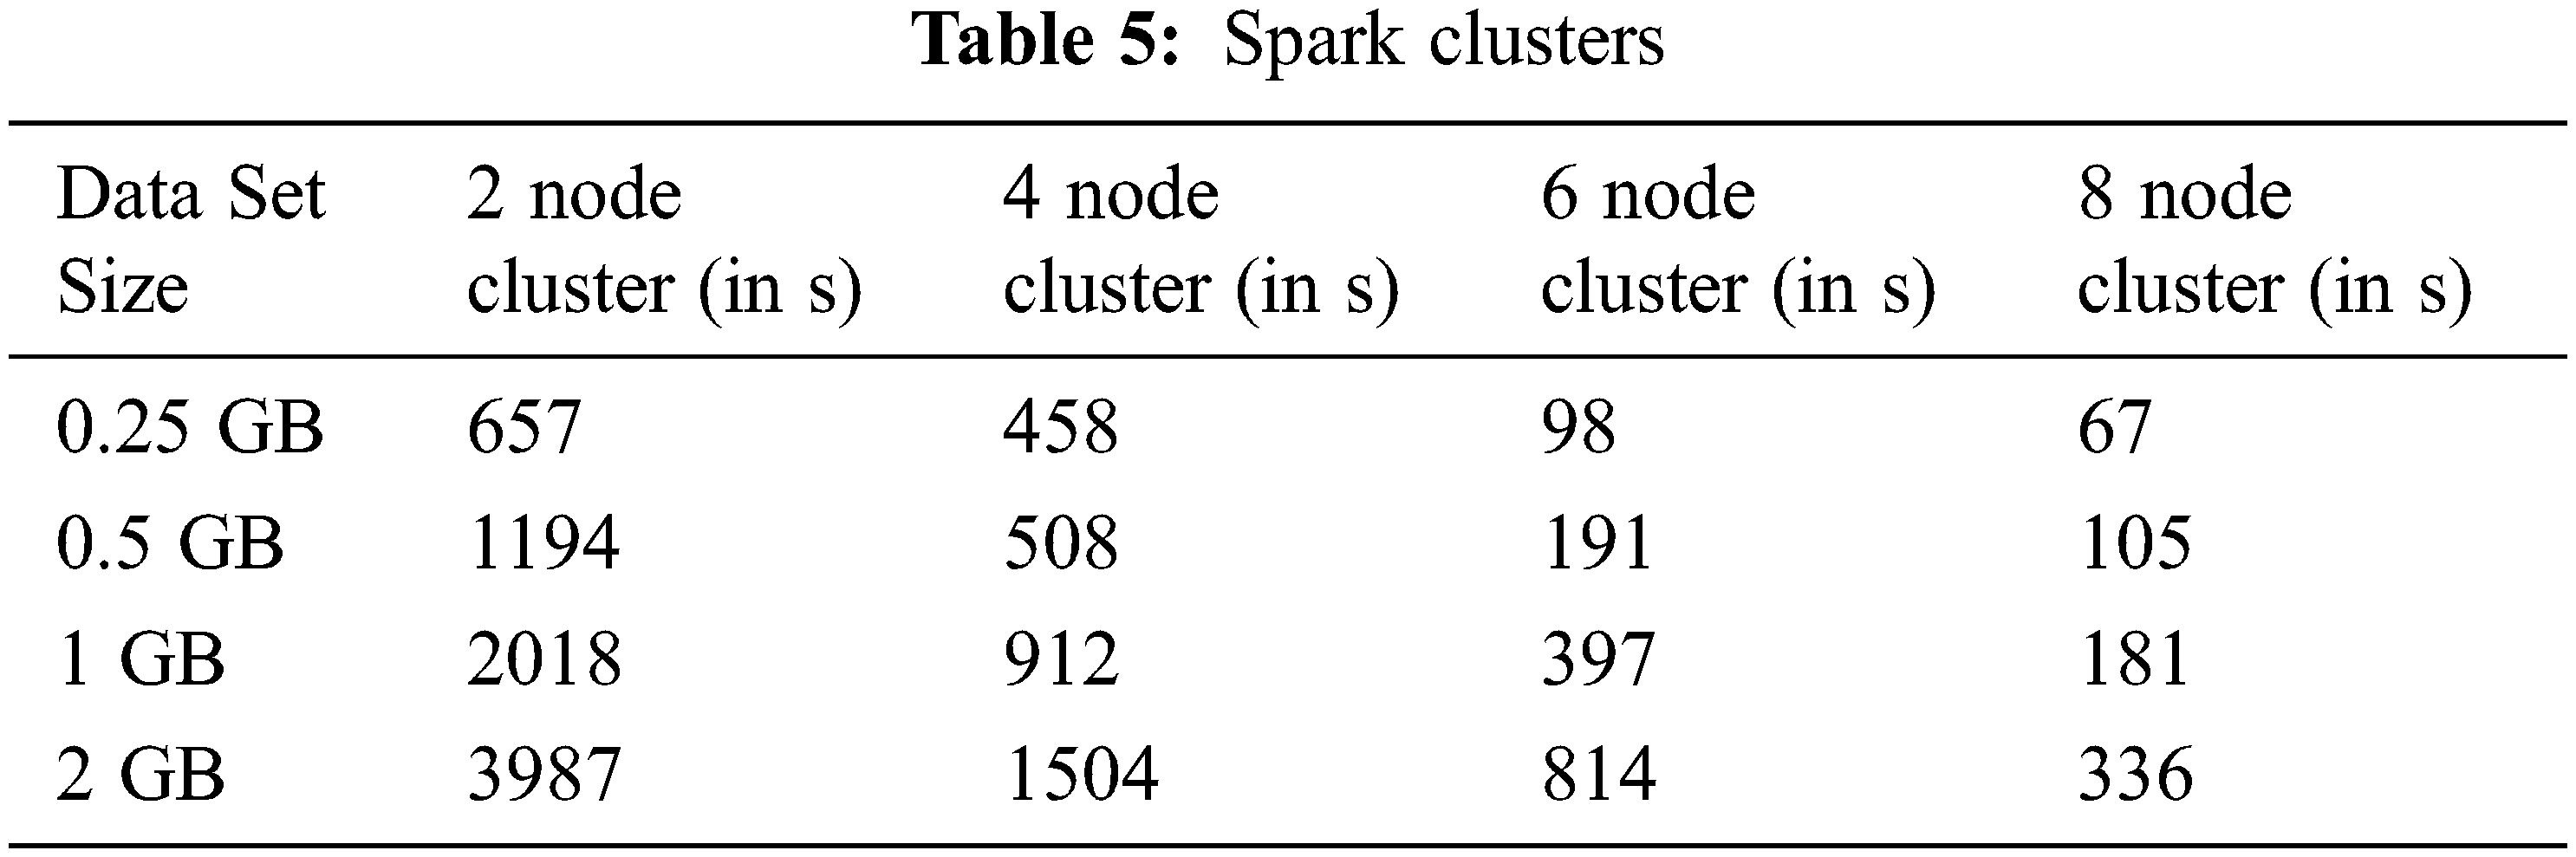
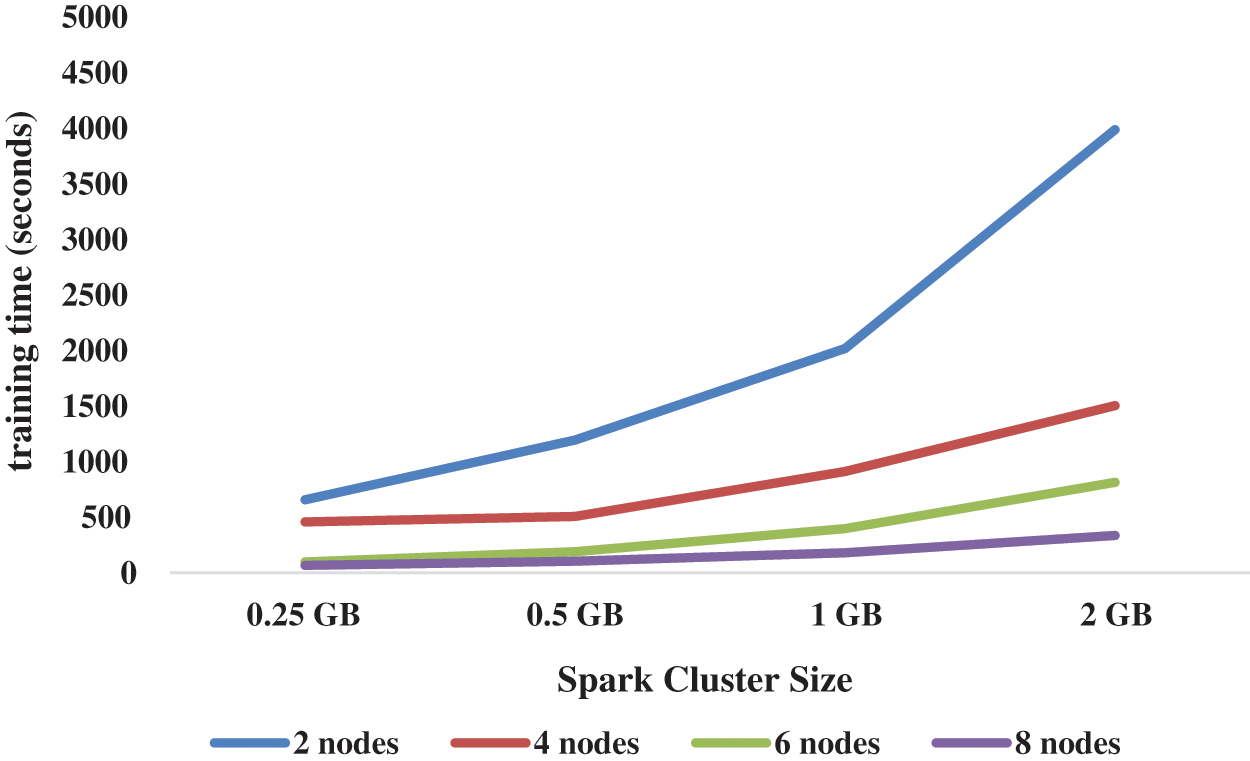
Figure 6: Spark cluster size
This research proposes a Spark-based parallel Naive Bayes Algorithm to classify the tweets according to sentiment polarity. The key feature of this work is to increase the speedup of the classification process by incorporating the Spark Framework. The proposed Spark-based algorithm is compared with Map Reduce-based and Mahout-based algorithms regarding training time and speedup. Moreover, the accuracy of the proposed algorithms is calculated in terms of precision, recall, and F-Measure. The proposed method yields a good accuracy score on 4 real-world Twitter Data sets. In the Future, advanced pre-processing and feature selection/extraction techniques are used to enhance the accuracy further, and it is expanded for multi-class sentiment analysis.
Acknowledgement: We thank our university to provide the infrastructure to test our proposed work.
Funding Statement: The authors received no specific funding for this study
Conflicts of Interest: The authors declare that they have no conflicts of interest to report regarding the present study
1. F. Hemmatian and M. K. Sohrabi, “A survey on classification techniques for opinion mining and sentiment analysis,” Artificial Intelligence Review, vol. 52, no. 3, pp. 1495–1545, 2019. [Google Scholar]
2. H. Kaur, S. U. Ahsaan, B. Alankar and V. Chang, “A proposed sentiment analysis deep learning algorithm for analyzing COVID-19 tweets,” Information Systems Frontiers, vol. 23, no. 6, pp. 1417–1429, 2021. [Google Scholar]
3. S. Yi and X. Liu, “Machine learning-based customer sentiment analysis for recommending shoppers, shops based on customers’ review,” Complex & Intelligent Systems, vol. 6, no. 3, pp. 621–634, 2020. [Google Scholar]
4. A. Yadav and D. K. Vishwakarma, “Sentiment analysis using deep learning architectures: A review,” Artificial Intelligence Review, vol. 53, no. 6, pp. 4335–4385, 2020. [Google Scholar]
5. S. Aloufi and A. E. Saddik, “Sentiment identification in football-specific tweets,” IEEE Access, vol. 6, no. 1, pp. 78609–78621, 2018. [Google Scholar]
6. L. Yang, Y. Li, J. Wang and R. S. Sherratt, “Sentiment analysis for e-commerce product reviews in chinese based on sentiment lexicon and deep learning,” IEEE Access, vol. 8, no. 1, pp. 23522–23530, 2020. [Google Scholar]
7. X. R. Zhang, W. F. Zhang, W. Sun, X. M. Sun and S. K. Jha, “A robust 3-D medical watermarking based on wavelet transform for data protection,” Computer Systems Science & Engineering, vol. 41, no. 3, pp. 1043–1056, 2022. [Google Scholar]
8. X. R. Zhang, X. Sun, X. M. Sun, W. Sun and S. K. Jha, “Robust reversible audio watermarking scheme for telemedicine and privacy protection,” Computers Materials & Continua, vol. 71, no. 2, pp. 3035–3050, 2022. [Google Scholar]
9. P. Akilandeswari, R. Harshita and M. Sumanth, “Sentiment analysis using machine learning through twitter streaming API,” International Journal of Engineering & Technology, vol. 7, no. 3, pp. 168–1174, 2018. [Google Scholar]
10. B. Liu, E. Blasch, Y. Chen, D. Shen and G. Chen, “Scalable sentiment classification for big data analysis using naive bayes classifier,” in Proc. IEEE Int. Conf. on Big Data, Washington, USA, pp. 99–104, 2016. [Google Scholar]
11. Z. Li, “Naive bayes algorithm for twitter sentiment analysis and its implementation in map-reduce,” Ph.D. dissertation, University of Missouri, Columbia, 2014. [Google Scholar]
12. I. Ha, B. Back and B. Ahn, “Map-reduce functions to analyze sentiment information from social big data,” International Journal of Distributed Sensor Networks, vol. 11, no. 6, pp. 1–11, 2015. [Google Scholar]
13. S. Prom-on, S. Ranong, P. Jenviriyakul, T. Wongkaew, N. Saetiew et al., “Dom: A big data analytics framework for mining Thai public opinions,” in Proc. Int. Conf. on Computer, Control, Informatics and Its Applications, Bandung, Indonesia, pp. 1–6, 2014. [Google Scholar]
14. F. Es-Sabery, K. Es-Sabery, J. Qadir, B. Sainz-de-abajo, A. Hair et al., “A mapreduce opinion mining for COVID-19-related tweets classification using enhanced ID3 decision tree classifier,” IEEE Access, vol. 9, no. 1, pp. 58706–58739, 2021. [Google Scholar]
15. V. N. Khuc, C. Shivade, R. Ramnath and J. Ramanathan, “Towards building large-scale distributed system for twitter sentiment analysis,” in Proc. 27th Annual ACM Symp. on Applied Computing, New York, USA, pp. 459–464, 2012. [Google Scholar]
16. M. M. Iqbal and K. Latha, “An effective community-based link prediction model for improving accuracy in social networks,” Journal of Intelligent and Fuzzy Systems, vol. 42, no. 3, pp. 2695–2711, 2022. [Google Scholar]
17. P. D. Nurfadila, A. P. Wibawa, I. A. E. Zaeni and A. Nafalski, “Journal classification using cosine similarity method on title and abstract with frequency-based stop word removal,” International Journal of Artificial Intelligence Research, vol. 3, no. 3, pp. 28–37, 2019. [Google Scholar]
18. P. P. Surya and B. Subbulakshmi, “Sentimental analysis using naive bayes classifier,” in Proc. Int. Conf. on Vision Towards Emerging Trends in Communication and Networking (ViTECoN), Vellore, India, pp. 761–765, 2019. [Google Scholar]
 | This work is licensed under a Creative Commons Attribution 4.0 International License, which permits unrestricted use, distribution, and reproduction in any medium, provided the original work is properly cited. |