DOI:10.32604/iasc.2023.029037
| Intelligent Automation & Soft Computing DOI:10.32604/iasc.2023.029037 | |
| Article |
Game Theory-Based Dynamic Weighted Ensemble for Retinal Disease Classification
Department of CSE, CEG, Anna University, Chennai, 600025, India
*Corresponding Author: Kanupriya Mittal. Email: kanu.05@gmail.com
Received: 23 February 2022; Accepted: 01 April 2022
Abstract: An automated retinal disease detection system has long been in existence and it provides a safe, no-contact and cost-effective solution for detecting this disease. This paper presents a game theory-based dynamic weighted ensemble of a feature extraction-based machine learning model and a deep transfer learning model for automatic retinal disease detection. The feature extraction-based machine learning model uses Gaussian kernel-based fuzzy rough sets for reduction of features, and XGBoost classifier for the classification. The transfer learning model uses VGG16 or ResNet50 or Inception-ResNet-v2. A novel ensemble classifier based on the game theory approach is proposed for the fusion of the outputs of the transfer learning model and the XGBoost classifier model. The ensemble approach significantly improves the accuracy of retinal disease prediction and results in an excellent performance when compared to the individual deep learning and feature-based models.
Keywords: Game theory; weighted ensemble; fuzzy rough sets; retinal disease
In the recent past, there has been an increase in the occurrence of retinal diseases. During the Covid-19 pandemic when the world was under a lockdown, screen time had increased multifold among all age groups. Computer-aided systems are very useful for medical practitioners to diagnose any abnormality well in advance and hence, to provide early treatment. Automated systems help ophthalmologists in detecting and diagnosing retinal diseases such as diabetic retinopathy (DR) and age-related macular degeneration (AMD).
Diabetic retinopathy (DR) is a retinal complication that is caused due to diabetes. DR is characterized by changes in blood vessels and leakage of fluids/bleeding from the vessels, leading to the damage of the retinal vessels [1,2]. AMD is one of the main causes of vision loss in people aged 50 and above. It causes loss in central vision, which is needed for everyday life activities such as driving and reading [3]. These diseases can be identified using various retinal fundus imaging techniques and the optical coherence tomography (OCT) technique [4,5].
In this proposed work, an automated system for detection of various retinal diseases using an ensemble of classifiers is proposed. The automated system can be classified into three types of classes, namely, DR, AMD and healthy retinal images. The proposed method is divided into three phases. Initially, a 2-level discrete wavelet transformation (DWT) is applied on the pre-processed images. In the first phase, LBP and HOG features are extracted from the 2-level DWT transformed images. Then, Gaussian kernel-based fuzzy-rough sets are applied for feature reduction; the reduct features are then processed with the synthetic minority oversampling technique (SMOTE) for handling the imbalanced class distribution and finally, the XGBoost classifier classifies into one of the three classes. In the second phase, a transfer learning model is applied on the DWT pre-processed images and the images are classified into one of the three classes. In the third phase, a novel game theory-based dynamic weighted ensemble of the transfer learning-based classifier model and the XGBoost-based classifier model is proposed.
Ensemble classifiers have become common in terms of their usage, and their end results are of a higher accuracy compared to that of the individual classifiers. In the multi-labelled classification, it is seen that different classifiers have different capabilities in classifying different classes. That is, a particular classifier may classify one class with a high accuracy while not being able to classify another class, even for the same dataset. Thus, when an ensemble of classifiers is constructed, giving equal weightage to the classification results of all the classifiers may not yield the best performance. Finding appropriate weights for each class for each classifier, while combining the outputs of the individual classifiers, can improve the performance of the ensemble model. This has been the motivation for us to develop the proposed game theory-based ensemble classifier.
The main contributions of this paper are (1) a machine learning pipeline for classification using Gaussian kernel-based fuzzy rough sets and XGBoost, (2) a novel ensemble classification framework incorporating game theory. The ensemble classifier is formulated as a non-cooperative refereed game in which classifiers are players and the referee is the ensemble algorithm (3) a novel approach to combine soft labels and hard labels in an ensemble. To the best of our knowledge, this paper is the first to develop a game theoretical model to create a fusion of the output of the individual classifiers in retinal disease classification.
The paper is organized as follows: Section 2 provides details on the existing work. Section 3 gives details about the proposed methodology. Section 4 points the results obtained and discusses the results. Section 5 concludes the paper.
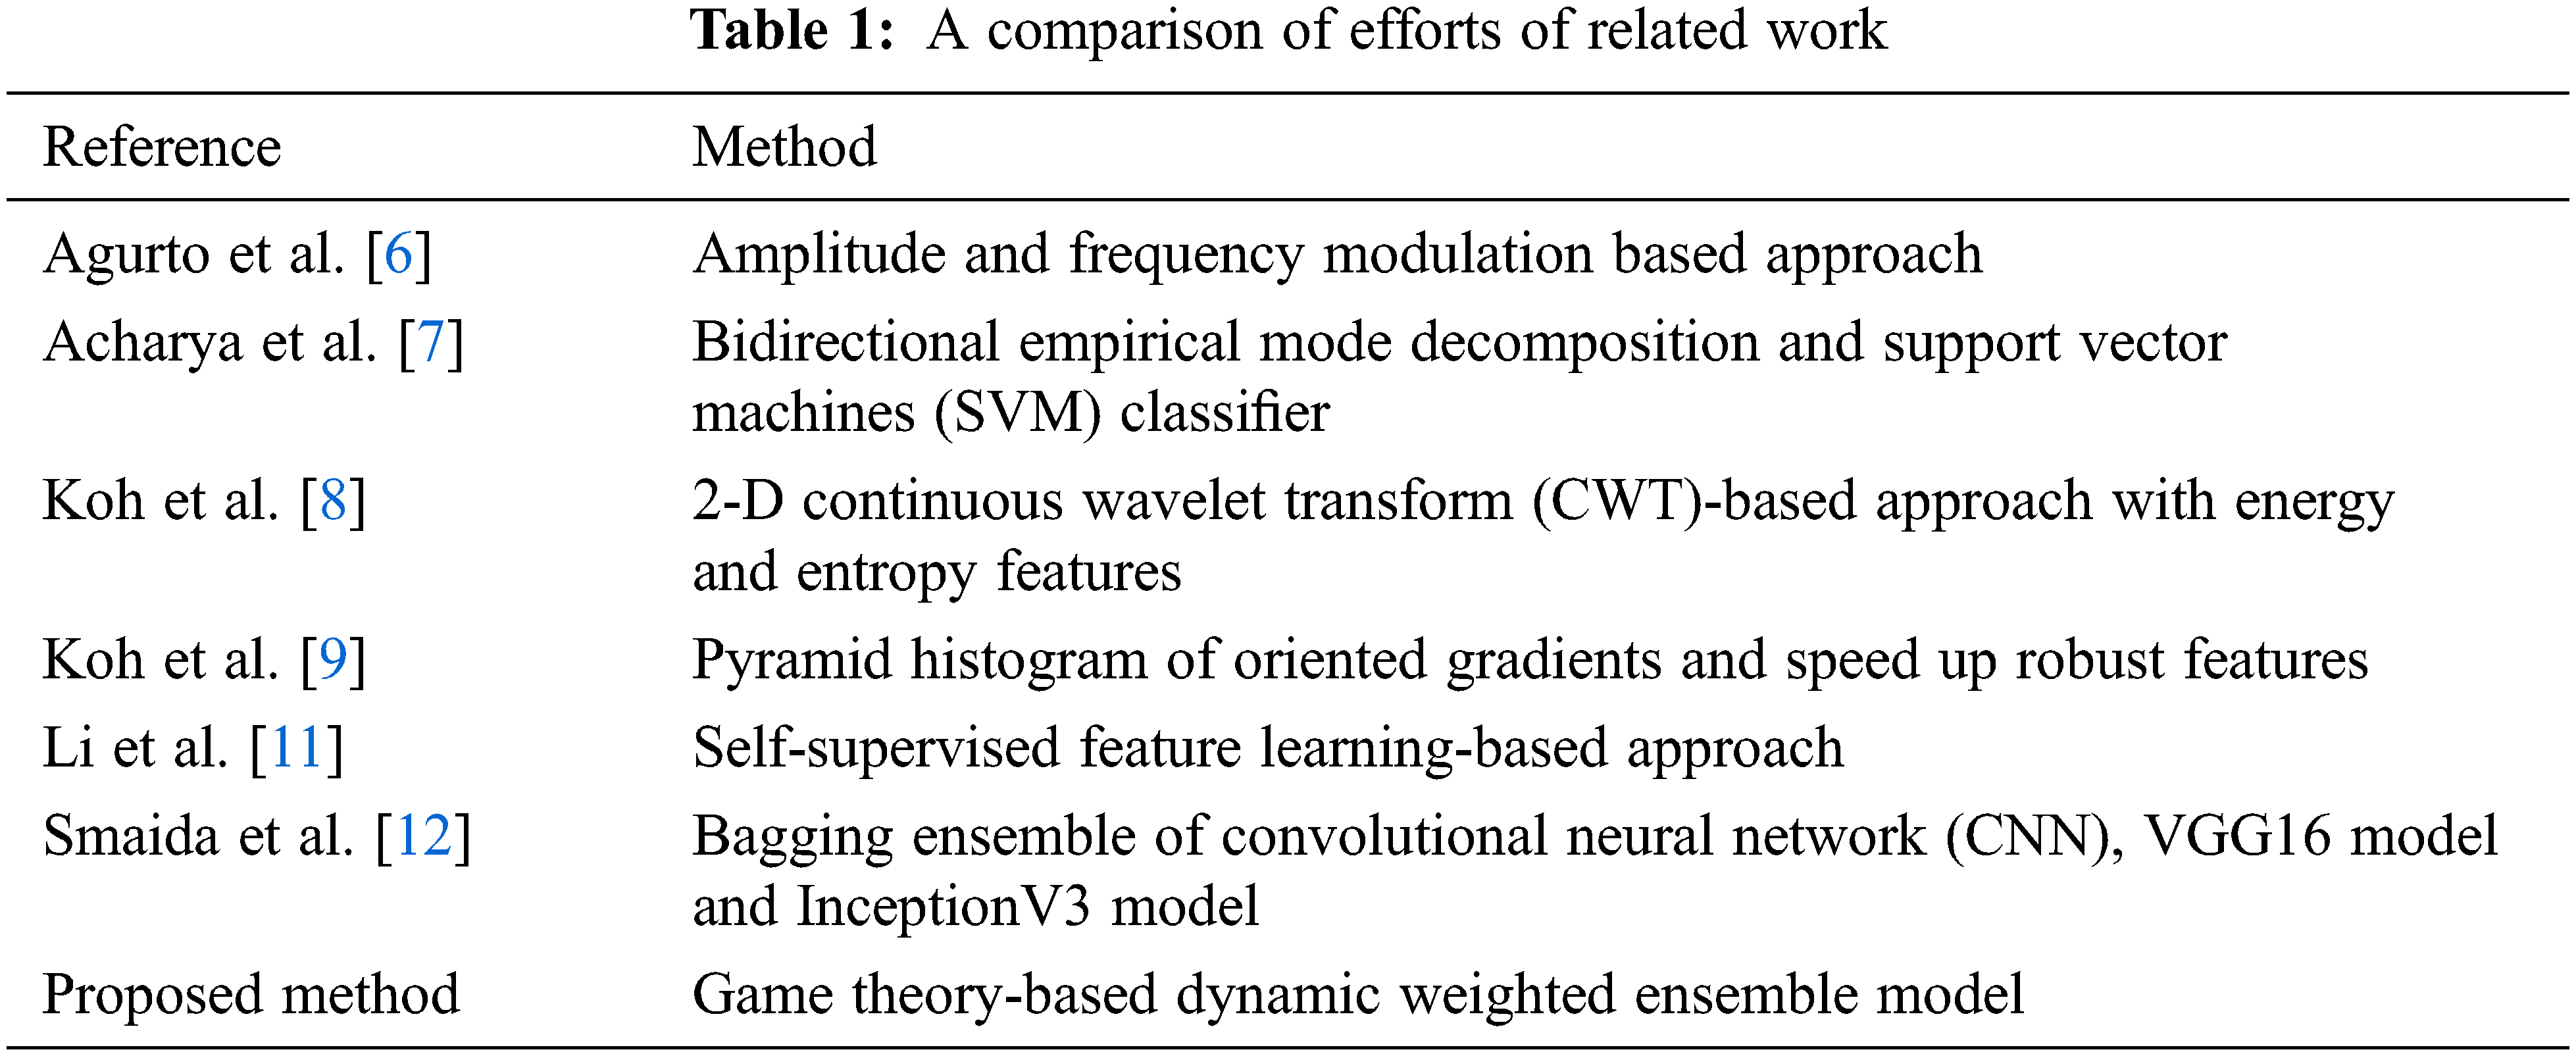
In the last few years, several techniques have been proposed for the automated detection of DR and AMD retinal diseases from retinal fundus images. Agurto et al. have proposed the amplitude modulation and frequency modulation-based approach to discern DR and AMD from fundus images [6]. Acharya et al. have identified AMD, DR and glaucoma from fundus images using bidirectional empirical mode decomposition and have used the support vector machines (SVM) classifier for classification into normal and abnormal classes [7]. Koh et al. have proposed a 2-D continuous wavelet transform (CWT)-based approach with energy and entropy features to detect normal and abnormal (AMD, DR and glaucoma) fundus images [8]. In another work, Koh et al. have developed an automated retinal screening system to distinguish normal and abnormal (AMD, DR and glaucoma) fundus images using pyramid histogram of oriented gradients and speed up robust features. In both the works, the particle swarm optimization (PSO) technique has been used for feature optimization [9]. Adal et al. have introduced a robust approach for the identification of retinal changes due to small red lesions by using normalized images that notably reduce the variations in illumination [10].
A self-supervised feature learning-based approach has been proposed by Li et al. [11] for retinal disease diagnosis. Here, multi-modal images, that is, colour fundus images with fundus fluorescein angiography images have been used. The neural network takes the semantic information common in both the modalities for retinal disease detection. A bagging ensemble of convolutional neural network (CNN), VGG16 model and InceptionV3 model has been used for the detection of DR, glaucoma and myopia from retinal fundus images by Smaida et al. [12]. An ensemble approach with bagging and multi-objective optimized weights for diabetes prediction has been proposed by Bashir et al. [13]. Tab. 1 gives the comparison of the related work for retinal disease classification.
As a mathematical tool, game theory has mostly been used to support decision making in the field of economics, communication networks, robotics, agriculture and many other fields. Recently, game theory-based ensemble of machine learning and deep learning techniques have been the central focus of research in various fields. A support vector machine (SVM) classification algorithm using ensemble kernel function model-based on the game theory has been proposed by Liu et al. [14]; the game theory-based kernel model effectively has given a better classification result for different datasets. The strategic coalition game, specifically the weighted majority game (WMG) approach incorporated into a multi-classifier decision fusion system, has been used for groundcover classification by Bruce et al. [15]. Ykhlef et al. have introduced an audio tagging system composed of an ensemble of deep learners with the coalitional game fusion strategy. The approach has been tested on a dataset made of sound recordings and a remarkable performance has been achieved [16]. Zhang et al. have proposed a label smoothing approach to generate soft labels by applying weighted average between distribution and hard labels [17].
In the discipline of medical information analysis and decision making, game theory is in its infancy. Coalition game and choquet integral-based deep learning model has been proposed by Bhowal et al. for Covid-19 screening from chest X-ray images [18]. Game theory and tree decomposition techniques have been applied to random forest predictor to work towards the prediction of dual molecular diagnosis cases by Versbraegen et al. [19]. Yang et al. have proposed a game-based channel access for age of information in multi–channel internet of things with the under dynamic attack. Nash equilibrium and distributed learning algorithm has been used with the reinforcement learning approach [20].
3 Proposed Methodology (TL-XGB Ensemble Model)
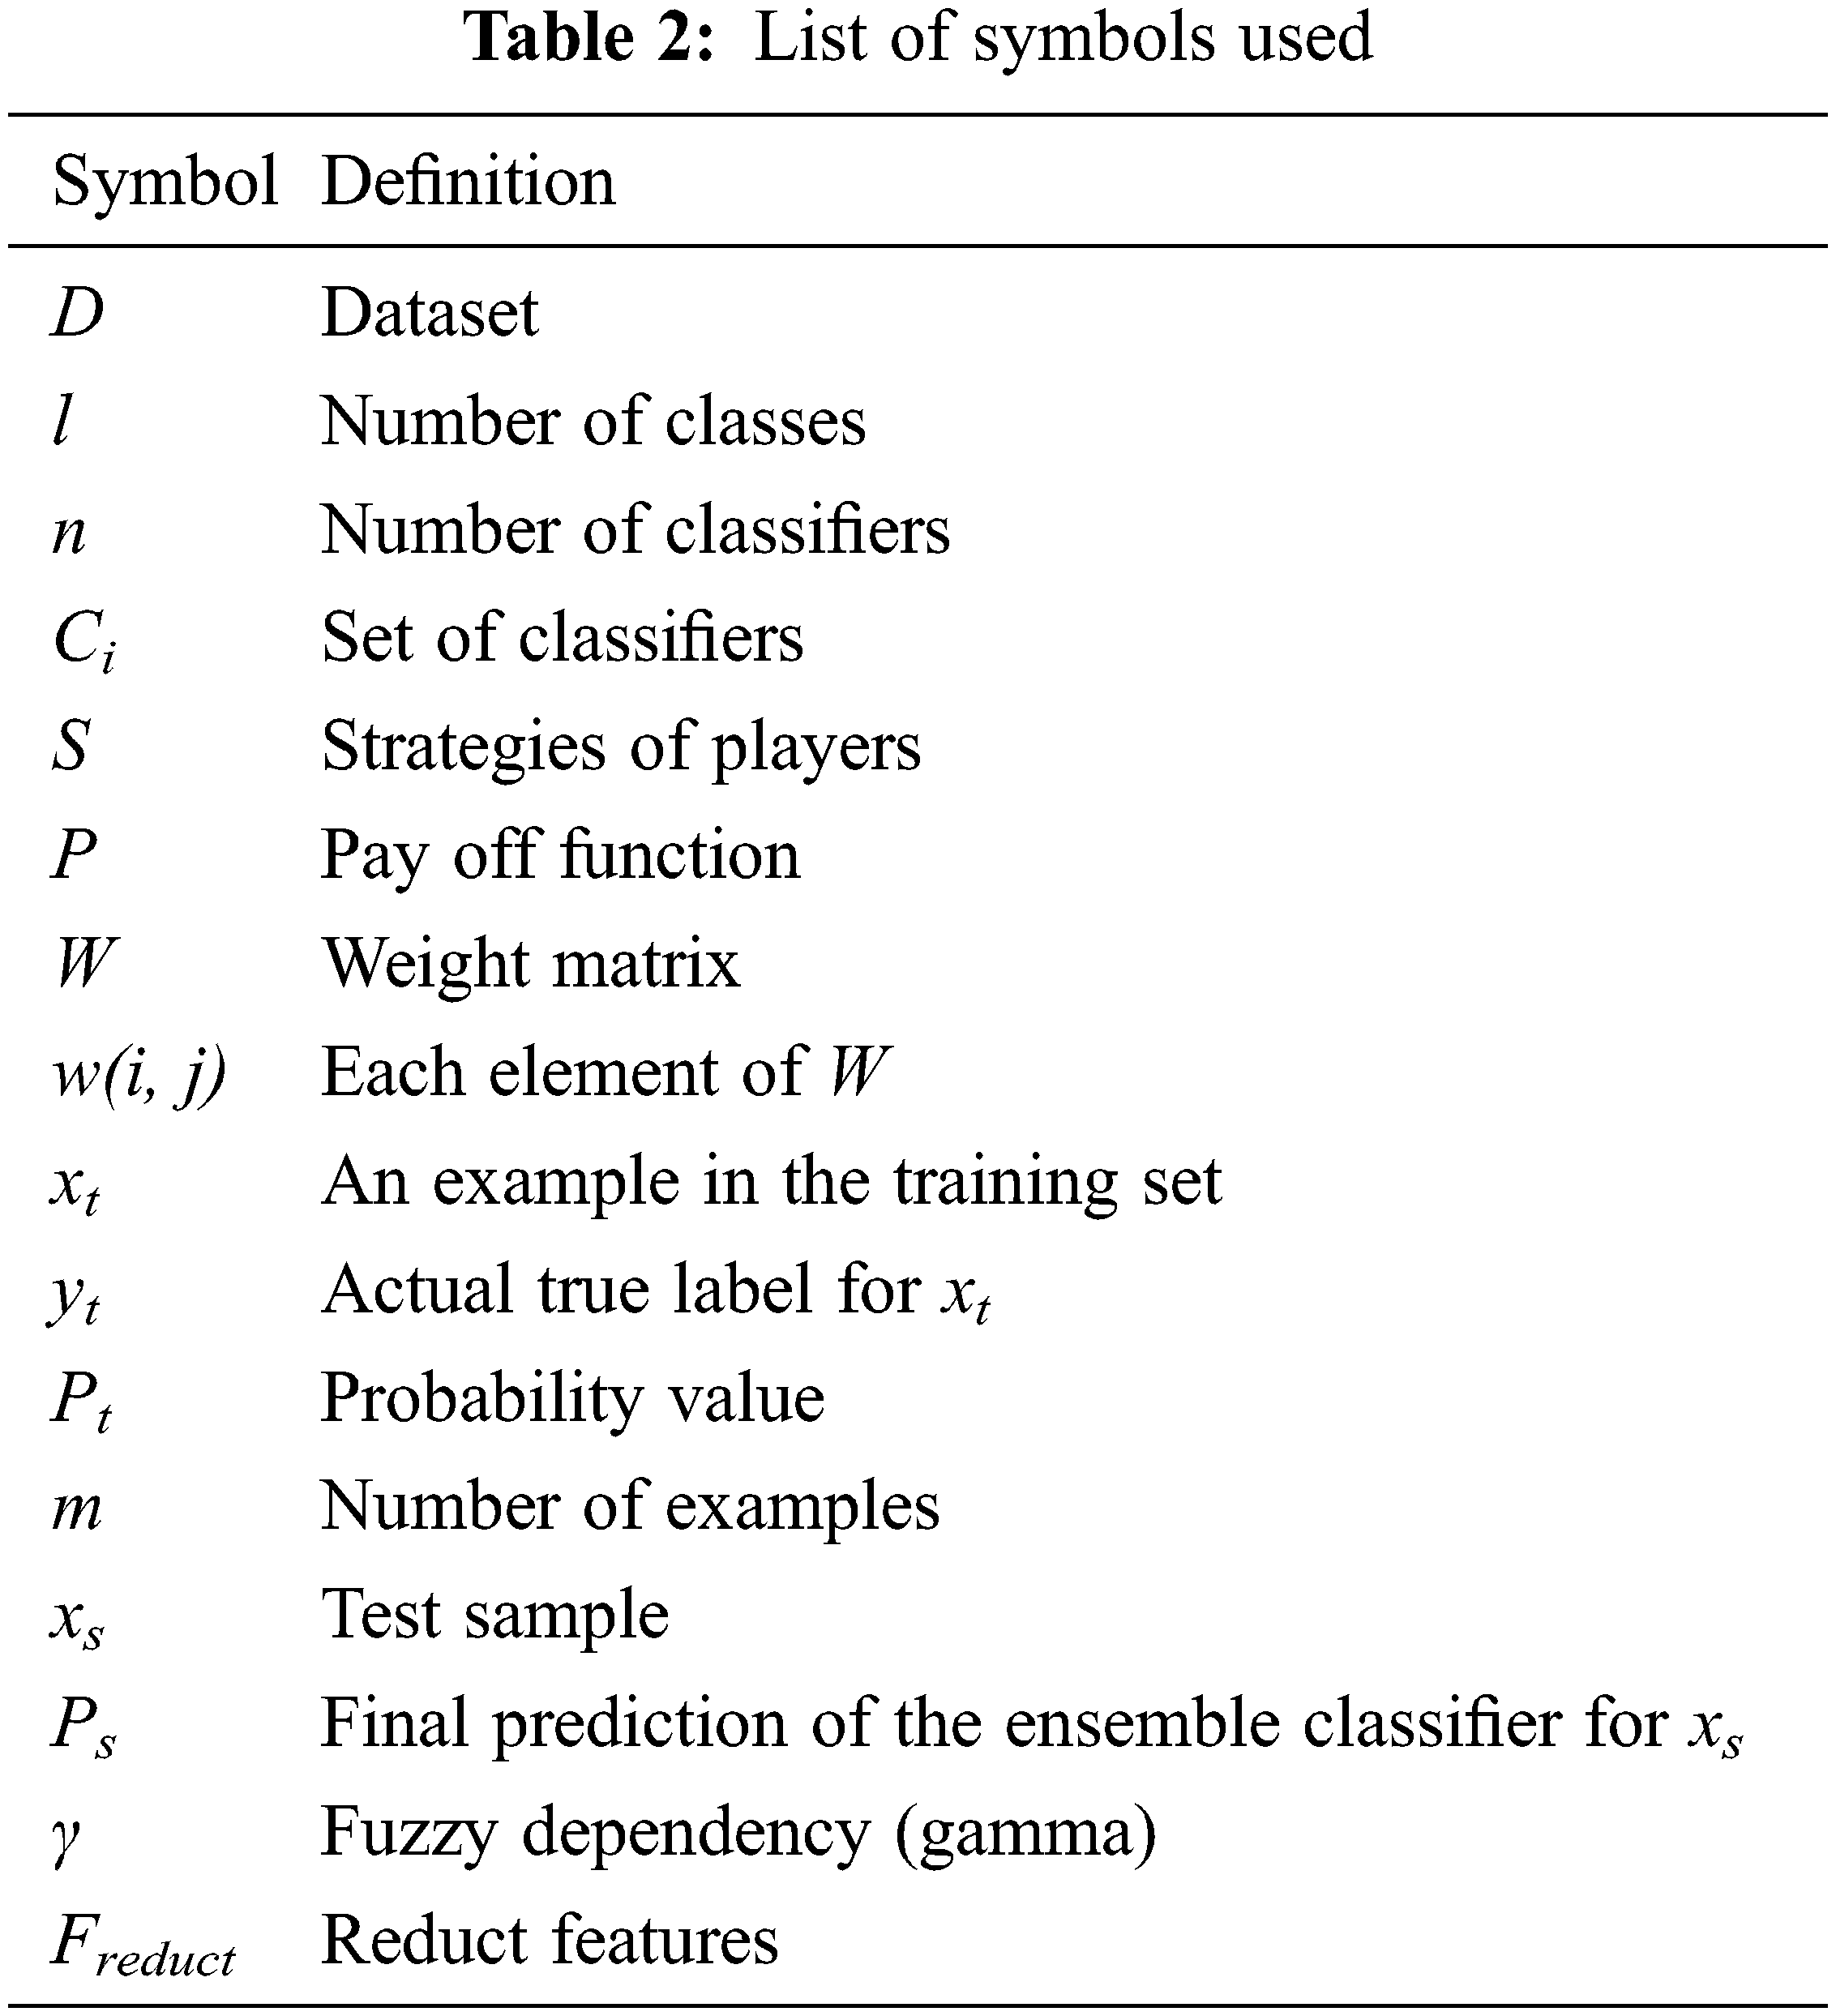
The work proposes a game theory-based dynamic weighted ensemble of two classifiers, one based on a transfer learning (TL) model and the other using a feature extraction-based XGBoost classifier model, and hence is named as TL-XGB ensemble. The schematic diagram of the proposed TL-XGB ensemble model is depicted in Fig. 1. The proposed methodology comprises the following: pre-processing, discrete wavelet transformation of the pre-processed image, feature extraction followed by Gaussian kernel-based fuzzy rough sets for feature reduction, XGBoost-based classification based on the feature reduct, classification using the transfer learning model and the game theory-based dynamic weighted ensemble model for the retinal disease classification. Tab. 2 gives the details of the notations used in this paper.
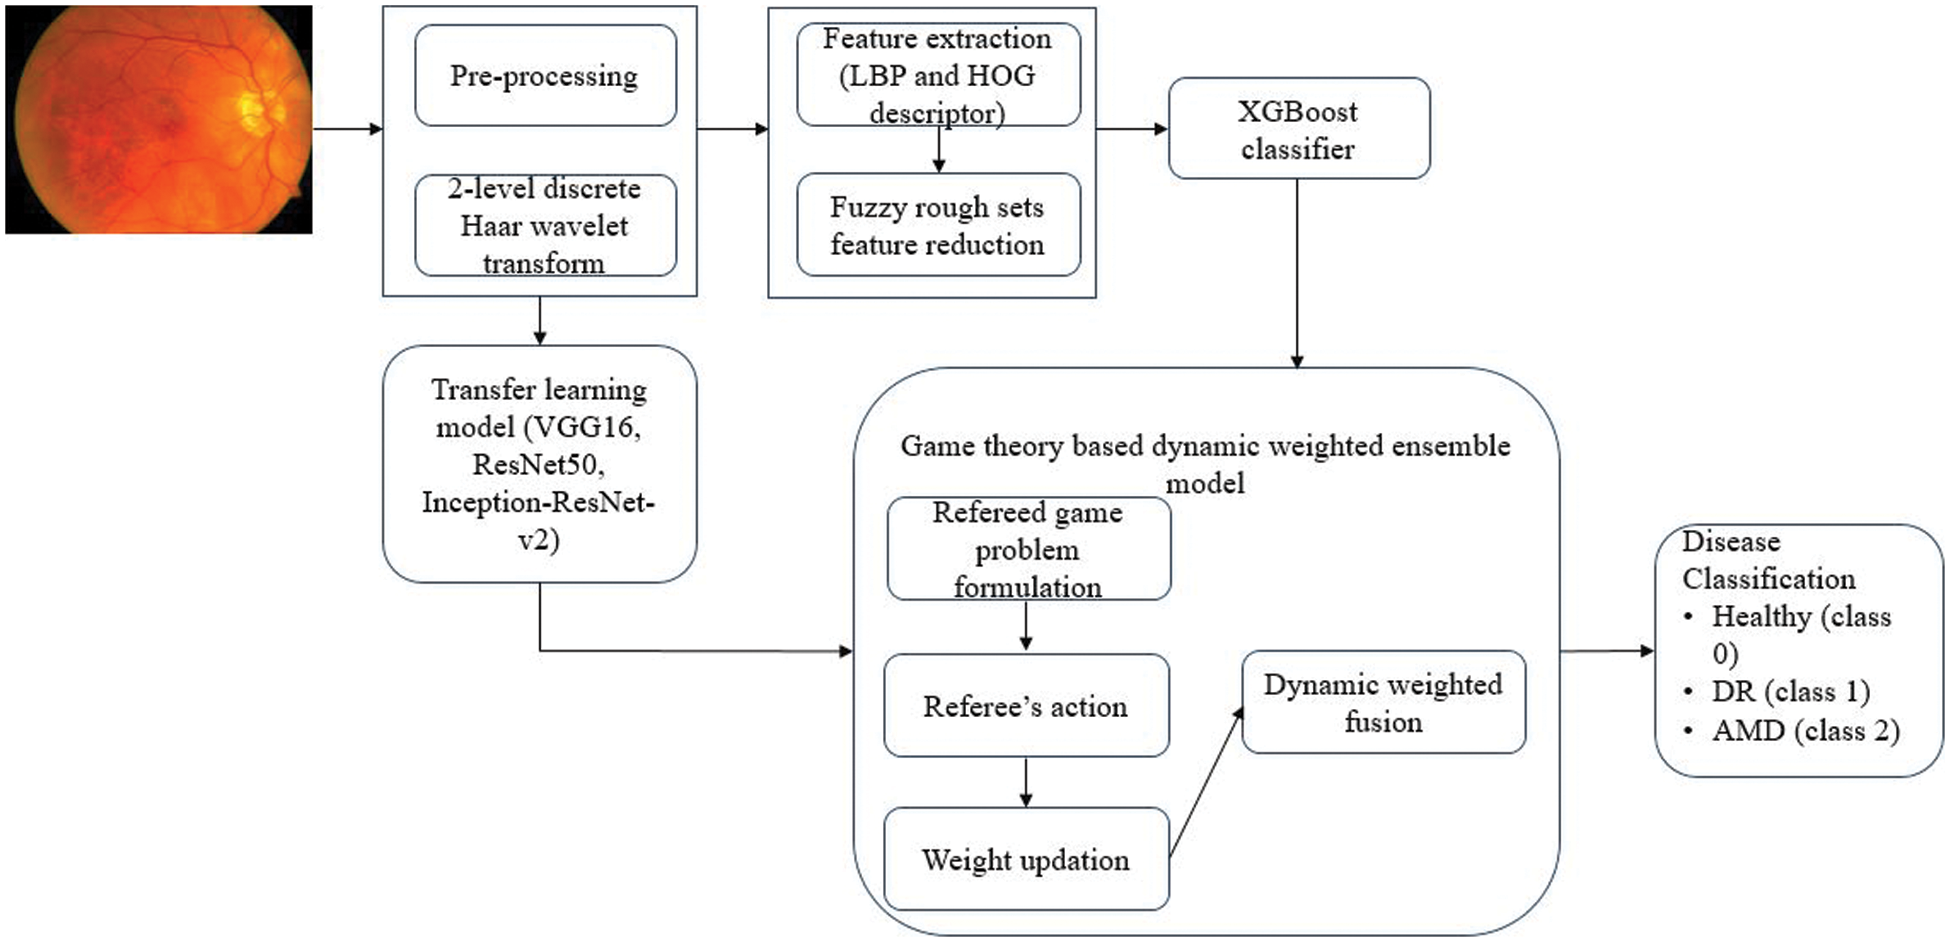
Figure 1: Proposed methodology (TL-XGB ensemble model)
3.1 Pre-processing and Discrete Wavelet Transformation
The retinal fundus image is resized and transformed to the hue, saturation and intensity (HSI) colour space. The intensity band is separated from the HSI fundus image and a median filter of size 3 × 3 is applied to remove noise. The image contrast is enhanced using contrast limited adaptive histogram equalization (CLAHE) [21].
The pre-processed image thus obtained is then subjected to two-level discrete wavelet transform (DWT) using Haar wavelet [22]. Discrete wavelet transform (DWT) decomposes an image into frequency and space dimensions [23,24]. It captures both low frequency and high frequency information using low and high frequency filters respectively. The low frequency components are called approximate coefficients and the high frequency components are called detail coefficients. In this work, two levels of DWT decomposition are performed on the pre-processed image and the approximate coefficients are obtained.
3.2 Feature Extraction-based Classification
In the first phase, classification is performed using the features extracted from the retinal image. The features are first extracted from the DWT transformed pre-processed image and then the Gaussian kernel-based fuzzy rough sets is used for feature reduction. The XGBoost classifier model is trained and tested on the reduced feature set.
To compute features from the approximate wavelet coefficients, local binary pattern (LBP) and histogram of oriented gradient (HOG) methods are used. The local binary pattern (LBP) is a texture feature extraction technique [25]. The 8-neighbourhood pixels around a centre pixel are considered and the intensity value of the centre pixel is compared with the 8 neighbouring pixels. If a neighbouring pixel has an intensity value greater than the centre pixel then the neighbouring pixel is considered ‘1’, otherwise it is considered ‘0’. From the eight neighbouring pixels, an 8-bit binary number is formed, which is then converted into a decimal number and the centre pixel is replaced by this decimal number. The process is repeated for the entire image and an LBP feature vector is obtained. A normalized histogram is then computed [26]. Here, we have used uniform LBP, as it reduces the dimension of the final LBP feature vector. Another feature extracted is the histogram of oriented gradients (HOG). The HOG method counts the instances of gradients in a confined region of an image [27]. The distribution of intensity gradients describes the local object shape within an image. The HOG feature vector, thus, gives the local shape knowledge from the regions in the image.
3.2.2 Fuzzy Rough Sets Feature Reduction
The process of feature selection and reduction aims at finding the optimum set of features, which are the most informative. In this work, Gaussian kernel-based fuzzy rough set theory (GK-FRST) proposed by Hu et al., is used for feature selection and reduction [28].
Fuzzy rough set theory (FRS) finds a subset (called reduct) of feature values and this subset has the features which are the most informative, and all the other features are removed with no information loss [29,30]. The Gaussian kernel-based fuzzy rough set theory (GK-FRST) combines Gaussian kernel with fuzzy relations [28,31]. Hence, it combines the advantages of kernel methods and fuzzy rough sets, and can be applied to various types of attributes like real-values, categorical, etc.
In this work, a decision system is formed with the features extracted as the conditional attributes. The value of the decision attribute is one of the three decision classes. The Gaussian kernel function is used for determining the fuzzy similarity relation between the objects (rows of the decision table) [28]. Then the fuzzy lower and upper approximations are found to calculate the dependency of the attributes. A positive region is a set of objects, which belongs to one of the decision classes and the percentage of objects in the positive region gives the fuzzy dependency (also called as gamma γ). The unimportant features have low gamma values, as they do not bring any new information about classification and are taken off during the feature selection process [28].
Feature selection is done by following a greedy search. An empty set of features is created first and then the selected features are added one by one to the subset; only the relevant features are included. As each selected feature is added to the current subset, it maximizes the dependence of the current subset. The reduct feature set is formed with the reduced optimal/important features. The complete algorithm on feature selection and feature ranking is shown in Fig. 2.
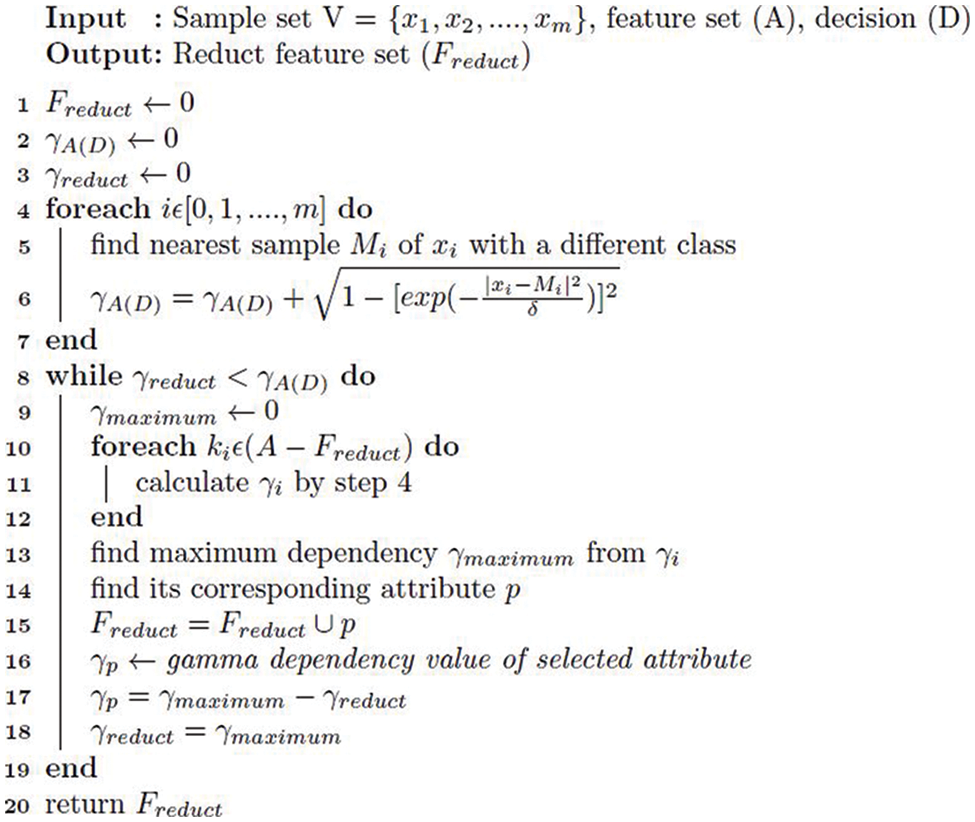
Figure 2: Gaussian fuzzy rough set approach for feature selection and feature ranking
Imbalanced data is a concern in the classification process and can cause a major setback to the classification performance. In this work, we use the synthetic minority over-sampling technique (SMOTE) for handling the imbalanced data. It works by oversampling the minority class, that is, the new examples of the minority class are synthesized using the existing minority class examples [32]. In this technique, a random example from the minority class is first chosen and then the k-nearest neighbours (k = 5) for that example are found. A synthetic example is then created by selecting a neighbour randomly [32].
Extreme gradient boosting (XGBoost) classifier is then used for the classification. XGBoost is a gradient boost decision tree algorithm specifically implemented for speed and performance, and yields good results with less time and less computing resources [33]. The XGBoost model thus created is given as input to the ensemble-based prediction of the retinal diseases. The healthy retinal images are assigned labels as class ‘0’, DR images as class ‘1’, and AMD images as class ‘2’.
3.3 Transfer Learning-based Classification
The transfer learning model approach allows to use a pre-trained model, which is trained over a large annotated database, on the problem of interest. We use transfer learning models based on visual geometry group (VGG16), residual neural network (ResNet50) and Inception-ResNet-v2, for retinal disease detection. VGG16 is a 16-layer deep and ResNet50 is a 50-layer deep convolutional neural network (CNN) trained on the ImageNet dataset. Inception-ResNet-v2 is a 164-layer deep CNN trained on the ImageNet dataset.
The DWT pre-processed image is given as input to the pre-trained transfer learning model. The top layer of each pre-trained model is removed. A convolutional layer is built on top of each of the models with a global average pooling layer, a flattened layer to convert the pooled feature map to a single column, and a dense layer with rectified linear unit (Relu) activation function. The ADAM optimizer is used to manage the learning rate of the neural network in order to reduce the losses. The binary cross entropy function is used to measure the performance of the model. For each retinal image, our model extracts the deep features and classifies the images into healthy or DR or AMD.
3.4 Game Theory-based Dynamic Weighted Ensemble
This section explains the proposed game theory-based dynamic weighted ensemble of each of the transfer learning (TL) models (VGG16, ResNet50 and Inception-ResNet-v2) and the feature-based XGBoost classifier model, which results in a stronger retinal disease classification model.
3.4.1 Structure of the Ensemble Classifier
Consider a dataset D with m examples x1, x2, …xm. Let the set of true class labels for the examples of the dataset D be y = y1, y2, …yl where l is the number of classes. Each example xi belongs to one of the labels of y. That is, L(xi) ∈ y.
Consider an ensemble classifier E comprising of ′n′ number of base classifiers C = C1, C2, …Cn. Each of the classifier Ci can generate a hard or a soft label depending on the type of the classifier. In our work, the XGBoost classifier generates a hard label and the deep learning classifiers generate soft labels. For a classifier that generates a hard label, a label h ∈ y is generated. For a classifier that generates a soft label, for each example xi, a probability Pi(k/xi) ∈ [0, 1] for the class k is generated using the softmax function. Thus, there are n such labels generated from the n classifiers. These n labels are combined using a novel method to generate a final label for the ensemble classifier.
The problem of combining the individual labels to arrive at the final label is modelled as a refereed game and is explained in the following subsection.
We study this problem of dynamic learning of weights in the ensemble using game theory. A static non-cooperative refereed game is formulated as G = (C, S, P), where C is the set of players, S is the strategies for the players and P is the payoff function that assigns a utility or payoff. In this problem, C = C1, C2, …Cn corresponds to the set of base classifiers, S is the set of possible labels generated, and P is the possible rewards assigned to each classifier. The classifiers (players) are independent and make simultaneous decisions. For a classifier that generates a hard label, each classifier has one of the strategy choices in y. For a classifier that generates a soft label, the strategy choice is a probability in the range [0, 1]. The base classifiers do not communicate between themselves or share any information. All the base classifiers (players) interact with a referee.
We model this as an m-round game. Each round will happen as follows:
i) (i)The referee provides all the classifiers with an example xi as input. (ii) All the classifiers send the outcomes (strategies) to the referee. (iii) The referee then determines if the outcome is proper and performs the appropriate payment.
The number of rounds (m) is equal to the number of examples used for training.
The referee maintains a weight matrix W. Each element w(i, j) of the weight matrix W is a weight for class yj of the ith classifier. That is, for each classifier Ci, each class yj is assigned a weight. For each i,
Consider an example xt in the training set. Let yt be the actual true label for the example. That is, L(xt) = yt. If the base classifier Ci generates a soft label 0 ≤ Pt((yt|xt)) ≤ 1 for xt, the difference dt between the probability value Pt generated as output by the classifier and the threshold for the actual label yt ∈ 0, 1 is found. If the difference dt is greater than 0.5, then it means that the classifier Ci has wrongly classified the sample. This is taken as a situation where the classifier should be penalised and the weight updation algorithm is called. If the difference dt is less than 0.5, then the classifier has classified the example correctly. Here, the classifier should be rewarded and the weight updation algorithm is called.
If the base classifier Ci generates a hard label, if the generated class label ht is the same as the true class label yt, the classifier is to be rewarded. If the generated class label ht is different from the true class label yt, the classifier is to be penalised. The weight updation algorithm is called. The weight updation algorithm is called with a notification whether the situation is a reward or a penalty for each classifier.
3.4.4 Weight Updation Algorithm
If all the classifiers have rewards or all classifiers have penalties, then the weights in the weight matrix W is unaltered. That is
If the classifier Ci has a reward for the class label j = yt, weight w(i, j) is incremented by a value Incij, that is w(i, j) = w(i, j) + Incij, where Incij is given by the Eq. (1), where n is the number of classifiers, m is the number of examples and l is the number of classes.
For an ensemble with two classifiers,
If the classifier Ci has a penalty for the class label j = yt , weight w(i, j) is decremented by a value
Decij , that is w(i, j) = w(i, j) + Decij, where Decij is given by the Eq. (2).
For an ensemble with two classifiers,
The results of the transfer learning model and the XGBoost classifier are combined and a unified output is generated to predict the class label. One of the n classifiers is chosen at random as the reference classifier (Cref). If the reference classifier Cref predicts a class j, then the weights corresponding to that class is used for the final classification. That is, the weights used for the fusion of the predictions of the n classifiers will be α1 , α2, … , αn = w(1, j), w(2, j), …, w(n, j).
Let xs be a test sample, p1, p2, … , pn be the predictions made for the test sample by the n classifiers. The final prediction Ps of the ensemble classifier for the test sample xs is given by Eq. (3).
We have evaluated the performance of the individual classifiers and the ensemble classifier and have summarized the results in this section.
The proposed work is evaluated on two datasets namely, ARIA and RFMiD retinal image datasets. The Automated Retinal Image Analysis (ARIA) dataset consists of 61 healthy retinal images, 92 retinal images with AMD and 59 retinal images of patients with DR. The images were collected by St. Paul’s eye unit and University of Liverpool, UK. The resolution of each image is 768 × 576 pixels [34].
The Retinal Fundus Multi-disease image Dataset (RFMiD) consists of 3200 retinal fundus images. The images were collected by the Centre of Excellence in Signal and Image Processing, Nanded, India. The images were captured using three different fundus cameras Kowa VX–10 (with a 50-degree field of view (FOV)), TOPCON 3D OCT-2000 (with 45-degree FOV), and TOPCON TRC-NW300 (with 45-degree FOV). The dataset has 46 different retinal disease annotations by senior retinal experts [35]. We have considered three types of images: DR, AMD and healthy images for this proposed work.
4.2 Performance Evaluation of XGBoost Classifier with Fuzzy Rough Sets Feature Reduction
A total of 123 features (LBP and HOG) are extracted from the approximate coefficients of 2-level DWT image. After applying the Gaussian fuzzy rough sets-based feature reduction (GK-FRST), out of 123, 17 features got selected for the ARIA dataset and a feature reduct of 24 features is achieved with the RFMiD dataset. Above 80% reduction in the number of features is achieved by using the fuzzy rough sets feature reduction method. The reduct feature set is balanced with the SMOTE technique and then classified using XGBoost classifier with a stratified ten-fold cross validation.
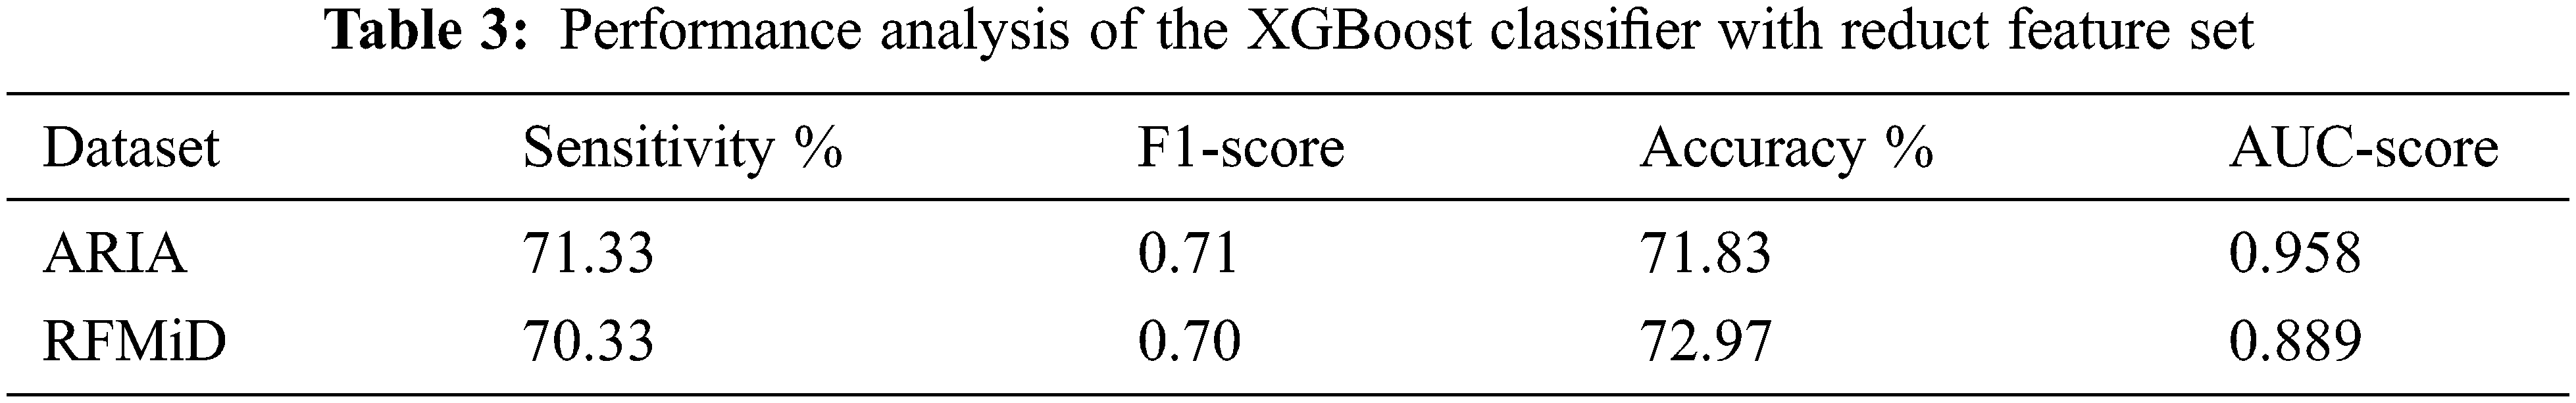
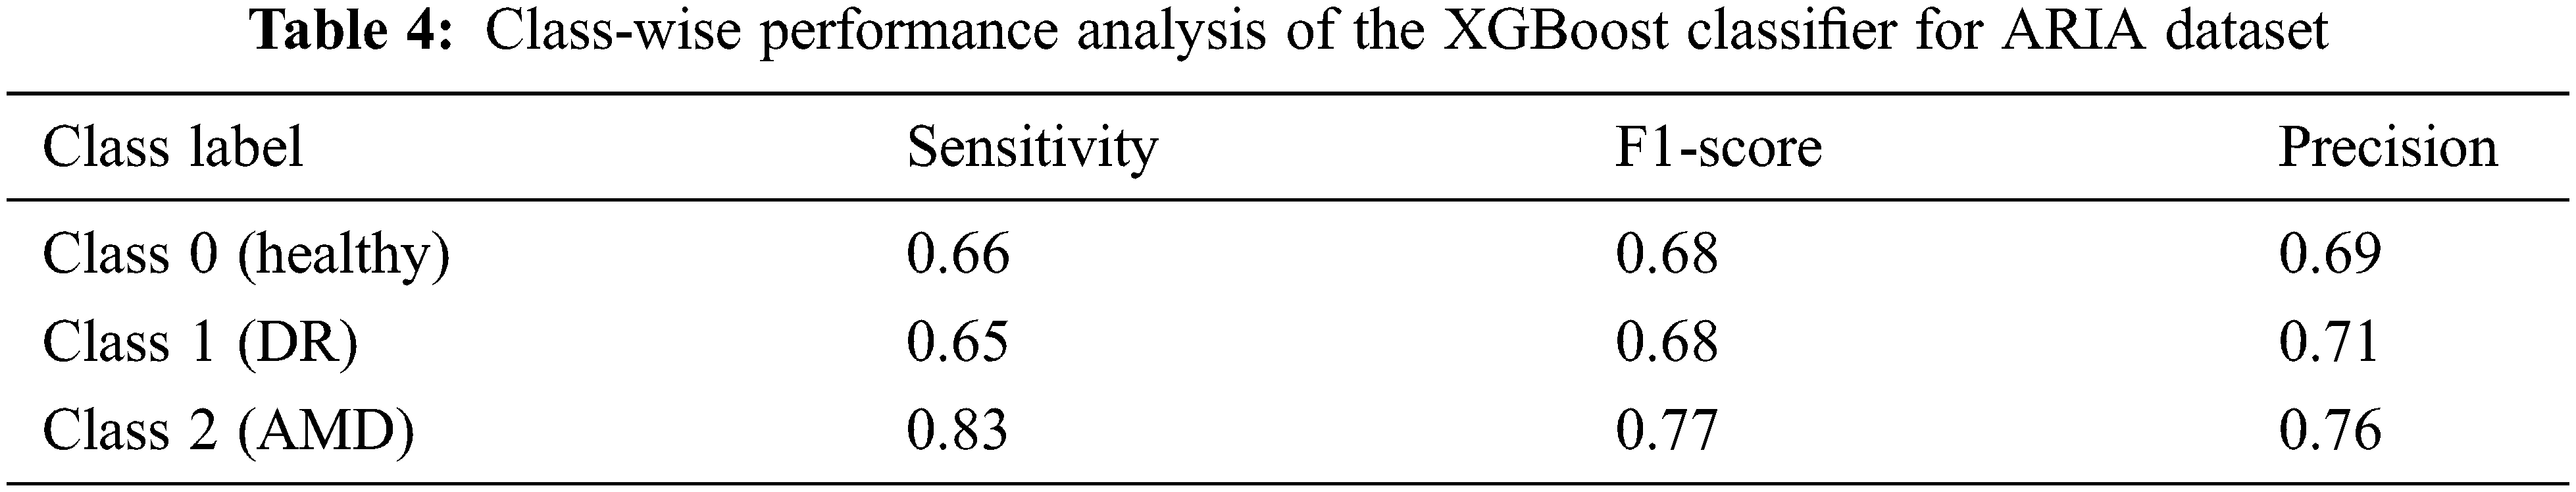
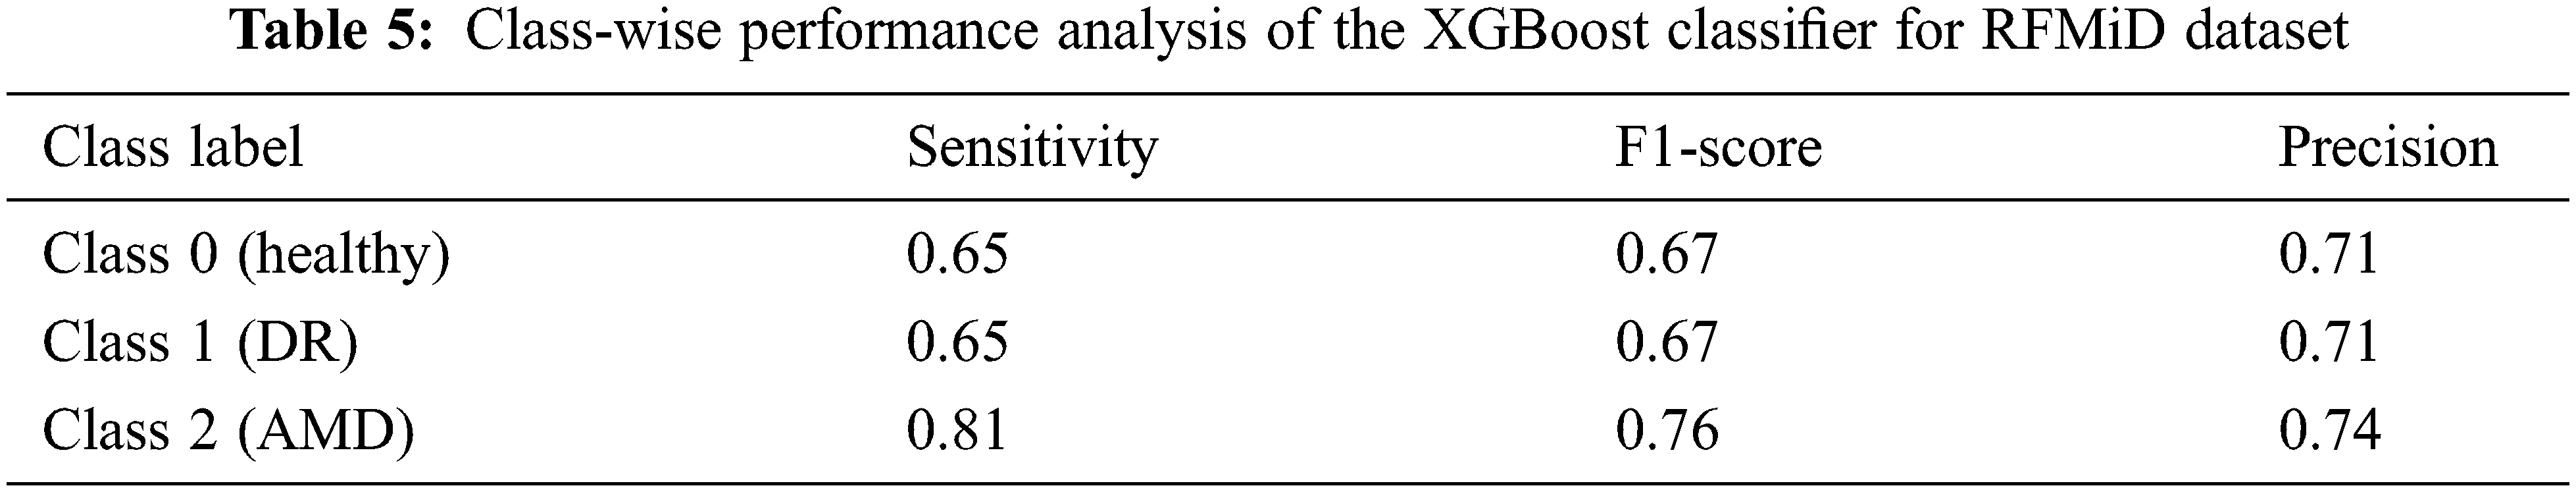
An accuracy of 67.90% and 69.24% is achieved when all the 123 features are given as the input to the XGBoost classifier for the ARIA and the RFMiD datasets respectively. An improvement in the accuracy (71.83% and 72.97%) is achieved using the reduct feature set with XGBoost classifier as shown in Tab. 3. A very high value of AUC-score is obtained by this model for both the ARIA and the RFMiD datasets as in Tab. 3. A high value of area under the curve score (AUC-score) implies better ability of the model to distinguish between the retinal diseases. Tabs. 4 and 5 show the class-wise performance of the XGBoost classifier for ARIA and RFMiD datasets. It can be seen that the performance of the XGBoost classifier for the AMD retinal images (class 2) is better than that for the DR retinal images (class 1) and healthy retinal images (class 0).
The effect of reducing the number of features further from the reduct feature set is also studied, and it is noted that reducing the features further from the reduct set decreases the performance, as in Fig. 3. Thus, it is seen that the LBP and HOG features extracted provide various distinctive information from the retinal fundus images. The Gaussian kernel fuzzy rough set technique used in this work for feature reduction provides the least number of features with less computational complexity. A very high feature reduction rate of about 80% and more is obtained, which helps in achieving high classification performance.
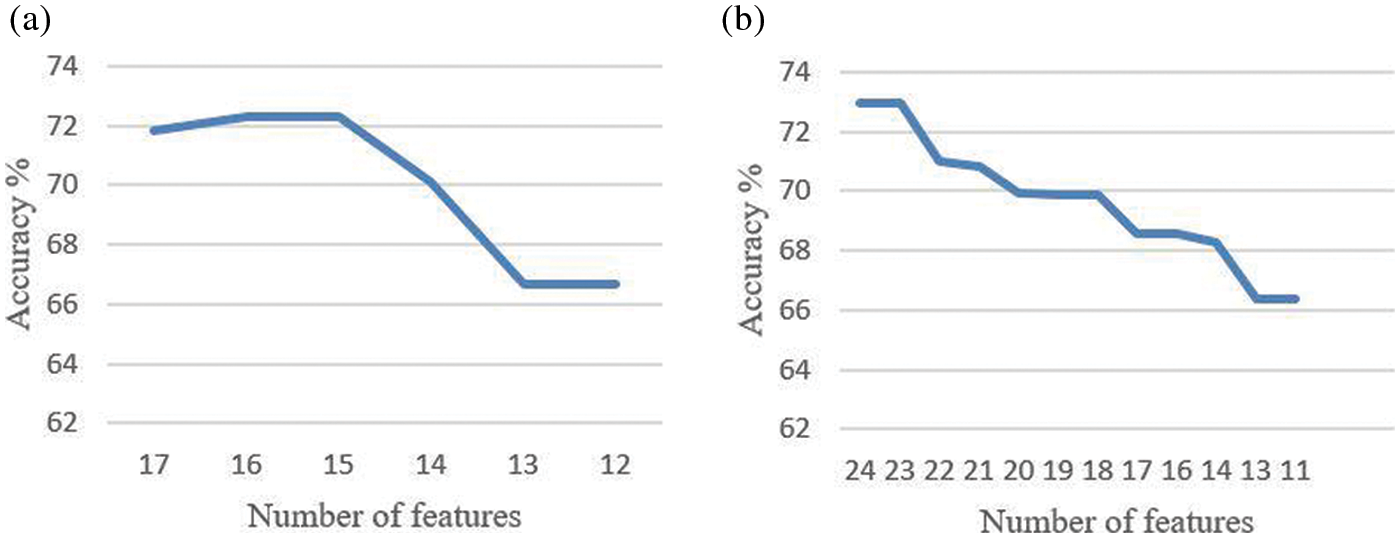
Figure 3: Accuracy based on the number of features (a) ARIA dataset (b) RFMiD dataset
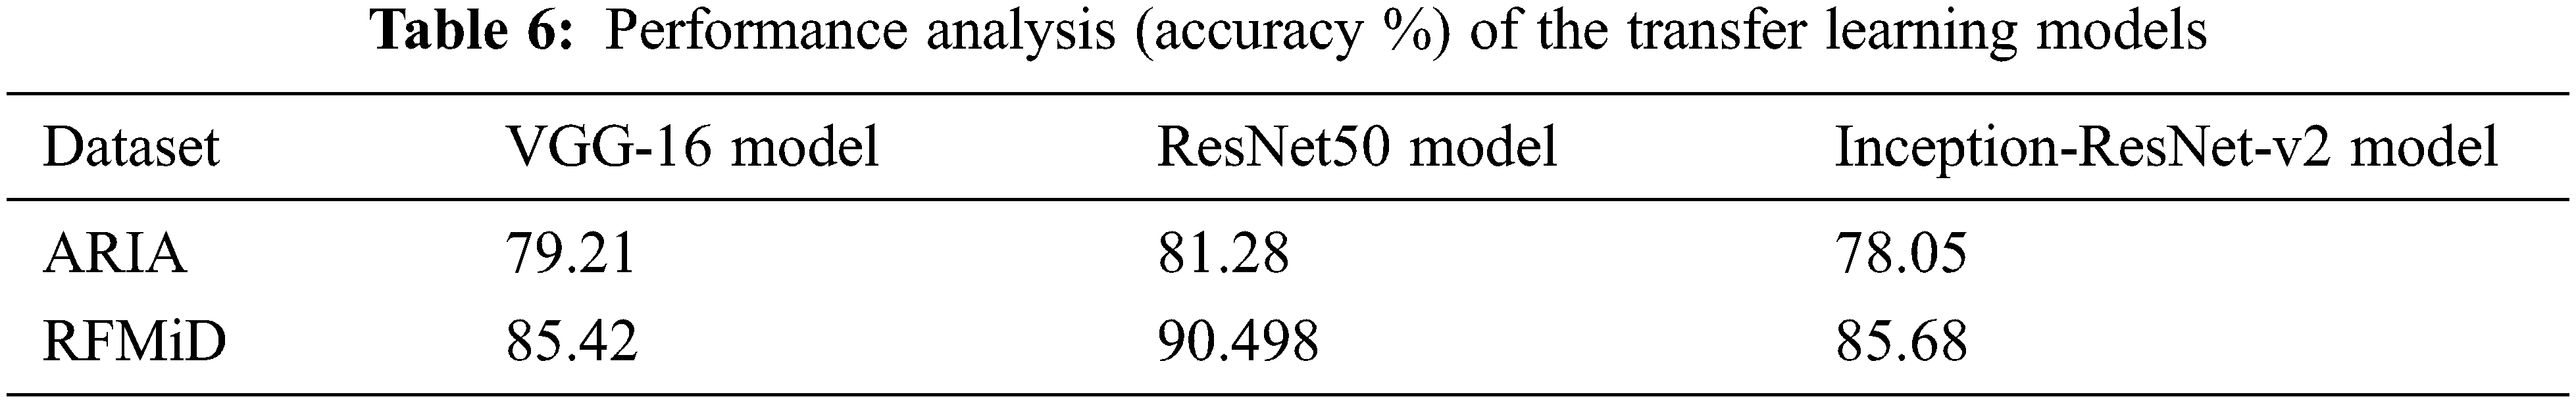
4.3 Performance Evaluation of Individual Transfer Learning Models
The three transfer learning models VGG-16, ResNet50 and Inception-ResNet-v2 are trained and tested on the ARIA and the RFMiD datasets for retinal disease predictions. Tab. 6 gives the accuracy in percentage for the three transfer learning models.
4.4 Performance Evaluation of Game Theory-based Ensemble Model
The dynamic weighted ensemble model combines each of the individual VGG16, ResNet50 and Inception-ResNet-v2 transfer learning models with the XGBoost classifier.
The ensemble model is evaluated on both the datasets with three different combinations, VGG16-XGBoost, ResNet50-XGBoost and Inception-ResNet-v2-XGBoost. The weights are first learnt using the proposed game theory-based ensemble fusion model. We evaluate these three combinations using two approaches. The first approach uses an equal weight fusion model, in which the predictions from the TL and the XGB models are given equal weights while combining. In this approach, each model contributes equally to the final prediction. The second approach is the proposed dynamic weighted fusion model. In this approach, the contribution of each model to the prediction is given a dynamic weight based on the weights learnt. The weights are positive values and the summation of all the weights is equal to one. The final prediction P of the ensemble classifier for a test sample is given by Eq. (4), where ptl is the prediction of the transfer learning model and pxgb is the prediction of the XGBoost classifier.
The value of α1 and α2 are 0.5 for the equal weight fusion model. In the dynamic weighted average fusion model, the values of α1 and α2 are assigned dynamically. Here, XGBoost is taken as the reference classifier. Tabs. 7 and 8 show the performance analysis for the proposed ensemble model for the ARIA and the RFMiD datasets.
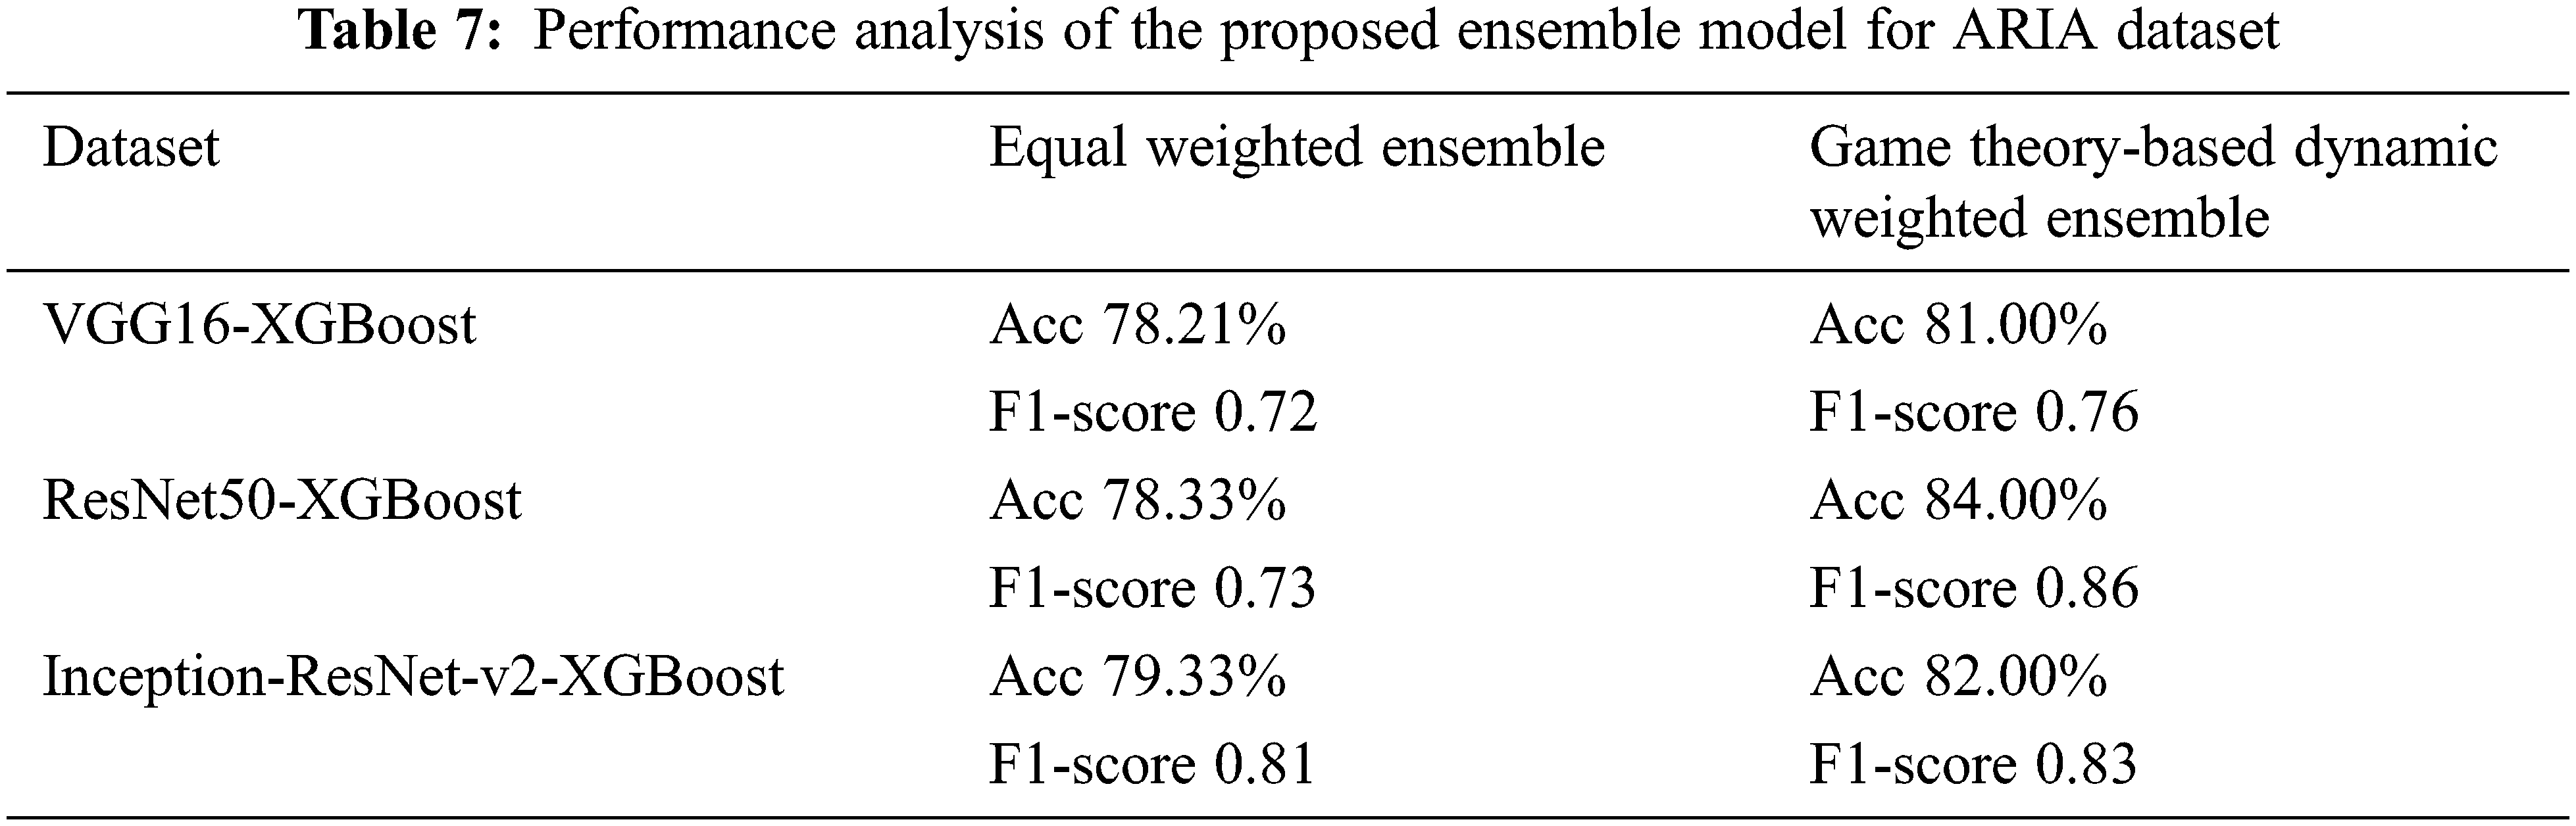
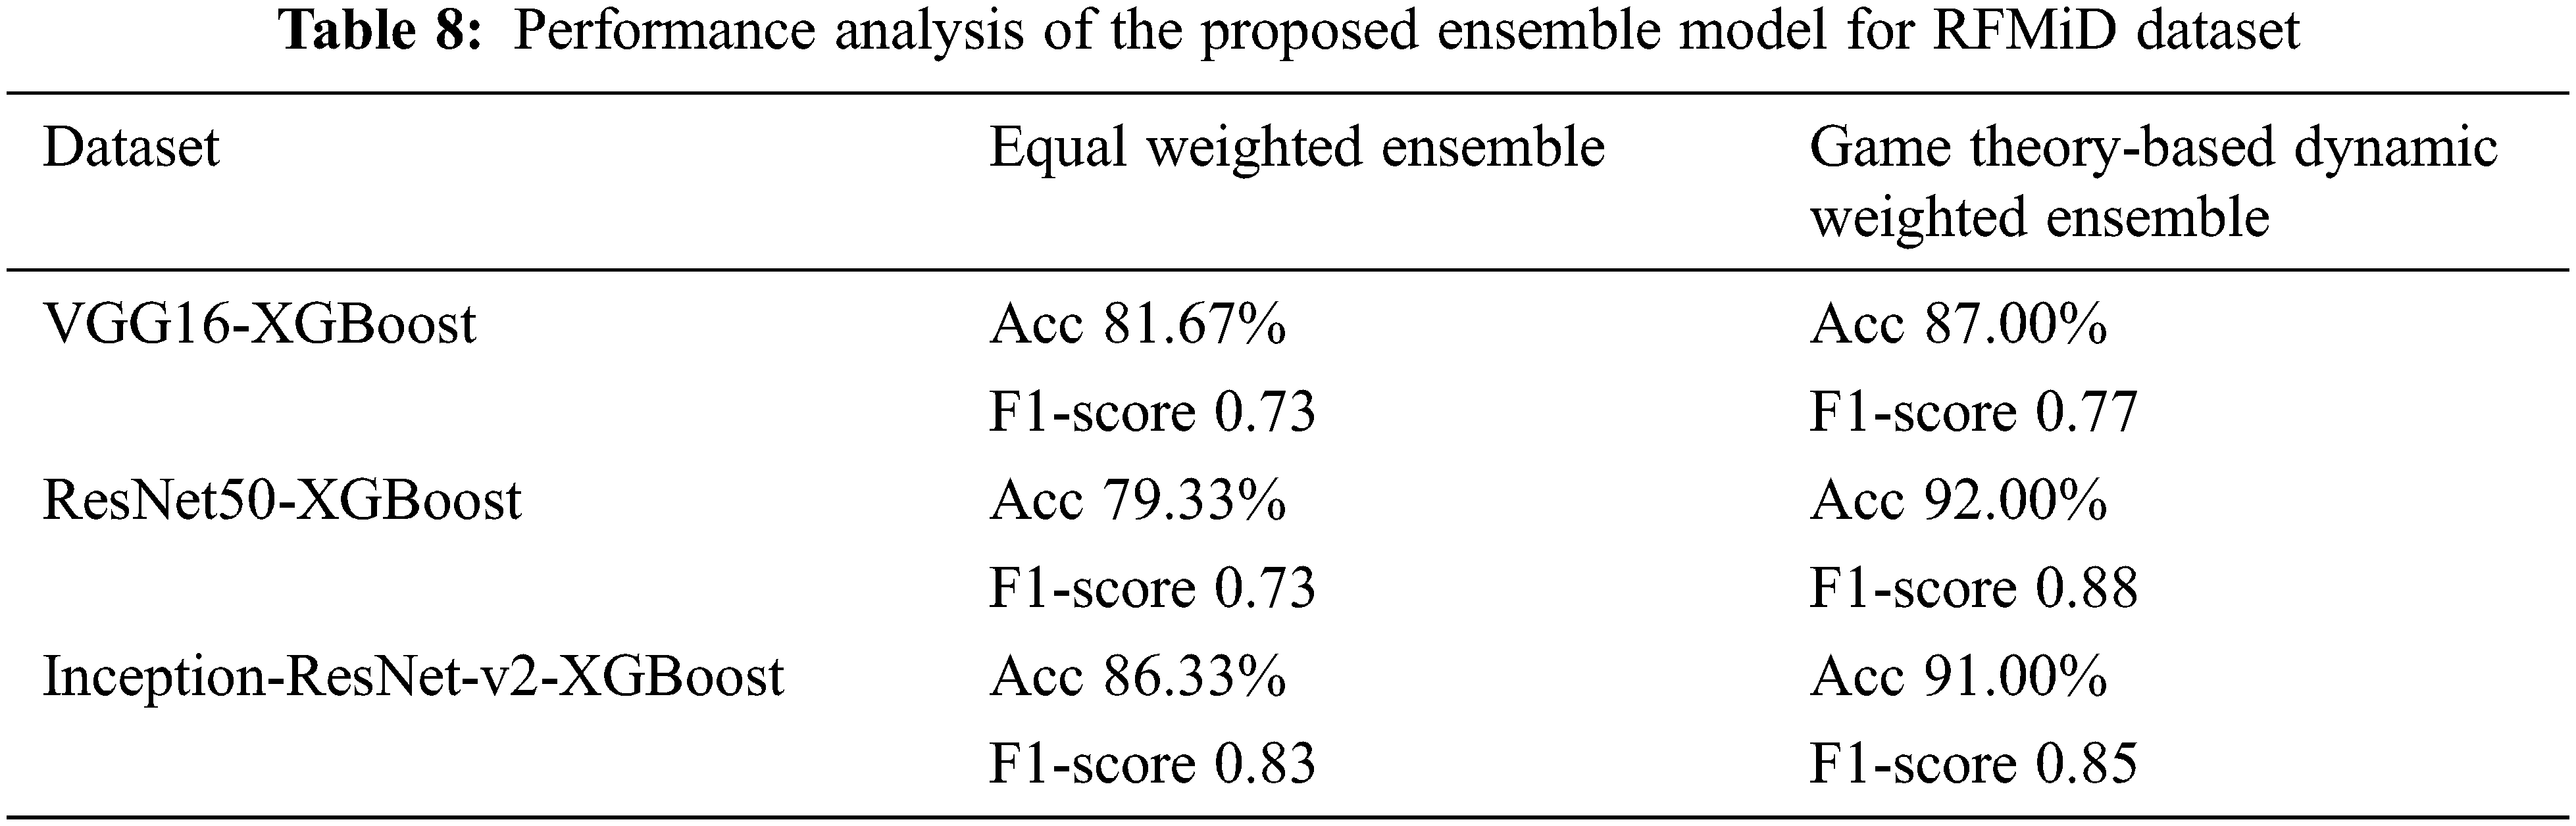
We note that this kind of weight assignment works well for both the datasets that we have considered. The proposed ensemble model gives a higher performance as compared to the individual models. The accuracy of the equal weights ensemble is lower than that of the dynamic weighted ensemble model as in Figs. 4 and 5 for ARIA and RFMiD dataset respectively. The dynamic weighted ensemble model performed much better and enhances the performance of the retinal disease diagnosis.

Figure 4: Ensemble model accuracy analysis for ARIA dataset (a) VGG16-XGBoost ensemble (b) ResNet50-XGBoost ensemble (c) Inception-ResNet-v2-XGBoost ensemble

Figure 5: Ensemble model accuracy analysis for RFMiD dataset (a) VGG16-XGBoost ensemble (b) ResNet50-XGBoost ensemble (c) Inception-ResNet-v2-XGBoost ensemble
The state-of-the-art methods for retinal disease classification are mainly either feature based or an ensemble of the deep learning models. Moreover, most of the methods concentrate on a single retinal disease classification. Hence, the proposed TL-XGB ensemble model is a novel, as it combines a feature-based model with transfer learning models for the retinal disease detection. It is evident from the results that the dynamic weights assignment for the ensemble of the classifiers using refereed game theory approach provides promising results. The proposed model does not need very high computational resources and will drastically reduce the work of the ophthalmologists.
A novel transfer learning and feature extraction-based ensemble model with a game theory-based dynamic weight assignment strategy is proposed in this paper for retinal disease detection. The results show that the proposed ensemble model performs better than the individual models. The accuracy has increased from the equal weighted ensemble model to the proposed game theory-based dynamic weighted ensemble model. For the ARIA dataset, the accuracy of the proposed game theory-based dynamic weighted ensemble model has increased in comparison to that of equal weighted ensemble to about 3%, 6% and 3% for VGG16-XGBoost, ResNet50-XGBoost and Inception-ResNet-v2-XGBoost, respectively. The increase in accuracy by approximately 5%, 13% and 5% is observed for VGG16-XGBoost, ResNet50-XGBoost and Inception-ResNet-v2-XGBoost, respectively, for the RFMiD dataset in comparison to the equal weighted ensemble model. This method works in an excellent manner for small-sized datasets and only a negligible amount of work is present in literature about small-sized retinal datasets. The major challenge with retinal images is the non-availability of real-time datasets. The retinal image dataset from multiple ethnicities will help in conducting additional studies and solidifying the performance of the proposed algorithm. In future, this work will be extended to the classification of other retinal diseases also. We will also explore on applying this model to other domains. Though in this paper, the performance for retinal disease classification is analysed, the model proposed seems to provide promising results for any ensemble with any number of classifiers and any number of classes. This also paves the way for building more ensemble models that combine hard and soft labels.
Funding Statement: The authors received no specific funding for this study.
Conflicts of Interest: The authors declare that they have no conflicts of interest to report regarding the present study.
1. K. Mittal and V. M. A. Rajam, “Computerized retinal image analysis-a survey,” Multimedia Tools and Applications, vol. 79, no. 31, pp. 22389–22421, 2020. [Google Scholar]
2. R. Raman, L. Gella, S. Srinivasan and T. Sharma, “Diabetic retinopathy: An epidemic at home and around the world,” Indian Journal of Ophthalmology, vol. 64, no. 1, pp. 69, 2016. [Google Scholar]
3. National Eye Institute. “AMD,” 2020. [Online]. Available: https://www.nei.nih.gov/learn-about-eye-health/eye-conditions-and-diseases/age-related-macular-degeneration. [Google Scholar]
4. K. Khaderi, K. Ahmed, J. Berry, L. Labriola and R. Cornwell, “Retinal imaging modalities: Advantages and limitations for clinical practice,” Retinal Physician, vol. 8, no. 3, pp. 44–48, 2011. [Google Scholar]
5. J. M. Schmitt, “Optical coherence tomography (OCTA review,” IEEE Journal of Selected Topics in Quantum Electronics, vol. 5, no. 4, pp. 1205–1215, 1999. [Google Scholar]
6. C. Agurto, E. S. Barriga, V. Murray, S. Nemeth, R. Crammer et al., “Automatic detection of diabetic retinopathy and age-related macular degeneration in digital fundus images,” Investigative Ophthalmology & Visual Science, vol. 52, no. 8, pp. 5862–5871, 2011. [Google Scholar]
7. U. R. Acharya, M. R. K. Mookiah, J. E. W. Koh, J. H. Tan, S. V. Bhandary et al., “Automated screening system for retinal health using bi-dimensional empirical mode decomposition and integrated index,” Computers in Biology and Medicine, vol. 75, no. C, pp. 54–62, 2016. [Google Scholar]
8. J. E. W. Koh, U. R. Acharya, Y. Hagiwara, U. Raghavendra, J. H. Tan et al., “Diagnosis of retinal health in digital fundus images using continuous wavelet transform (cwt) and entropies,” Computers in Biology and Medicine, vol. 84, pp. 89–97, 2017. [Google Scholar]
9. J. E. W. Koh, E. Y. K. Ng, S. V. Bhandary, A. Laude and U. R. Acharya, “Automated detection of retinal health using phog and surf features extracted from fundus images,” Applied Intelligence, vol. 48, no. 5, pp. 1379–1393, 2018. [Google Scholar]
10. K. M. Adal, P. G. V. Etten, J. P. Martinez, K. W. Rouwen, K. A. Vermeer et al., “An automated system for the detection and classification of retinal changes due to red lesions in longitudinal fundus images,” IEEE Transactions on Biomedical Engineering, vol. 65, no. 6, pp. 1382–1390, 2017. [Google Scholar]
11. X. Li, M. Jia, M. T. Islam, L. Yu and L. Xing, “Self-supervised feature learning via exploiting multi-modal data for retinal disease diagnosis,” IEEE Transactions on Medical Imaging, vol. 39, no. 12, pp. 4023–4033, 2020. [Google Scholar]
12. M. Smaida and S. Yaroshchak, “Bagging of convolutional neural networks for diagnostic of eye diseases,” in COLINS, Ukraine, pp. 715–729, 2020. [Google Scholar]
13. S. Bashir, U. Qamar and F. H. Khan, “Intellihealth: A medical decision support application using a novel weighted multi-layer classifier ensemble framework,” Journal of Biomedical Informatics, vol. 59, pp. 185–200, 2016. [Google Scholar]
14. Y. Liu, D. Pi and Q. Cheng, “Ensemble kernel method: Svm classification based on game theory,” Journal of Systems Engineering and Electronics, vol. 27, no. 1, pp. 251–259, 2016. [Google Scholar]
15. L. M. Bruce and D. Reynolds, “Game theory based data fusion for precision agriculture applications,” in IEEE Int. Geoscience and Remote Sensing Symp. (IGARSS), Beijing, China, pp. 3563–3566, 2016. [Google Scholar]
16. H. Ykhlef, F. Ykhlef and B. Amirouche, “Game theory-based ensemble of deep neural networks for large scale audio tagging,” in 2021 Int. Conf. on Recent Advances in Mathematics and Informatics (ICRAMI), Tebessa, Algeria, pp. 1–6, 2021. [Google Scholar]
17. C. B. Zhang, P. T. Jiang, Q. Hou, Y. Wei, Q. Han et al., “Delving deep into label smoothing,” arXiv preprint arXiv:2011.12562, 2020. [Google Scholar]
18. P. Bhowal, S. Sen, J. H. Yoon, Z. W. Geem and R. Sarkar, “Choquet integral and coalition game-based ensemble of deep learning models for covid-19 screening from chest x-ray images,” IEEE Journal of Biomedical and Health Informatics, vol. 25, no. 12, pp. 4328–4339, 2021. [Google Scholar]
19. N. Versbraegen, A. Fouche, C. Nachtegael, S. Papadimitriou, A. Gazzo et al., “Using game theory and decision decomposition to effectively discern and characterise bi-locus diseases,” Artificial Intelligence in Medicine, vol. 99, pp. 101690, 2019. [Google Scholar]
20. Y. Yang, X. Wei, R. Xu, L. Peng and L. Liu, “Game-based access for AoI-oriented data transmission under dynamic attack,” IEEE Internet of Things Journal, pp. 1–1, 2021. [Google Scholar]
21. S. M. Pizer, R. E. Johnston, J. P. Ericksen, B. C. Yankaskas and K. E. Muller, “Contrast-limited adaptive histogram equalization: Speed and effectiveness,” in Proc. of the First Conf. on Visualization in Biomedical Computing, IEEE Computer Society, Atlanta, USA, pp. 337–338, 1990. [Google Scholar]
22. D. Rosca, “Haar wavelets on spherical triangulations,” in Advances in Multiresolution for Geometric Modelling, Mathematics and Visualization, Springer, Berlin, Heidelberg, pp. 405–417, 2005. [Google Scholar]
23. S. Thakral and P. Manhas, “Image processing by using different types of discrete wavelet transform,” in Int. Conf. on Advanced Informatics for Computing Research, Springer, India, pp. 499–507, 2018. [Google Scholar]
24. H. Lidong, Z. Wei, W. Jun and S. Zebin, “Combination of contrast limited adaptive histogram equalisation and discrete wavelet transform for image enhancement,” IET Image Processing, vol. 9, no. 10, pp. 908–915, 2015. [Google Scholar]
25. M. Pietikainen, A. Hadid, G. Zhao and T. Ahonen, “Local binary patterns for still images,” in Computer Vision Using Local Binary Patterns, London: Springer, pp. 13–47, 2011. [Google Scholar]
26. E. Prakasa, “Texture feature extraction by using local binary pattern,” INKOM Journal, vol. 9, no. 2, pp. 45–48, 2016. [Google Scholar]
27. N. Dalal and B. Triggs, “Histograms of oriented gradients for human detection,” in IEEE Computer Society Conf. on Computer Vision and Pattern Recognition (CVPR’05), San Diego, California, USA, vol. 1, pp. 886–893, 2005. [Google Scholar]
28. Q. Hu, L. Zhang, D. Chen, W. Pedrycz and D. Yu, “Gaussian kernel based fuzzy rough sets: Model, uncertainty measures and applications,” International Journal of Approximate Reasoning, vol. 51, no. 4, pp. 453–471, 2010. [Google Scholar]
29. D. Dubois and H. Prade, “Rough fuzzy sets and fuzzy rough sets,” International Journal of General System, vol. 17, no. 2–3, pp. 191–209, 1990. [Google Scholar]
30. C. Cornelis, R. Jensen, G. Hurtado and D. Slezak, “Attribute selection with fuzzy decision reducts,” Information Sciences, vol. 180, no. 2, pp. 209–224, 2010. [Google Scholar]
31. A. Zeng, T. Li, D. Liu, J. Zhang and H. Chen, “A fuzzy rough set approach for incremental feature selection on hybrid information systems,” Fuzzy Sets and Systems, vol. 258, pp. 39–60, 2015. [Google Scholar]
32. N. V. Chawla, K. W. Bowyer, L. O. Hall and W. P. Kegelmeyer, “Smote: Synthetic minority over-sampling technique,” Journal of Artificial Intelligence Research, vol. 16, pp. 321–357, 2002. [Google Scholar]
33. T. Chen and C. Guestrin, “Xgboost: A scalable tree boosting system,” in Proc. of the 22nd ACM Sigkdd Int. Conf. on Knowledge Discovery and Data Mining, San Francisco, California, USA, pp. 785–794, 2016. [Google Scholar]
34. D. J. Farnell, F. N. Hatfield, P. Knox, M. Reakes, S. Spencer et al., “Enhancement of blood vessels in digital fundus photographs via the application of multiscale line operators,” Journal of the Franklin Institute, vol. 345, no. 7, pp. 748–765, 2008. [Google Scholar]
35. G. Quellec, M. Lamard, P. H. Conze, P. Massin and B. Cochener, “Automatic detection of rare pathologies in fundus photographs using few-shot learning,” Medical Image Analysis, vol. 61, pp. 101660, 2020. [Google Scholar]
 | This work is licensed under a Creative Commons Attribution 4.0 International License, which permits unrestricted use, distribution, and reproduction in any medium, provided the original work is properly cited. |