DOI:10.32604/iasc.2023.029446
| Intelligent Automation & Soft Computing DOI:10.32604/iasc.2023.029446 | |
| Article |
Germination Quality Prognosis: Classifying Spectroscopic Images of the Seed Samples
Department of Information Systems, College of Computer and Information Systems, Umm Al-Qura University, Makkah, Saudi Arabia
*Corresponding Author: Saud S. Alotaibi. Email: ssotaibi@uqu.edu.sa
Received: 03 March 2022; Accepted: 15 April 2022
Abstract: One of the most critical objectives of precision farming is to assess the germination quality of seeds. Modern models contribute to this field primarily through the use of artificial intelligence techniques such as machine learning, which present difficulties in feature extraction and optimization, which are critical factors in predicting accuracy with few false alarms, and another significant difficulty is assessing germination quality. Additionally, the majority of these contributions make use of benchmark classification methods that are either inept or too complex to train with the supplied features. This manuscript addressed these issues by introducing a novel ensemble classification strategy dubbed “Assessing Germination Quality of Seed Samples (AGQSS) by Adaptive Boosting Ensemble Classification” that learns from quantitative phase features as well as universal features in greyscale spectroscopic images. The experimental inquiry illustrates the significance of the proposed model, which outperformed the currently available models when performance analysis was performed.
Keywords: Precision farming; ensemble classification; germination quality; machine learning; predictive analytics
Agriculture has traditionally contributed to economic growth and decreased unemployment. It has also been demonstrated to aid in the reduction of poverty. Agriculture has low production despite a big number of people working in it. Precision farming relies significantly on information and communication technology (ICT) to enhance agricultural yield. One of the most significant parts of intensive agriculture is seed quality, which has a direct impact on yield. The use of high-quality seeds decreases the cost of field tests while improving the probability of selecting the perfect crop variety by inbreeding the crop. Quality assurance approaches in the seed sector rely on a range of methodologies for validating the quality attributes of seed-like vigor and germination tests [1]. Because of their time-consuming character, damaging nature, and subjective nature of seed quality assessment, these systems have limitations [2]. The work [3] illustrates the breadth of rapidly expanding demand for effective technologies capable of reliably, swiftly, objectively, and non-destructively determining seed quality.
A human culture requires seeds as a primary food source and as key crop materials. Crop yield is largely governed by environmental conditions, although it is also affected by the germination rate. Hence, seed germination evaluation is a key duty for seed researchers in order to study different seed lots in order to maximize the effectiveness of the food chain.
It is crucial to underline that global crop production must be doubled by 2050 in order to feed the world’s rising population [4]. Traditional seed testing methodologies, particularly seed vigor assays, have been neglected due to time-consuming and complex protocols [5].
In accordance with the preceding prologue, computer-aided models built on Machine Learning, Artificial Intelligence, and Deep Learning platforms are required. This research introduces a unique machine-learning model called “Adaptive Boosting Ensemble Classification for Assessing the Germination Quality of Seed Samples” in this regard.
Variation in the morphological and chemical composition of seeds has been linked to lower vigor and viability [6]. The visual examination would have missed these modifications. Additionally, X-ray imaging and spectrometric techniques have been employed to collect data on complex seed quality characteristics. By obtaining a large number of spectral characteristics, FT-NIR spectroscopy may detect seed chemicals [7,8]. FT-NIR spectroscopy is based on the absorption of electromagnetic light between 780 and 2500 nm [9]. As a result, it may be utilized to simultaneously evaluate a large number of constituents in seed samples [10,11]. X-ray imaging is based on differences in X-ray attenuation between tissues in different dimensions [12] revealing a physical seed condition with an inner morphology. However, merging datasets can provide additional information about seed samples or improve the performance of classifiers [13].
Agriculture has been transformed by machine learning algorithms that have invented ways of identifying items, most notably seed quality parameters. They are capable of accurately classifying non-linear and linear relationships. Numerous techniques, including PLS-DA (Partial Least Squares Discriminant Analysis), NB (Nave Bayes), and SVM (Support Vector Machine), have been demonstrated to be effective in a variety of research domains. The different algorithms exhibit varying degrees of performance.
While optical seed quality models are accurate, integrating them with machine learning methods can significantly improve classification performance. There have been no attempts made to classify seed quality using FT-NIR and X-ray data. Thus, we investigated whether spectroscopic imaging data combined with machine learning algorithms could be used to improve seed vigor and germination forecasts using rice seeds.
Numerous researchers have developed ways of automating the error-prone practice of seed testing. Currently, traditional methods are used to identify seeds since they are automated and generate more reliable data [14–16]. Several stated methods, on the other hand, use color-based thresholds to anticipate elements such as the perimeter, roundness and color values, width, and perimeter in order to interpret the seed [17]. The term “germinator” refers to software that analyzes the variance and area between dots in photographs over time in order to forecast the germination of Arabidopsis thaliana [18]. The strategy is likely to fail for a large number of seeds, regardless of whether they are partially blocked or partially lighted. SVIS (Seed vigor imaging system) measures seed lengths by digitally analyzing the RGB pixel values of scanned images (33). Additionally, the use of a non-illuminated scanner has been standardized to improve performance. The researcher must remain present throughout the seed germination simulation in order to appropriately examine seed germination progress. This was done to examine the seed germination rates predicted by various ANN (Artificial Neural Network) approaches in order to maximize accuracy and performance. As a result, 11 features were manually extracted via image processing. CNNs (Convolutional Neural Networks) are the newest image processing technique, replacing deep learning [19,20].
Automatically extracting features from raw photos and learning their relationships aids in resolving image categorization issues. Computer vision tasks can be completed precisely because of the absence of unique obstructions and illuminations. CNN has already been monitoring rice seed germination [21]. Due to the fact that the photographs were taken following the simulation, this model can only forecast the final germination percentage.
The Germination Detection, Prediction, and Quality (G-DPQ) Assessment [22] is a novel approach for evaluating seed germination quality prediction. The “Automated Seed Quality Testing (ASQT) System utilizing GAN and Active Learning [23]” approach attempted to minimize preprocessing for rapid classification. However, it is projected that increased dimensionality will reduce prediction accuracy, specificity, and sensitivity.
However, even though the models represent a novel variant of a classification technique, feature extraction is probabilistic. As a result, performance may vary. The highest judgment accuracy was obtained by utilizing datasets with low ambiguity, a high degree of sensitivity, and a high degree of specificity in feature values.
To enhance the germination prediction model, which has (a) independent thresholds based on custom color and thus can be applied to a variety of illumination settings and seed cultivars, and (b) can be used to investigate the vigorous germination of seed by predicting not only the ultimate percentage of germination but also the percentage of germination at various stages of germination. The proposed model trains and classifies seed germination quality using quantitative phase and universal factors such as entropies, GLCM, and morphological traits. The test record’s feature confidences are then compared to the fitness coefficients of the optimal features in order to forecast the test record’s correct label.
For a detailed description of the suggested model, see here. This section offers information regarding the data and the strategy framework. This part also covers finding the optimal features from microscopic images of seed samples for training the classifier. A simulation study and systematic model of the suggested approach called AGQSS by Adaptive Boosting Ensemble Classification are presented in the subsections.
Let dataset
Entropy is a measure of unpredictability used to describe visual input. The value of the co-occurrence matrix elements is high. In this scenario, entropy is vital to feature extraction. This section divides microscopic photos of seed samples exhibiting favorable and negative germination quality. The term entropy denotes the degree of uncertainty, and it is dependent on the entropies available and described in this literature the entropies are calculated using five entropies.
Entropy is a measure of unpredictability used to define a photo entry’s tissue. It is high when all elements of the coexistence matrix are the same. In this scenario, entropy is vital to feature extraction. This section categorizes microscopic images of seed samples as positive or negative. Therefore, the term entropy relates to the level of uncertainty, so it is important to distinguish between negative and positive pictures to train the classifier, five entropies are traded.
This part covered GLCM feature extraction. The GLCM (Gray Level Co-Occurrence Matrix) matrix identifies unique gray hues in an image. The GLCM content is used to compute texture feature changes in pixel intensity. To calculate a matrices’ co-occurrence, two parameters are used: the relative distance d between pixels and the number of pixels and their layout. It can be quantized in four directions or mixed. There are 19 GLCM features in all, which are connected to information variance, measurement, entropy, and other energy-relevant factors.
3.1.3 The Morphological Features
Morphometric features and invariant moments are taken into account and stated as morphological traits. Based on these morphological qualities, it is possible to predict the similarities and differences between training images of different classes.
This phase discovers the optimal features of the microscopic images of the seed samples belongs labels positive and negative
To determine the correlation between two vectors, researchers utilize Spearman’s Rho, a non-parametric test in which
Using Spearman’s correlation, the following function investigates the optimal feature selection. Furthermore, these features will be used to execute supervised learning in order to obtain feature measures connected to microscopic images of seed samples of projected labels.


This section discusses the suggested classifier, the model for the training stage, and the classification operation’s objective.
Adaptive boosting is used in the proposed classifier. The classifier makes use of a variety of data sources. Boolean-classifiers are a type of weak classifier that is constructed using a decision tree. Each weak classifier was developed by incorporating the most important characteristics of numerous quantitative levels. These imprecise classifiers segment the test data according to the condition and its true or false status. Additionally, a weak classifier might classify negatives as false positives or false negatives. This procedure is repeated until the task can be completed by the overall weak classifier. This classification approach’s overall findings would combine weak classifiers and produce a final result.
The quantitative seed phase optimum extracted features were used to represent each weak classifier in this article’s projected model. The second classifier iteration, dubbed “boosting,” would be the weak classifier iteration that incorrectly classified the corpus section. Each iteration makes use of this subpar classifier. Iteratively completing weak classifiers would result in records being incorrectly classified. Each Adaboost algorithm’s weak classifier suggests a certain n-gram for classification accuracy. Additionally, bad classifier classification results would be justified in order to ascertain the polarity of the provided record. In comparison to earlier binary classification challenges, the Adaboost classifier has demonstrated the potential to improve DT outcomes (decision trees). It has the potential to significantly improve a variety of machine-learning systems. The label prediction procedure for an unlabeled record is comprised of the following parts:
i) Extract all considered feature values from unlabeled records.
ii) The proposed adaptive boosting classification approach will be utilized to forecast seed germination quality as follows:
iii) Find the standard measurements of feature fitness coefficients for all weak classifiers.
iv) Consider the values of the features in the input record, which are best for one or more weak classifiers.
v) The normal distribution for each optimal feature is calculated using the feature’s input value as the standard measure.
vi) Find the input record’s fitness confidence towards all optimal features of the weak classifier.
vii) Use standard measurements of fitness coefficients discovered during the training phase to predict the label.
viii) After this prediction step, each input record will be labeled.
This section explains the process of training a classifier using the given corpus of records with different labels, which have been targeted to discover in prediction phase. Training phase includes,
a) The optimal features for each label shall be selected from the given training corpus
b) Find the fitness coefficients of each optimal feature of each label

Further, for each label
These resultant values

This section explains the process involved in the prediction phase to identify the germination quality of the seed samples. The steps involved in this phase are to select the values in a given test record, representing the optimal features selected in the training phase. The value of each optimal feature will be used as a standard measure in the future, predicting the normal distribution of size, which is the maximum number of records with any of the given labels
Discovers fitness confidences of each optimal feature, which is using the normal distribution synthesized in earlier process.
Further, compares fitness confidences of each optimal feature with fitness coefficients of the corresponding optimal feature to identify the appropriate label representing the germination quality of the seed samples

3.3.4 Estimating Fitness Confidences
This set of fitness coefficients of respective features of each label shall be considered to train the classification model that predicts the germination quality of seed samples from the given unlabeled records.

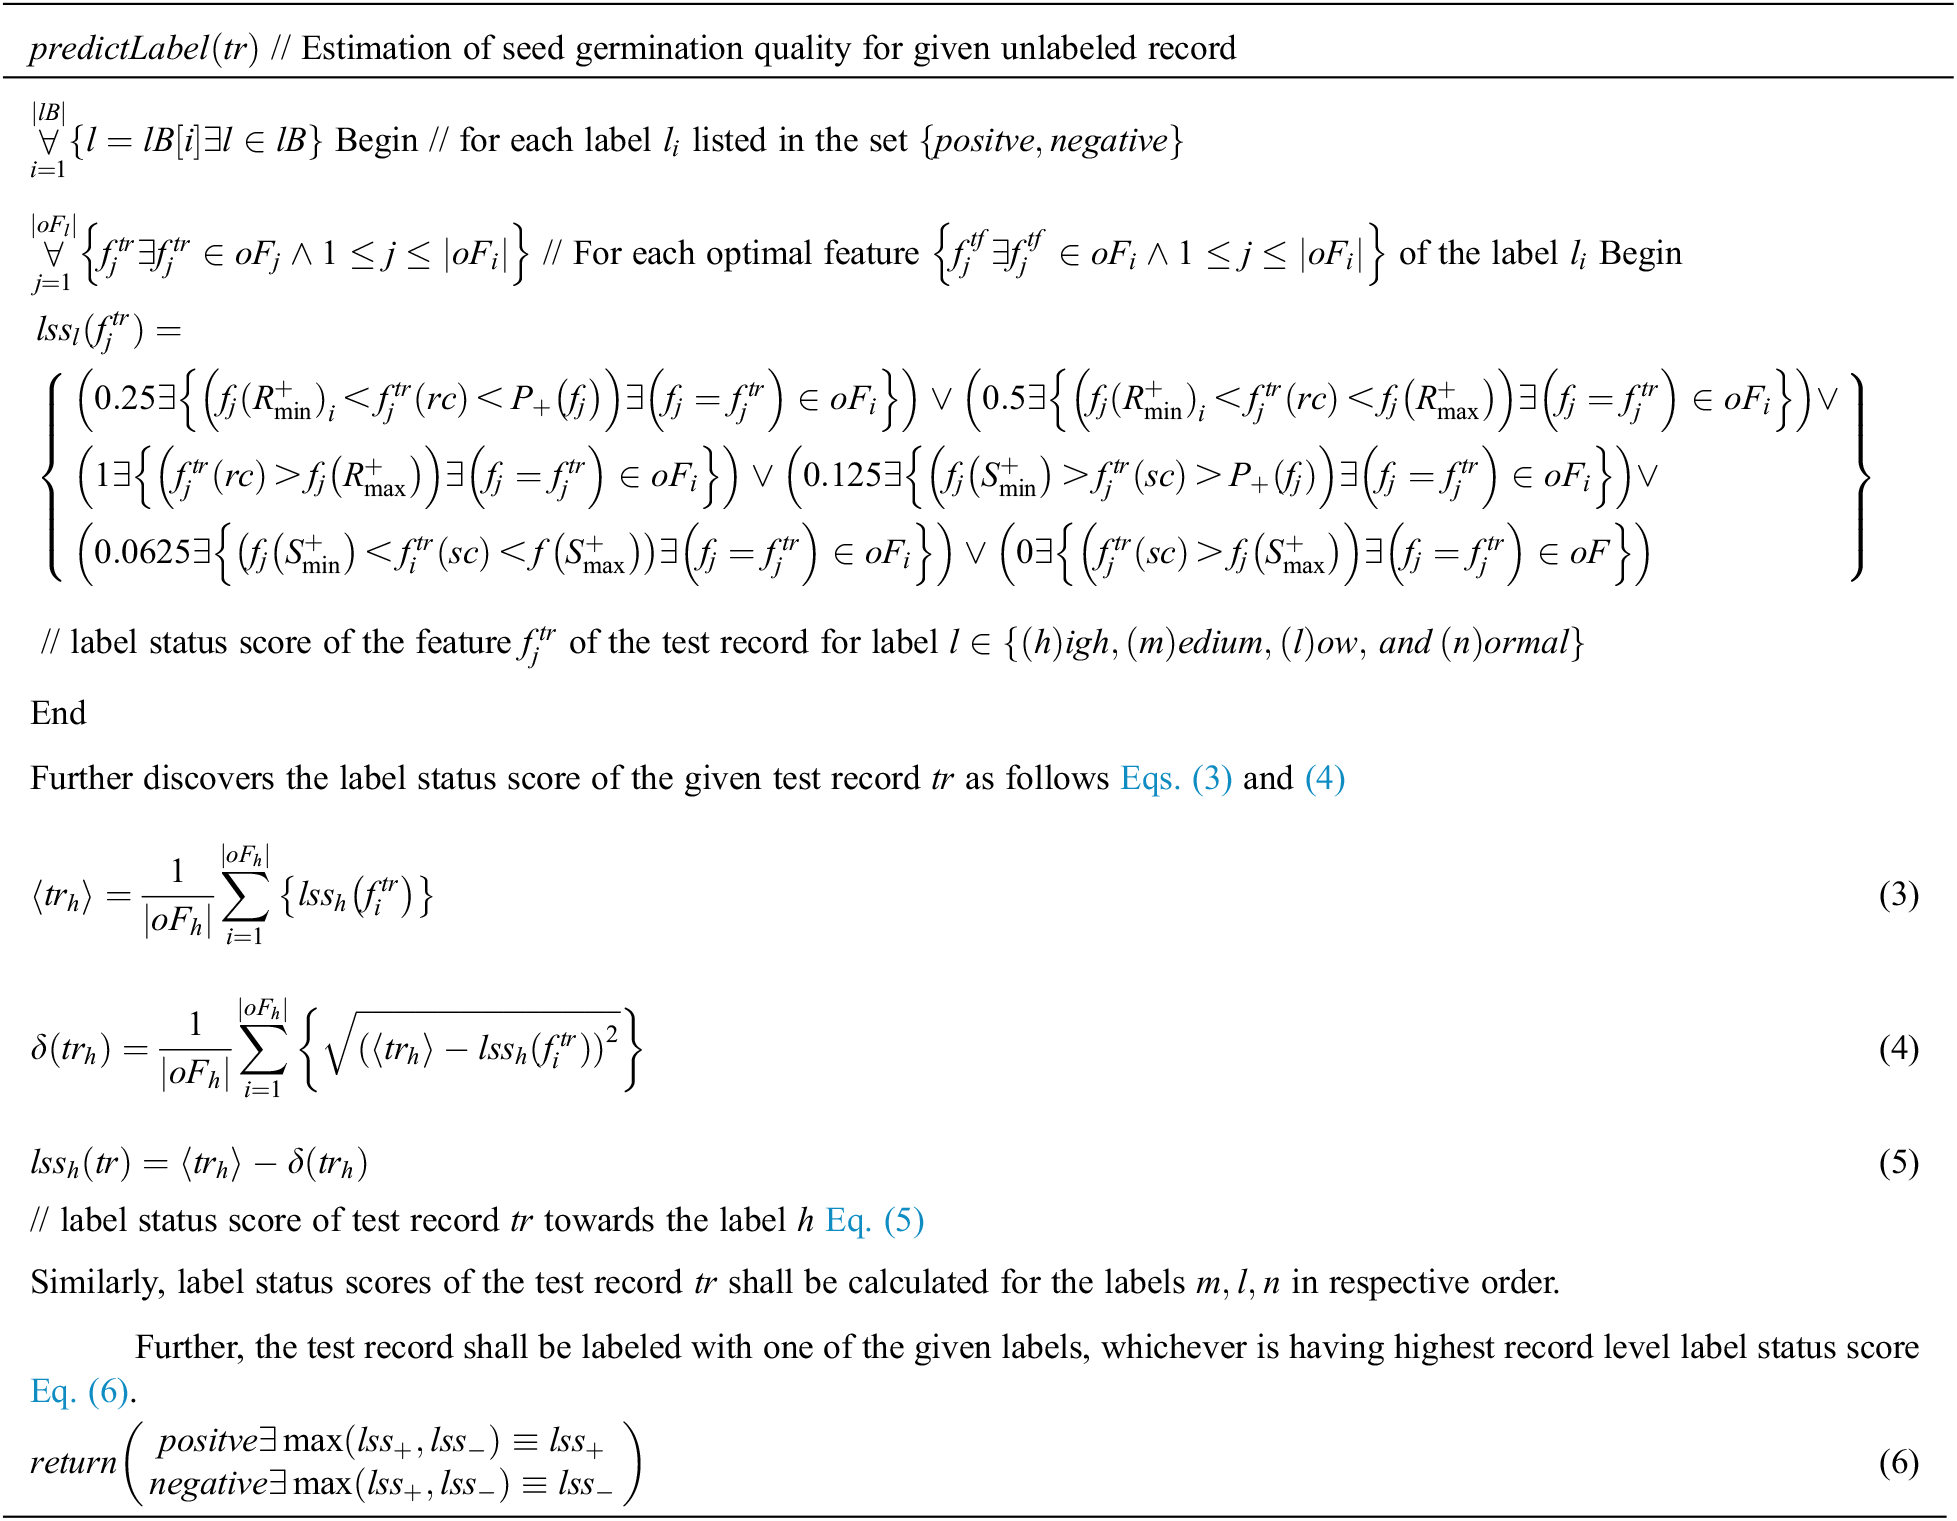
This section explains the process of predicting the seed germination quality of the given unlabeled record, which has to be done by comparing the fitness confidences of each optimal feature value of test record to the fitness coefficients of the respective optimal feature discovered in training phase. The mathematical representation of the label prediction follows:
This section describes the experimental strategy and performance analysis. The data corpus used for this experimental study has been tailored by aggregating the appropriate microscopic images of seeds labeled as positive or negative for germination quality. The motive of the considered dataset is to achieve diversity in records for each label and to maintain marginal specificity and sensitivity.
This simulation uses the negative and positive data corpus from [25] to show the germination quality of paddy seed. The corpus dataset has 4250 negative items and 6230 positive records. Tab. 1 shows the input corpus statistics. Precision, TPR, TNR, and accuracy are significant ideal qualities chosen based on diverse threshold set. Both the proposed AGQSS model and current approaches like ASQT System employing GAN and Active Learning have been simulated in cross-validation of 10 folds. Moreover, comparison research shows that the proposed AGQSS model outperforms existing techniques like G-DPQ and ASQT.

The comparison has been carried out among the projected model AGQSS and existing models ASQT and G-DPQ by plotting a graph with ten folds on the x-axis and metric precision on the y-axis, as shown in Fig. 1. The precision metric is also called a positive predictive value. From the statistics, the average standard deviation of the projected model AGQSS is 0.98818 ± 0.001303 and the contemporary models ASQT and G-DPQ are 0.97638 ± 0.002464 and 0.96798 ± 0.001635 in respective order. It has been concluded that the performance of the projected model is more optimal when compared with contemporary models.
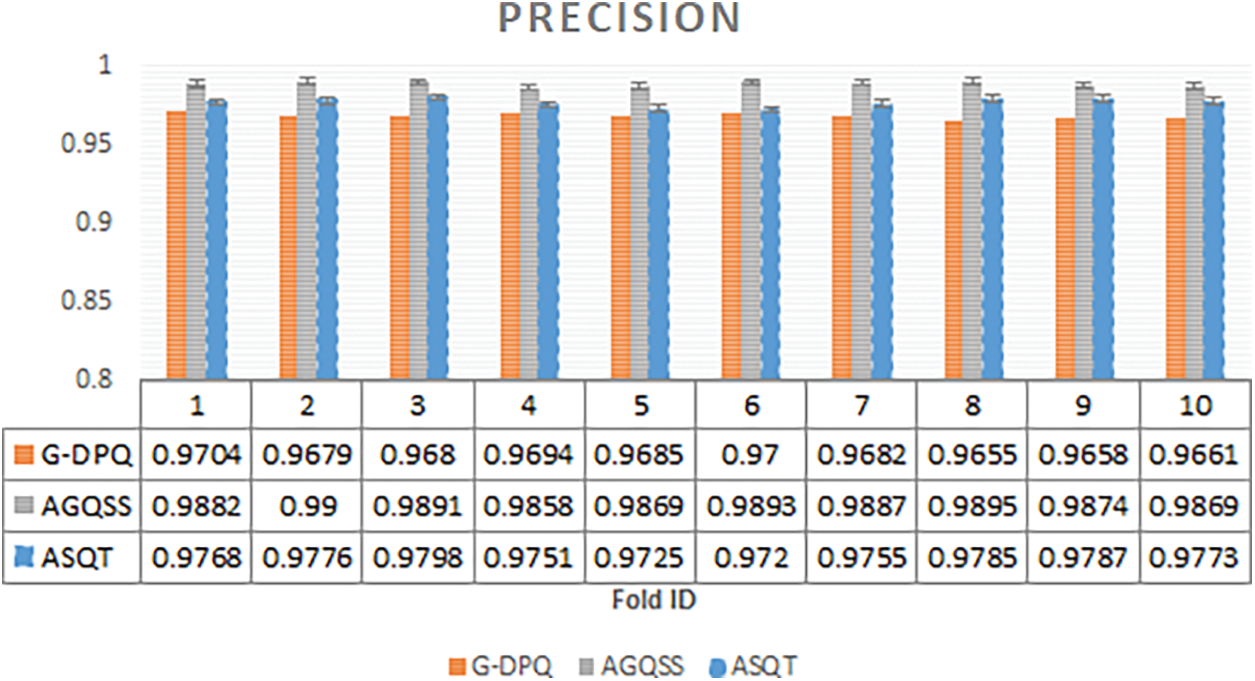
Figure 1: Precision observed for proposed method AGQSS, contemporary models ASQT, and G-DPQ
In Fig. 2, the graph has been plotted among ten folds on the x-axis and metric specificity values on the y-axis for the projected AGQSS and compared with other contemporary models like ASQT and G-DPQ. From the statistics, the average standard deviation of specificity over the projected model AGQSS is 0.95689 ± 0.004955, and the contemporary models ASQT and G-DPQ are 0.91576 ± 0.009092 and 0.88891 ± 0.005879 respectively. It has been concluded that the performance of the projected model in terms of specificity is better compared with contemporary models.
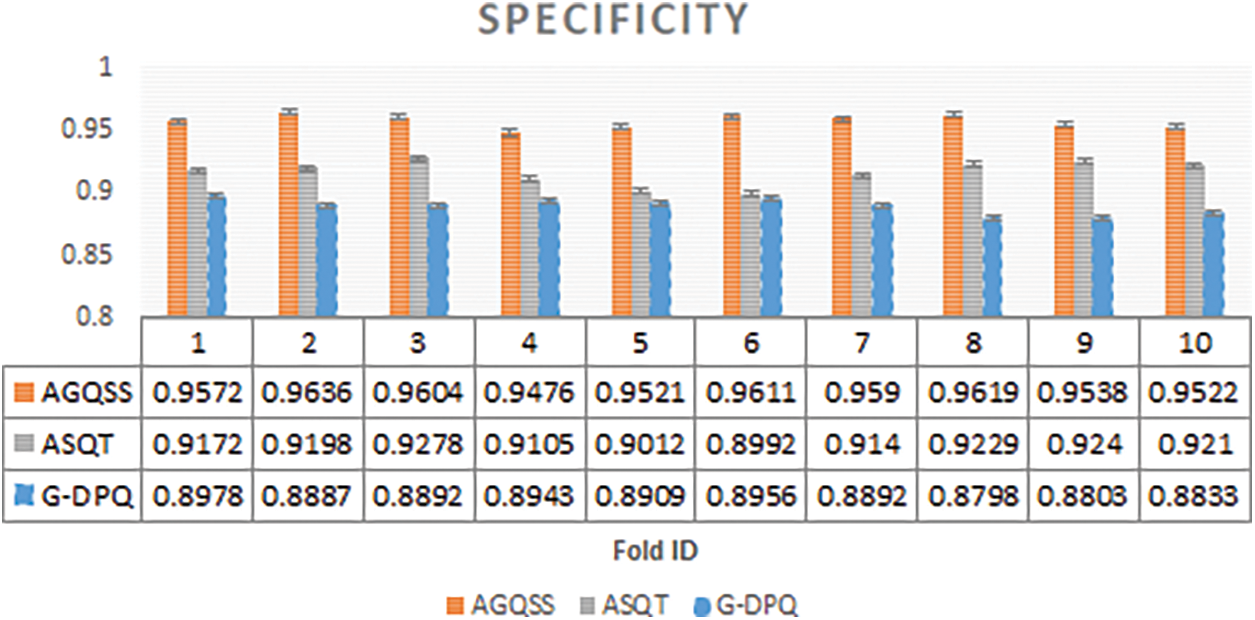
Figure 2: Specificity observed for proposed method AGQSS, contemporary models ASQT, and G-DPQ
The comparison between the projected model AGQSS and existing models ASQT and G-DPQ was made by plotting a graph among ten folds on the x-axis and metric sensitivity values on the y-axis, as shown in Fig. 3. The metric sensitivity is also called recall or TPR. From the statistics, the average standard deviation of the projected model AGQSS is 0.94677 ± 0.005321 and the contemporary models ASQT and G-DPQ are 0.92522 ± 0.006914 and 0.89124 ± 0.003353 in respective order. It has been concluded that the performance of the projected model in terms of sensitivity is more optimal when compared with contemporary models.

Figure 3: Sensitivity observed for proposed method AGQSS, contemporary models MK-SQC, and G-DPQ
The comparison between projected model AGQSS and existing models ASQT and G-DPQ by plotting graph among ten folds on the x-axis and metric accuracy values on the y-axis as shown in Fig. 4. From the statistics, the average standard deviation of accuracy over the projected model AGQSS is 0.94887 ± 0.003834 and contemporary models ASQT and G-DPQ are 0.9232 ± 0.004999 and 0.89076 ± 0.002999 in respective order. It has been concluded that the performance of the projected model in terms of accuracy is better compared with contemporary models.

Figure 4: Accuracy observed for proposed method AGQSS, contemporary models MK-SQC, and GDPQ
In Fig. 5, the graph has been plotted among ten folds on the x-axis and metric F-measure values on the y-axis for the projected AGQSS and compared with other contemporary models like ASQT and G-DPQ. From the statistics, the average standard deviation of F-measure over the projected model AGQSS is 0.97227 ± 0.003191, and the contemporary models ASQT and G-DPQ are 0.94509 ± 0.006003 and 0.92675 ± 0.003934 respectively. It has been concluded that the performance of the projected model in terms of F-measure is better compared with contemporary models.

Figure 5: F-measure observed for proposed method AGQSS, contemporary models ASQT, and G-DPQ
In Fig. 6, the graph has been plotted among the ten folds represented on the x-axis and metric MCC values on the y-axis for the projected AGQSS and compared with other contemporary models like ASQT and G-DPQ. From the statistics, the average standard deviation of MCC over the projected model AGQSS is 0.85829 ± 0.009093, and the contemporary models ASQT and G-DPQ are 0.78957 ± 0.011044 and 0.71354 ± 0.007015, respectively. It has been concluded that the performance of the projected model in terms of MCC is more optimal when compared with contemporary models.

Figure 6: Matthews’s correlation coefficient (MCC) observed for proposed method AGQSS, contemporary models ASQT, and G-DPQ
The performance of the models is compared by using several metrics like precision, accuracy, specificity, sensitivity, MCC, and F-measure. From the above analysis, it has been concluded that the proposed model AGQSS performs much better when compared with the contemporary models ASQT and G-DPQ over the ten folds.
The goal of this work was to address the limitations of predictive analysis by utilizing classification to determine the germination quality of seed samples. In contrast to conventional models, this one generates feature values from quantitative phases. When shown microscopic images of the seed at an early stage of infection, it has been discovered that contemporary models lose predictive accuracy. Predictive analysis by classification is applied in the healthcare domain. As a result, the suggested model, “AGQSS” via Adaptive Boosting Ensemble Classification, is designed to train utilizing the values of characteristics observed at various quantitative phases of microscopic pictures, as well as the universal features of entropies, GLCM, and morphological aspects of the training seeds. The training phase’s fitness function was adjusted to determine the fitness coefficients of the parameters affecting germination quality. The fitness function used in the prediction phase of the classification to anticipate germination quality evaluates the feature confidence of the test record with respect to germination quality. The feature confidences are then compared to the fitness coefficients of the features discovered in the training corpus in order to forecast the right label that accurately represents the seed samples’ germination quality. The experimental inquiry compared the AGQSS performance analysis measures’ depicted findings to current models. According to the experimental study, the AGQSS beats other contemporary models in terms of accuracy, sensitivity, and specificity. Additionally, the proposal’s fallout and miss-rate are quite low in comparison to current models. However, the ratio of fall-out to miss-rate seen in the proposed model AGQSS imposes considerable constraints, “which would be the subject of future research.”
Funding Statement: The author received no specific funding for this study.
Conflicts of Interest: The author declare that they have no conflicts of interest to report regarding the present study.
1. G. ElMasry, N. Mandour, S. Al-Rejaie, E. Belin and D. Rousseau, “Recent applications of multispectral imaging in seed phenotyping and quality monitoring—an overview,” Sensors, vol. 19, no. 5, pp. 1090, 2019. [Google Scholar]
2. J. Yasmin, M. Raju Ahmed, S. Lohumi, C. Wakholi, M. S. Kim et al., “Classification method for viability screening of naturally aged watermelon seeds using FT-NIR spectroscopy,” Sensors, vol. 19, no. 5, pp. 1190, 2019. [Google Scholar]
3. A. D. De Medeiros, D. T. Pinheiro, W. A. Xavier, L. J. da Silva and D. C. F. dos Dias, “Quality classification of Jatropha curcas seeds using radiographic images and machine learning,” Industrial Crops and Products, vol. 146, pp. 112162, 2020. [Google Scholar]
4. D. K. Ray, N. D. Mueller, P. C. West and J. A. Foley, “Yield trends are insufficient to double global crop production by 2050,” PLoS ONE, vol. 8, no. 6, pp. e66428, 2013. [Google Scholar]
5. J. Marcos Filho, “Seed vigor testing: An overview of the past, present and future perspective,” Scientia Agricola, vol. 72, no. 4, pp. 363–374, 2015. [Google Scholar]
6. M. R. Ahmed, J. Yasmin, W. Collins and B. K. Cho, “X-ray CT image analysis for morphology of muskmelon seed in relation to germination,” Biosystems Engineering, vol. 175, no. 3, pp. 183–193, 2018. [Google Scholar]
7. A. D. De Medeiros, D. T. Pinheiro, W. A. Xavier, L. J. da Silva and D. C. F. dos Dias, “Quality classification of Jatropha curcas seeds using radiographic images and machine learning,” Industrial Crops and Products, vol. 146, pp. 1–7, 2020. [Google Scholar]
8. G. C. Andrade, C. M. Medeiros Coelho and V. G. Uarrota, “Modelling the vigour of maize seeds submitted to artificial accelerated ageing based on ATR-FTIR data and chemometric tools (PCA, HCA and PLS-DA),” Heliyon, vol. 6, no. 2, pp. e03477, 2020. [Google Scholar]
9. R. M. Silverstein, F. X. Webster and D. Kiemle, “Spectrometric identification of organic compounds,” Journal of Chemical Education, vol. 13, no. 11, pp. 546–553, 1962. [Google Scholar]
10. C. Li, T. Zhao, C. Li, L. Mei, E. Yu et al., “Determination of gossypol content in cottonseeds by near infrared spectroscopy based on Monte Carlo uninformative variable elimination and non-linear calibration methods,” Food Chemistry, vol. 221, pp. 990–996, 2017. [Google Scholar]
11. P. Mukasa, C. Wakholi, C. Mo, M. Oh, H. J. J. Joo et al., “Determination of viability of Retinispora (Hinoki cypress) seeds using FT-NIR spectroscopy,” Infrared Physics & Technology, vol. 98, pp. 62–68, 2019. [Google Scholar]
12. B. Nugraha, P. Verboven, S. Janssen, Z. Wang and B. M. Nicolai, “Non-destructive porosity mapping of fruit and vegetables using X-ray CT,” Postharvest Biology and Technology, vol. 150, pp. 80–88, 2019. [Google Scholar]
13. L. Benedet, W. M. Faria, S. H. G. Silva, M. Mancini, L. R. G. Guilherme et al., “Soil subgroup prediction via portable X-ray fluorescence and visible near-infrared spectroscopy,” Geoderma, vol. 365, no. 6, pp. 1–10, 2020. [Google Scholar]
14. R. A. Bantan, A. Ali, S. Naeem, F. Jamal, M. Elgarhy et al., “Discrimination of sunflower seeds using multispectral and texture dataset in combination with region selection and supervised classification methods,” Chaos: An Interdisciplinary Journal of Nonlinear Science, vol. 30, no. 11, pp. 1–10, 2020. [Google Scholar]
15. D. Awty-Carroll, J. Clifton-Brown and P. Robson, “Using k-NN to analyse images of diverse germination phenotypes and detect single seed germination in Miscanthus sinensis,” Plant Methods, vol. 14, no. 1, pp. 1–7, 2018. [Google Scholar]
16. R. Masteling, L. Voorhoeve, I. J. Jsselmuiden, F. Dini-Andreote, W. de Boer et al., “DiSCount: Computer vision for automated quantification of Striga seed germination,” Plant Methods, vol. 16, no. 1, pp. 1–8, 2020. [Google Scholar]
17. K. Halcro, K. McNabb, A. Lockinger, D. Socquet-Juglard, K. E. Bett et al., “The BELT and phenoSEED platforms: Shape and colour phenotyping of seed samples,” Plant Methods, vol. 16, no. 1, pp. 1–3, 2020. [Google Scholar]
18. D. Lozano-Claros, X. Meng, E. Custovic, G. Deng, O. Berkowitz et al., “Developmental normalization of phenomics data generated by high throughput plant phenotyping systems,” Plant Methods, vol. 16, no. 1, pp. 1–11, 2020. [Google Scholar]
19. R. Mayara, F. G. Gomes-Junior and J. Marcos-Filho, “Vigor-S: System for automated analysis of soybean seed vigor,” Journal of Seed Science, vol. 42, no. e202042039, pp. 1–12, 2020. [Google Scholar]
20. V. Sainte Fare Garnot, L. Landrieu, S. Giordano and N. Chehata, “Satellite image time series classification with pixel-set encoders and temporal self-attention,” in 2020 IEEE/CVF Conference on Computer Vision and Pattern Recognition (CVPR), Seattle, WA, USA, pp. 12322–12331, 2020, ISSN: 1063-6919. [Google Scholar]
21. T. T. Nguyen, V. N. Hoang, T. L. Le, T. H. Tran and H. Vu, “A vision-based method for automatic evaluation of germination rate of rice seeds,” in 1st Int. Conf. On Multimedia Analysis And Pattern Recognition (MAPR), Ho Chi Minh city, Vietnam, pp. 1–6, 2018, ISBN:978-1-5386-4181-1 [Google Scholar]
22. N. Genze, R. Bharti, M. Grieb, S. J. Schultheiss and D. G. Grimm, “Accurate machine learning-based germination detection, prediction and quality assessment of three grain crops,” Plant Methods, vol. 16, no. 1, pp. 1–11, 2020. [Google Scholar]
23. N. Sandeep, P. Pani, R. Nair and G. Varma, “Automated seed quality testing system using GAN & active learning1–9, 2021. [Online]. Available: https://arxiv.org/abs/2110.00777. [Google Scholar]
24. S. Yue, P. Pilon and G. Cavadias, “Power of the mann-kendall and spearman’s rho tests for detecting monotonic trends in hydrological series,” Journal of hydrology, vol. 259, no. 1–4, pp. 254–271, 2002. [Google Scholar]
25. Ken Pletcher, “Paddy Seed Data [Data set]. Kaggle,” 2020. [Online]. Available: https://www.kaggle.com/dataset/c6caf46ef419a4cb653b4f8872a8136bb17151b106abd84821742b19d6db2447. [Google Scholar]
 | This work is licensed under a Creative Commons Attribution 4.0 International License, which permits unrestricted use, distribution, and reproduction in any medium, provided the original work is properly cited. |