DOI:10.32604/iasc.2023.029549
| Intelligent Automation & Soft Computing DOI:10.32604/iasc.2023.029549 | |
| Article |
Hybrid Color Texture Features Classification Through ANN for Melanoma
1Faculty of Computer Science & Information Technology, Superior University, Lahore, 54600, Pakistan
2Department of Software Engineering, Superior University, Lahore, 54600, Pakistan
3Department of Computer Science & Artificial Intelligence, College of Computer Science & Engineering, University of Jeddah, 21493, Saudi Arabia
4Department of Software Engineering, College of Computer Science and Engineering, University of Jeddah, 21493, Saudi Arabia
*Corresponding Author: Muhammad Waseem Iqbal. Email: waseem.iqbal@superior.edu.pk
Received: 07 March 2022; Accepted: 19 April 2022
Abstract: Melanoma is of the lethal and rare types of skin cancer. It is curable at an initial stage and the patient can survive easily. It is very difficult to screen all skin lesion patients due to costly treatment. Clinicians are requiring a correct method for the right treatment for dermoscopic clinical features such as lesion borders, pigment networks, and the color of melanoma. These challenges are required an automated system to classify the clinical features of melanoma and non-melanoma disease. The trained clinicians can overcome the issues such as low contrast, lesions varying in size, color, and the existence of several objects like hair, reflections, air bubbles, and oils on almost all images. Active contour is one of the suitable methods with some drawbacks for the segmentation of irregular shapes. An entropy and morphology-based automated mask selection is proposed for the active contour method. The proposed method can improve the overall segmentation along with the boundary of melanoma images. In this study, features have been extracted to perform the classification on different texture scales like Gray level co-occurrence matrix (GLCM) and Local binary pattern (LBP). When four different moments pull out in six different color spaces like HSV, Lin RGB, YIQ, YCbCr, XYZ, and CIE L*a*b then global information from different colors channels have been combined. Therefore, hybrid fused texture features; such as local, color feature as global, shape features, and Artificial neural network (ANN) as classifiers have been proposed for the categorization of the malignant and non-malignant. Experimentations had been carried out on datasets Dermis, DermQuest, and PH2. The results of our advanced method showed superiority and contrast with the existing state-of-the-art techniques.
Keywords: Gray level co-occurrence matrix; local binary pattern; artificial neural networks; support vector machines; color; skin cancer; dermoscopic
Diagnosis and cure of various types of cancer is a very extensive, careful, and often serious procedure. Melanoma is a skin lesion, which contains melanocytes in pigment cells of the skin body which has significant dominance amongst the patients of skin lesion. The commonly aroused cancer in men and women is malignant melanoma of the skin lesion. About three million new patients registered in 2018. The harshness of this type of cancer can be estimated from the information that melanoma is the cause of about 75% of death related to skin cancer. Various figures from the U.K show that around 2,400 melanoma skin lesion death every annual which is more than six per day [1].
In Canada, similar studies were conducted show that one in 74 males and 1 in 90 females have the chance to be diseased with skin lesion melanoma in their life. Reviewing various literature related to skin lesions from 1992-to 2006, the researchers have discovered that incidence rates were increasing in white men and women is about 3% annual rate and for ages fifteen to thirty, so the very common type of skin cancer is malignant melanoma [2].
These relevant studies show that the probability of its treatment increases extensively if melanoma is identified in the initial stages. For example, with recognition at stage I, the chance of cure is 96 for 5-years. But, if the melanoma is identified in the fourth stage, the same chance of cure decreases to 5%. Additionally, the cost of treatment of stages I and IV are differing by 30%. So, at the initial stage melanoma investigation is considered both a fruitful cure and reducing cost. For exposure to the lesion features and enhancing the skin lesions dermatologist and consultants use dermoscopy which is a very helpful instrument performed with a small tool [3].
Tremendous improvement in diagnosis by using the dermoscopic device as compared to diagnosis with the naked eye. It has experimented that the application of ABCD rules combined with using a dermoscopic image detection of skin cancer as malignant melanoma has an impressive stated sensitivity of 76% to 87.7% and specificity of 61% to 77.8%. Though, only 48% of dermatologists in the US testified by using a dermoscopic device. The reasons can be the lack of either training or interest for this low ratio [4].
This suggested research work performs under the core areas of information systems for image processing, artificial intelligence as well as decision-making activities and is usually known as a decision support system. Decision support systems had been installed in the large region on an industrial scale such as education institutions, corporate sector, government public sector, medical domain and defense organizations, etc. In recent times for medical applications decision support systems acquire more pertinence, especially in the research field. This result uplifts them to motivate competent and effective novel solutions to many problems of real life in the domain of medicine [5].
Medical decision support systems are carrying out a creditable job in supporting medical professionals by helping them in making accurate results for ingdiagnosing different types of disease. Malignant melanoma is not detected and cured early, so it is the deadliest and rare type of skin lesion. The death rate of malignant melanoma is more than three times of compared of all other skin malignancies. Occurrence rates of malignance had been increased, particularly among grown people, however, existence rates are high if identified in the early stage. Unluckily, the costs and time necessary for a skin doctor to examine all patients for melanoma are very expensive. So, there is essential for a computerized system to measure an affected risk of melanoma using digital dermoscopic. Dermoscopy is a technique of skin imaging commonly used for pigmented skin cancer check-ups. One of the major challenges in applying such a system is that precisely detects and classifies skin cancer in the dermoscopic image. In the presence of noise such as lighting variation like low contrast, shadows, hairs, and specular reflections, most current skin cancer segmentation algorithms are poorly affected in dermoscopic images. It confuses the task of detecting the skin lesion in the presence of these abnormalities. Existing systems for skin lesions for detection and classification are also computationally extensive and quite costly [6].
The basic objective of this research is to review the existing techniques and then after investigating their limitations, suggest an innovative technique for image segmentation with a particular focus on skin lesions. Such a technique should validate the accuracy and higher reliability in skin lesion recognition and classification. The general objective is to carefully review, analyze and explore the overall skin cancer detection and classification in its performance to establish the need for a better and enhanced technique. Our specific objective is to introduce automated and intelligent skin lesion detection techniques with enhanced quality and classification. The system should also provide easiness, simplicity, and support to all those people working in the health sector to analyze the skin lesion reliably and accurately.
Cheer et al. [7] propose two segmentation methods K-mean clustering and iterative for skin lesion detection and classification in his survey paper. Asymmetry of lesion parts, irregularity of border, color variability, and diameter are extracted and a total dermoscopic score uses to classify the skin cancer as melanoma or non-melanoma [8] using a geometric, structural, textual, and chromatic feature for classification of skin cancer. By using these features by a classifier, 94.3% accuracy was achieved in 500 images classifying into the present and absent class and 82.3% perfection while differentiating regular, truant, and random classes. It was proposed by [9] the classification of skin cancer by using a bag of features.
Color and textures features are used for classification. Three classifiers for the classification such as K-nearest neighbor (kNN), AdaBoost, and Support vector machines (SVM) enhanced by various authors. The authors get 93% sensitivity and 85% specificity by using kNN and 93% sensitivity and 88% specificity by using SVM to present their research at High-level intuitive features (HLIF) to classify skin cancer images into melanoma or non-melanoma class [10]. By using high-level intuitive features, he described the asymmetry of skin cancer images. The color and shape of the x-axis are considered in this study. They showed the results 79.83% sensitivity, 68.97% specificity, and 75.24% accuracy by using SVM and leave-one-out cross-validation. He suggested a combination of HLIFs set with LLFs set for better results.
This showed 86.89% accuracy, 91.60% sensitivity, and 80.46% specificity. later research, [11] explained first-class originality to describe the irregularity of border of skin lesion images that gets from a standard camera. He proposed irregularity of border HLIFs combined with other features. and produced 87.38% accuracy, 90.76% sensitivity, and 82.76% specificity by using Fourier descriptors classification is the last stage of skin lesion detection and at that stage, input images are categorized into two types (melanoma and nonmelanoma) [12].
T Two procedures categorized dermoscopic images: The first procedure is described as, for classification of the input image into melanoma or nonmelanoma vector machines assigns a label of 1 or 0. The second procedure in which different classifier artificial neural networks, Logistic regression, nearest neighbors, and decision trees enhance class membership to the first procedure for classification robust and more accurate [13].
We have studied some more classification algorithms in detail and assessed them to enhance the performance of classification algorithms that depend upon neural networks. Using these algorithms, the sensitivity lies between 78% to 81%, and its specificity is 76% to 86%. It is a suggested classification algorithm which based on multivariate and showed outstanding results such as 76% sensitivity and the specificity of 65%. Rule-based algorithm for classification presented by [14] showed 80% sensitivity and 85% specificity. The sensitivity is 80% and 80% is achieved by this algorithm. Marques et al. [15] suggests performance evaluation of Support vector machine (SVM) classifiers for classification. According to this perspective, he gets 93% sensitivity and 92% specificity [16].
This method showed 93% sensitivity and 91% specificity. By using the [17] method the performance of a CART algorithm for classification determined and express both sensitivity and specificity have the same results 92%. Evaluation of the performance of a k-NN method for classification developed by [18] and sensitivity 87% and the specificity 92% in this method. The performance evaluation of combining Logistic model trees (LMT) and Correlation-based feature sector (CFS) for classification [19]. Using this technique, he showed results of 94% sensitivity and 68% specificity.
In this research methodology, there are several stages and approaches to get robust and accurate classification results. In the initial stages, from Dermis, we get the melanoma & non-melanoma dermoscopic images. There was also a different texture of melanoma that present as a lesion in the images. Propose method used for classification of malignancy and non-malignance, texture features, and color features.
These images have also some texture characteristics as well as color and shape, so, we will combine different feature extraction techniques; texture, color, and shape features. Since the main features of skin cancer are color and shape so we contribute to the use of these feature extraction techniques. These images have similarities in texture characteristics with LBP and GLCM. So, we will use these two common texture feature extraction algorithms; LBP and GLCM to get good and robust classification results. so the final step is that for classification into two classes melanoma and non-melanoma ensemble bagged tree classifier is used by giving the input. The proposed method has been represented in the diagram shown below as a Fig. 1.
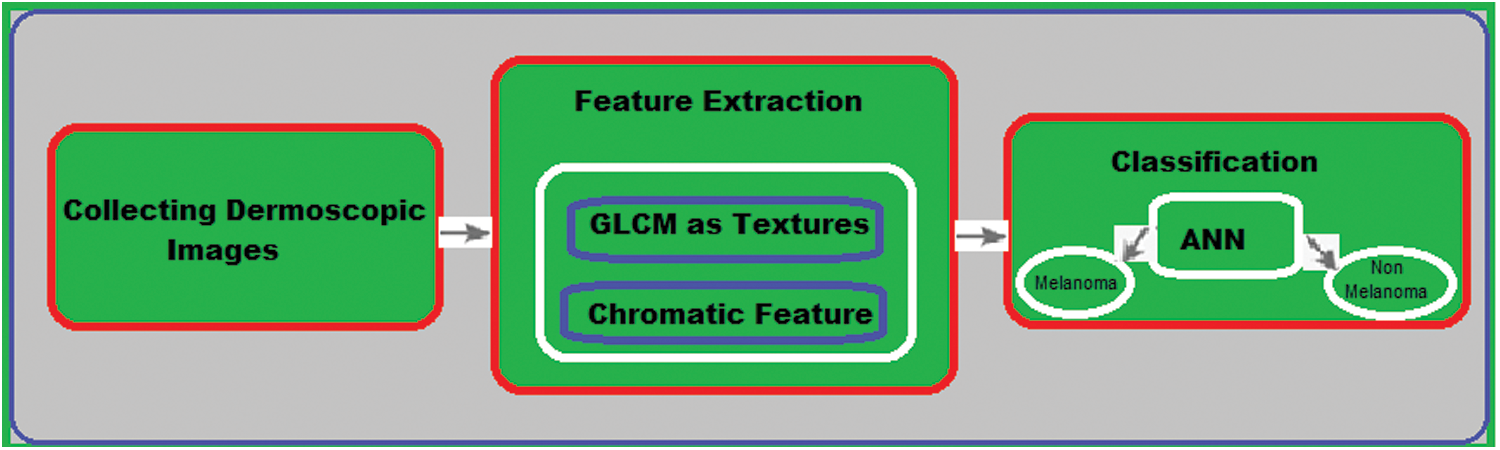
Figure 1: The framework of the proposed method
3.1 Features Extraction and Classification
In this paper, we combined different character features GLCM, LBP as texture with chromatic features and shape features.
The LBP is such a type of operator which extract the LBP features from the image. By calculating the threshold value from each neighborhood pixel and convert into a binary number We have an LBP operator for labeling the image on every pixel of the image as shown in Fig. 2.
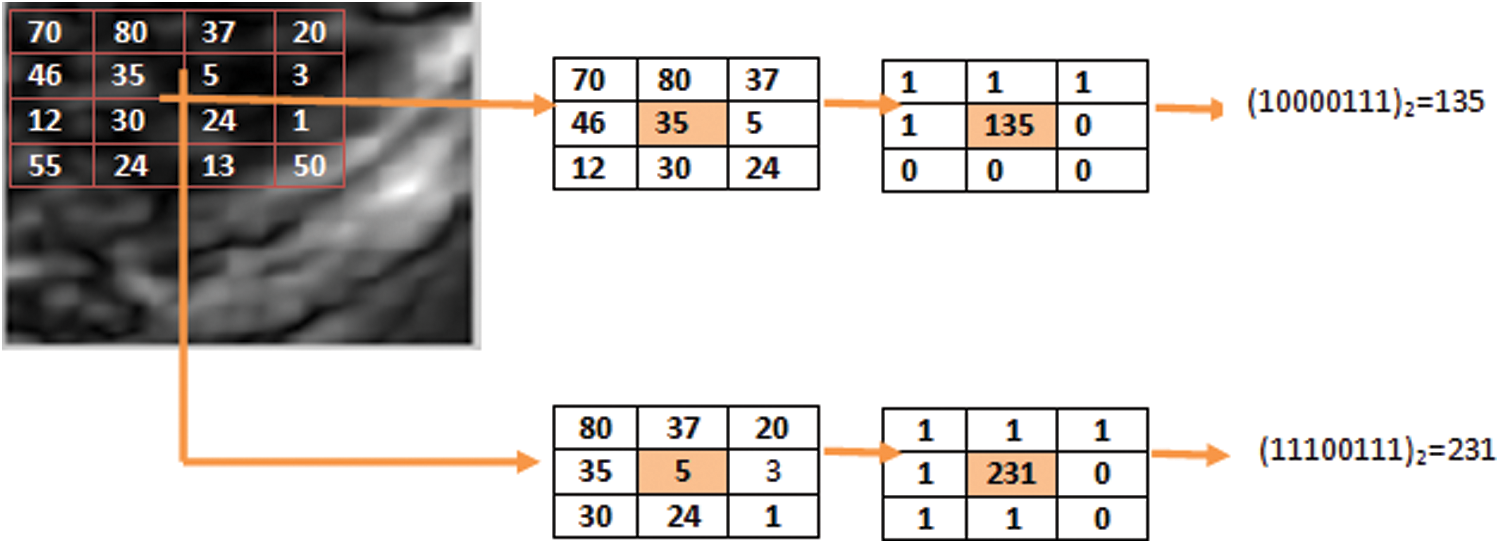
Figure 2: Basic LBP operator working
LBP is very simple in computational and tolerant in changing the gray level. LBP operator read each pixel and compares it with its neighbors’ pixels of the images. It has been used for texture description. LPB has been used in many image processing problems including biomedical image analysis, face recognition, environment modeling, motion analysis, and visual inspection [20].
Basic LBP operator was designed for textures description It calculates threshold value from each neighborhood pixel and converted into a decimal number also assigned for each pixel of images. The following process is used to calculate LBPs as follows. First, we take a set of 3 × 3 pixels of local images. All the neighbor’s pixels’ value is compared with the center pixel value. If the value of the neighbor’s pixels is greater than the central value then labeled as 0 others wise labeled 1. After this, start from the top-left neighbors of the central value for binary values of each pixel, which are concatenated in a clockwise direction to create a new binary number. Gained decimal value is used for assigning the given pixel as LBP codes [21,22].
The Basic LBP operator a can not extract dominant features on a large scale with its small 3 * 3 sets neighborhood. To overcome this limitation, basic LBP has been modified which is applicable at different scales and the different sizes of neighborhoods pixels. By choosing a set of sampling points by defining a local neighborhood to allow any even radius spaced on a circle at the central pixel [23]. If the sampling point does not lie in the pixel of the center, then another bilinear interpolation approach is applied.
LBP is expressed in the decimal form by giving a central pixel
where
3.3 Gray Level Co-Occurrence Metrix
It proposed five entropy, contrast, energy, homogeneity, and correlation classical statistical measurements of texture [24], which obtain from GLCM abbreviated by grey level co-occurrence matrix. In GLCM arrangement different combinations of grey levels occur in a specific pixel coupled with the image. In this concept two GLCMs are in different four directions of 00, 450, 900, and 1350 using eight grey level average and four pixels distance to get a single GLCM and extract five entropy, contrast, energy, homogeneity, and correlation texture metrics from each.
The equation of co-occurrence matrix p of an image I by N*N size is given below;
In this Eq. (2) (Δx, Δy) are relative distance pixels and their neighbor pixel. Two pixels (i, j) with d distance and direction θ are neighborhoods located in gray level which the element representing in GLCM is a statistic.
By using GLCM we can calculate four different features such as entropy, contrast, energy, and homogeneity are given below;
Eq. (3) is used to calculate the entropy feature.
Eq. (4) is used to calculate the contrast feature.
Eq. (5) is used to calculate the energy feature.
Eq. (6) is used to calculate the homogeneity feature.
Chromatic is characterized by color. Color is very tand helps us to recognize a chromatic feature such as color space. The feature of color space is learned by the basic three primary colors Red, green, and blue (RGB). Using the color feature technique, the detected color is presented in the segmented lesion part.
It is done by ing out four statistics mean, variation, standard deviation, and skewness which are generally called color features or color moments which is through six individual color spaces channels: HSV, YCbCr, YIQ, L* a* b*, linear RGB and CIE 1931 XYZ from segmented lesion parts. The basic definition of the color moments is described below:
Mean The average of color values in the channel calculated by given Eq. (7).
This calculates the average value of the color.
Standard deviation: The square root of the variance of the distribution in the channel calculated by given Eq. (8).
This calculates the square root of the variance of the distribution in pixels.
Skewness: The characterized degree of asymmetry distributed around in channel calculated by given Eq. (9).
The above equation calculates the degree of asymmetry distributer around the color channel;
Variance: The variation of the color distribution in the channel is calculated by given Eq. (10).
This calculates the variance of color distribution in channel value.
Where P represents the color channel, N showed the number of pixels and i is for the image.
Here Pj represents the jth pixel of the respective color channel.
We have 6 color models and each model has three channels. For each channel, we extracted four features. There are 6 × 3 × 4 = 72 color features after combining all these color features.
Features obtained from chromatic, GLCM, and LBP have been collected to get a fused set of combined features.
For predicting the class of melanoma or non-melanoma of input images, features which drawn out in the second step are used for the classification tasks. Artificial neural networks (ANN) were used as a basic classifier for the classification of melanoma and non-melanoma in this study because it understands images much more effectively as well as quickly.
ANN is a replication of biological nervous systems. Neurons are the primary element of that system and are the process element to solve specific problems. ANN classifier can detect and classify the composite pattern of given data.
All the features of images of the given dataset were used for training purpose. Backpropagation ANN differentiate malignant and non-malignant from skin pigment.
In ANN demonstration, properties of first layer input are equivalent to the neurons number that’s interconnected with the hidden layer of ANN. Before being presented to the ANN the input data of neurons properties will get normalized. The implementation of the sigmoid assignment function is a need in each neuron. In the hidden layer of ANN, the training processor is executed by using this prior algorithm for the category of those features and to discover the association rules among the features.
The preceding algorithms identify repetitive groups of properties per classification than ANN processor executed till acceptance of the maximum sum of the square error. After training each object must be classified for determining class. The 0 and 1 used in ANN as the target represent melanoma and non-melanoma class respectively.
In this research work, we have to use different three datasets DermIS, DermQuest, and PH2 to evaluate our proposed method. 69 dermoscopic images had been gathered from Dermatology Information System (DermIS) database [25], 213 dermoscopic images from the DermQuest data set, and 200 images from the PH2 dataset. These images belong to two main melanoma and non-melanoma classes. The total number of melanoma images is 26 and 43 for non-melanoma of DermIS dataset represents 39 images of melanoma and 161 images of non-melanoma from the PH2 data set and 76 images of melanoma and 137 images of non-melanoma form the dataset of DermQuest.
4.2 Feature Extraction and Classification
In the light of above the discussion, the following abbreviations are used throughout this section:
- SC is abbreviated as a set of chromatic features. SG stands for the set of GLCM features and SGC isa set of GLCM by appending with chromatic SC and SG (SGC = SC USG).
All above mentioned different feature sets had been used for the preparation and testing of the different two classifiers Linear SVM and ANN [26]. Three different measures accuracy, sensitivity, and specificity were used to check out the performance of all respective different feature sets. In machine learning, we give feature vectors to classification methods as input and predicted class (malignant or non-melanoma) as outputs. The ground truth of each class is known by supervised learning. The classifier generally trains the subset of data and tests on the other part of the data.
There are several different classifiers in MATLAB Toolbox. For our purposes, we used different two classifiers ANN and Liner SVM due to obtaining widely robustness, simplicity, and accurate classification. Better precision consequently imputed to the feature uprooting algorithm ingthe project the data into a separable feature space [27]. For the implementation of our experiments, we used the MATLAB Toolbox.
The given performance measures of classifiers are used.
Accuracy: Number of total classified images/Number of total images
Sensitivity: Number of correct classified malignant images/Number of total malign images
Specificity: Number of correct classified non-malignant images/Number of total non-malignant images = (TN)/(TN + FP)
where TP is a true positive, TN is a true negative, FP false positive and FN is a false negative.
Fig. 3 shows the confusion matrix of the proposed method along with the values of output and target class.
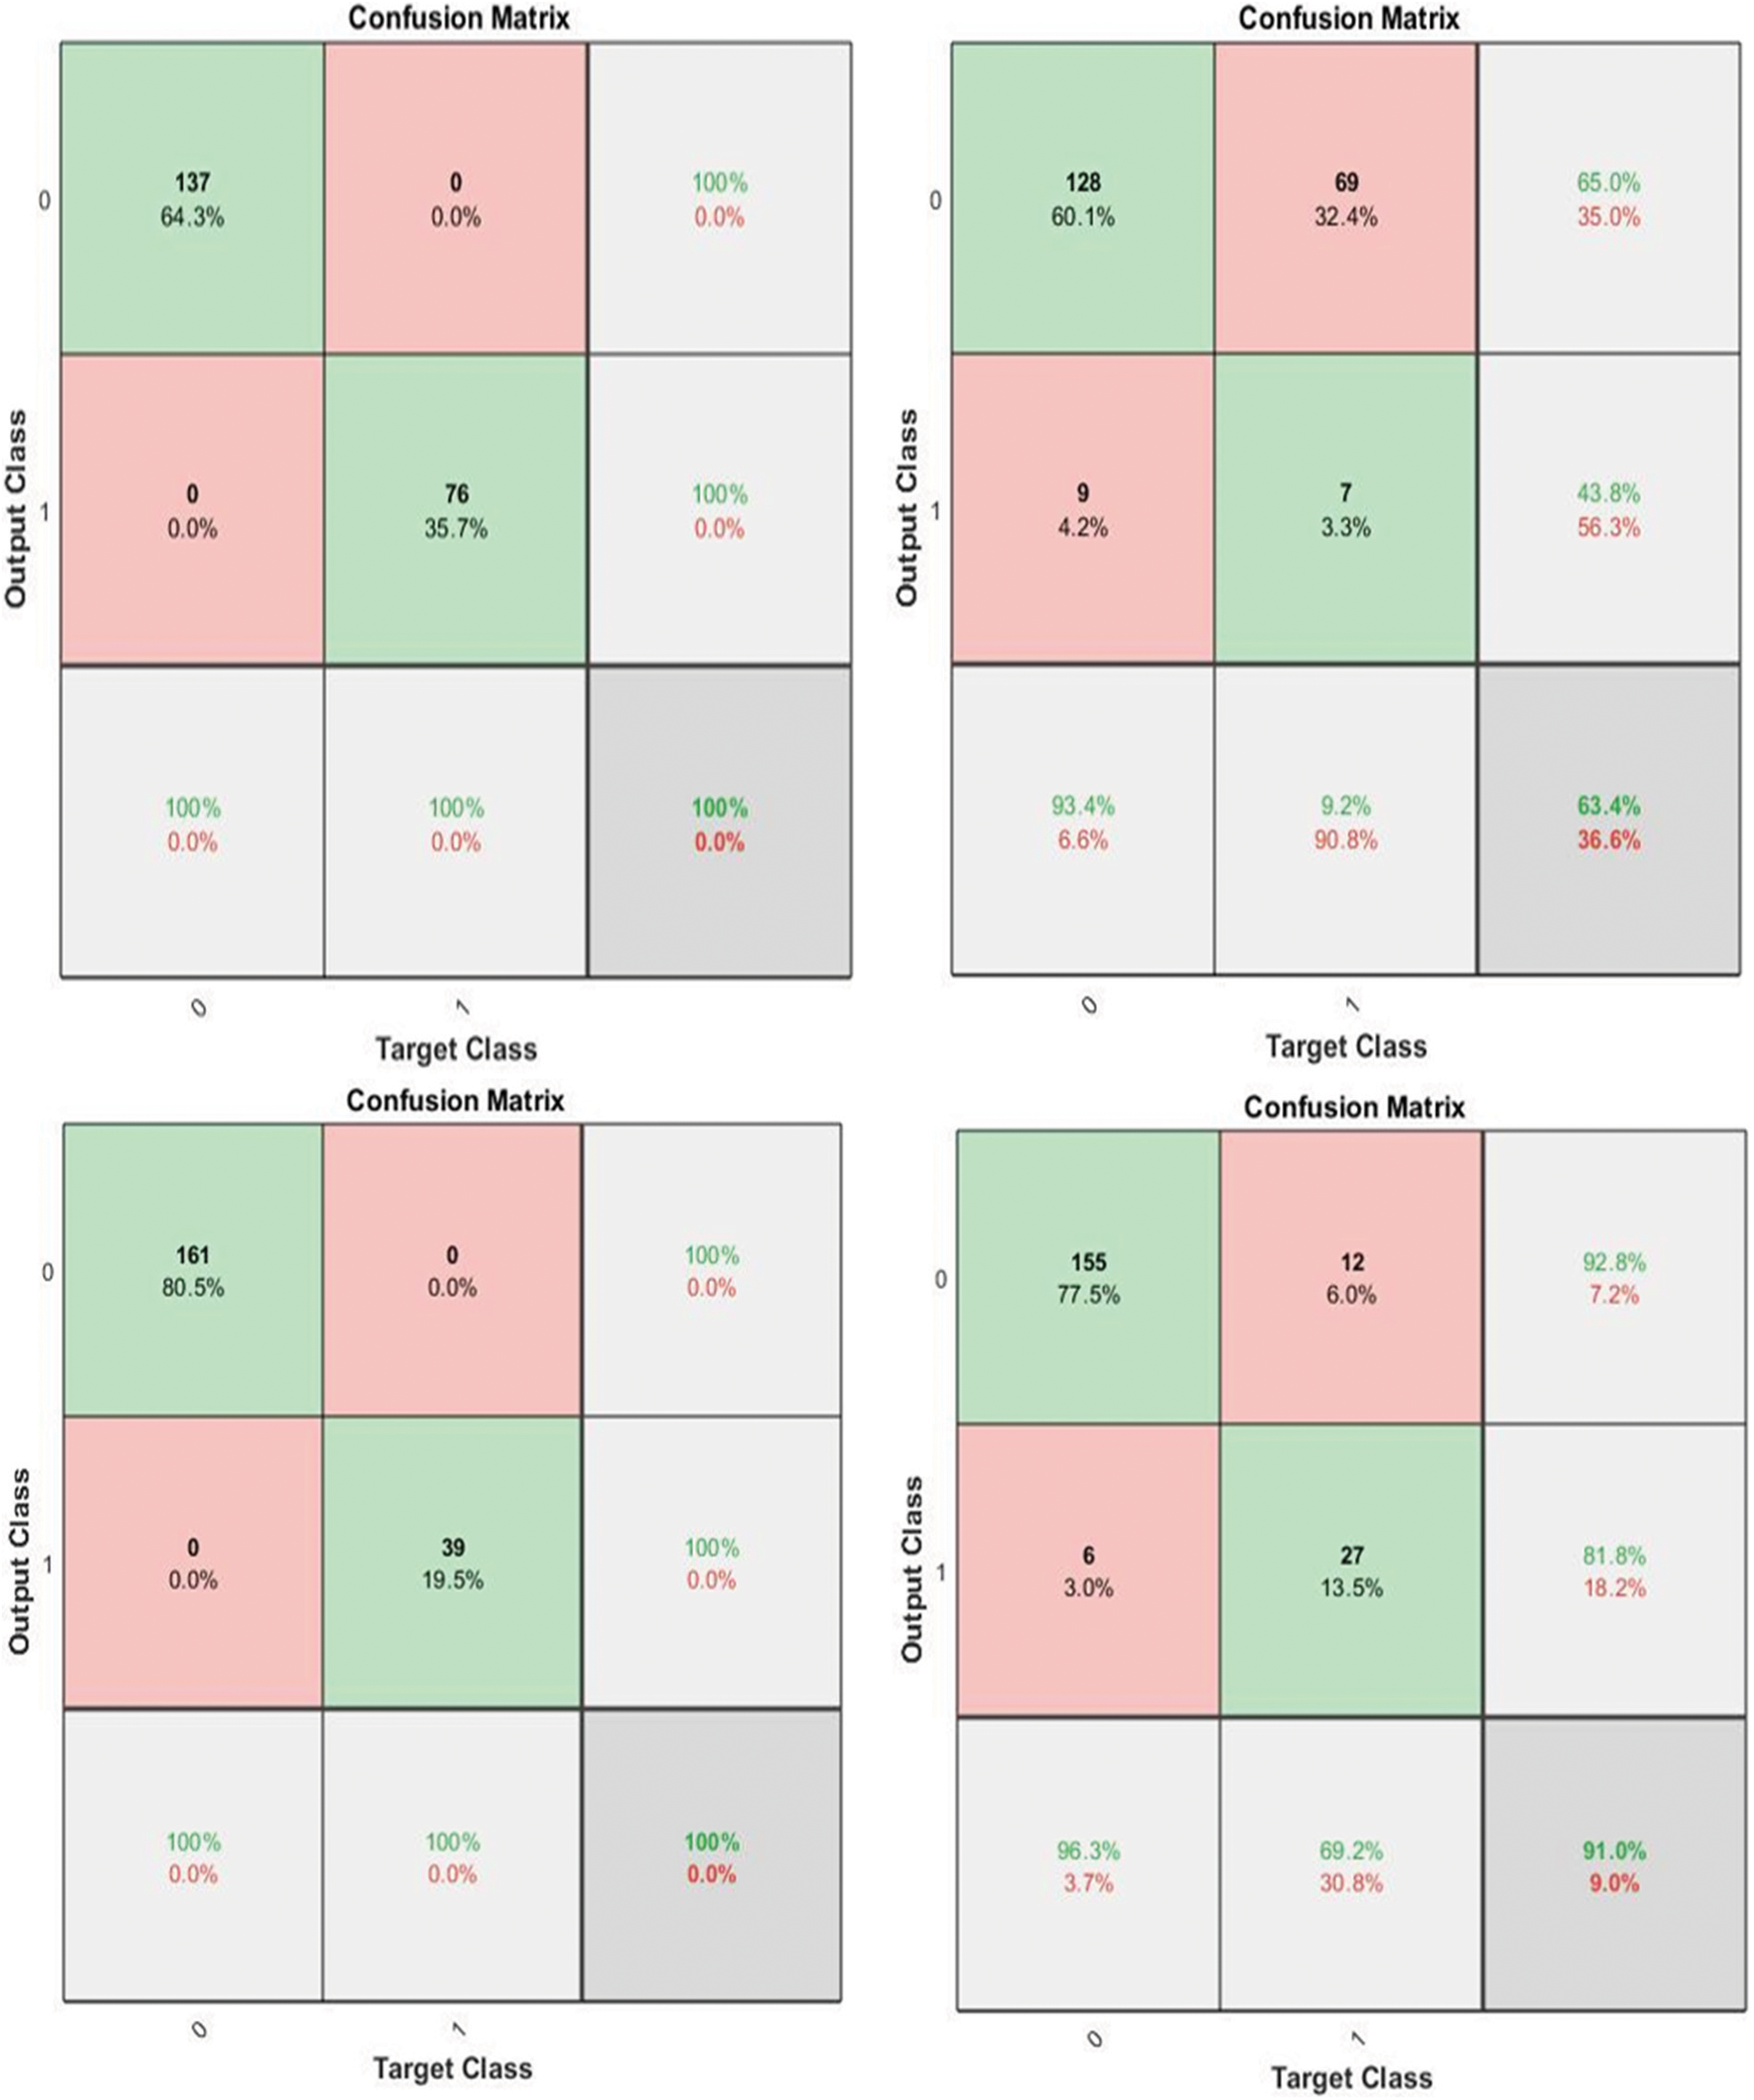
Figure 3: Sample of confusion matrix of the proposed method
The results using the classification scheme with the feature set SG, SC, and SGC are summarized in given Tab. 1 below.
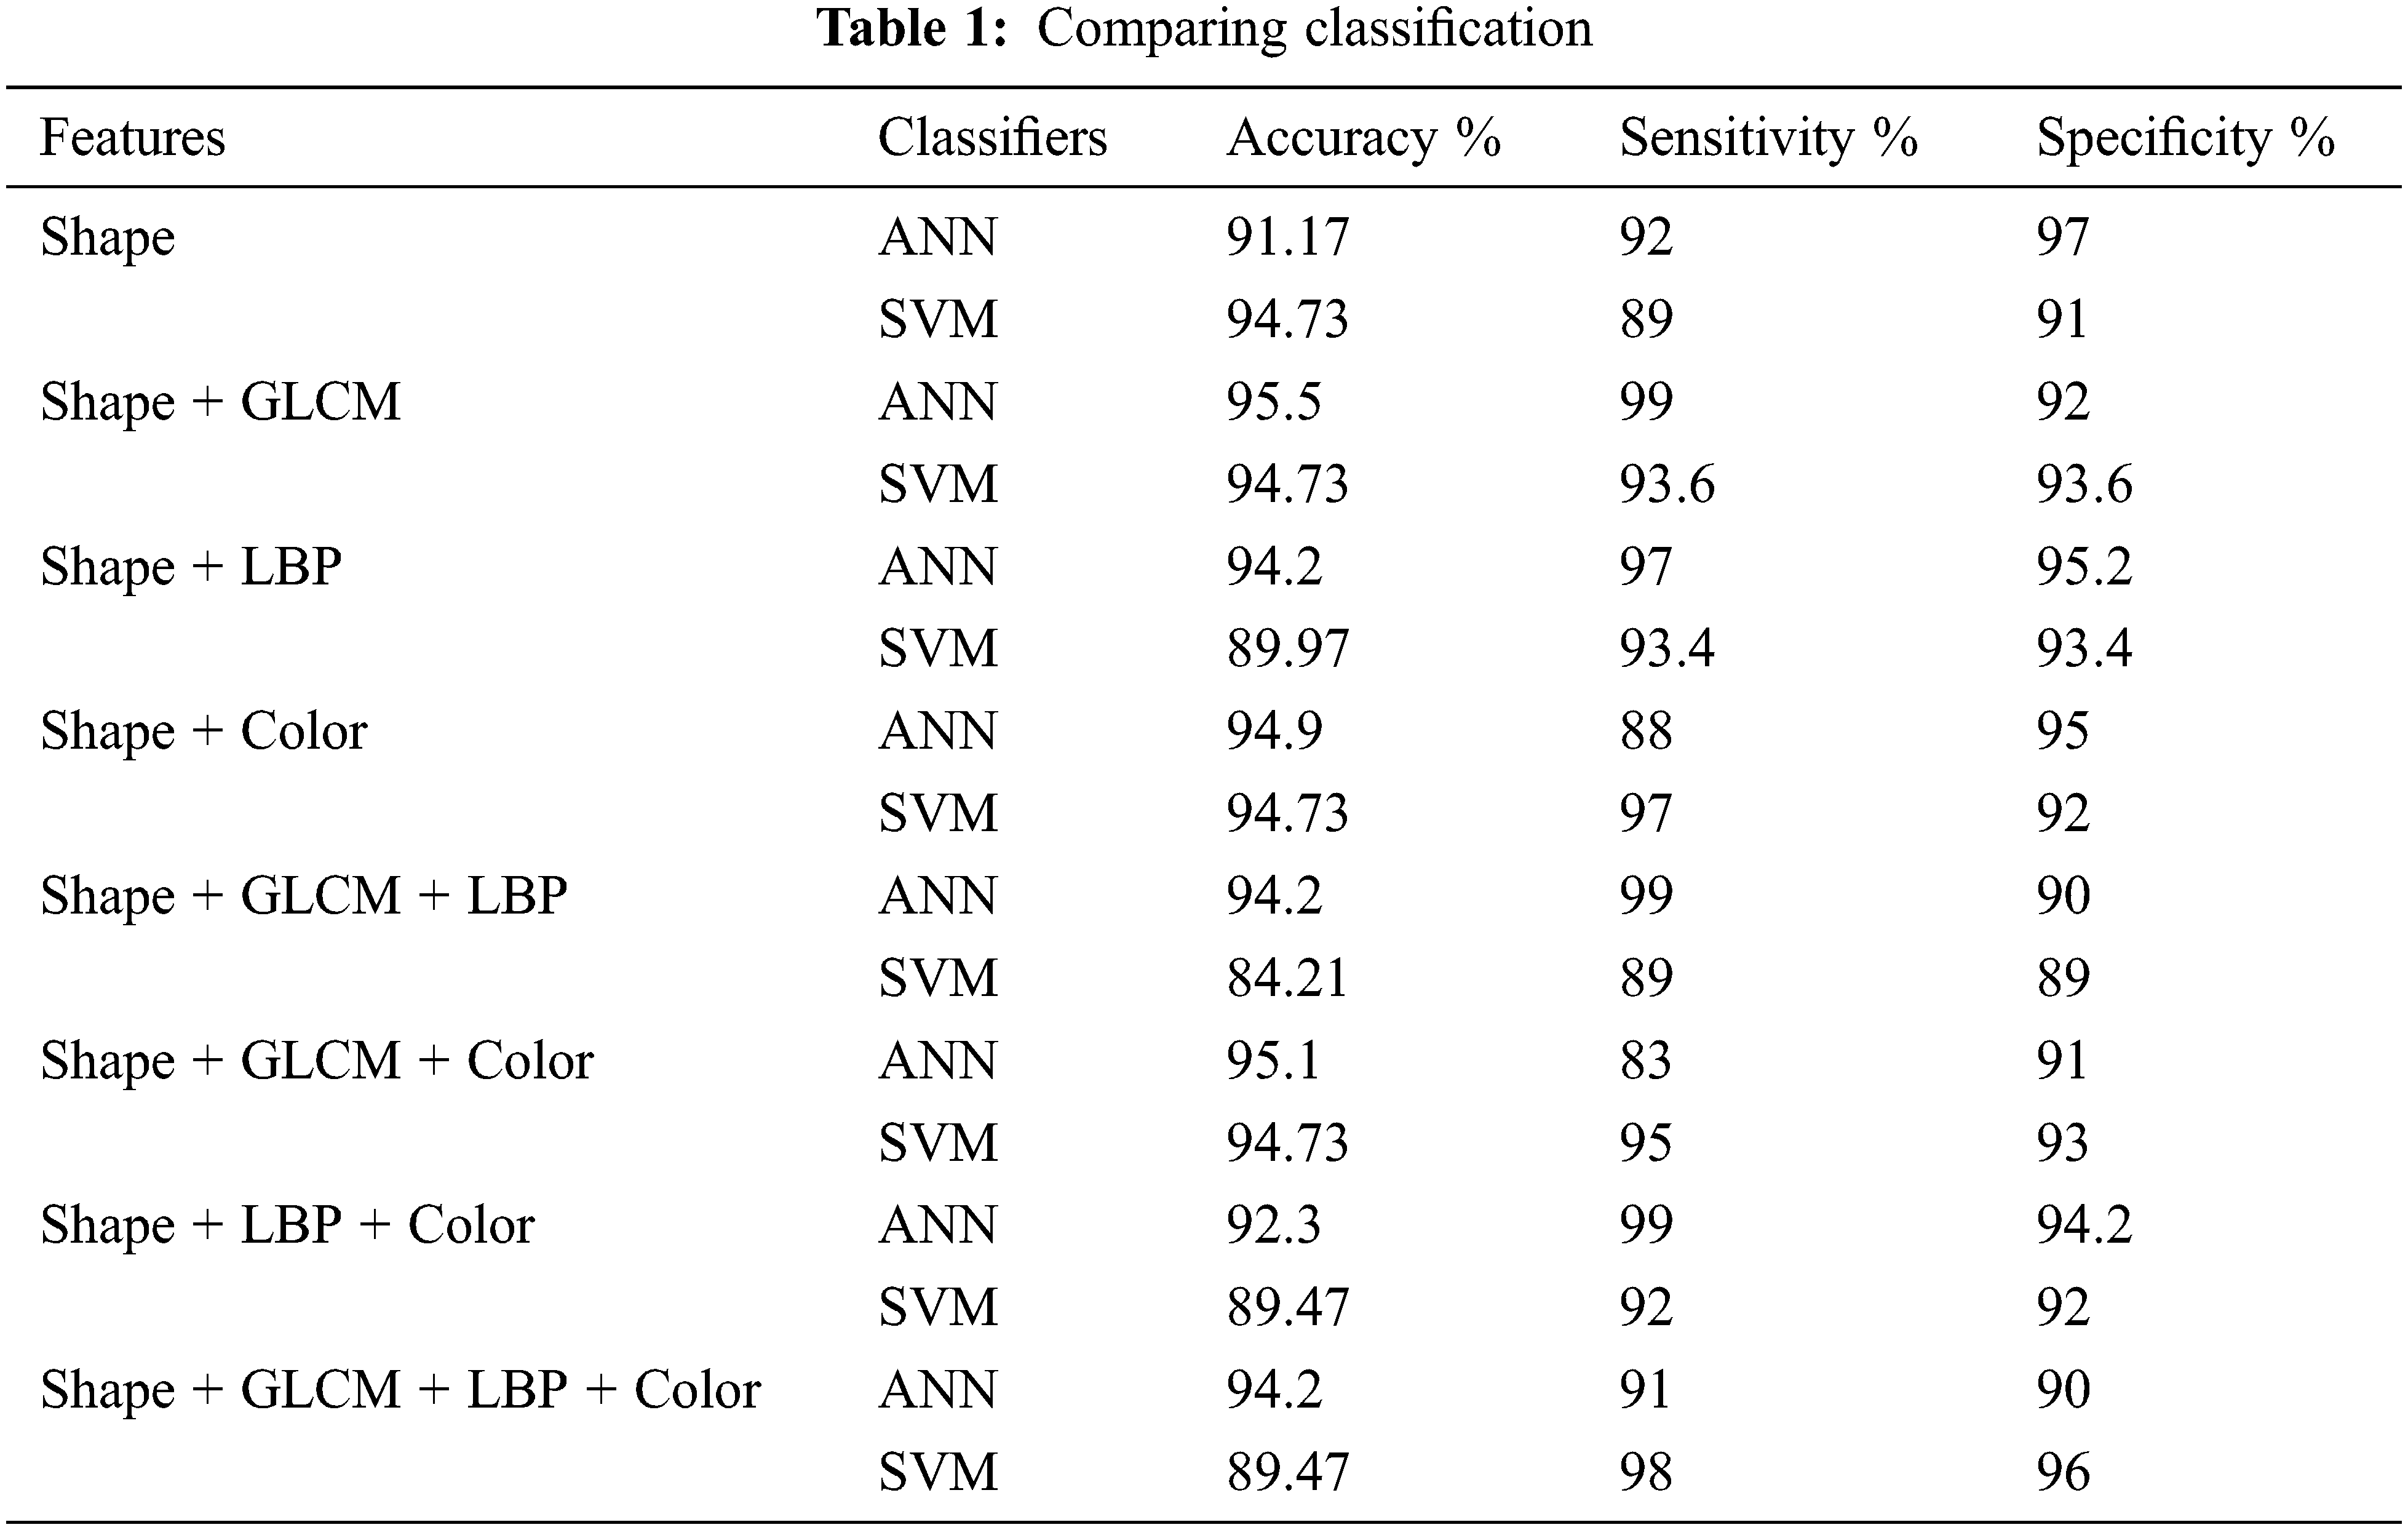
Tab. 2 shows the comparison of different feature sets using ANN and SVM classifiers. The graph shows a comparison of different features of dataset DermIS by using SVM and ANN classifier. On the leftmost side, shape features have been used and a comparison has been made by using ANN and SVM. It shows that accuracy is around 94.73% by using both classifiers but SVM shows better performance than ANN. Then different combinations of shapes with different features have been used to check the performance of both classifiers. First shape and GLCM have been combined and it shows that ANN performs better and shows 94.73% accuracy while SVM shows 92.2% [28].
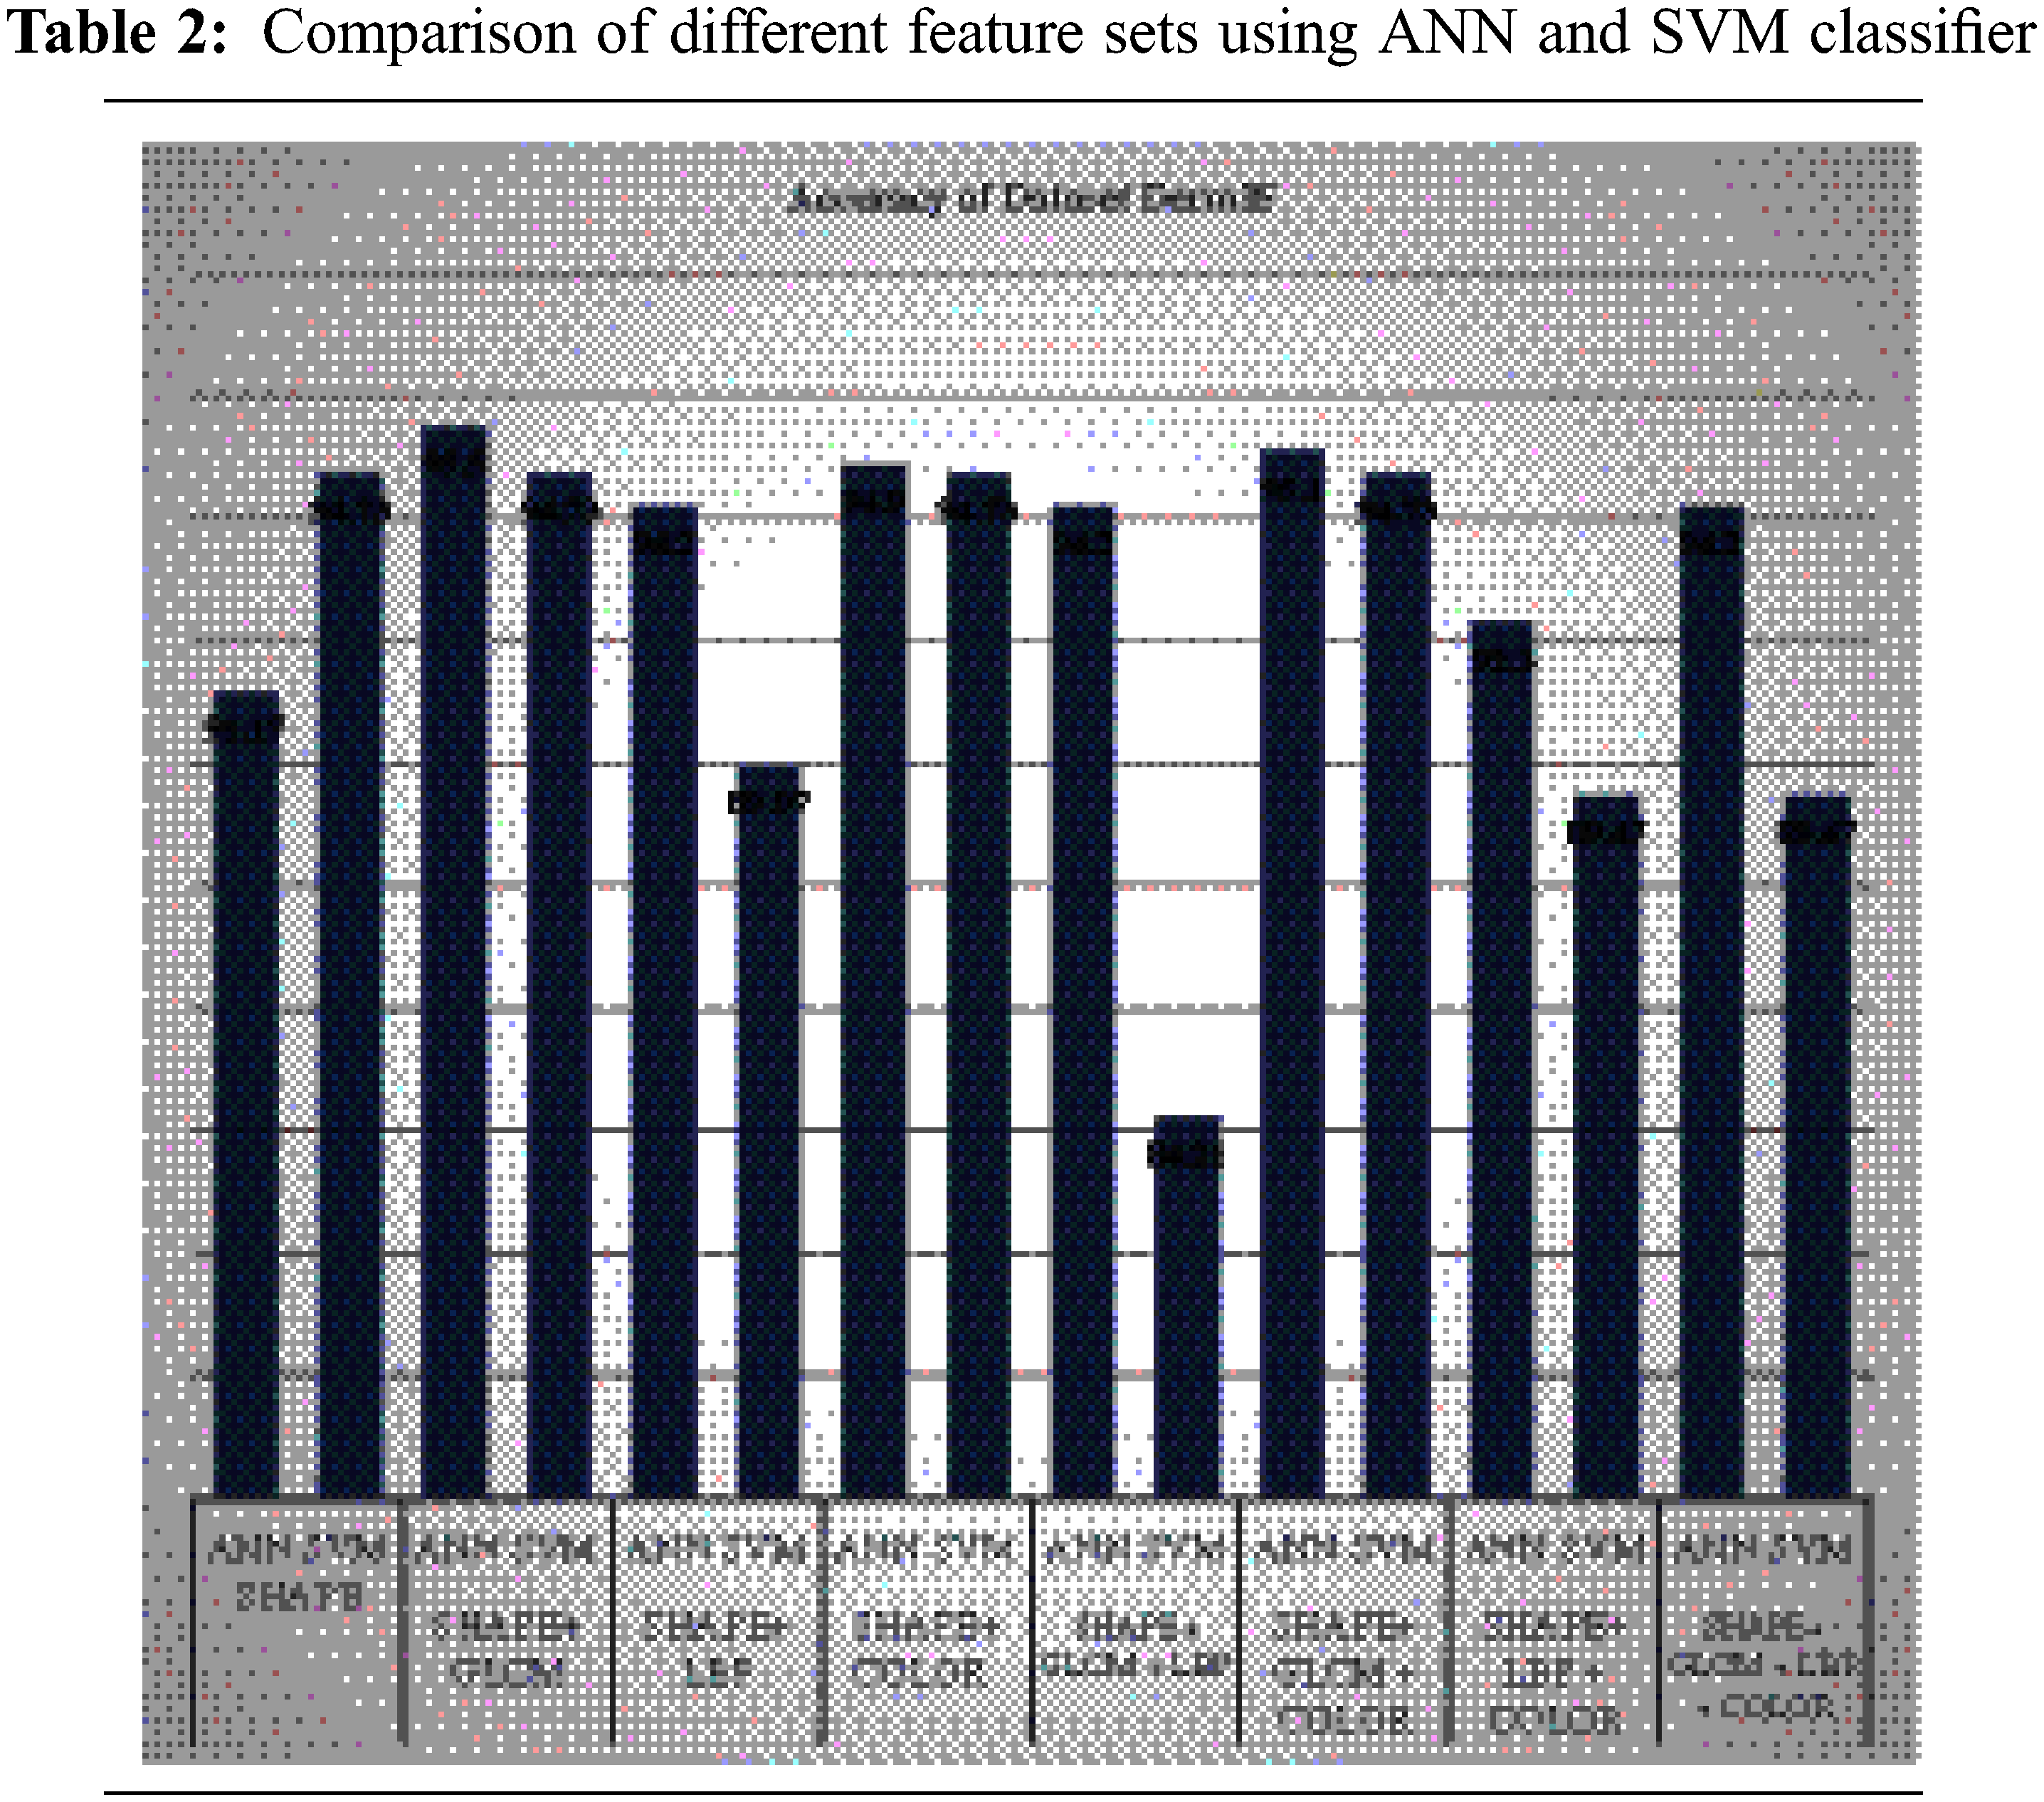
Then shape has been combined with LBP and ANN classifier shows 94.2% accuracy and SVM shows 89.97%. Later, shape and color features have been combined and tested. This combination also shows that ANN classifiers achieve 94.9% accuracy. After pairs combination, all three features types have been combined with GLCM and color and the ANN classifier shows 95.1% accuracy and SVM shows 94.73%. Later, shape with LBP and color features has been combined and tested [29].
The testing has been done and combined by using both classifiers. The first shape with GLCM and LBP has been combined and it shows that ANN performs better and shows 94.2% accuracy while SVM shows 84.21%.
This combination also shows that ANN classifiers achieve 92.3% accuracy. In the end, All features were combined and tested. All tests show that shape and LBP is the most important feature to identify skin lesion. Accuracy is the most important measure for enhancing the performance of features and classifiers.
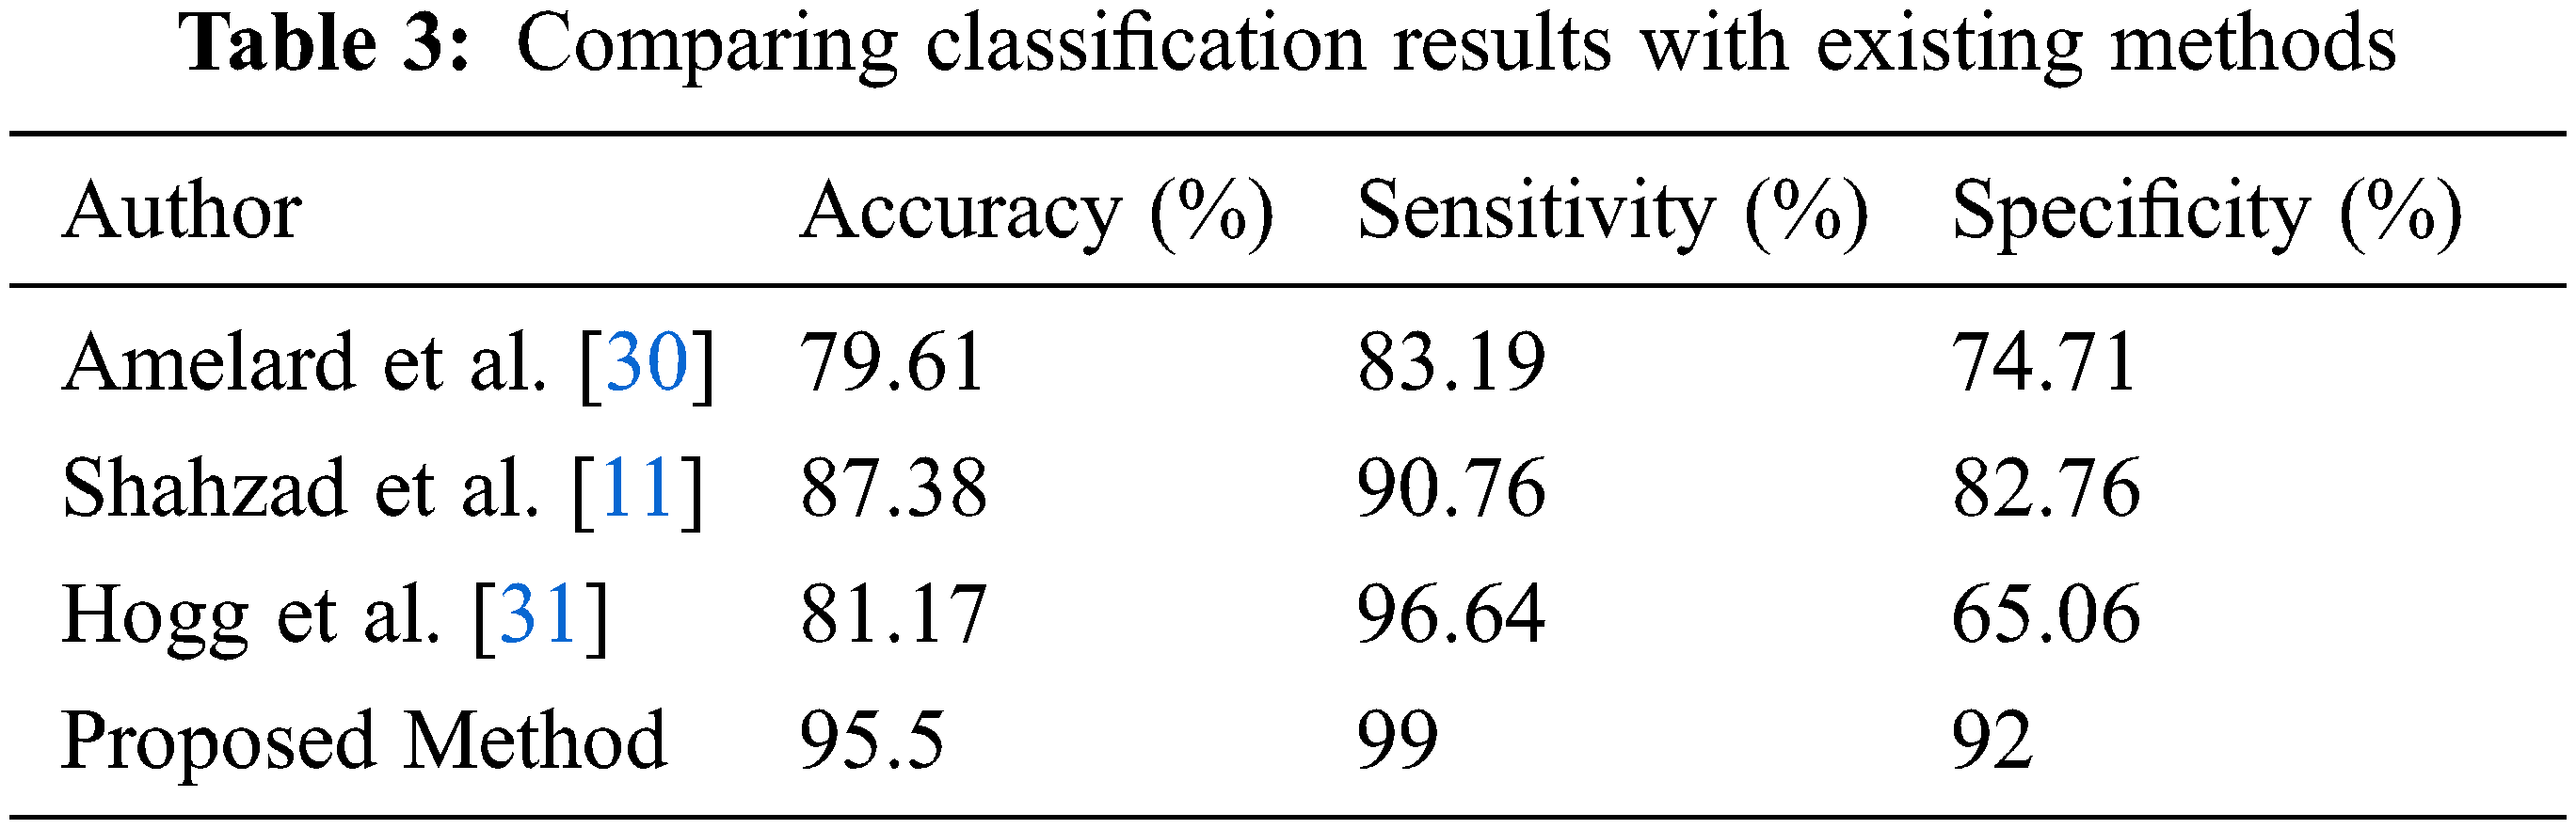
The comparison of classification results of the proposed method is compared with the existing method shown in Tab. 3. The accuracy in previous studies is calculated as 79.61%, 87.38%, and 81.17% respectively while 95.5% in the proposed method. Sensitivity is 99% while specificity is 92% which is higher than previous.
Color features also play an important role in improving classification. The shape also improves performance when combined with texture and color features. Shape features have been extracted from segmented images [32].
In this existing situation, data insufficient lead to a suboptimal outcome. A main difficulty at the existing stage is the fewer amount of skin lesion detection data globally available. Medical professionals might be taking the snaps of the lesion, but they keep it confidential only within their hospital, at this phase they concern with commercialization or privacy. For the static validation of the strong model, the heterogenous amount of dataset is required and applied to the decision-support system for training as well as testing. Extremely large heavy model validity achievement only be got when large datasets, especially in images of skin lesions, can obtain globally.
Insufficient data contribute to suboptimal outcomes in its current state. The limited amount of data available to the scientific community is a major hindrance to the current state of skin cancer detection research. Dermatologists may take pictures of skin lesions, but they may be limited to their clinic due to concerns about confidentiality or advertising. For the training and testing of these decision support systems, much larger data sets must be collected to ensure reliable models and statistical validity. This is particularly the case because the photographs are taken in unconstrained conditions, which results in extremely large differences in the information acquired [33].
Additionally, unfortunately, some product of existing data collection is present but unluckily at is final diagnosis at last stage melanoma. The prediction of melanoma diseases is linked with the stage in which it is analyzed and identified. Even there is worth in middles to last stage melanoma detection. But the early-stage diagnoses can ensure a better rate of survival. Again, data collection needs the priority to examine the validity and accuracy of the model/system.
Another unfortunate by-product of the current methods of data collection is that most of the photographs provided with a final diagnosis are melanoma of the late stage. The prognosis of melanoma patients is highly correlated with the stage of identification (and excision). While there is validity in the mid-to the late-stage diagnosis of melanoma, there should be a strong emphasis on early-stage diagnosis to ensure better survival rates. Once, the greatest need for data collection limits the verification of models of reliable structures.
This research work presents an automated and novel set of approaching techniques for the segmentation of dermoscopic images for the use of automated and intelligent techniques. Proper segmentation of skin cancer melanoma and subsequent diagnoses using automated Computer-aided design (CAD) systems is not only a trending research phenomenon but also an important necessity of modern times. This objective was met by developing techniques and combining them within one framework, which not only promised efficiency. But, also achieved better results than the existing solutions to this problem.
Three different types of features had been extracted to accomplish the classification of melanoma and non-melanoma. Features show robustness as well as incorporate scale and rotation invariance and it also showed the global information of the image. In the first phase, GLCM had been extracted at several stages, and local information through LBP on different scales as texture features. Because of that altering property of GLCM features and scale-invariant property of LBP, these features are robust. Both LBP and GLCM show texture in the images.
We have combined these both texture types and it shows promising results. These features are robust due to a scale-invariant property of LBP and rotation invariant property of GLCM features. Color is the most important factor based upon the lesion part can be differentiated. Therefore, it's most important to incorporate color information. Different color models have different characteristics. There is not a single model that is suitable for these datasets. Therefore, it was important to use different color models.
Each model has different channels and these channels have important characteristics thus we include all channels of these models. Global information of different colors channels had been combined by four different moment drawn out in six different color spaces Melanoma lesion part has a specific shape. To differentiate it, shape features are also important.
Thus, to extend the features of the lesions, the shape features of the lesion have been extracted from the segmented lesion. Thus, a fused hybrid texture local, color global, and shape features have been proposed to classify melanoma and non-melanoma. Experiments have shown that this fusion has achieved remarkably good results as compared to the performance of individual feature sets. The results are somehow good than several state-of-the-art existing methods, which point towards better segmentation.
Acknowledgement: The authors, acknowledge with thanks to DSR King Abdulaziz University, Jeddah, Saudi Arabia for technical and financial support.
Funding Statement: The authors received no specific funding for this study.
Conflicts of Interest: The authors declare that they have no conflicts of interest to report regarding the present study.
1. A. Sáez, B. Acha and C. Serrano, “Pattern analysis in dermoscopic images,” in Pro. Computer Vision Techniques for the Diagnosis of Skin Cancer, Berlin, Heidelberg, pp. 23–48, 2013. [Google Scholar]
2. Q. Abbas, M. Celebi, C. Serrano, I. F. García and G. Ma, “Pattern classification of dermoscopy images; A perceptually uniform model,” Pattern Recognition, vol. 46, no. 1, pp. 86–97, 2013. [Google Scholar]
3. A. Sáez, C. S. Mendoza, B. Acha and C. Serrano, “Development and evaluation of perceptually adapted color gradients,” Institution of Engineering and Technology Image Process, vol. 7, no. 4, pp. 355–363, 2013. [Google Scholar]
4. C. Barata, J. S. Marques and T. Mendonça, “Bag-of-features classification model for the diagnose of melanoma in dermoscopy images using color and texture descriptors,” in Proc. 10th Int. Conf. Image Analysis Recognition, Berlin, Heidelberg, pp. 547–555, 2013. [Google Scholar]
5. M. Ruela, C. Barata, T. Mendonca and J. S. Marques, “On the role of shape in the detection of melanomas,” in Proc. 8th Int. Sym. on Image and Signal Processing and Analysis (ISPA), Trieste, Italy, pp. 268–273, 2013. [Google Scholar]
6. M. Mubeen, M. W. Iqbal, M. Junaid, M. H. Sajjad, M. R. Naqvi et al., “Usability evaluation of pandemic health care mobile applications,” in Proc. Institute of Physics Publishing (IOP) Conf. Series: Earth and Environmental Science, Guangzhou, China, pp. 12041, 2021. [Google Scholar]
7. C. Barata, M. Ruela, M. Francisco, T. Mendonça and J. S. Marques, “Two systems for the detection of melanomas in dermoscopy images using texture and color features,” IEEE Systems Journal, vol. 8, no. 3, pp. 965–979, 2013. [Google Scholar]
8. N. Cheerla and D. Frazier, “Automatic melanoma detection using multi-stage neural networks,” International Journal of Innovative Research in Science Engineering and Technology, vol. 3, no. 2, pp. 9164–9183, 2014. [Google Scholar]
9. M. Sadeghi, P. Wighton, T. K. Lee, D. McLean, H. Lui et al., “Pigment network detection and analysis,” in Proc. Computer Vision Techniques for the Diagnosis of Skin Cancer, Berlin, Heidelberg, pp. 1–22, 2014. [Google Scholar]
10. C. Barata, M. Ruela, T. Mendonc and J. S. Marques, “A bag-of- features approach for the classification of melanomas in dermoscopy images the role of color and texture descriptors,” in Proc. Computer Vision Techniques for the Diagnosis of Skin Cancer, Berlin, Heidelberg, pp. 49–69, 2014. [Google Scholar]
11. S. K. Shahzad, D. Ahmed, M. R. Naqvi, M. T. Mushtaq, M. W. Iqbal et al., “Ontology driven smart health service integration,” Computer Methods and Programs in Biomedicine, vol. 207, no. 1, pp. 106146, 2021. [Google Scholar]
12. R. Amelard, A. Wong and D. Clausi, “Extracting high-level intuitive features (hlif) for classifying skin lesions using standard camera images,” in Proc. Ninth Conf. on Computer and Robot Vision, Toronto, Canada, pp. 396–403, 2012. [Google Scholar]
13. R. Amelard, A. Wong and D. A. Clausi, “Extracting morphological high-level intuitive features (hlif) for enhancing skin lesion classification,” in Proc. Annual International Conf. of the IEEE Engineering in Medicine and Biology Society, San Diego, California, pp. 4458–4461, 2012. [Google Scholar]
14. I. Feroz, N. Ahmad and M. W. Iqbal, “Usability based rating scale for mobile health applications,” in Proc. Int. Conf. on Engineering and Emerging Technologies (ICEET), Peshawar, Pakistan, pp. 1–7, 2019. [Google Scholar]
15. J. S. Marques, C. Barata and T. Mendonca, “On the role of texture and color in the classification of dermoscopy images,” in Proc. 34th Annual Int. Conf. of the IEEE EMBS, San Diego, United States, pp. 4402–4405, 2012. [Google Scholar]
16. S. Gerald, K. Bartosz, M. E. Celebi and H. Iyatomi, “Melanoma classification using dermoscopy imaging and ensemble learning,” in Proc. 2nd Asian Conf. on Pattern Recognition (IAPR), Okinawa, Japan, pp. 386–390, 2013. [Google Scholar]
17. E. Arif, S. K. Shahzad, R. Mustafa, M. A. Jaffar and M. W. Iqbal, “Deep neural networks for gun detection in public surveillance,” Intelligent Automation and Soft Computing, vol. 32, no. 2, pp. 909–922, 2022. [Google Scholar]
18. M. E. Celebi and A. Zornberg, “Automated qualification of clinically significant colors in dermoscopy images and its application to skin lesion classification,” IEEE Systems Journal, vol. 8, no. 3, pp. 980–984, 2014. [Google Scholar]
19. C. Barata, M. E. Celebi and J. S. Marques, “Improving dermoscopy image classification using color constancy,” IEEE Journal of Biomedical and Health Informatics, vol. 19, no. 3, pp. 1146–1152, 2015. [Google Scholar]
20. F. Riaz, A. Hassan, M. Y. Javed and M. T. Coimbra, “Detecting melanoma in dermocopy images using scale adaptive local binary patterns,” in Proc. 36th Int. Conf. of the IEEE on Engineering in Medicine and Biology Society (EMBC), Chicago, Illinois, pp. 6758–6761, 2014. [Google Scholar]
21. M. Malik, M. W. Iqbal, S. K. Shahzad, M. T. Mushtaq, M. R. Naqvi et al., “Determination of covid-19 patients using machine learning algorithms,” Intelligent Automation and Soft Computing, vol. 31, no. 1, pp. 207–222, 2022. [Google Scholar]
22. L. Bi, J. Kim, E. Ahn, D. Feng and M. Fulham, “Automatic melanoma detection via multi-scale lesion-based representation and joint reverse classification,” in Proc. 13th Int. Sym. on Biomedical Imaging (ISBI), Prague, Czech Republic, pp. 1055–1058, 2016. [Google Scholar]
23. M. A. Marchetti, N. C. Codella, S. W. Dusza, D. A. Gutman, B. Helba et al., “Results of the 2016 international skin imaging collaboration international symposium on biomedical imaging challenge: Comparison of the accuracy of computer algorithms to dermatologists for the diagnosis of melanoma from dermoscopic images,” Journal of the American Academy of Dermatology, vol. 78, no. 2, pp. 270–277, 2018. [Google Scholar]
24. N. C. Codella, Q. B. Nguyen, S. Pankanti, D. A. Gutman, B. Helba et al., “Deep learning ensembles for melanoma recognition in dermoscopy images,” IBM Journal of Research and Development, vol. 61, no. 4/5, pp. 1–5, 2017. [Google Scholar]
25. A. Esteva, B. Kuprel, R. A. Novoa, J. Ko, S. M. Swetter et al., “Dermatologist-level classification of skin cancer with deep neural networks,” Nature, vol. 542, no. 7639, pp. 115–118, 2017. [Google Scholar]
26. Z. Li, X. Zhang, H. Müller and S. Zhang, “Large-scale retrieval for medical image analytics a comprehensive review,” Medical Image Analysis, vol. 43, no. 1, pp. 66–84, 2018. [Google Scholar]
27. B. Zhou, A. Khosla, A. Lapedriza, A. Oliva and A. Torralba, “Learning deep features for discriminative localization,” in Proc. IEEE Conf. on Computer Vision and Pattern Recognition, Las Vegas, USA, pp. 2921–2929, 2016. [Google Scholar]
28. D. Ahmed, M. W. Iqbal, S. K. Shahzad, M. R. Naqvi and F. Muneer, “Smart health architecture integration model,” in Proc. 1st Int. Conf. on Healthcare computing Systems and Technologies (CHEST), Birjand, Iran, pp. 1–7, 2019. [Google Scholar]
29. N. C. Codella, D. Gutman, M. E. Celebi, B. Helba, M. A. Marchetti et al., “Skin lesion analysis toward melanoma detection: A challenge at the 2017 international symposium on biomedical imaging (isbihosted by the international skin imaging collaboration (isic),” in Proc. IEEE 15th Int. Sym. on Biomedical Imaging, Washington, USA, pp. 168–172, 2018. [Google Scholar]
30. R. Amelard, J. Glaister, A. Wong and D. A. Clausi, “High-level intuitive features (hlifs) for intuitive skin lesion description,” Biomedical Engineering IEEE Transactions, vol. 62, no. 3, pp. 820–831, 2015. [Google Scholar]
31. P. Hogg, P. Rooney, E. Ingham and J. N. Kearney, “Development of a decellularised dermis,” Cell and Tissue Banking, vol. 14, no. 3, pp. 465–474, 2013. [Google Scholar]
32. X. R. Zhang, X. Sun, W. Sun, T. Xu and P. P. Wang, “Deformation expression of soft tissue based on BP neural network,” Intelligent Automation & Soft Computing, vol. 32, no. 2, pp. 1041–1053, 2022. [Google Scholar]
33. P. Yang, G. Liu, X. Li, L. Qin and X. Liu, “An intelligent tumors coding method based on drools,” Journal of New Media, vol. 2, no. 3, pp. 111–119, 2020. [Google Scholar]
 | This work is licensed under a Creative Commons Attribution 4.0 International License, which permits unrestricted use, distribution, and reproduction in any medium, provided the original work is properly cited. |