DOI:10.32604/iasc.2023.029598
| Intelligent Automation & Soft Computing DOI:10.32604/iasc.2023.029598 | |
| Article |
Human Fatty Liver Monitoring Using Nano Sensor and IoMT
1Department of Electrical and Electronics Engineering, Saveetha Engineering College, Chennai, 602105, India.
2Department of Computer Science and Engineering, Aalim Muhammed Salegh College of Engineering, Chennai, 600055, India.
3Department of Physics, Saveetha Engineering College, Chennai, 602105, India.
4Department of Medical Gastroentrology, SRM Medical College Hospital and Research Centre, Chennai, 603203, India.
*Corresponding Author: Srilekha Muthukaruppankaruppiah. Email: srilekha.mk@gmail.com
Received: 07 March 2022; Accepted: 19 April 2022
Abstract: Malfunction of human liver happens due to non-alcoholic fatty liver. Fatty liver measurement is used for grading hepatic steatosis, fibrosis and cirrhosis. The various imaging techniques for measuring fatty liver are Magnetic Resonance Imaging, Ultrasound and Computed Tomography. Imaging modalities lead to the exposure of harmful radiation of electromagnetic waves because of frequent measurement. The continuous monitoring of fatty liver is never achieved through imaging techniques. In this paper, the human fatty liver measured through a Fatty Liver Sensor (FLS). The continuous monitoring of the fatty liver is achieved through the FLS. FLS is fabricated through the screen-printing with materials such as graphene and polyacrylic. The fatty liver sensor is placed around the liver surface for continuous measuring fatty liver. The signal acquired from the fatty liver sensor is processed using blind source separation, a filtering technique removes the random noise from the acquired signal. The denoised signal is processed with tunable Q wavelet transform (TQWT), of FLS based fatty liver measurement fatty liver signals. The continuous fatty liver volume measured and analysis are performed through Long-short term memory and internet of medical things (IoMT). The experimental results are validated with ultrasound lab values.
Keywords: Fatty liver sensor; ultrasound; tunable Q wavelet transform; non-alcoholic fatty liver disease; long short-term memory
Liver does the major activities such as produce bile juice creation, blood filtration, glucose storage, increases digestion process, protein production for blood plasma, removes the harmful chemicals in the body [1]. Liver renders the necessary elements such as cholesterol and lipids, which helps cells to perform functional operations for human body. In hepatocytes cytoplasm, triglyceride accumulation characterizes the fatty liver disease. The fatty liver affects the process of protein production and nutrients in humans. The fatty liver leads to insulin resistance, obesity and increase the risk factors of the cardiovascular [2]. The untreated fatty liver leads to chronic hepatocellular injury, which leads to Non-alcoholic steatohepatitis. The common disorders associated with liver are viral hepatitis, liver tumor, liver abscess.
Fatty liver is classified as alcoholic and non-alcoholic fatty liver. Non-alcoholic fatty liver disease is associated with cirrhosis, hepatocellular carcinoma, heart failure, stroke, and myocardial infarction [3]. The fatty liver occurs because of chronic diseases that affect the human body metabolism, such as hypertension, obesity and Type 2 diabetes [4]. Nonalcoholic fatty liver disease leads to increased aminotransferase levels, which are related to ischemic stroke [5]. The various stages in fatty liver are shown in Fig. 1.

Figure 1: Fatty liver stages
Liver biopsy is considered as the best method for assessment of fatty liver, internal bleeding is the major complication in the above method. Non-invasive methods are used to detect fatty liver. Non-invasive techniques include computer tomography (CT), magnetic resonance imaging (MRI), ultrasonography (US), transient elastography (TE), and acoustic radiation force impulse (ARFI). CT is used for qualitative diagnosis of severe steatosis. However, harmful radiation of CT alters the liver attenuation. MRI is used for signal fat measurement. This is an expensive technique and never widely used. The US is widely used method for detection of severe steatosis. Transient elastography is used for liver stiffness measurement. In TE, an ultrasound transducer probe mounted with a vibrator produces shear waves that propagate through the liver tissues, which is used to study liver stiffness. Acoustic radiation force impulse imaging (ARFII) is a new technique that delves into the region of interest (ROI) through experimenting with real-time B-mode imaging. ROI of the liver tissue is automatically excited using an acoustic frequency of 2.67 MHz. The advantages of FLS are continuous monitoring is achieved through this sensor. Mutations happens in glucocerebrosidase gene and reduces the activity of beta-glucocerebrosidase in cells. The glucocerebroside is never broken properly and substance build white blood cells called macrophages and later becomes gaucher cells in the liver. Liver and spleen are enlarged and cells enters to other organs. More damage in gaucher cells leads to fibrosis, hepatic steatosis and cirrhosis. To prevent the next stages of fatty liver continuous monitoring of fatty liver is required. The excessive level of liver enzyme leads to the damage of liver and inflammation. To avoid these inflammations continuous monitoring of liver is required.
In this paper, human fatty liver is measured using a fatty liver sensor. FLS allows for continuous monitoring of the fatty liver. This fatty liver sensor is made using a screen-printing technique, and some of the materials used are graphene and polyacrylic. The fatty liver sensor can be placed around the lower chest and over the liver surface for testing.
Fatty liver disease steatosis and fibrosis are detected through fibroscan detection, which estimates liver stiffness as a controlled attenuation parameter [6]. However, fibroscan uses liver biopsy as the reference value for detection of fatty liver. The techniques such as ultrasound and magnetic resonance imaging detect hepatic steatosis through the reference calculation obtained during proton density fat fraction [7]. The relative stiffness between hepatic lesion and parenchyma detected using computed tomography. Fibrosis is measured through transient elastography. Further fibrosis liver fibroscan measures a small portion of the liver surface. The fatty liver detection through fibroscan leads to the overlapping of regions in fibroscan and leads to the mosaic in the image. Moreover, artifacts arise in ultrasound images due to the air bubble present of the biliary tree in the liver.
The artifact in the ultrasound was removed through preliminary correction before ultrasound scanning. However, ultrasound method of fatty liver is a standard method for prognosis and needs non-invasive methods. The non-invasive fatty liver measurement needs to be correlated with other non-invasive measuring parameters such as hemoglobin, blood pressure, and blood sugar levels. Moreover, the variation in diabetic patient needs to be analyzed based on the physical parameter. Among the above methods, fatty liver measurement leads to a more efficient method for digestive system analysis. The continuous monitoring of fatty liver is achieved through the fatty liver sensor and adverse drug effect can be monitored.
• To measure the dielectric property of fatty liver through inhale and exhale technique-using FLS, the inhale leads to variation in liver stiffness tissues and exhale leads to the inhomogeneous fat distribution in the liver.
• To measure, the fatty liver volume measured through blind source separation and differentiates the liver and fat.
• To measure, fatty liver volume from digitized signals of the liver, non-negative matrix filters, extract fat signals. Fat signal instantaneous frequency and energy obtained using tunable Q wavelet transform and correlates with lab values. Long short-term memory process is used for Fatty Liver prediction.
• To validate, the proposed FLS method of fatty liver volume measurement compared with ultrasound liver values measurement.
FLS is fabricated with graphene and polyvinyl material. The fabric has an adjustable band and fit on the human liver. The size of the fabric is 15 cm × 10 cm and the thickness is of 3 cm. The fabric is coated with graphene ink using the screen-printing technique purchased from DYCOTEC materials DM-GRA-9101S. The graphene ink offers high electrical and thermal conductivity. In addition, ink offers high stability due to inert behavior to chemical attacks and provides high mechanical strength and high smoothness. Fig. 2 shows the screen-printing technique for developing the FLS.
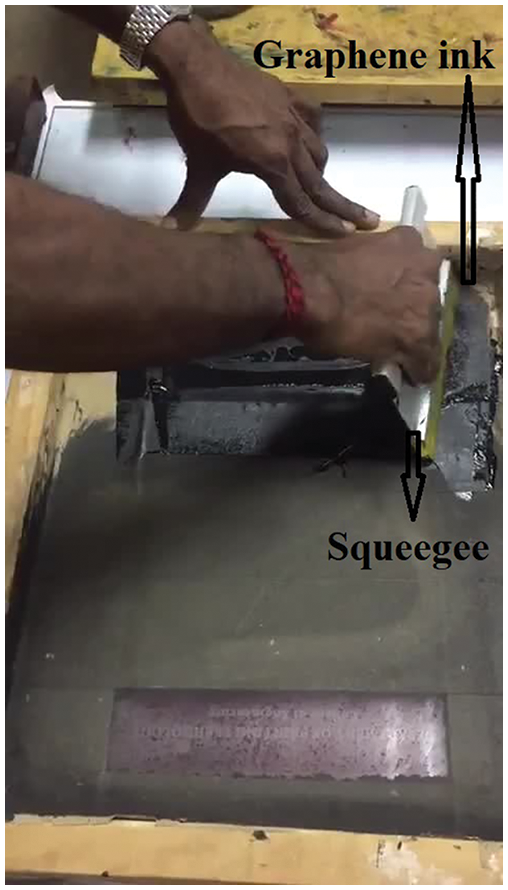
Figure 2: Screen-printing of fatty liver sensor
4.2 Fabrication of Fatty Liver Sensor
Screen-printing includes the modification of graphene ink from a stenciled mesh into fabric. Furthermore, processes the graphene ink inside the mesh, which fills the open area. However, the mesh can be in contacted with the substrate by a downward force. Finally, mesh can be pulled vertically and the ink will develop as a filament that happens because of cohesive force and leads into substrate deposition [8]. The final stage involves the ink adhesion on the substrate, the extension of ink is pulled vertically, and flows into the filament structure.
The cylindrical polar coordinate based stokes equation provides the flow of the ink as an analytical model and explains the transfer of ink during screen-printing [9].
where r is the radius and
The characterization of the sensor was performed using scanning electron microscope (SEM) instrument model Thermoscientific Apreo S and XRD X-ray Diffraction. The morphology of the sensor was performed using scanning electron microscope shown in Fig. 3. SEM is integrated with a material tester to investigate the mechanical behavior of graphene-coated fabric [10]. The mechanical behavior was recorded during the tensile process and evaluated for coating surface quality. The graphene has a greater percentage of 60% and a net count of 5823. The next element is oxygen, whose weight percentage is 35% and net count is 7143. The other elements present in FLS are magnesium, sodium, and silicon. The high percentage level of carbon is responsible for acquiring the electromagnetic signal from the fatty liver.
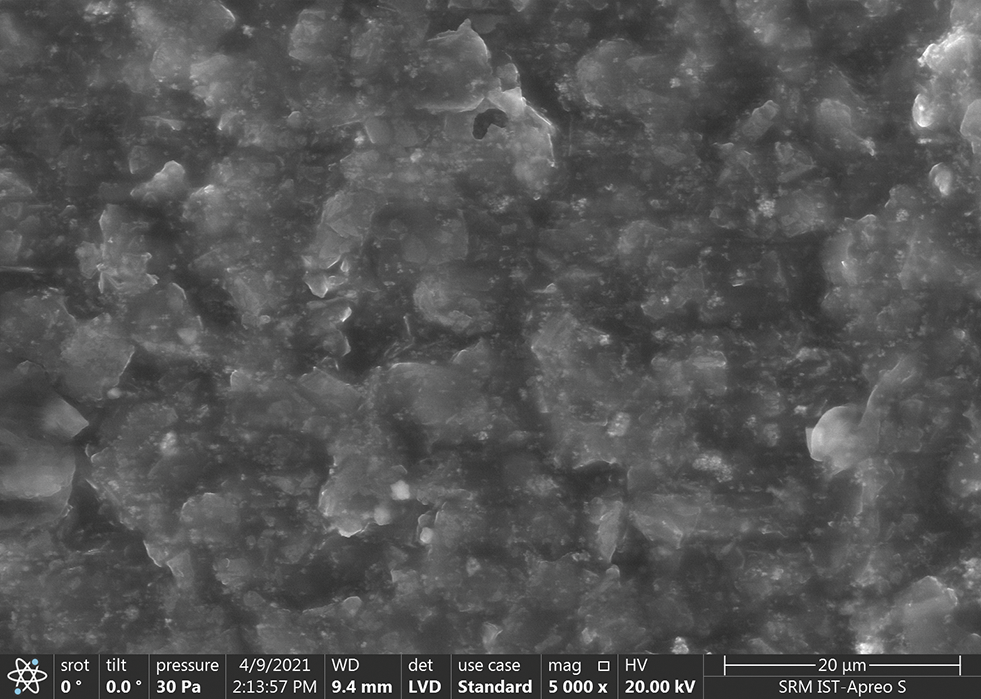
Figure 3: SEM of fatty liver sensor
X-ray diffraction XRD is performed on the FLS through an X-ray diffractometer (D8 ADVANCE) [11]. It uses CuKα radiation with λ = .154 nm 30 KV and 30 mA and estimate signal arrival, absorb the liver’s radiation. The scanning rate is maintained at 10 s-1 over 2θ range. The diffraction curve of the fabric shows the peak at 26.80.
The FLS is tested on the human body. The fatty liver signals are acquired through inhaling and exhaling conditions. The signal is acquired when the person inhales, leading to liver deformation. The liver deformation is related to the position of the diaphragm in breathing. The liver deformation is measured through the fatty liver sensor. The liver deformation is based on inhaling and exhaling. Furthermore, liver deformation alters liver deformation. The output voltage increases when the patient inhales.
The fatty liver sensor signal is through data acquisition system. The fatty liver signal is acquired through two leads present in the FLS. The FLS is placed on the patient, and electromagnetic signal is acquired through the sensor. The proposed fatty liver sensor is used to measure fibrosis and cirrhosis measurement. The monitoring of fatty liver is shown in Fig. 4. The fatty liver monitoring system consists of fatty liver sensor, signal conditioning circuit, Node MCU internet of things, and the signal are stored in a personal computer for analysis. Data acquisition has analog to digital converter. The USB card is connected to the fabric and records the electromagnetic signals coming out from the fatty liver. The electromagnetic variation in the fatty liver is converted into an electrical signal through the two leads present in the FLS. The signal conditioning circuit consists of a signal amplifier. The signal amplifier AD620 is of high gain instrumentation amplifier and a low power of 1.3 mA integrator circuit. However, the analog signal from the sensor is converted signal to a digital signal using analog to digital converter. The signal is acquired during inhale and exhale conditions to measure liver deformation.
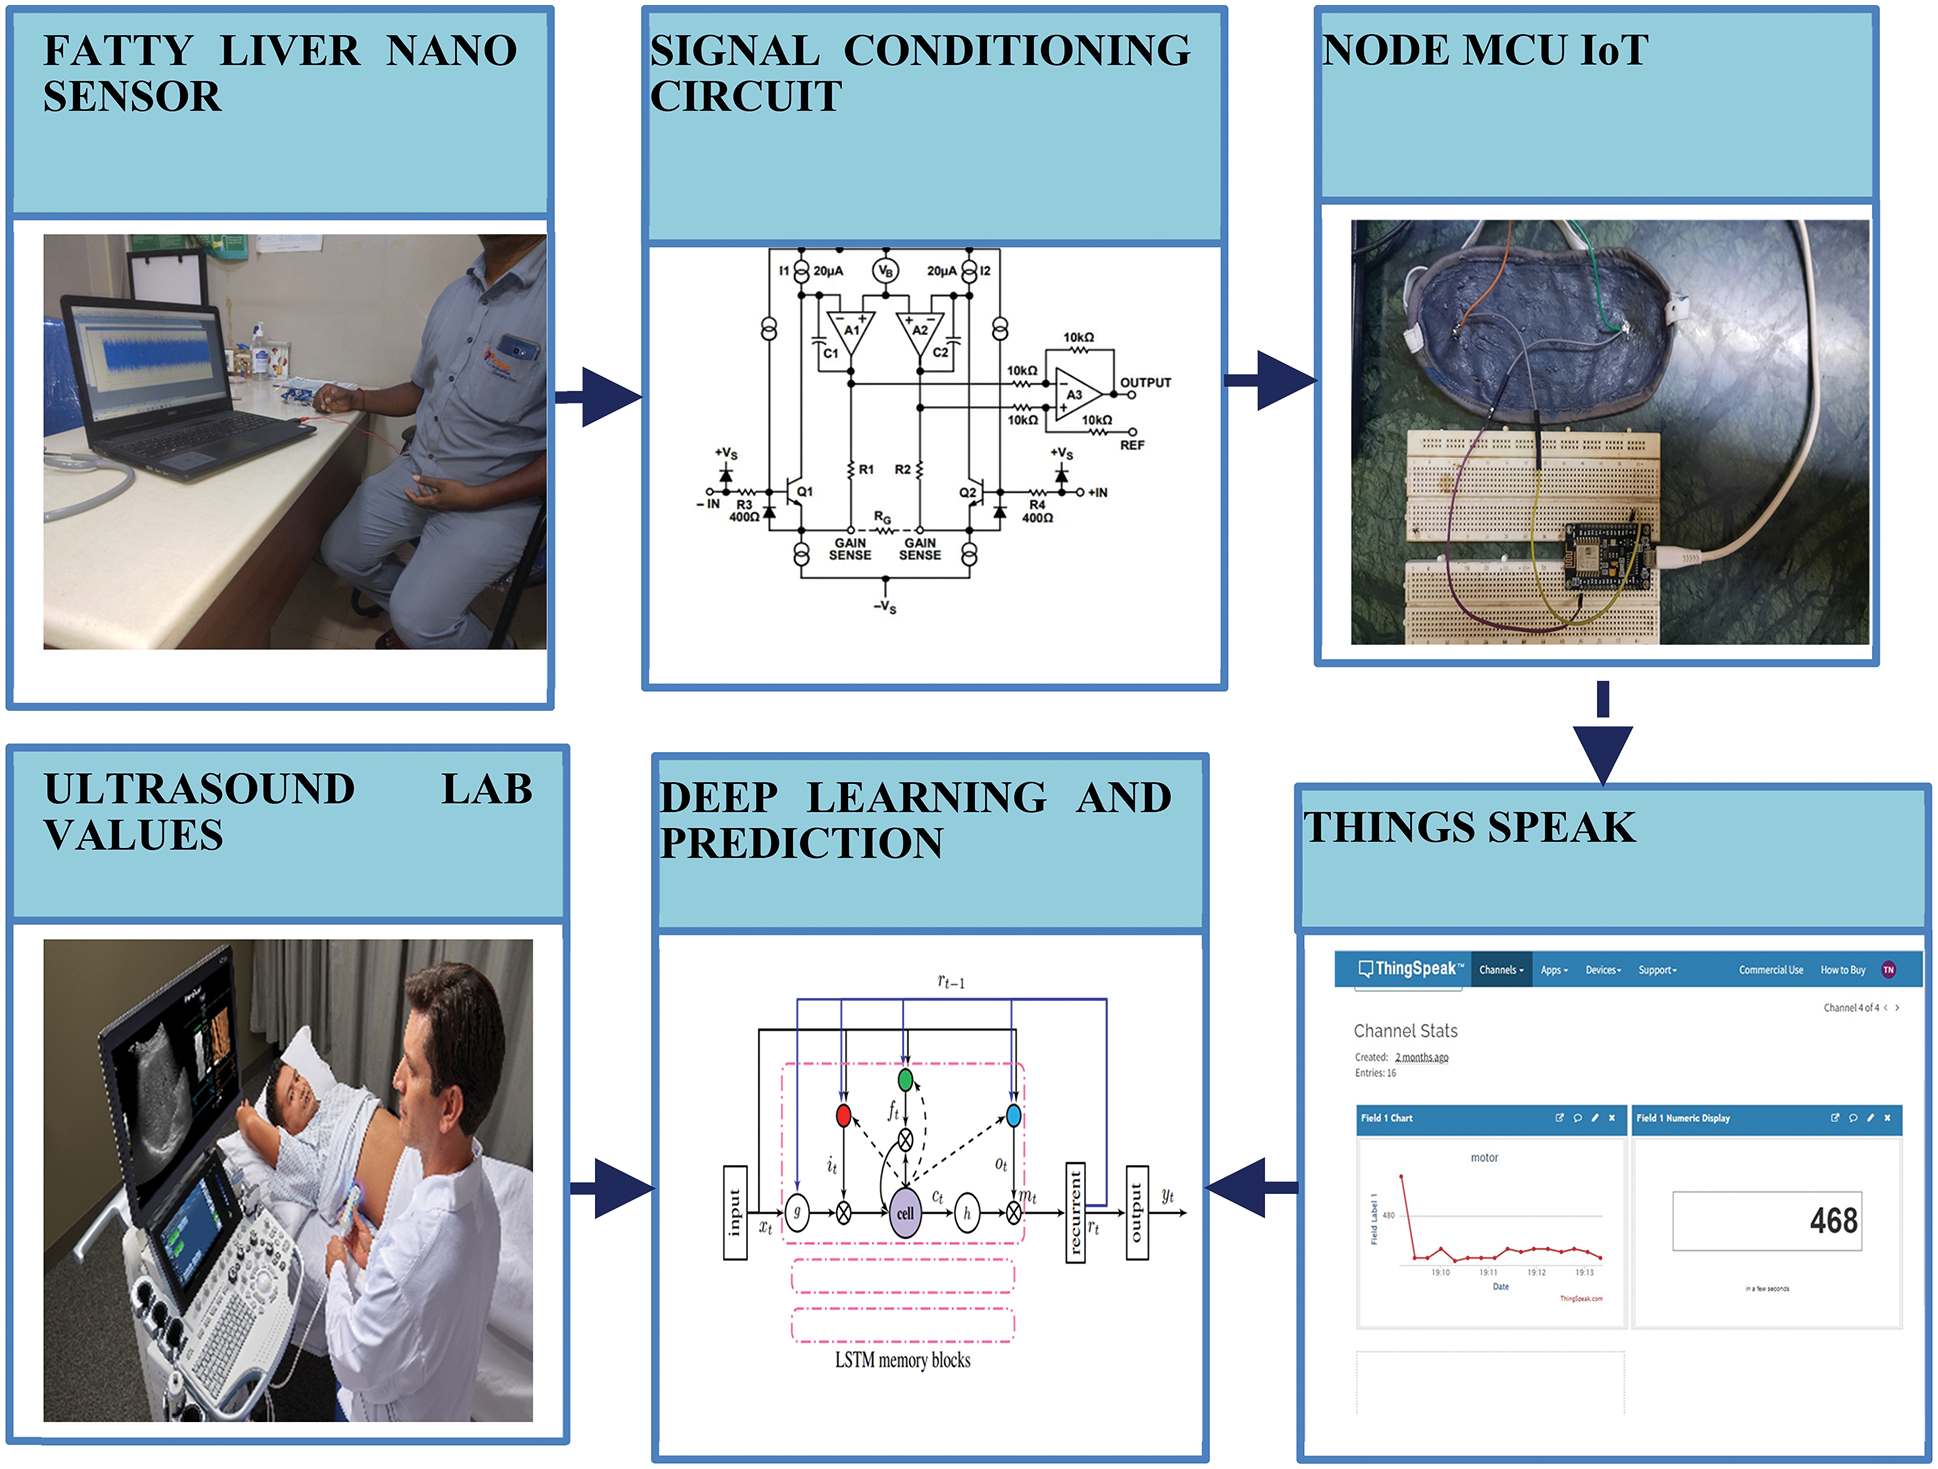
Figure 4: Fatty liver monitoring system
The data received from signal conditioning circuit over the serial bus is processed using ESP8266/ESP32. The data is written to the memory before getting uploaded to the server. ESP8266/ESP32 is connected to internet of things speaks service over 2.4 GHz WiFi. ESP 8266 has Tensilica 32-bit reduced instruction set computer central processing unit Xtensa LX106 microcontroller. The microcontroller operating voltage is 3.3 V and works on 802.11b/g/n with 2.4 GHz frequency. Thing speak software enables the internet devices and communicates to the users [12]. Thing speak facilitates data access and retrieval to provide an API to the device and website. It contains built-in compatibility for math works matrix laboratory (MATLAB) numerical computing program, allow thing speak for analyzation and visualization of submitted data. MATLAB results are obtained from total harmonic distortion MATLAB license 2021b and the system configuration is Intel (R) Core (TM) i3-7020U central processing unit at 2.30 GHz. The acquired and transmitted signals have external and internal noise. The internal noise is due to the artifact and external noise is due to the signal transmission. The signal observed from fatty liver patient is shown in Fig. 5.
The methods used for the detection of fatty liver are magnetic belt consist of unidirectional antenna to detect fatty liver. The low permittivity signals are acquired from antenna and used to detect steatosis. However, fatty liver grading is studied through ultrasound and MRI. Moreover, controlled attenuation parameter is used to diagnose fibrosis. Fibrosis and steatosis are diagnosed through transient elastography and ultrasound imaging. Furthermore, the non-invasive method of diagnosing the steatosis and fibrosis is done through computed tomography. However, the liver stiffness is measured through fibroscan.
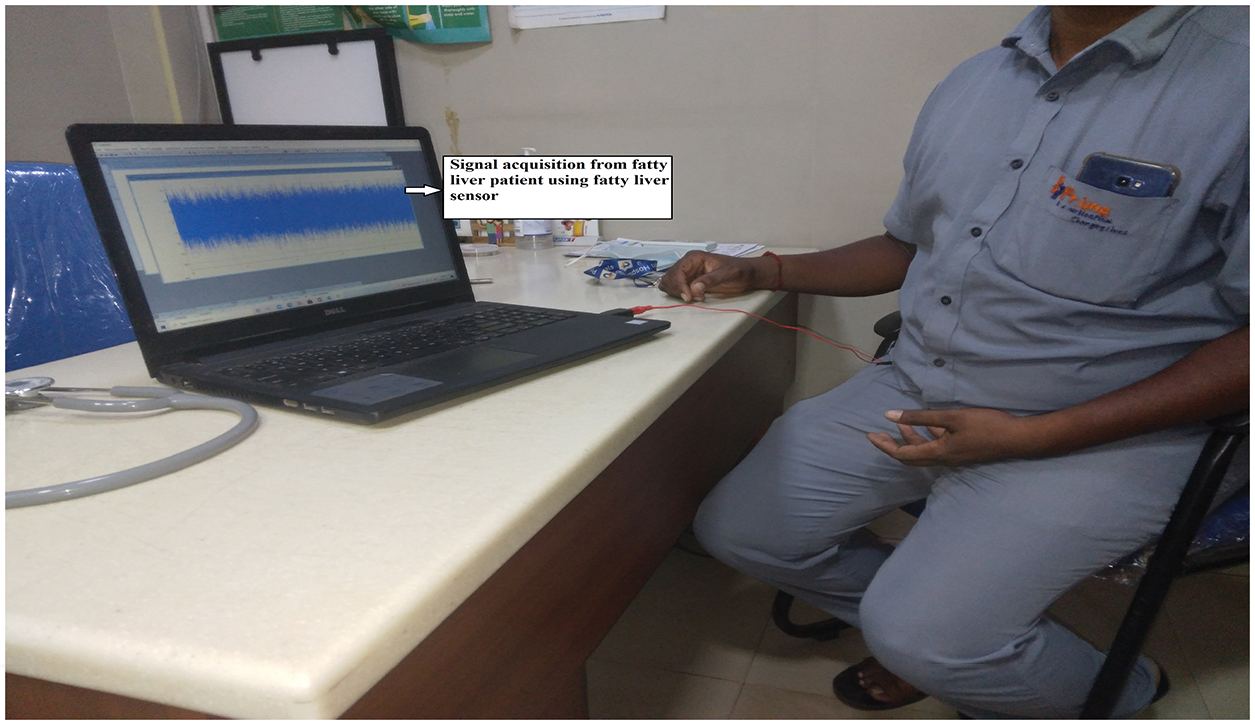
Figure 5: Realtime monitoring of fatty liver signal
The proposed fatty liver signal absorbs the electromagnetic radiation from the fat. The fat content in the liver consists of various artifacts such as ringdown artifacts and motion artifacts. The artifacts present in the signal are separated by the blind search separation method. This method is used to separate the fat and tissues. Blind search signal separation removes periodic and random motion noises in the fatty liver signal. Blind signal separation removes random motion noise through unsupervised learning [13]. In this paper, blind source separation of fat signal various noise through the blind search separation method. Fat signal can be separated using non-negative matrix factorization and separation of blind sources. In the non-negative matrix, V is given as in Eq. (2)
The non-negative matrix factorization predicts the random and motion noise, which are present in the fatty signal. The signal observed from severe fatty liver patient is shown in Fig. 6.
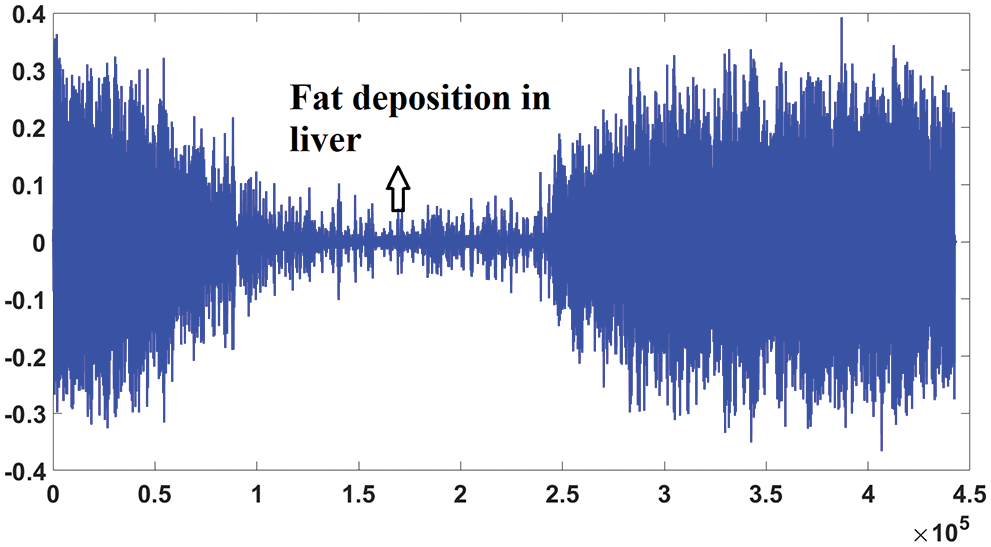
Figure 6: Signal from fatty liver patient
Fig. 7 shows the blind source separation for intestinal gas artifact of severe fatty liver patient.
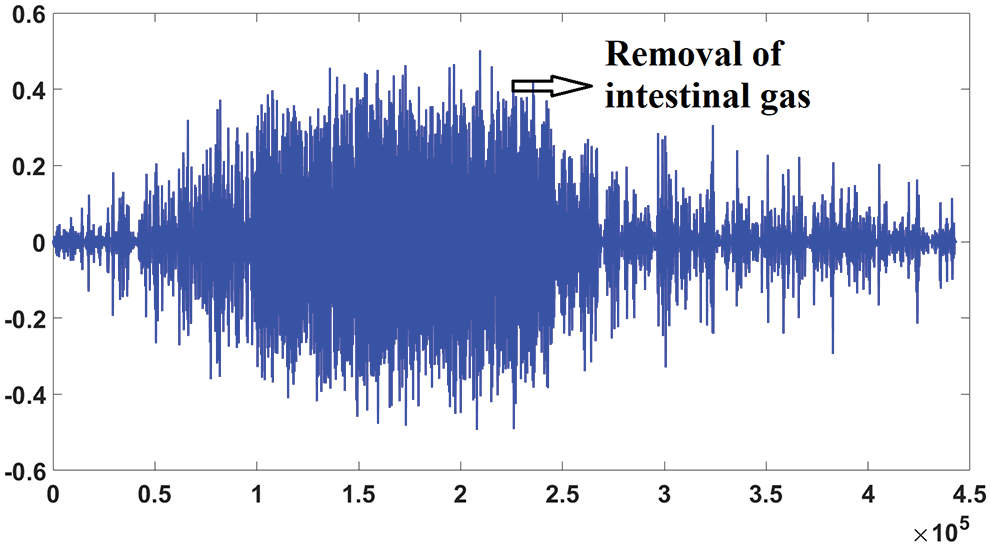
Figure 7: Blind source separation of severe fatty liver patient
6.1 Q Factor of Fat Signal for Fatty Liver Measurement
The filtered fatty liver signal is obtained through the blind source separation method and processed with TQWT. TQWT extracts energy value from different Q factor from non-negative matrix filtered fat signal for liver measurement. Instantaneous frequency provides concentration.
Tunable Q wavelet transform is tuned according to the oscillatory behavior of the fatty liver signal. TQWT is a fully discrete perfect reconstruction property of the fatty liver signal. Tunable Q wavelet transform is created using two-channel filter banks iterations and implemented using Discrete Fourier Transform using radix 2 fast fourier transform, and parameters are related to the Q factor [14]. The wavelet transforms has the perfect reconstruction property from the two-channel filter bank. The wavelet subband signal of the fatty liver signal is denoted as in Eq. (3)
The subband j has a sampling rate given in Eq. (4)
where
The frequency response is denoted as H1 (j)(ω), with non-zero between the interval (ω1, ω2) and given as in Eq. (6). The center frequency is the average of
The bandwidth is half the width of the interval over which the frequency is non-zero as in Eq. (7)
The tunability of the Q factor is described in terms of α and β as in Eq. (8)
The Q factor parameter depends on the filter bank parameter β. The frequency decomposition of mild-medium and severe fatty liver signals shown in Fig. 8. Higher the value of Q leads to more oscillatory wavelets. The fatty liver signal is sampled at 16,000 samples per second. The fatty liver signal is analyzed with a Q-factor of 4 and then with a Q-factor 1.
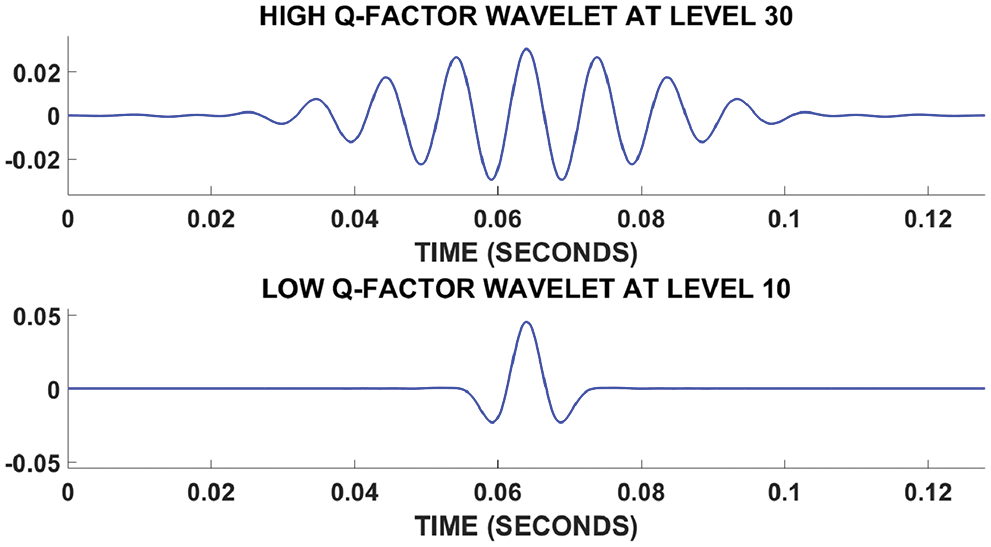
Figure 8: Fatty liver signal based on Q factor
The fatty liver signal is decomposed in to low and high resonance components. The fatty liver signal is denoted by x, this is represented as a sum of oscillatory fatty liver signal
The signal energy
where ‘w’ represents the subband. The high Q-factor factor fatty liver consist of sustained oscillatory behavior. The low Q-factor fatty liver signal consists of transients and never have sustained oscillations.
The sparsification of the subbands lead to the distribution of signal energy across the subbands. Fig. 9 shows energy distribution for severe fatty liver signal. The plot shows that more energy is concentrated at subband 31.
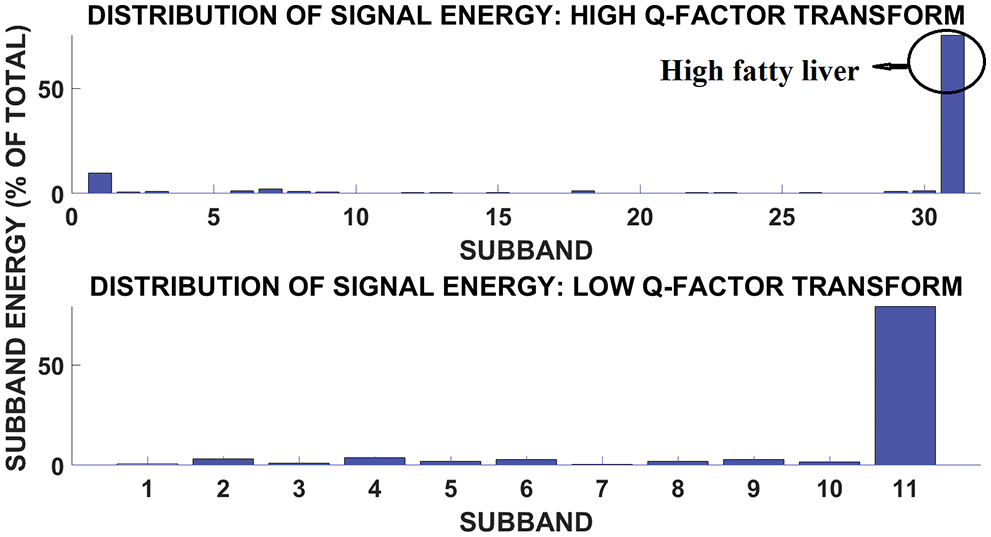
Figure 9: Subband and signal energy distribution of high fatty liver signal
Fig. 10 shows the subband and signal energy distribution of medium fatty liver signal. The plot shows more energy and concentrated in subband 4. Mild fatty liver person dielectric frequency range is about 100 to 150 Hz. The medium fatty liver affected person has a dielectric frequency range of 300 to 500 Hz and severely affected person has the frequency range of around 900 Hz [15]. The frequency range is analyzed using the fatty liver signal obtained from 96 patients. The fatty liver values are obtained from SRM medical college hospital and research centre. Moreover, accuracy of fatty liver dielectric frequency is correlated with ultrasound values. From the correlation, tunable Q wavelet transform based frequency analysis provides better result, when compared with stationary wavelet transform and discrete wavelet transform. The Fatty liver sensor is tested on patients who never consume alcohol. The patients who have fever and the kids below the age of 10 are excluded from this testing. The sample size is calculated using the relation given in Eq. (12)
where
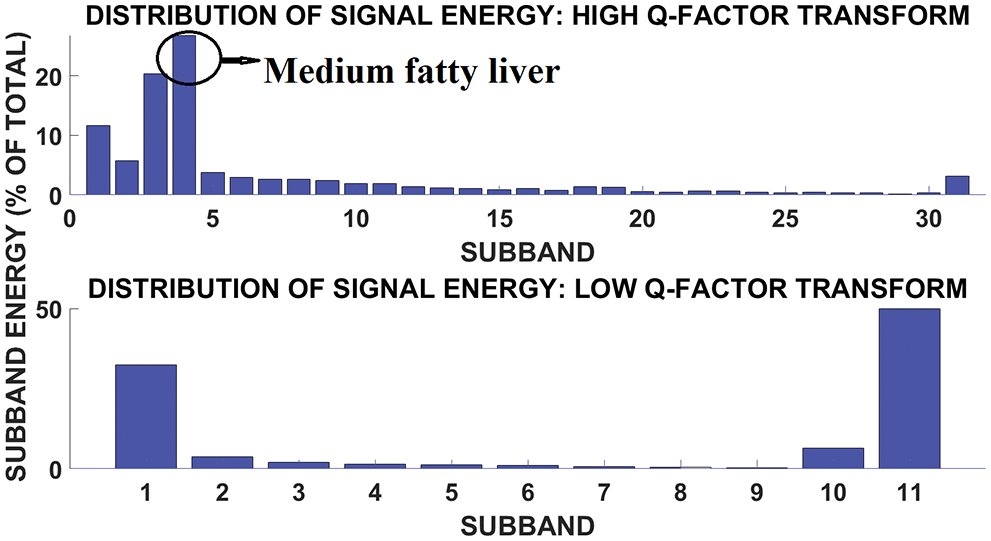
Figure 10: Subband signal energy distribution of medium fatty liver patient
Fig. 11 shows the subband and signal energy distribution of mild fatty liver patient. The signal energy is more in subband 1.
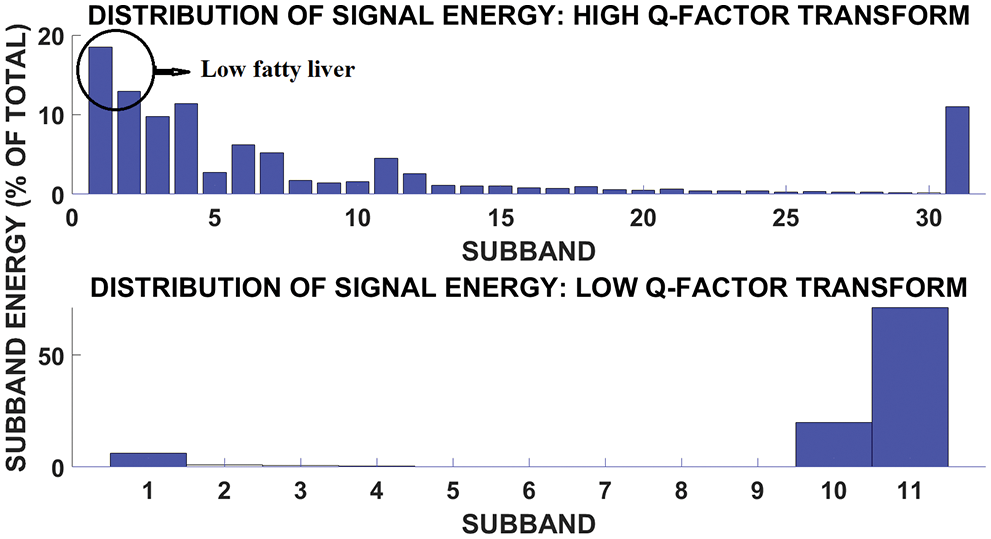
Figure 11: Subband and signal energy distribution of low fatty liver patient
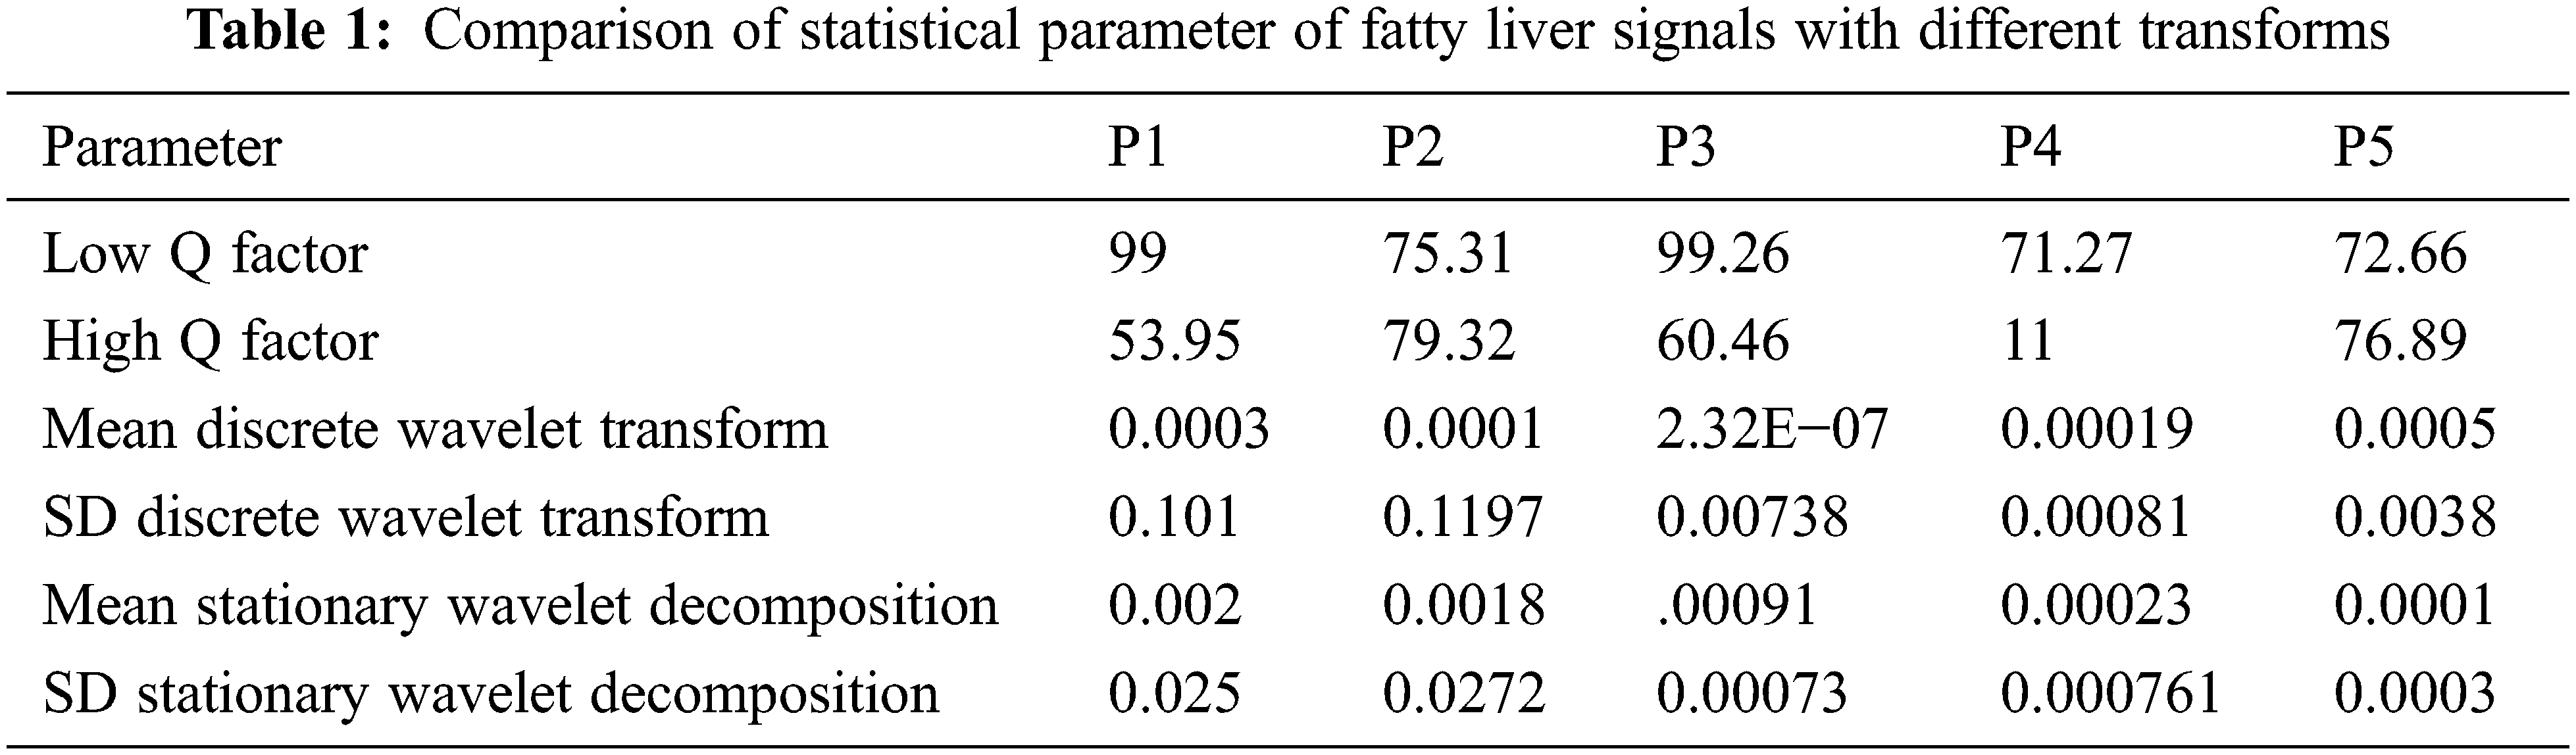
The comparison of statics parameter values with other transforms are shown below in Tab. 1. The statics parameter is obtained from various transforms such as discrete wavelet transform and stationary wavelet transform. The fatty liver signals performance is evaluated through discrete wavelet transform and stationary wavelet transform statistical parameters such as Mean and Standard deviation. From the statics parameter tunable Q wavelet transform subband values are taken for analysis. The discrete wavelet transforms and stationary wavelet transform performed based on non-decimated and decimated property. The fatty liver signals performance is evaluated through discrete wavelet transform and stationary wavelet transform statistical parameters such as standard deviation and mean. From the statistical parameter TQWT band values are obtained.
The fatty liver performance is analyzed through ultrasound image and Q values from fatty liver sensor. The tunable Q wavelet transform signal parameters is correlated with ultrasound values. Fig. 12 shows the ultrasound value of severe fatty liver patient. The total liver volume is 2442.13 cc, right liver volume is 554 cc and left liver volume is 1888 cc. The severe fatty liver signal obtained from female patient at the age 61.
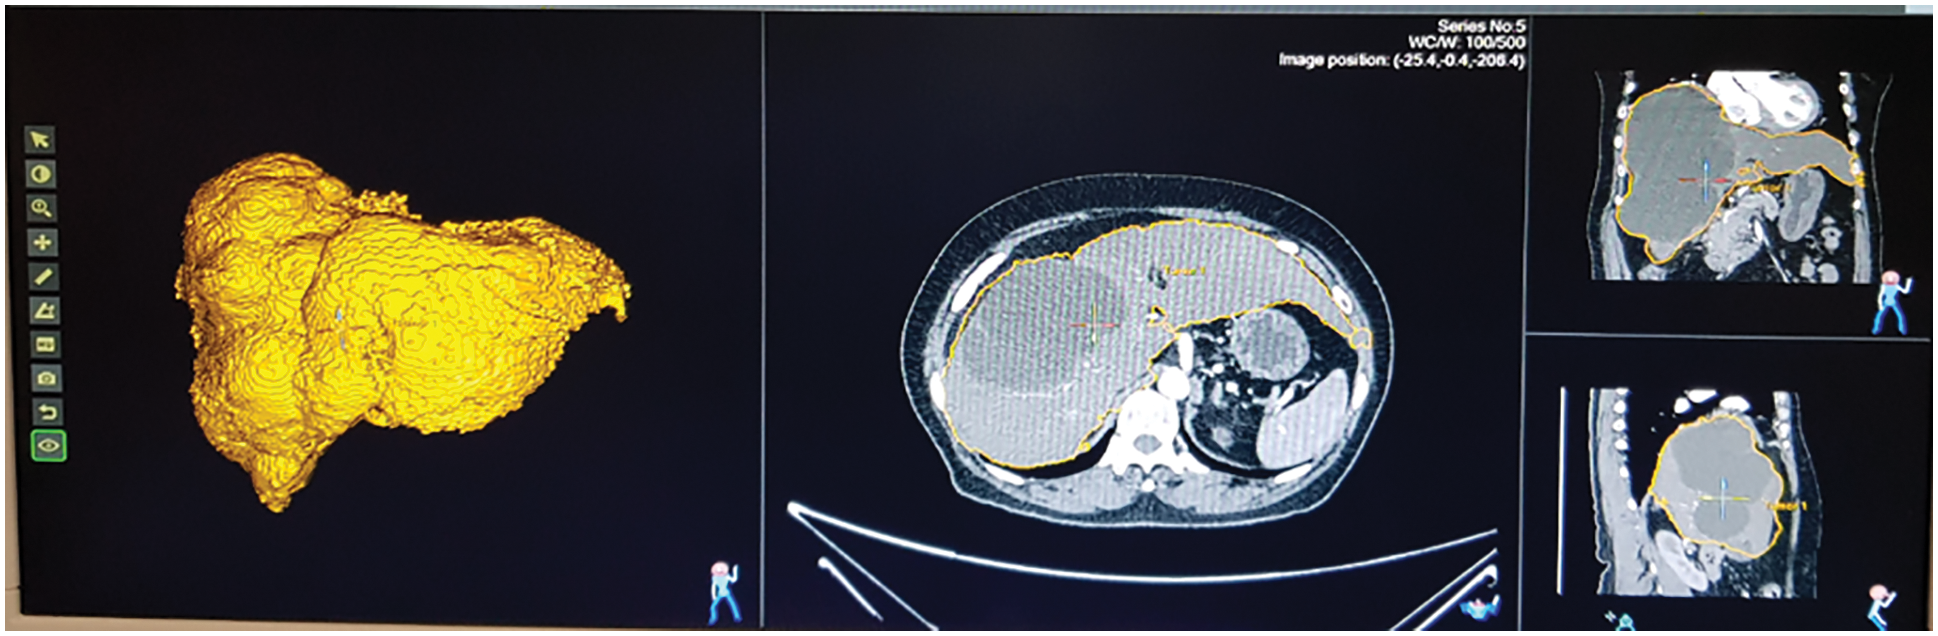
Figure 12: Ultrasound of severe fatty liver patient
Fig. 13 shows the ultrasound value of medium fatty liver patient. The total liver volume is 1467 cc, right liver volume is 445.9 cc and left liver volume is 1021.88 cc. The medium fatty liver signal obtained from male patient age 70. Fig. 14 shows the ultrasound of mild fatty liver patient. The total liver volume is 961.86 cc, right liver volume is 365.93 cc and left liver volume is 595.33 cc. The mild fatty liver male patient at age 70. The signals from fatty liver are obtained from fatty liver sensor for sever mild and moderate fatty liver patients. The statistical parameters of the fatty liver signal from TQWT and the ultrasound lab values are correlated using gaussian regression modelling.
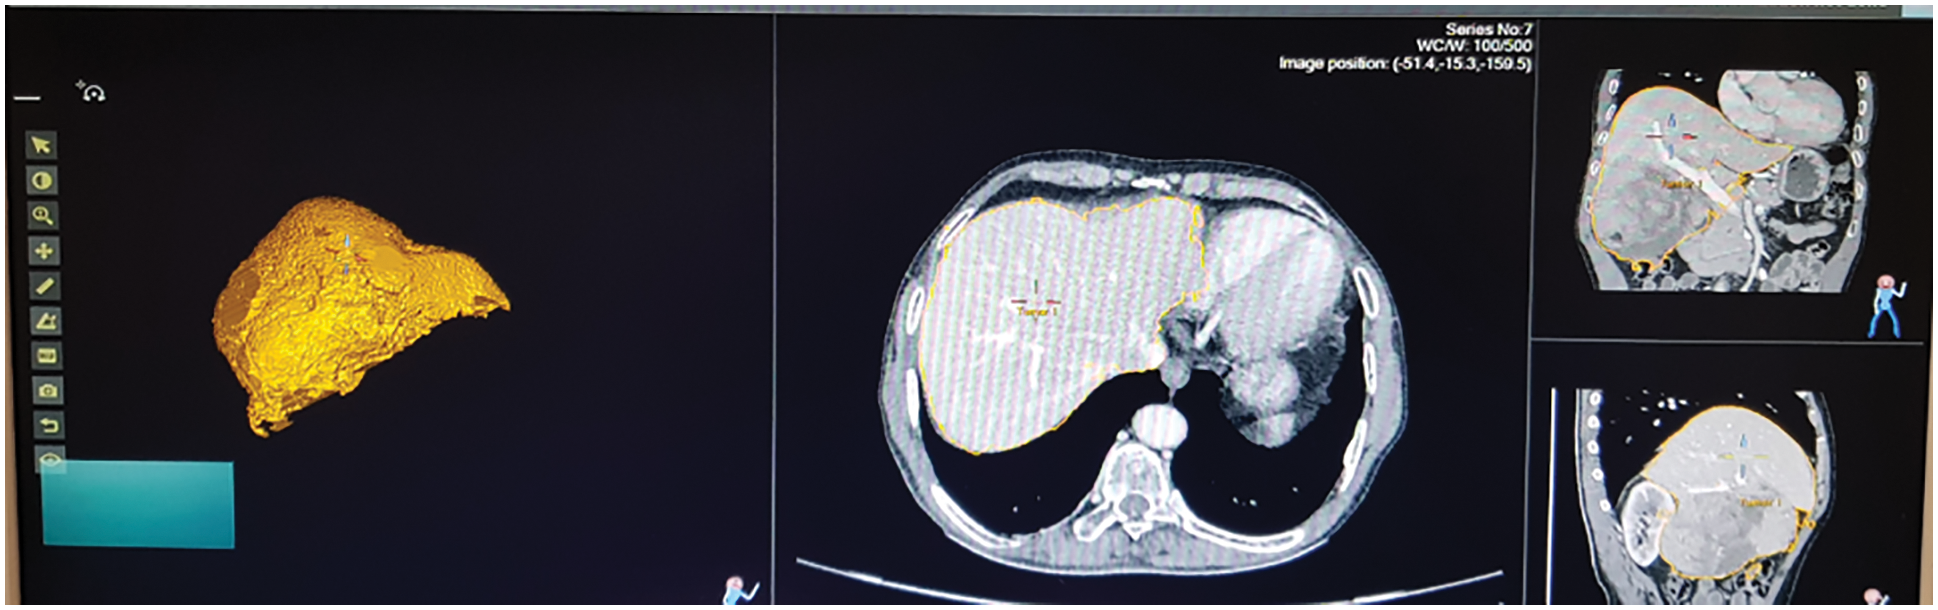
Figure 13: Ultrasound of medium fatty liver patient
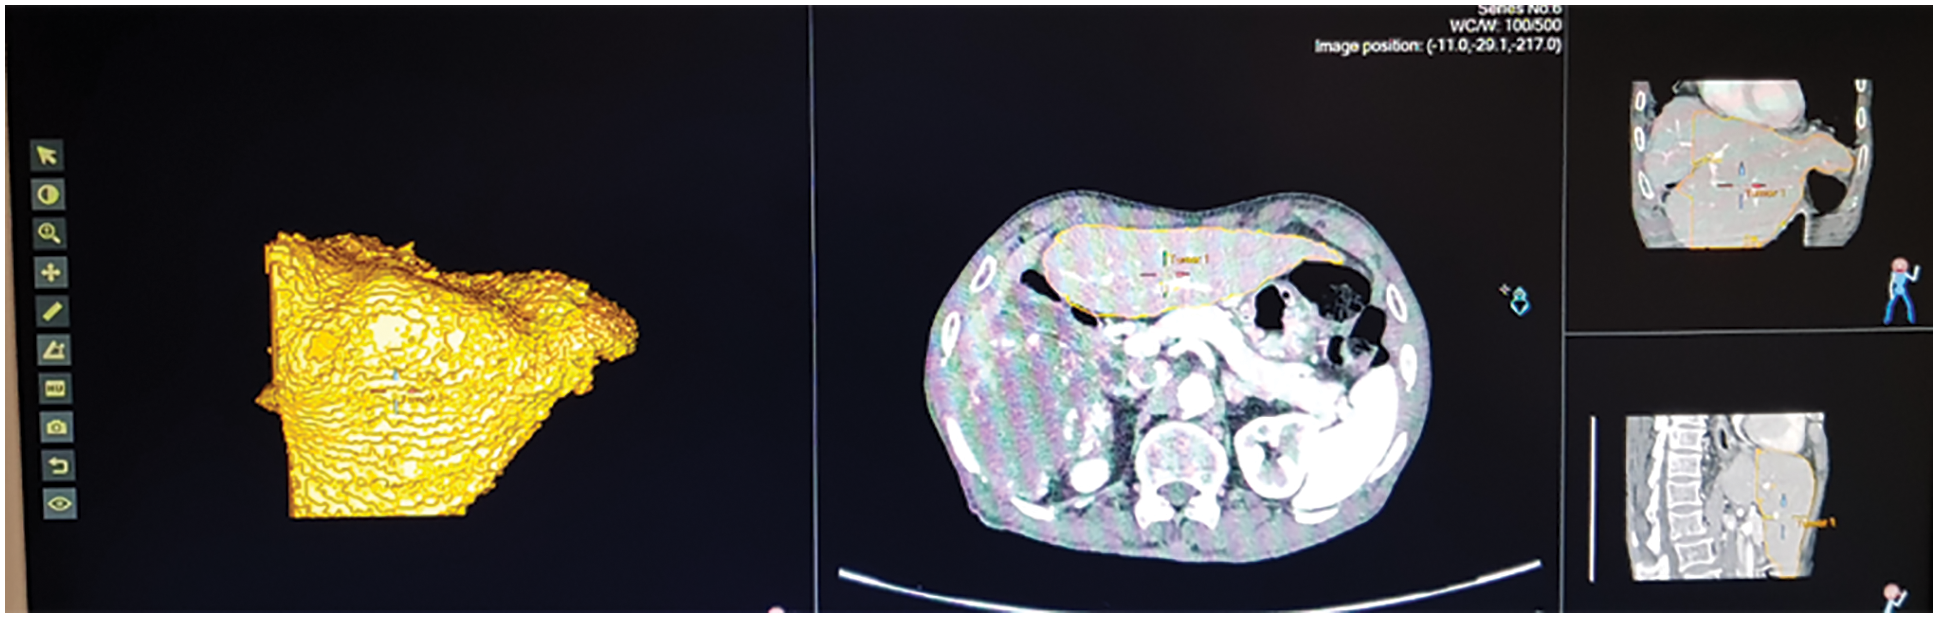
Figure 14: Ultrasound of mild fatty liver patient
6.2 Real Time Fatty Liver Monitoring with Gaussian Regression Modelling
Gaussian regression modelling is used for predicting the fatty liver. From proposed methodology, TQWT energy values are considered as independent variable. Values that retrieved from the lab is considered as a dependent variable. These dependent and independent variables are used in regression modeling. Using regression modeling, the fatty liver measurements are analyzed and the relations between experimental parameters are observed. From the Gaussian regression prediction fatty liver value is measured from the Eq. (13)
The regression model residual plot is shown in Fig. 15. For good model, the probability density function of the residual plot is uniformly distributed. For liver data, histogram bins are well distributed.
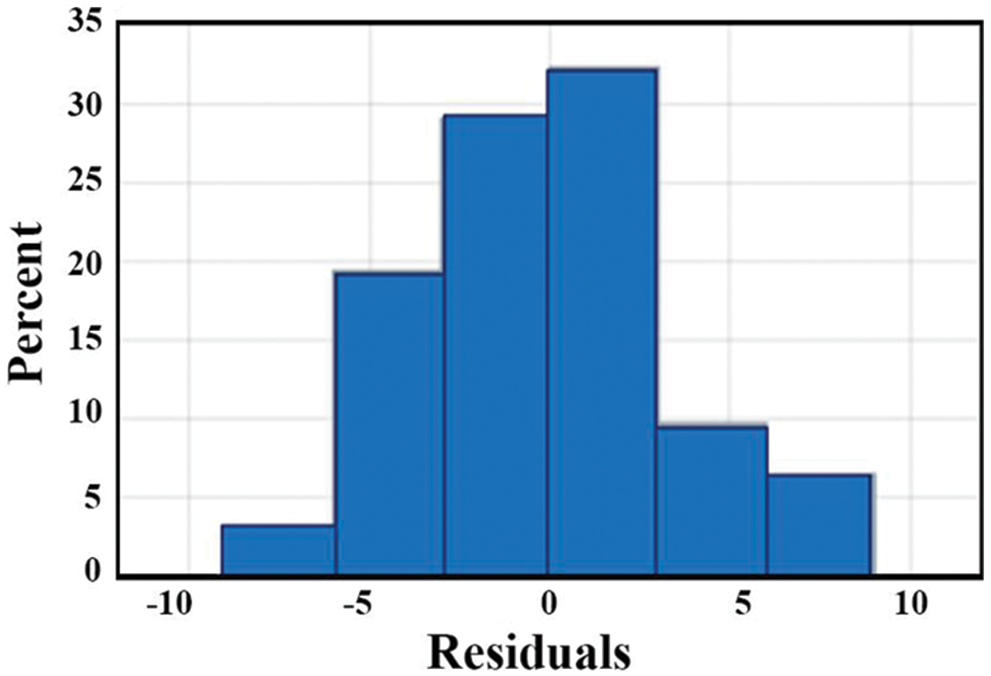
Figure 15: Residual plot of regression model
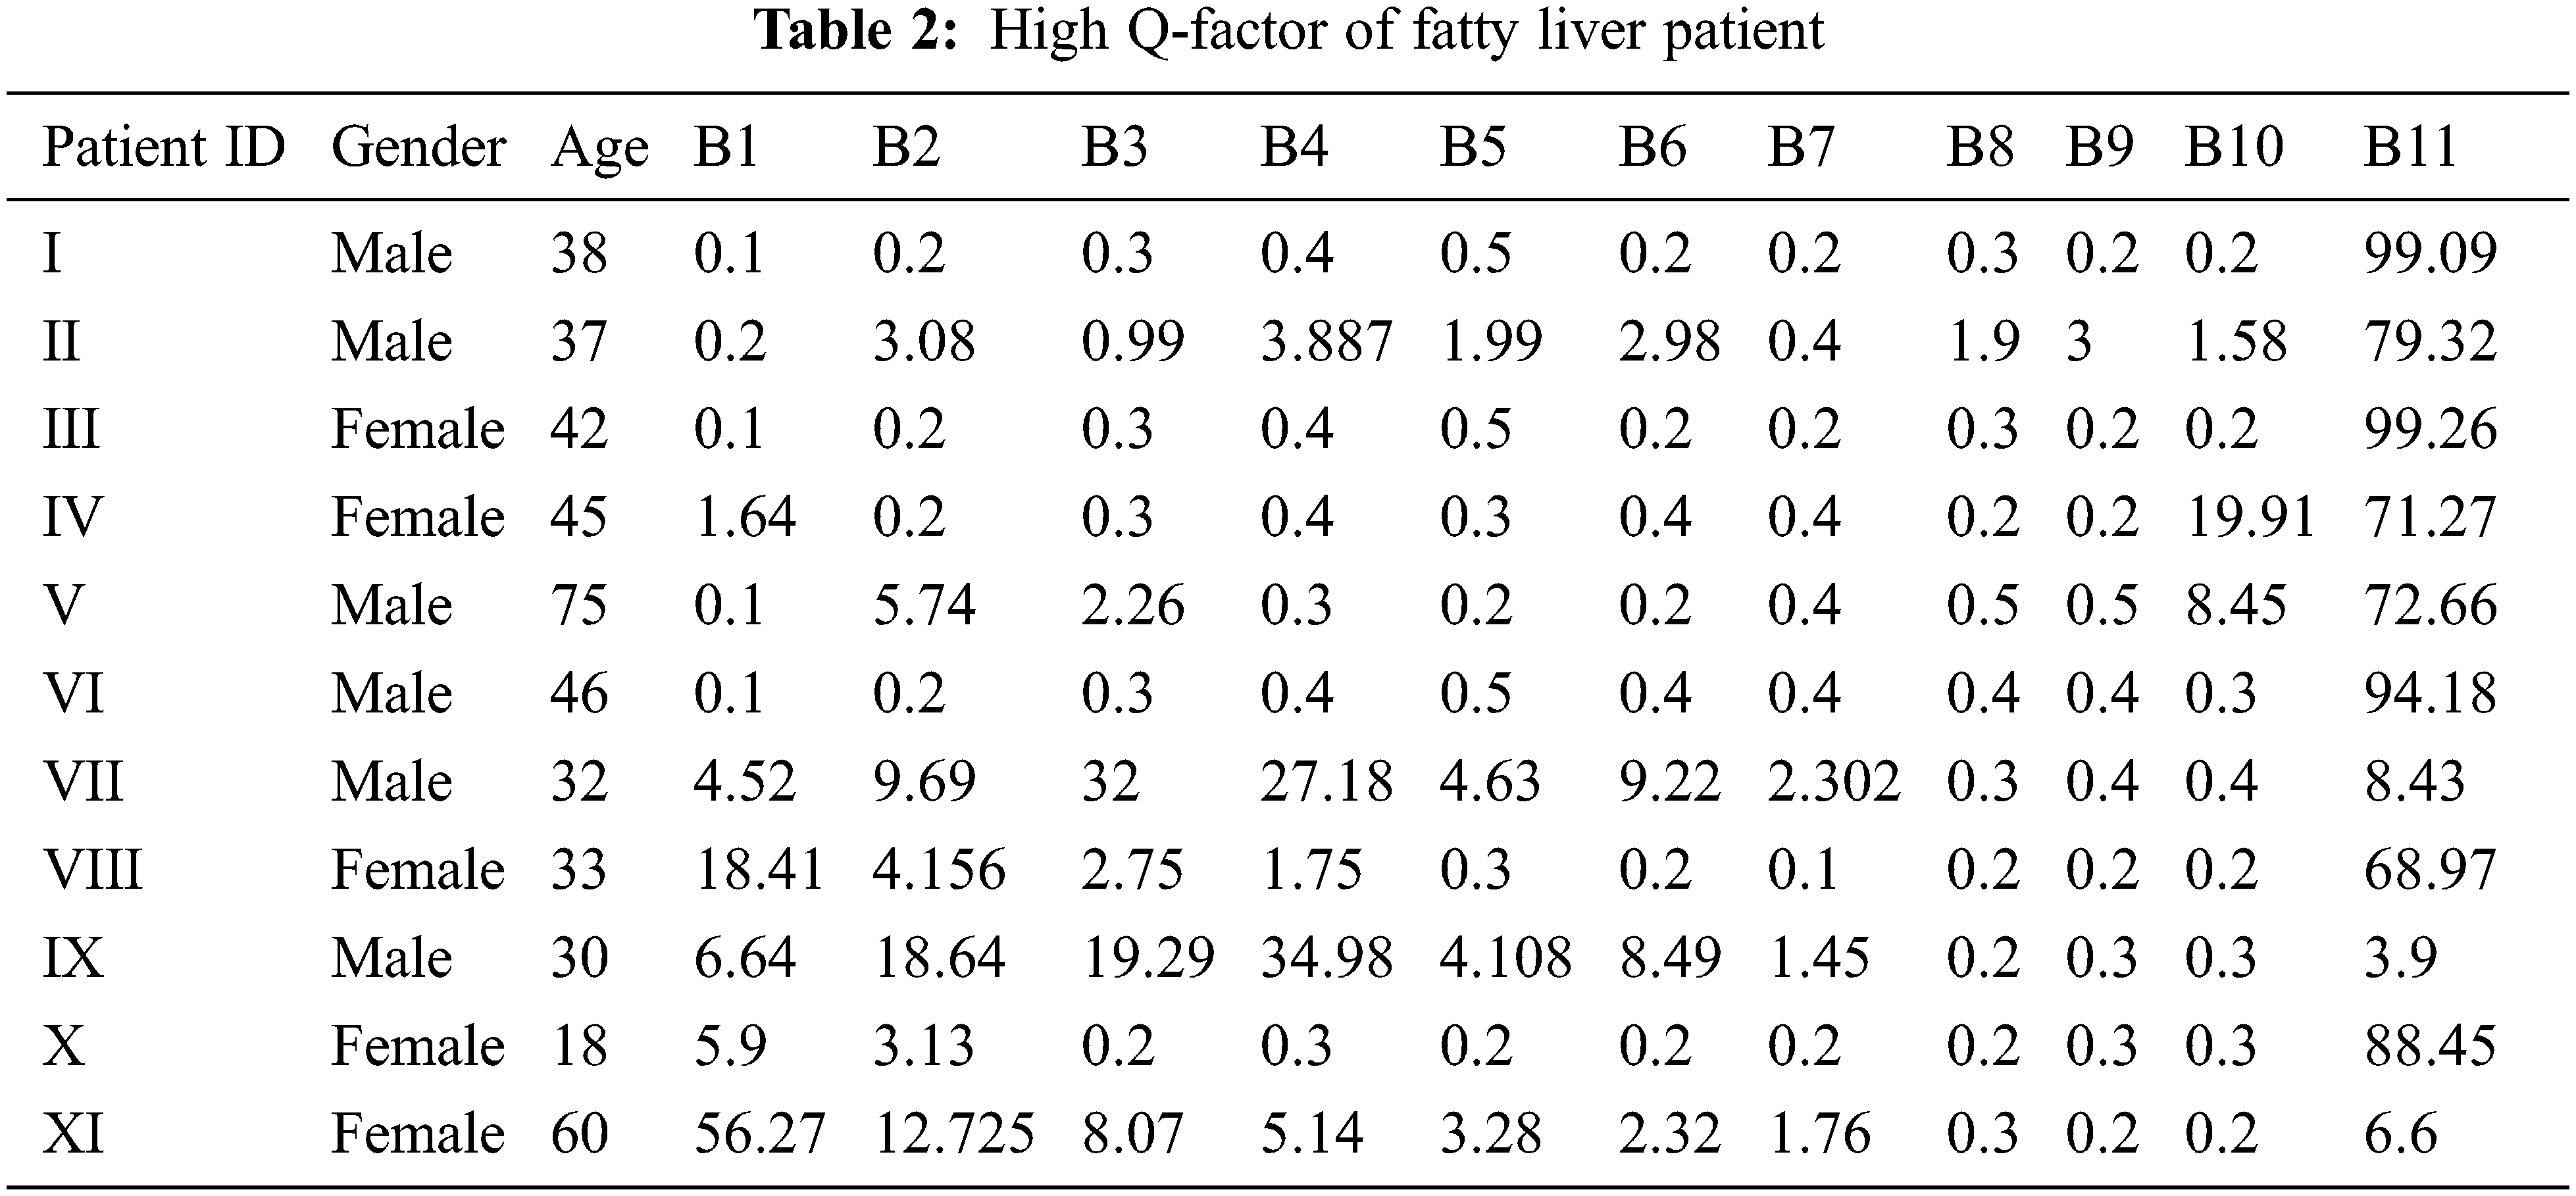
The tunable Q wavelet transform signal parameters are correlated with the real-time ultrasound values. The fatty liver signal is obtained from the fatty liver sensor for severe mild and moderate fatty liver patients. The statistical parameters of signals from tunable Q wavelet transform and laboratory values are taken for fatty liver prediction after processing with long short term memory model. The Q factor of severe, mild and medium fatty liver patient is shown in Tab. 2.
6.3 Fatty Liver Signal Monitoring Using Long Short-Term Memory
Long short-term memory model has memory blocks in the recurrent hidden layer. The memory block has a self-connection that store the network state and multiplicative units made of gates that controls the flow of information [16]. The memory block has an input and output gate. The input gate controls the input activation and the output gate controls the cell activation output flow. The memory block has another unit called the forget network. Long shot term memory model prevents continuous input stream processing, never segmented. The forget gate is used to forget or reset the cell memory. The modern long short term memory architecture has peephole connections from the internal cells to the same cell gate for the precise output timing.
In this paper, fatty liver signals are collected from fatty liver patients. The 70 signals are used for training and 36 signals are used for testing. Each signal is acquired using FLS for five minutes. The recorded signal from the fatty liver sensor has a mean value of 15 for severe fatty liver patient. In this paper, prevent over fitting is prevented through by splitting signal data randomly in to three sets. The datasets are training set with seventy percent, validation set with fifteen percent and test set with fifteen percent [17]. The training process of severe fatty liver is shown in Fig. 16. The strength of this proposed system is the FLS is tested on adults. The weakness is the sensor is never tested on the children below age ten.
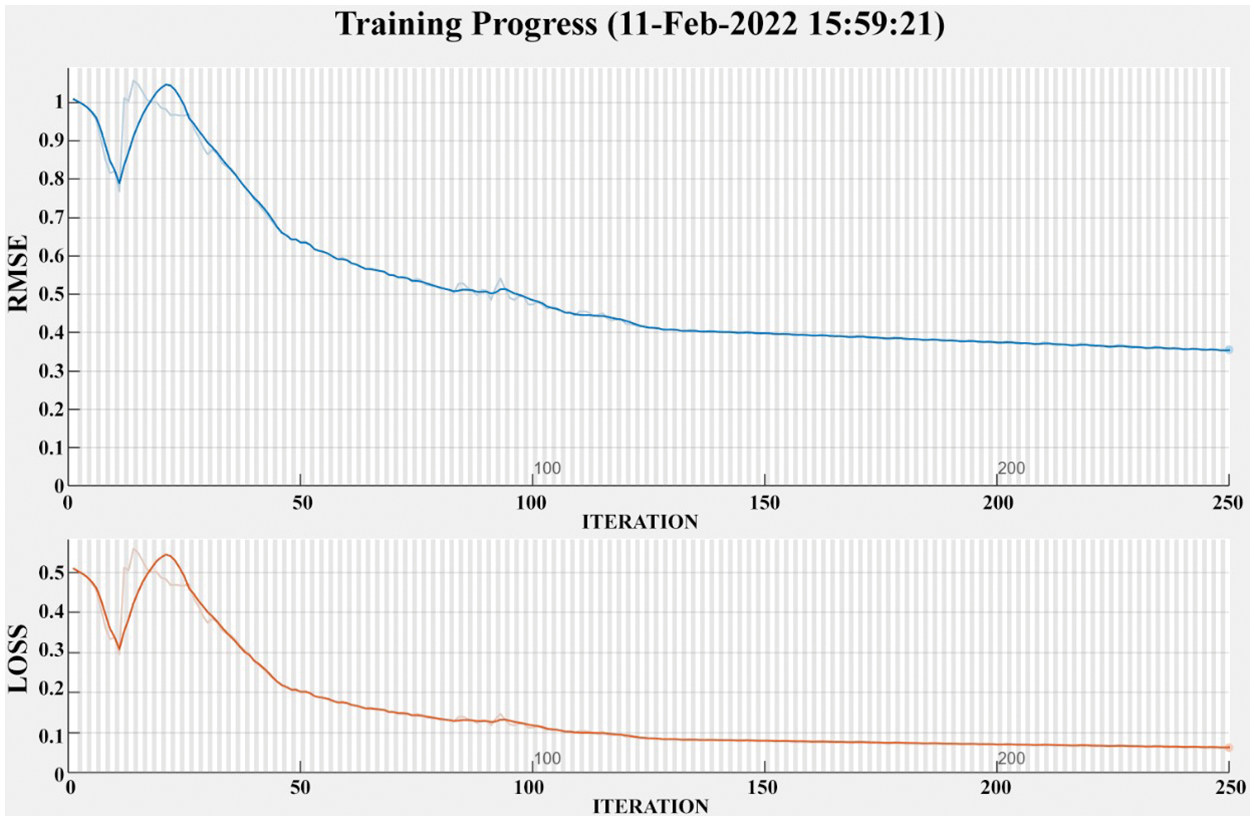
Figure 16: Training progress of severe fatty liver patient
The human fatty liver is measured through a FLS for fatty liver measurement. Fatty liver disease is detected early through FLS and to prevent lifestyle disorders disease. The fatty liver sensor is placed on the stomach, and the sensor is recorded liver dielectric material radiation and analyzed. The noise present in the signal is removed using a non-negative matrix filter. Furthermore, tunable Q wavelet transform analysis is done for Q factor analysis, obtained the energy values and processed with LSTM Continuous monitoring of fatty liver is proposed in this paper. Compared to other non-invasive methods, the proposed system performs better for fatty liver disease. The fatty liver measurement from the fatty liver sensor and long short-term memory provides an accuracy of 86% with lab measurement.
Ethical approval to report this case was obtained from Ethical committee of SRM Medical College Hospital and Research Centre with Ethics clearance number: 2963/IEC/2021.
Acknowledgement: The authors would like to acknowledge the physician Dr. Jagadeesan of KJ Research foundation centre, Dr. S. Anbazhagan of Kavitha Multispecialty hospital and Dr. Kannan of Prime Indian hospital for the continuous support in data acquisition.
Funding Statement: The authors received no specific funding for this study.
Conflicts of Interest: The authors declare that they have no conflicts of interest to report regarding the present study.
1. T. Ueno and M. Komatsu, “Autophagy in the liver: Functions in health and disease,” Nature Reviews Gastroenterology & Hepatology, vol. 14, no. 3, pp. 170–184, 2017. [Google Scholar]
2. M. Ahmed, “Non-alcoholic fatty liver disease in 2015,” World Journal of hepatology, vol. 7, no. 11, pp. 1450–1459, 2015. [Google Scholar]
3. S. M. Abdeldyem, T. Goda, S. A. Khodeir, S. Abou Saif and S. A. Elsalam, “Nonalcoholic fatty liver disease in patients with acute ischemic stroke is associated with more severe stroke and worse outcome,” Journal of Clinical Lipidology, vol. 11, no. 4, pp. 915–919, 2017. [Google Scholar]
4. F. Bril and K. Cusi, “Nonalcoholic fatty liver disease: The new complication of type 2 diabetes mellitus,” Endocrinology and Metabolism Clinics, vol. 45, no. 4, pp. 765–781, 2016. [Google Scholar]
5. H. F. Ji, Y. Sun and L. Shen, “Effect of vitamin E supplementation on aminotransferase levels in patients with NAFLD, NASH, and CHC: Results from a meta-analysis,” Nutrition Journal, vol. 30, no. 9, pp. 986–991, 2014. [Google Scholar]
6. P. J. Eddowes, M. Sasso, M. Allison, E. Tsochatzis, Q. M. Anstee et al., “Accuracy of fibroscan controlled attenuation parameter and liver stiffness measurement in assessing steatosis and fibrosis in patients with nonalcoholic fatty liver disease,” Gastroenterology, vol. 156, no. 6, pp. 1717–1730, 2019. [Google Scholar]
7. C. Caussy, M. H. Alquiraish, P. Nguyen, C. Hernandez, S. Cepin et al., “Optimal threshold of controlled attenuation parameter with MRI-PDFF as the gold standard for the detection of hepatic steatosis,” Hepatology, vol. 67, no. 4, pp. 1348–1359, 2018. [Google Scholar]
8. D. E. Riemer, “The theoretical fundamentals of the screen-printing process,” Microelectronics International, vol. 6, no. 1, pp. 8–177, 1989. [Google Scholar]
9. N. Zavanelli and W. H. Yeo, “Advances in screen printing of conductive nanomaterials for stretchable electronics,” American Chemical Society Omega, vol. 6, no. 14, pp. 9344–9351, 2021. [Google Scholar]
10. S. Naghdi, M. Rezaei, N. Bahramifar and B. Kuswandi, “Preparation and characterization of intelligent color-changing nanosensor based on bromophenol blue and GONH2 nanosheet for freshness evaluation of minced caspian sprat (Clupeonella cultriventris caspia) Stored at 4°C,” Chemical Papers, vol. 1, no. 1, pp. 1–14, 2022. [Google Scholar]
11. N. M. Hieu, T. T. Hien, N. D. Chinh, N. D. Quang, N. M. Hung et al., “ZnTe-coated ZnO nanorods: Hydrogen sulfide nano-sensor purely controlled by PN junction,” Materials & Design, vol. 191, no. 1, pp. 108628–108636, 2020. [Google Scholar]
12. B. Frankston, “# APIFirst: How things speak to each other [Bits Versus Electrons],” IEEE Consumer Electronics Magazine, vol. 4, no. 3, pp. 86–89, 2015. [Google Scholar]
13. C. Lei, L. Y. Zhang, Y. J. Guo, Y. Huang and Y. Liang, “Blind signal separation algorithm based on temporal predictability and differential search algorithm,” Journal on Communications, vol. 35, no. 6, pp. 117–125, 2014. [Google Scholar]
14. A. Subasi and S. M. Qaisar, “Surface EMG signal classification using TQWT, bagging and boosting for hand movement recognition,” Journal of Ambient Intelligence and Humanized Computing, vol. 1, no. 1, pp. 1–16, 2020. [Google Scholar]
15. X. Zhang, X. Sun, W. Sun, T. Xu, P. Wang et al., “Deformation expression of soft tissue based on BP neural network,” Intelligent Automation and Soft Computing, vol. 32, no. 2, pp. 1041–1053, 2022. [Google Scholar]
16. T. Zia and U. Zahid, “Long short-term memory recurrent neural network architectures for Urdu acoustic modeling,” International Journal of Speech Technology, vol. 22, no. 1, pp. 21–30, 2019. [Google Scholar]
17. X. R. Zhang, J. Zhou, W. Sun and S. K. Jha, “A lightweight CNN based on transfer learning for COVID-19 diagnosis,” Computers Materials & Continua, vol. 72, no. 1, pp. 1123–1137, 2022. [Google Scholar]
 | This work is licensed under a Creative Commons Attribution 4.0 International License, which permits unrestricted use, distribution, and reproduction in any medium, provided the original work is properly cited. |