DOI:10.32604/iasc.2023.030168
| Intelligent Automation & Soft Computing DOI:10.32604/iasc.2023.030168 | |
| Article |
Deep Learning Prediction Model for Heart Disease for Elderly Patients
Department of Computer Sciences, College of Computer and Information Sciences, Princess Nourah bint Abdulrahman University, Riyadh, 11671, Saudi Arabia
*Corresponding Author: Hanan Ahmed Hosni Mahmoud. Email: hahosni@pnu.edu.sa
Received: 20 March 2022; Accepted: 20 April 2022
Abstract: The detection of heart disease is a problematic task in medical research. This diagnosis utilizes a thorough analysis of the clinical tests from the patient’s medical history. The massive advances in deep learning models pursue the development of intelligent computerized systems that aid medical professionals to detect the disease type with the internet of things support. Therefore, in this paper, we propose a deep learning model for elderly patients to aid and enhance the diagnosis of heart disease. The proposed model utilizes a deeper neural architecture with multiple perceptron layers with regularization learning techniques. The model performance is verified with a full and minimum set of features. Fewer features enhance the processing time of the classification process while the accuracy is compromised. The performance of classifiers with less features has been analyzed with experimental results. The proposed system is built on the Internet of Things Platform for medical data for the classification process which aids medical professionals to detect heart diseases through cloud platforms. The results accuracy is matched to classical learning models such as Convolutional Neural Network (CNN), Deep CNN, and neural ensemble models. The analysis of the proposed diagnostic system can determine the heart disease risks efficiently. Experimental results demonstrate that flexible modeling and tuning of the hyperparameters can attain an accuracy of up to 97.11%.
Keywords: Heart disease; internet of things; deep learning
Heart disease is the primary cause of death in the elderly age group. Hence, the medical sector needs to enhance the prediction of heart problems [1] using deep learning models. Precise diagnosis of heart disease is impacted by previous knowledge of the patient’s pathological metrics [2]. Therefore, patients’ pathological parameters such as cholesterol, hypertension condition, smoking, diabetes, and sex habits [3,4] need to be monitored at all-time [5]. These parameters are independent and can be utilized for deep learning models.
Deep learning models, for heart disease Prediction, are the main aspect of our research [6]. The deep learning models depict prediction enhancement for heart disease [7–9]. As in other medical fields. in this paper, we employ the patient’s data to predict the chance of heart disease by mathematical calculations using distributive functions.
The authors in [10], classified heart disease into coronary, congenital, and rheumatic heart disease. The cardio activity was investigated during motion and rest [11,12]. Heart artery disease signs are respiratory complaints, chest pain, heart palpitation, and fatigue. Recent research advances in these fields are prominent, via classification and deep learning models [13] to classify cardiac disease efficiently [14]. Diagnostic methods for heart disease are chest X-ray, angiogram, stress testing resonance imaging [15], and electrocardiogram test [16]. Medical data mining models are utilized to detect various signals of metabolic parameters during activities and rest [17]. Data mining techniques for prediction are utilized using data analysis in heart disease extrapolation [18–21].
The authors in [22] described that a Convolutional Neural Network Heart disease prediction utilizes bioinformatics patterns in datasets by data mining methods. Features extraction is very effective in prediction knowledge and class mining. various trends to classify heart diseases can be mined utilizing neural networks. A shallow neural network and a multi-layer perceptron are used to examine the brain’s neurons. It has several perception levels which impact the output and are depicted in Fig. 1. Both the hidden and outputs layer with predetermined values are depicted.
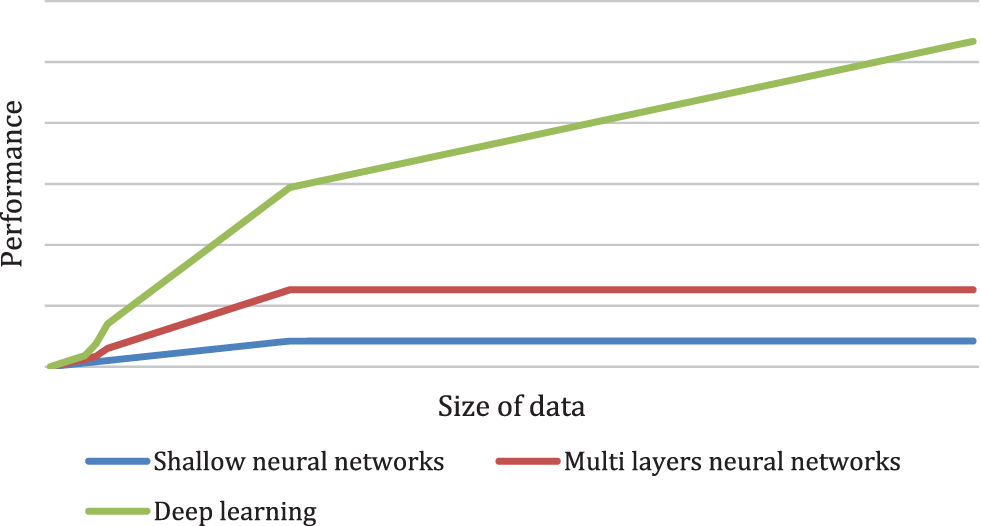
Figure 1: Performance versus the amount of data for different supervised learning models
Authors in [23] presented a deep learning (DL) model for perceiving cardio diseases, and the outcomes have revealed a four-level DL network for Risk minimization for better prediction accuracy. The DL network proposed by the authors focused on model optimization and resolve the missing data and outliers with high precision. To validate the optimized network, a cross-validation technique is used. Also, Matt correlation parameters are used. The research was performed on a dataset of Cleveland clinic medical data (DCC).
The authors in [24] proposed the ensemble machine learning healthcare model (EML-HSM) for computerized cardio disease detection in an internet of things (IoT) Fog model. The fog model offers disease diagnosis as a fog model with IoT apparatus and levers the cardiac data efficiently. Fog-Cloud Model Bus utilizes the bandwidth, speed, power dissipation, and precision to execute and test a model’s accuracy. Fog models are programmed to produce the highest quality and prediction accuracy for many fog settings and various user requirements. Deep learning models with high accuracy need huge processing resources for learning and classification. In [25] the authors integrate deep learning models to edge detection paradigms by using new models such as the assembly computation model, that authorize high accuracy with less computational time.
Authors in [26] proposed a recurrent deep learning model for early diagnosis of heart congestive. The new model was able to detect multiple months’ scrutiny cases and controls apt occurrences, for example, heart disease detection on, medication procedural instructions. Model performance metrics are contrasted with the regression logistics, where the neural computing and vector support classification model to the k-nearest neighbor’s algorithm (KNN) classifier for prediction. Deep learning techniques can exploit time linearity in the short time window to enhance the model performance to indicate the incident heart congestive failure.
The authors in [27] presented a neural ensemble model for the operative diagnosis of cardio diseases. The ensemble models produce new techniques by incorporating the retrograde possibilities of multiple models. This can produce more operational test experiments. Heart disease data was utilized to learn heart diseases symptoms. The ensemble technique is generated using multiple discrete models of neural computing, and It permits the user to utilize various performance valuation methods. It permits the user to produce multi views to verify their model performance [28–30].
To solve these problems, in this paper, we propose a deep learning model (D-CNN) [1–5] for the early diagnosis of cardiac disease. D-CNN is a neural convolution network with deeper layers i.e. has more hidden layers for better feature extraction [4]. Data analysis in deep learning models will reduce the need for the medical expertise and also will eradicate the human error incidence, thus enhancing prediction performance. D-CNN indicates favorable results in the tuning of models for the diagnosis of heart disease with the augmented scope of routine medical data. Experimental results depict that an elastic design and tuning of D-CNN parameters can attain a precision of 97.11%.
This paper demonstrates the developed D-CNN model to identify cardio disorders and enhance detection accuracy utilizing deep learning classification models. The classification model proposed for this research has two stages:
1. A deep learning model that motivated a multi-layer regulation. Further, the deduced pattern is utilized to predict if the patients have cardio disorders based on a learning model.
2. The performance is measured for precision via error probability, accuracy, and specificity [19]. Also, a remote monitoring platform (RMP) is introduced, that is competent to screen the patient metrics with IoT [20] information collection from patients’ parameters such as ECG and hypertension and generate a risk warning to the medical personnel with his condition.
The scope of the research is depicted as follows:
1. Determine the performance of heart disease detection using an assisted deep learning model,
2. Develop a classification technique using the Bayesian model to attain the best error rate,
3. Develop a perceptron method with multiple layers of neurons, with hidden layers for binary classification.
The experiments employed the dataset (DS1) in [27]. The proposed model has better precision in diagnosis heart disease.
The rest of the paper is divided as follows: In Section 2, The deep learning model (D-CNN) is proposed to aid and enhance patient precision and reliability in prognostics of cardio diseases. In Section 3: The experiments are depicted and tested. Section 4 depicts the conclusions.
2 The Deep Learning Model (D-CNN)
In this paper, we propose a D-CNN model for the timely prediction of cardiovascular disease and early diagnosis. The dataset DS1 [27] is used for learning and prediction purposes. A deep learning CNN and perceptron module with multiple layers (PML) is utilized to classify ECG data for feature extraction. The D-CNN performs feature extraction to characterize beat classification diseases. The last activation layer as the last convolution is utilized as inputs. A normalization layer and a final activation layer follow the first convolutional layer via a mathematical process. As shown in Eq. (1), parameters are utilized to implement a conveyor function in each layer using 20 kernels. The convolutional layers can be defined as a block of three operators, depicted by the following equations.
where
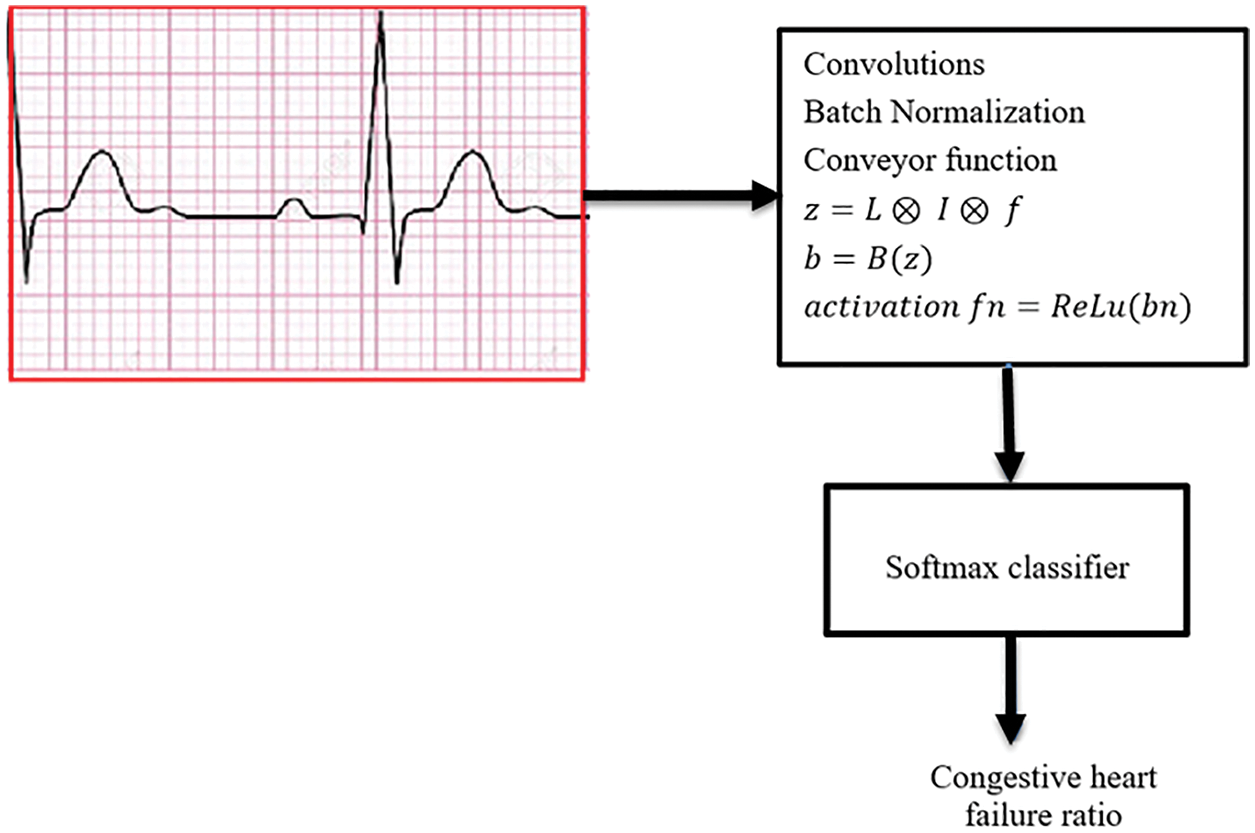
Figure 2: A Softmax classifier that is utilized in the final longitudinal layer of data analysis
The score for class x as an average pooling for the final function is computed using the weight of the forwarding linear combination of activation vector, which aids to analyze various windows such as, diagnosis, observation, and prediction. In particular, the model computes the gradient score of class x (Gx) regarding the P which is the average-pooled global value to produce the weights
where,
This method was utilized in the differentiation of the activation map x, defining the value of the activation function at the temporal position
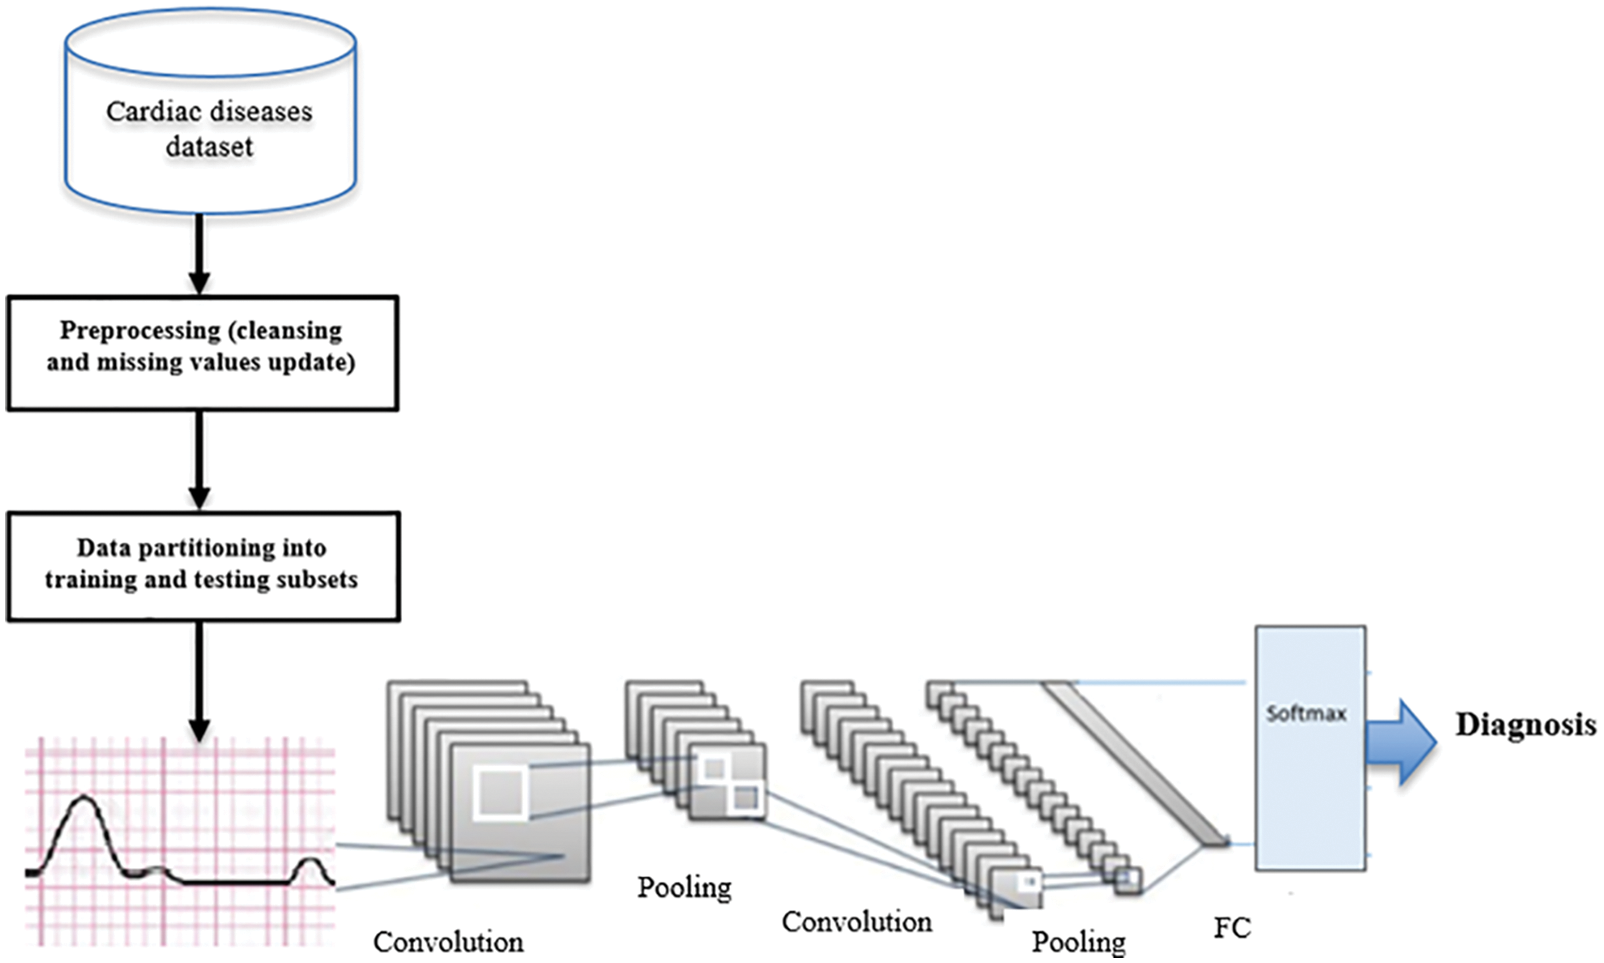
Figure 3: The proposed D-CNN model
2.2 Perceptron Process Using Multiple Layers
A Bayes net is a probability model using a prediction model graphically. Bayes nets are dedicated to statistical distributions to predict the heart disease diagnosis. Features that are defined by Bayes net, are depicted in Fig. 4.
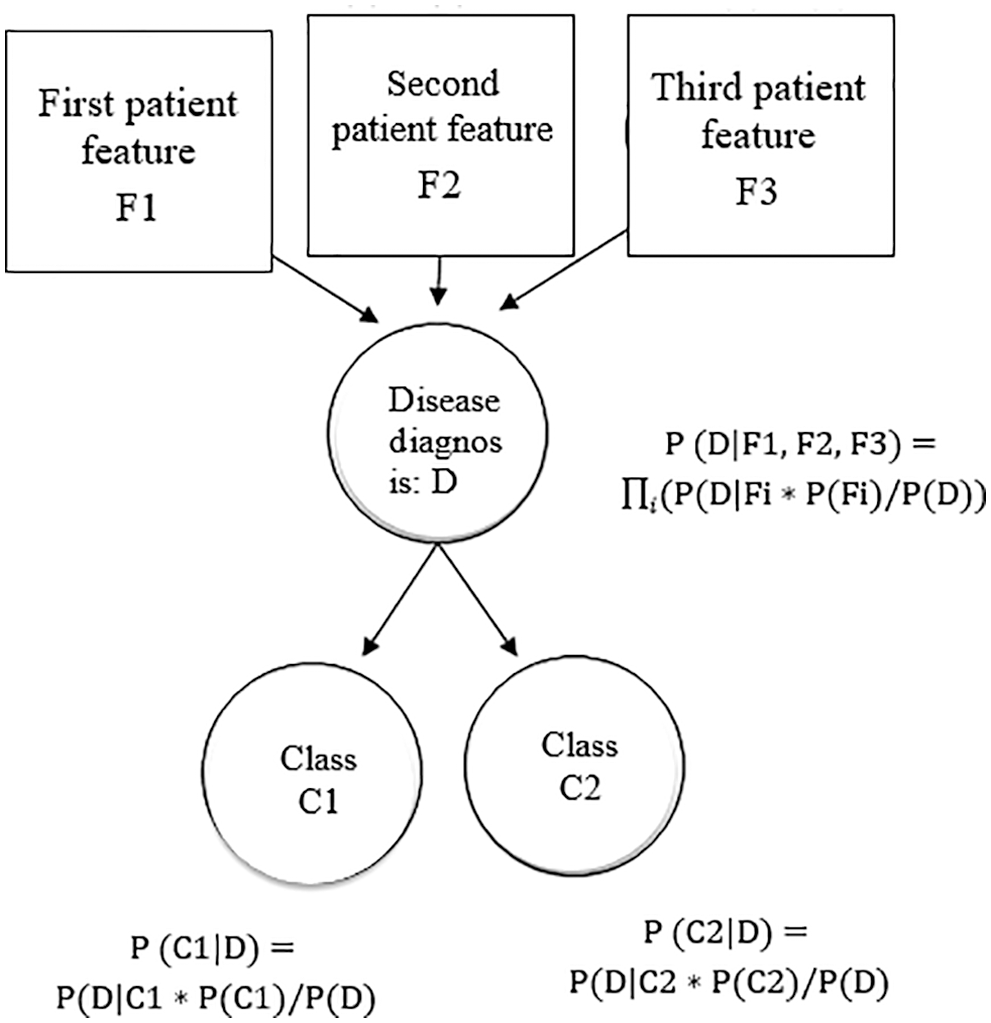
Figure 4: Features defined by the Bayes net
The Bayes net is defined as a group of feature variables represented as a directed graph depicting the conditional variable dependencies. The edges in the Bayes graph depict the dependent variables (features, while the nodes that are not connected by edges then these nodes are independent variables.
Let’s define M as a variable that depends on n attributes M = {A1, A2,…, An}. Let a hypothesis (H) that M is an element to a class C. The probability (H|M), is defined as P(H|M). P(H|M) is the posterior conditional probability of the M condition on H. The posterior conditional probability can be predicted via the Bayes graph theorem.
As depicted in Eq. (6), where P(H) is the probability of the hypothesis is real, and P(M) is the probability of the evidence. P(M|H) is the probability of the evidence M such that H is correct and P(H|M) is the probability of the hypothesis is true given that the evidence M represents a high likelihood.
The Bayesian classification is based on the probability Bayes theorem. This is a specific case of the Bayes net and a Softmax classifier using the following features: age, sex, and other hypertension attributes. The functions are autonomous in the conditionally Bayes net. Accordingly, the adjustments of one feature do not impact the others. The Naïve model is proper for dataset classification of high dimensions. The classifier is characterized that the attribute value being separate from the significance of the other attributes of a class.
Let’s then define
hence,
if the attributes are independent of each other therefore:
where,
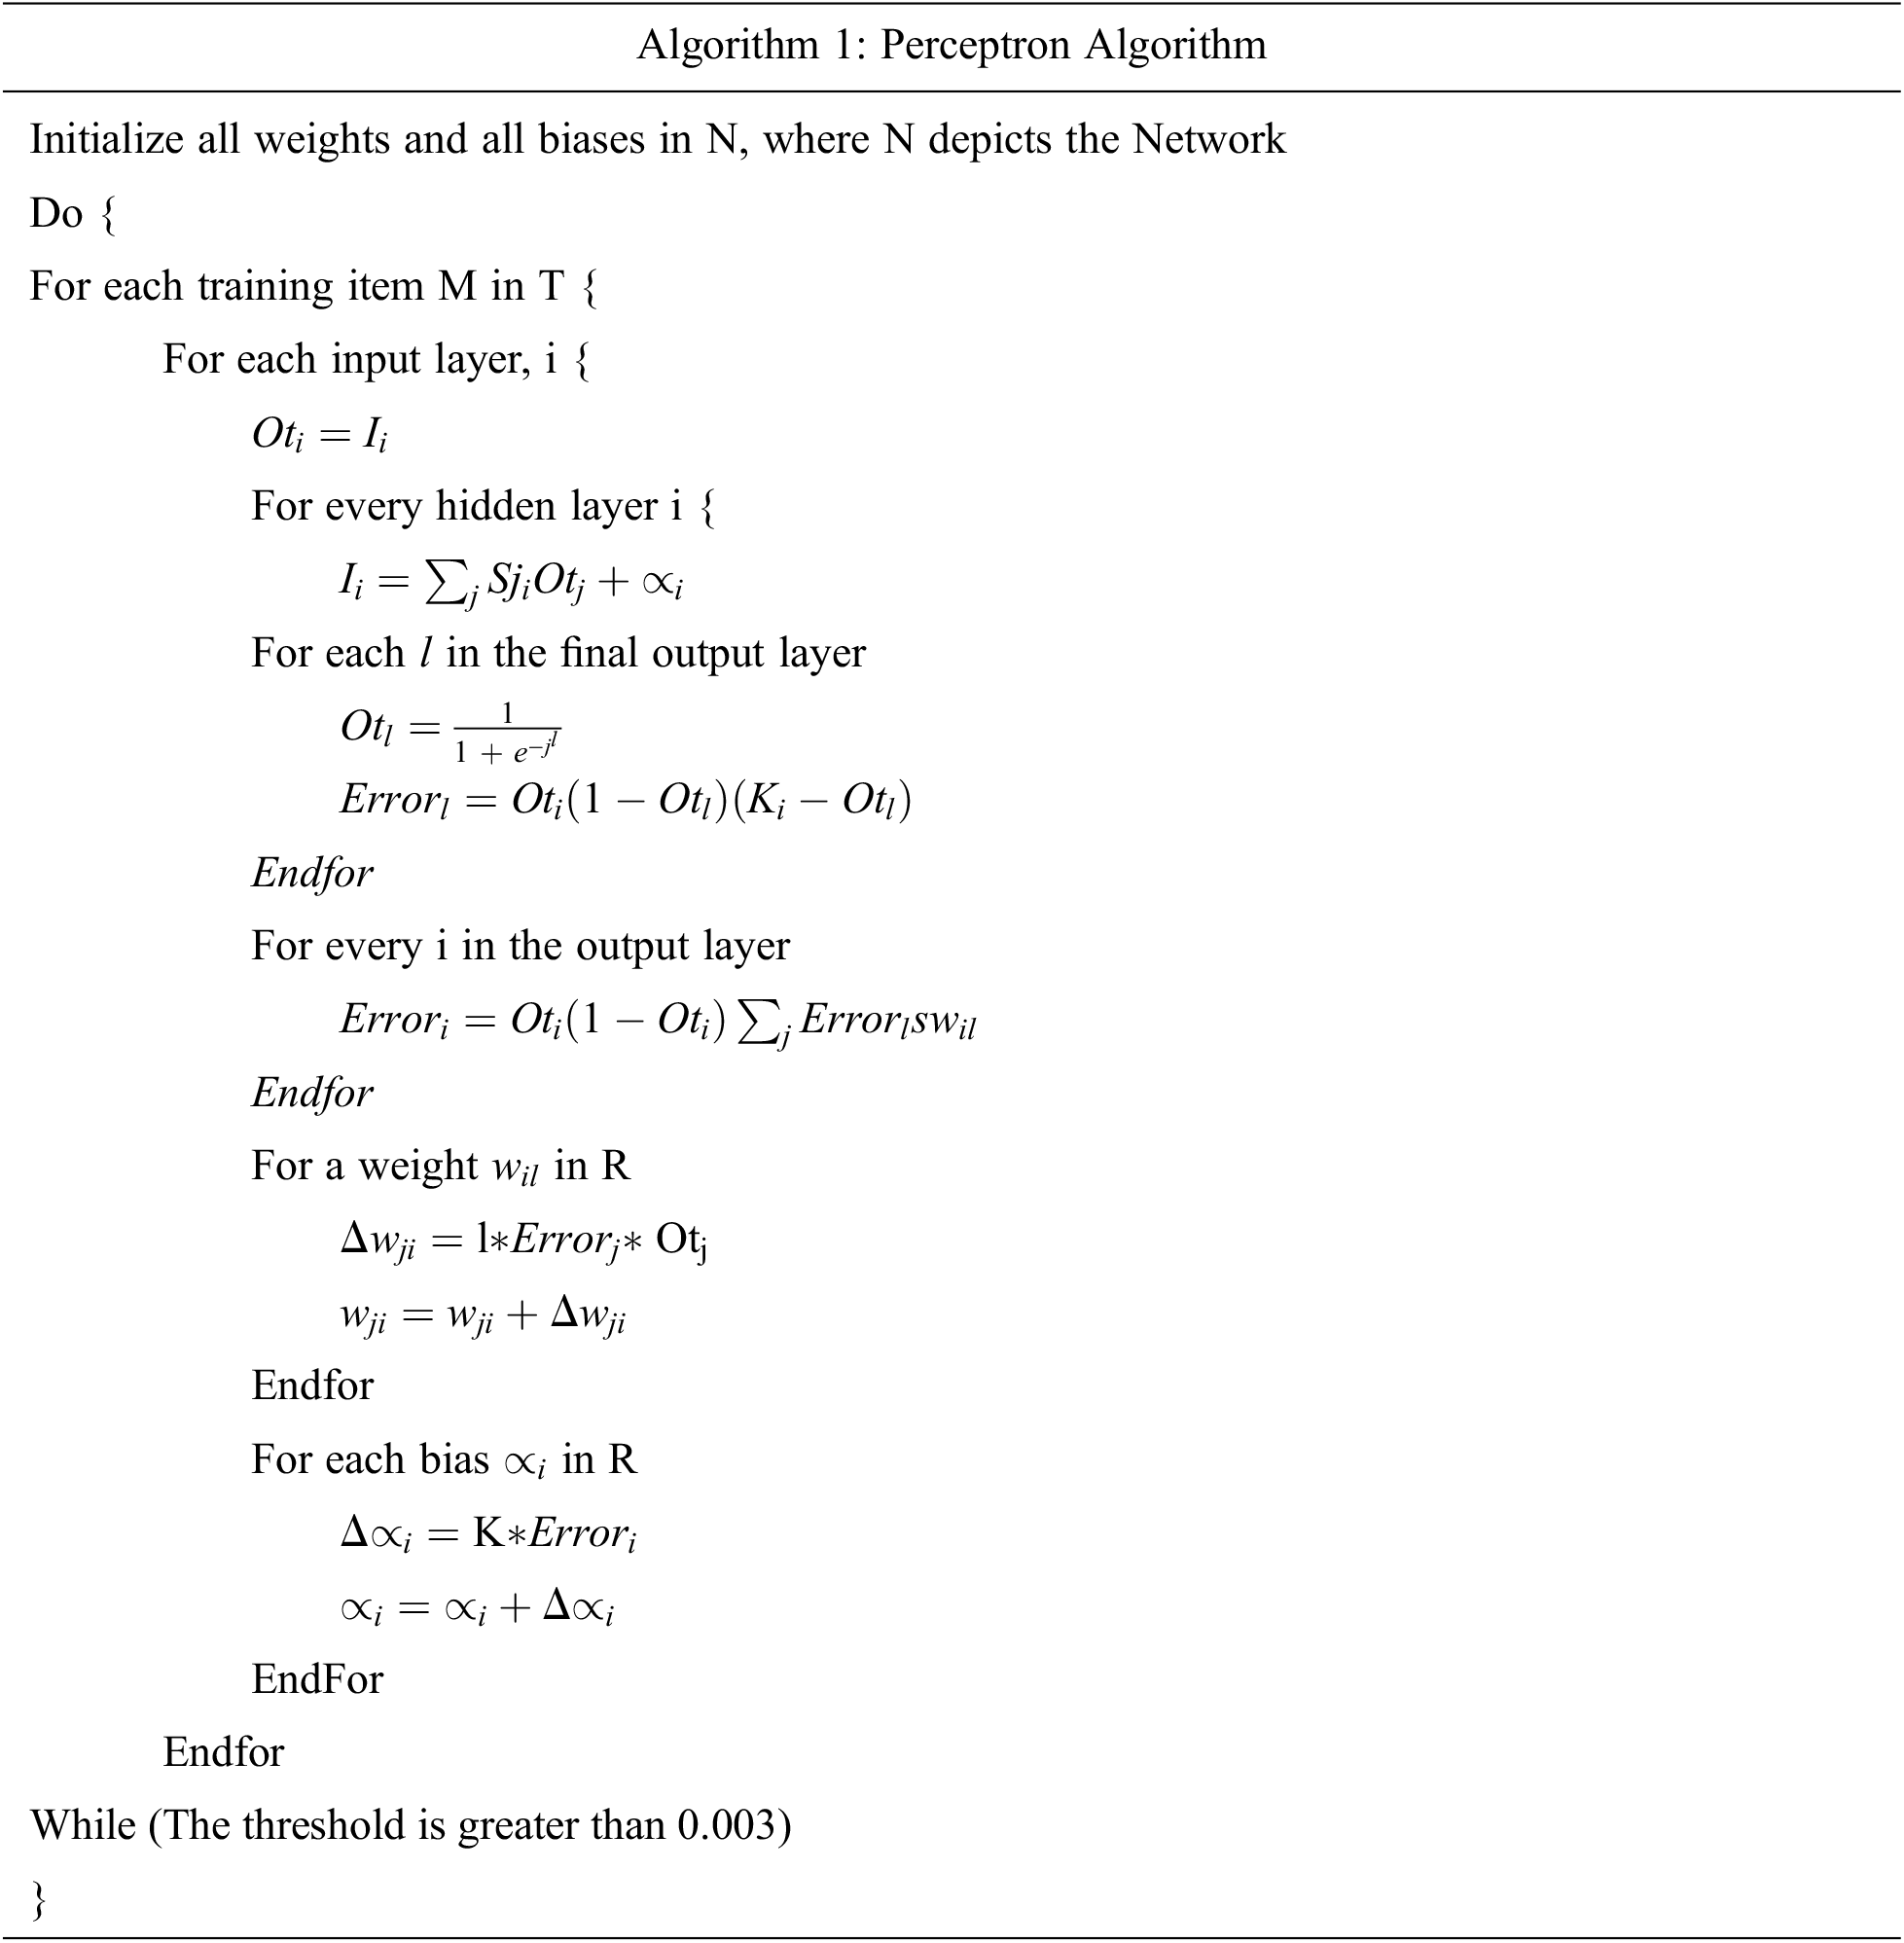
As depicted in Algorithm 1, the perceptron with multiple layers’ algorithm consists of neurons, and hidden multi-layers for the binary classification modeling. For each convolution neuron, a perceptron algorithm utilizes activation. Therefore, the functions perception modeling is presented as biological neuronal models, which utilize the perceptron activation layers in neurons. The activation formula defines the weights for the neuron inputs and decreases the count of layers to two or three layers, by changing the weights that are allocated to a perceptron neuron.
The hypothesis, in our research, has a mathematical model that is derived from the prognosis formula,
The prediction was passed from patient pre-charge data from clinical factors
As depicted in Eq. (11), where
The likelihood formula for cardiac occurrences has been proposed in our research. It should be noted that, there has been no substantial increase in the cardiac occurrences probability per day. The prediction of the continuing cardiac occurrences likelihood per day is defined as follows:
As depicted in Eq. (12), where
The survival curve is formulated as depicted in the following equation,
A mathematical formula is defined that accurately computes the likelihood probability of the hospitalized patient’s medical results who are discharged after correct diagnosis. The likelihood probability of potential cardiac occurrences can be predicted by utilizing the current data. The D-CNN model has been employed on the Medical Platform (IoT), which helps clinicians to diagnose cardiac patient’s cases in the cloud medical platform efficiently and the experimental results prove that a flexible model with hyper-parameters can attain an accuracy of 97.11%.
The Internet of Things IoT medical platform for cardiac disease prediction. Recent research has presented that Internet of Things sensors are successfully incorporated into different paradigms, especially emergent health care, where the IoT Medical platform (IoT-M) is usually employed. IoT-M monitors heart pulse, hypertension, oxygen levels, and glucose readings using an oximeter. our paper proposes an Internet of Things medical platform that employs fitness tracking to collect medical data of a patient using blood pressure, heart pulse, and ECG data. The platform can drive signals with complete data to healthcare physicians handing accurate profile of healthcare. This paper proposes an effective approach for the modern busy world. The test results are discussed in next section.
The experiments are performed employing the dataset (DS1) which includes data about elderly patients with heart diseases in [27]. The data is partitioned into three folds 70% for training, 15% for validation and 15% for testing. The experiments are performed on Intel Core i19 running at 9.6 GHz with 64 GB RAM. Python language was used to implement the model. We performed training by using 80 epochs for the deep learning D-CNN model. Fig. 5 depicts the region of interest of cardiac patient images. We utilized Fourier series analyses for each slice to mine the medical image, which represent the maximum rate activity at the matching heart pulse frequency. Fig. 5a is the patient heart image with region of interest, Fig. 5b depicts the Fourier transform image. Fig. 5c depicts the likelihood slice across all images. The center of the left ventricle has been removed by incorporating the Hough transform with kernel voting model with the blood pressure (bP).
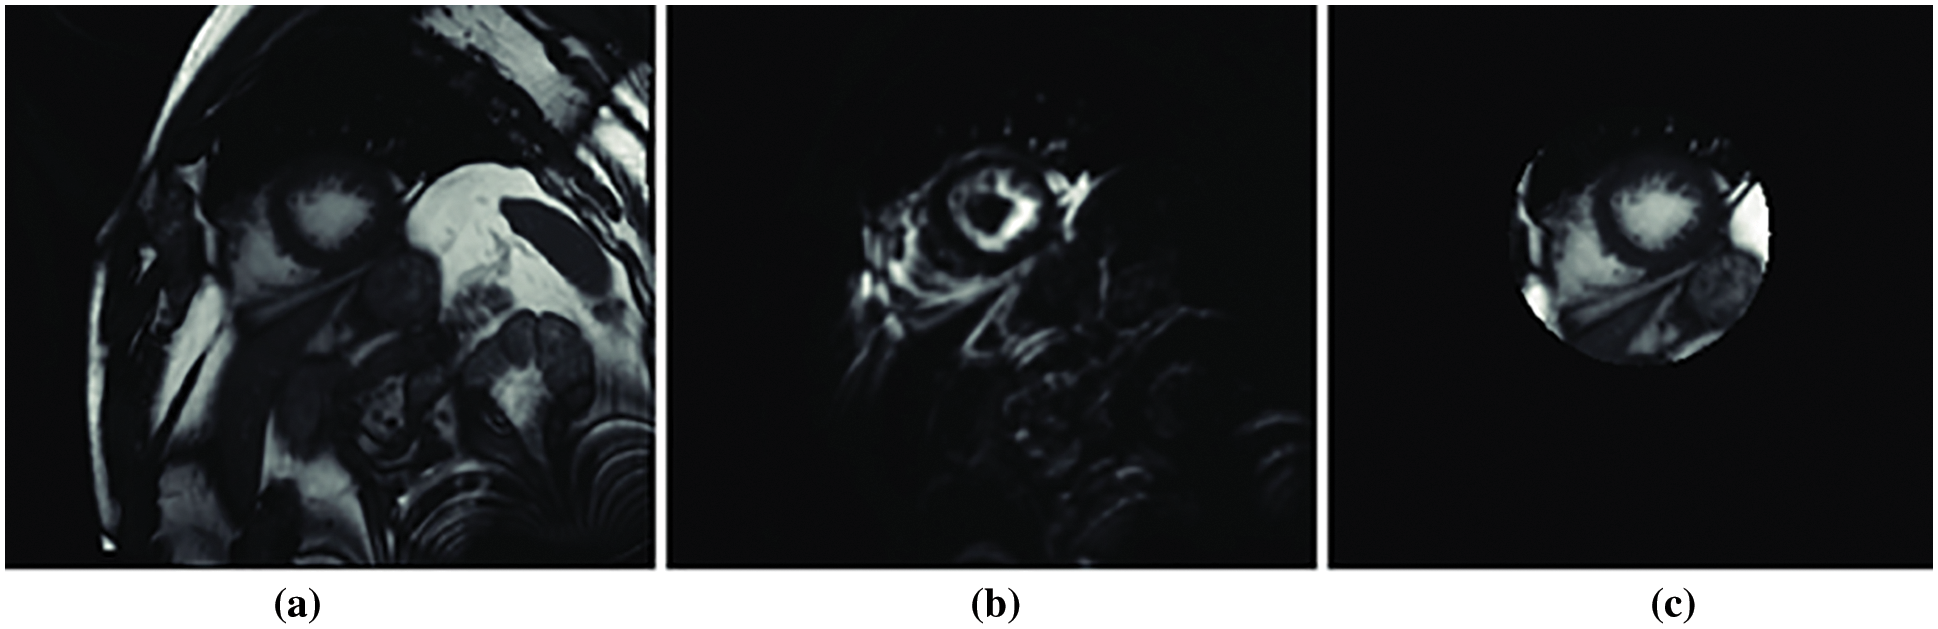
Figure 5: Fourier transform of the region of interest (a) patient heart image with region of interest, (b) Fourier transform image and (c) likelihood slice across all images [27]
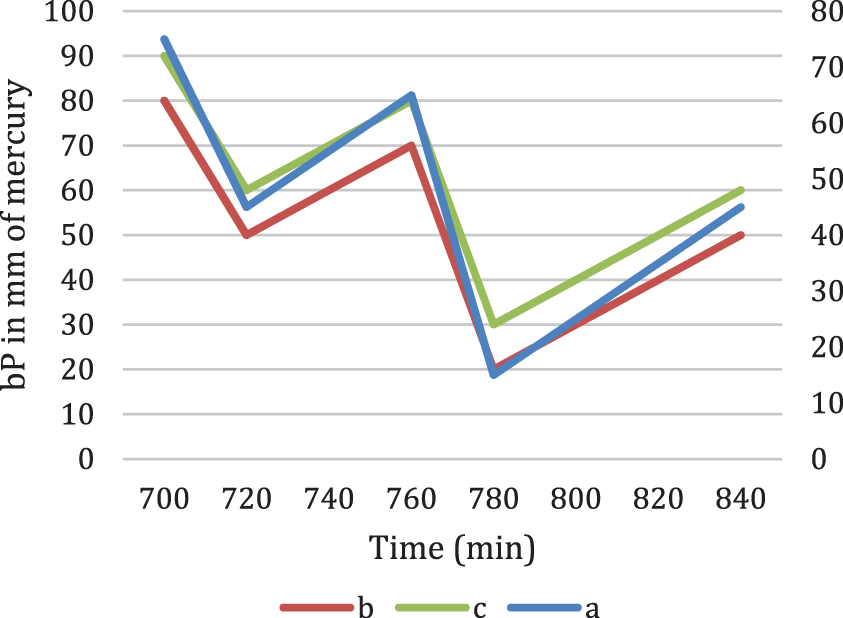
Figure 6: Fourier series transform of bP in mm of mercury
This research employs a deep learning model for cardiac diseases risk factor prediction and risk classification. It pursues to enhance the classification accuracy of cardio disease risk with an ensemble model. Ensemble classification model delivers higher precision and flexibility, even for unstructured data, than traditional classification. The proposed D-CNN architecture is a beneficial tool in heart disease recognition for medical doctors. An extra phase of feature selection was presented to enhance accuracy. The accuracy is calculated as follows:
where, TP denotes the count of true positives, FP denotes the count of false positives, whereas TN denotes the count of true negatives and FN denotes the count of false negatives.
Fig. 6 denotes the Fourier series transform for the three cases in Fig. 5.
While, Fig. 7 depicts the proposed model accuracy ratio.
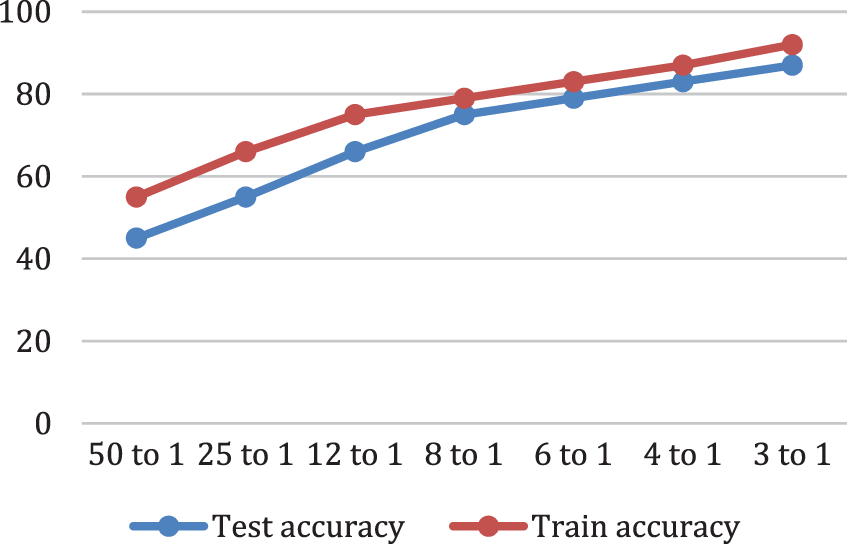
Figure 7: Classification Accuracy analysis. Test accuracy of a model is computed on new cases not used in the training phase Accuracy is defined as the ratio of the correct number of classified cases to the total number of classified cases, train accuracy of a model is computed on the cases it was trained on
We used two performance metrics namely sensitivity and specificity and they are calculated as follows:
A sensitivity percentage of 97.51% is the substantial result because it specifies the highest likelihood of true positive case results in patients with cardiac disease, which implies an accurate 97.11% cardiac disease diagnosis for a new case with undiagnosed cardiac disease in the hospital. A timely and precise prediction of cardiac disease is crucial for timely intervention and increase survival time and rate, this high sensitivity together with the comparatively high 0.8681 and 0.8977 AUC curves indicates a high precision in the cardiac diseases diagnosis in the developed deep learning model. The cardiac disease diagnostic specificity percentage is 95.1%.
Figs. 8a and 8b depicts the sensitivity and the specificity of the proposed model compared to other models. Also, the analysis ratio for the Sensitivity/Specificity ratios is depicted for various models. The Sensitivity formula values identify cardiac disease cases by the last layer classifier. The specificity ratio is utilized to decide the classification ability to verify true negative cardiac arrests.
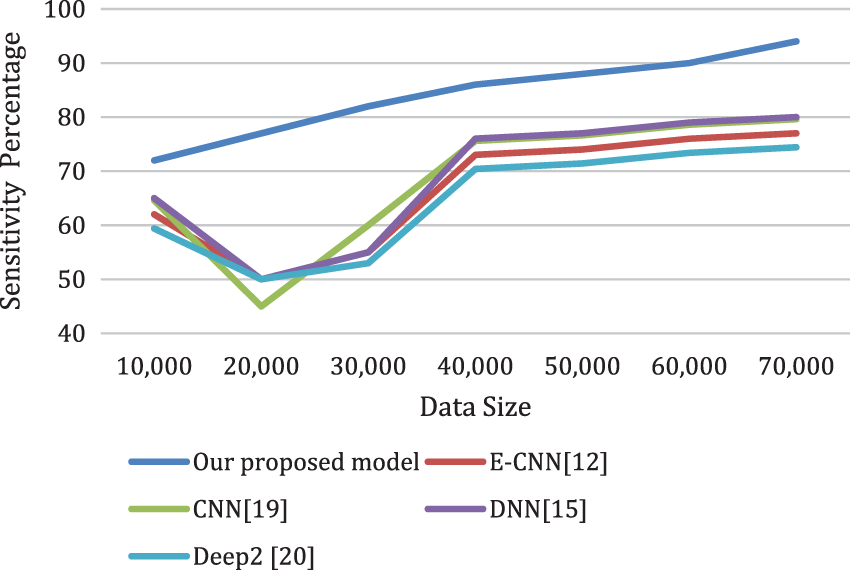
Figure 8a: The sensitivity of the proposed model compared to other models for different data sizes
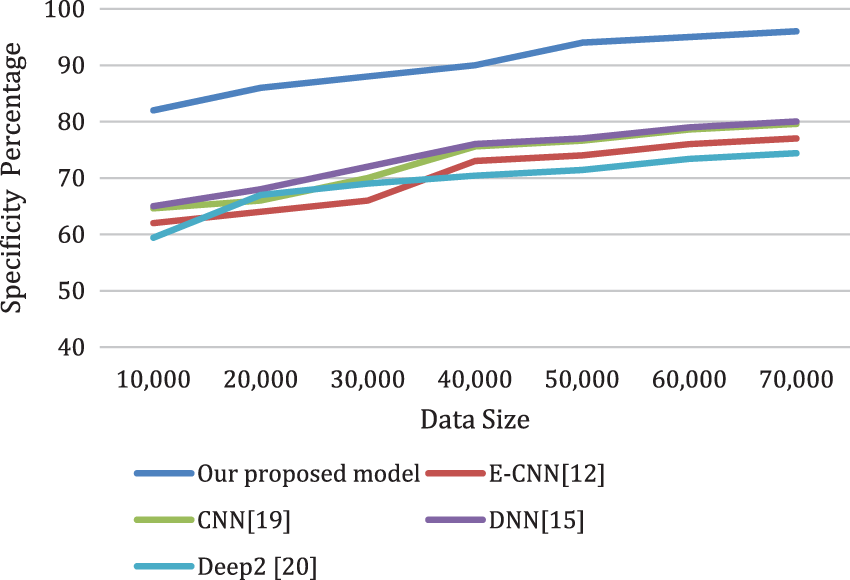
Figure 8b: The specificity of the proposed model compared to other models for different data sizes
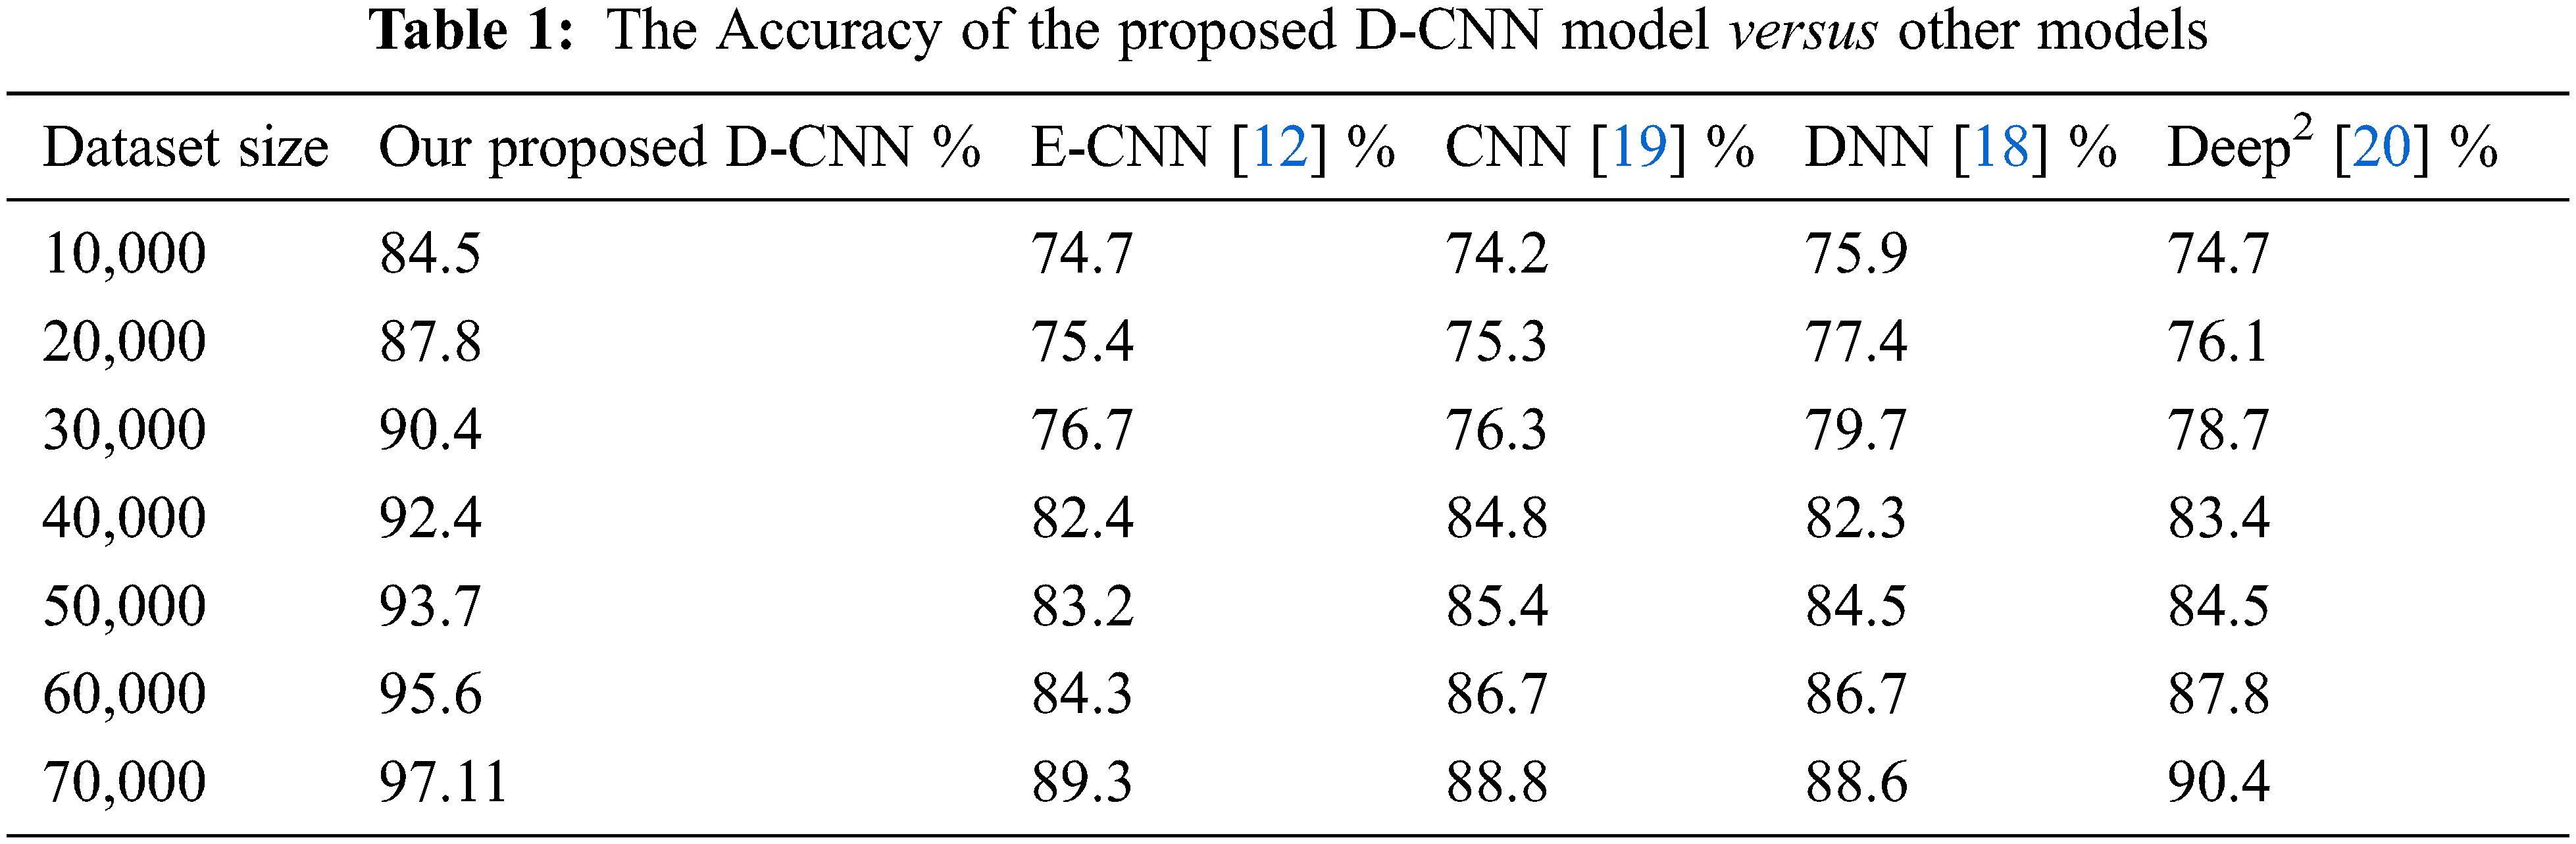
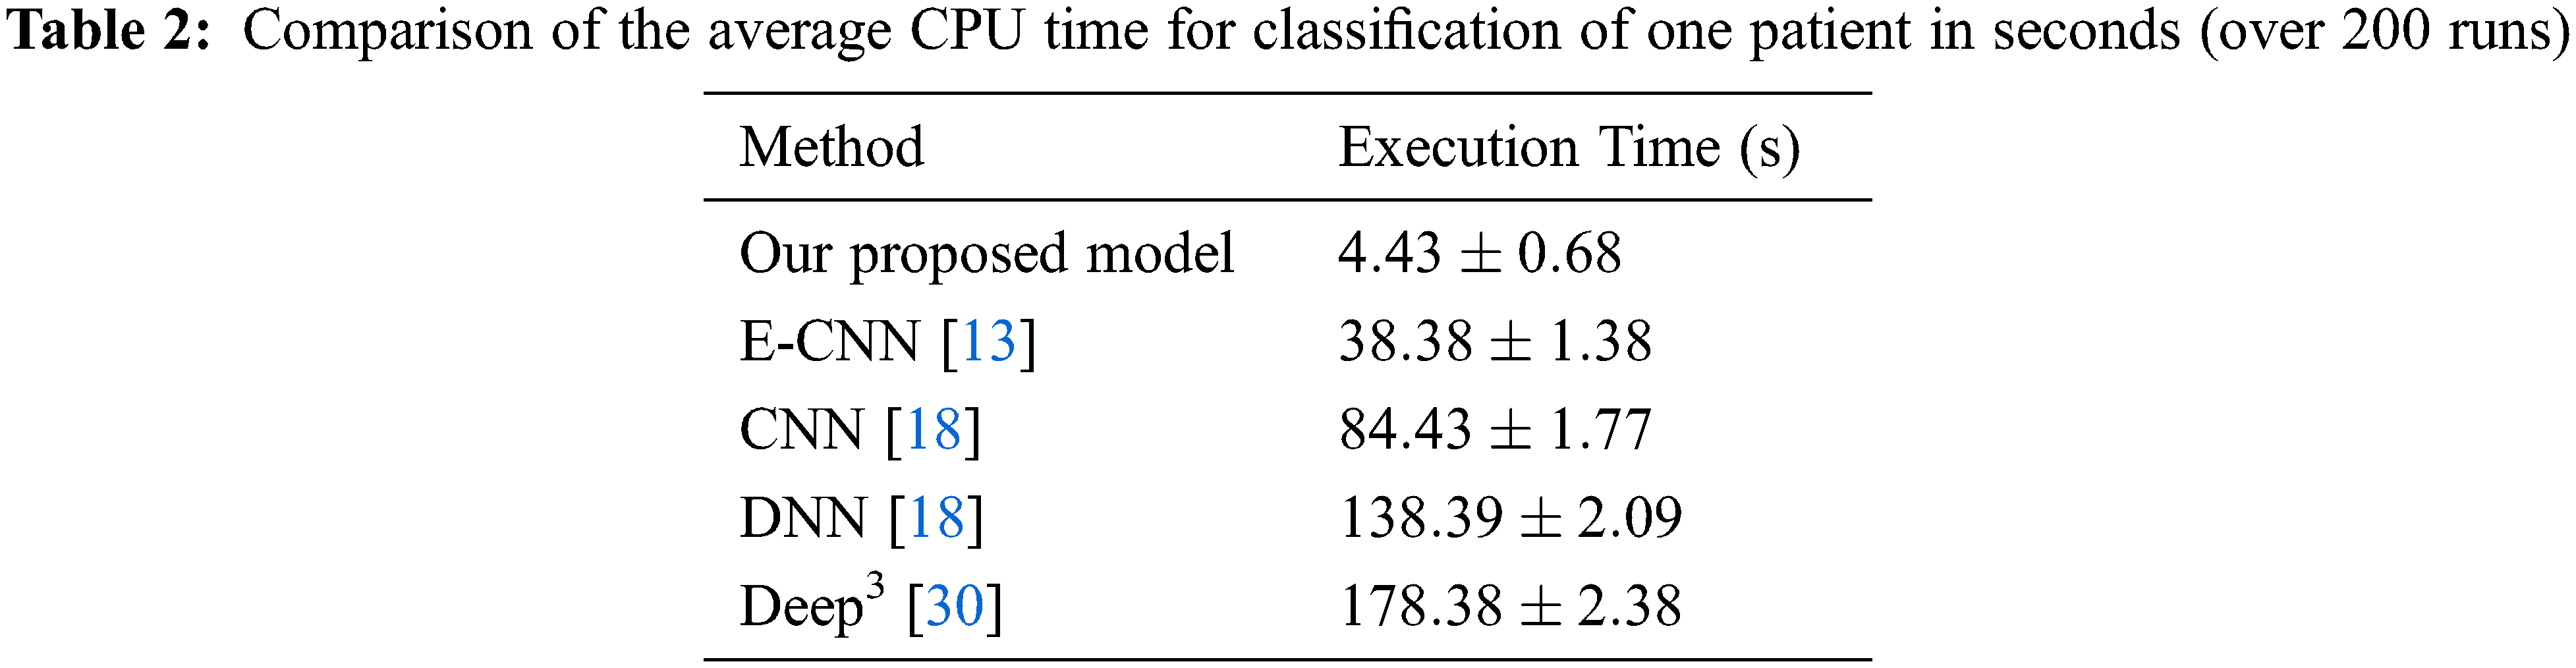
The deep CNN model’s efficiency depends on the DNN classifier choice during the training phase. In this research, after the conclusion of the training phase, the weights and the biases of the deep learning prediction were tuned from the deep learning model. The dataset is partitioned into a training and a testing dataset, and the training set is utilized to form classifiers. While, the testing set verified the efficiency. Tab. 1 depicts the efficiency percentage of the proposed D-CNN model versus other models. Tab. 2 displays the CPU time required by our model versus other models.
This paper proposed a Deep learning CNN model for heart disease Classification. The heart disease detection performance with 96 percent confidence using accuracy and specificity metrics. The proposed deep learning classification neural model has a deep learning mode for prediction with non-linear regularized learning. The proposed model can, therefore, perform with high accuracy and reliability. and can reduce the miss ratio. The model can aid patients and medical professionals globally to help the public in developing regions with few medical personnel for heart disease. We employed feature extraction to enhance the accuracy of the proposed technique. The feature extraction technique has added to the precision of the deep learning model. The model performance is verified with a full and minimum set of features. Less features enhance the processing time of the classification process while the accuracy is compromised. The performance of classifiers with less features has been analyzed with experimental results. Experimental results demonstrate that flexible modeling and tuning of the hyperparameters can attain an accuracy of up to 97.11%.
Though, the limitation of this study is the lack of investigating the bandwidth performance for the internet of things using our platform which would be very crucial for future study.
Acknowledgement: We would like to thank for funding our project: Princess Nourah bint Abdulrahman University Researchers Supporting Project number (PNURSP2022R113), Princess Nourah bint Abdulrahman University, Riyadh, Saudi Arabia.
Funding Statement: This research was funded by Princess Nourah bint Abdulrahman University Researchers Supporting Project number (PNURSP2022R113), Princess Nourah bint Abdulrahman University, Riyadh, Saudi Arabia.
Conflicts of Interest: Authors declare there is no conflicts of interest.
1. R. Zhang, S. Ma, L. Shanahan, J. Munroe, S. Horn et al., “Automatic methods to extract New York heart association classification from clinical notes,” in Proc. of the 2017 IEEE Int. Conf. on Bioinformatics and Biomedicine (BIBM), Kansas City, MO, USA, IEEE, pp. 1296–1299, 2017. [Google Scholar]
2. G. Parthiban and S. K. Srivatsa, “Applying machine learning methods in diagnosing heart disease for diabetic patients,” International Journal of Applied Information Systems, vol. 3, no. 7, pp. 25–30, 2012. [Google Scholar]
3. E. Keogh and A. Mueen, “Curse of dimensionality,” in Encyclopedia of Machine Learning and Data Mining, C. Sammut, G. I. Webb (eds.Cham, Switzerland: Springer, 2017. [Google Scholar]
4. A. Danelakis, T. Theoharis and D. Verganelakis, “Survey of automated heart disease lesion segmentation techniques on magnetic resonance imaging,” Computerized Medical Imaging and Graphics, vol. 5, no. 3, pp. 439–442, 2020. [Google Scholar]
5. L. Farhi, R. Zia and Z. Ali, “Performance analysis of machine learning classifiers for heart disease,” Sirsyed University Research Journal of Engineering and Technology, vol. 8, no. 1, pp. 23–28, 2020. [Google Scholar]
6. M.-S. Yang and Y. Nataliani, “A feature-reduction fuzzy clustering algorithm based on feature-weighted entropy,” IEEE Transactions on Fuzzy Systems, vol. 26, no. 2, pp. 817–835, 2018. [Google Scholar]
7. R. Chen, N. Sun, X. Chen, M. Yang and Q. Wu, “Supervised feature selection with a stratified feature weighting method,” IEEE Access, vol. 6, pp. 15087–15098, 2018. [Google Scholar]
8. M. Imani and H. Ghassemian, “Feature extraction using weighted training samples,” IEEE Geoscience and Remote Sensing Letters, vol. 12, no. 7, pp. 1387–1391, 2015. [Google Scholar]
9. H. Liu and H. Motoda, Feature Extraction, Construction and Selection. Cham, Switzerland: Springer, 1998. [Google Scholar]
10. B. Dun, E. Wang and S. Majumder, “Heart disease diagnosis on medical data using ensemble learning,” IEEE Access, vol. 8, pp. 189503–189512, 2020. [Google Scholar]
11. R. S. Singh, B. S. Saini and R. K. Sunkaria, “Detection of coronary artery disease by reduced features and extreme learning machine,” Medicine and Pharmacy Reports, vol. 91, no. 2, pp. 166–175, 2018. [Google Scholar]
12. C. Loizou, E. Kyriacou, I. Seimenis, M. Pantziaris, S. Petroudi et al., “Classification of heart diseases subjects for the prognosis of future disability,” Intelligent Decision Technologies, vol. 7, no. 1, pp. 3–10, 2021. [Google Scholar]
13. C. Loizou, V. Murray, M. Pattichis, I. Seimenis, M. Pantziaris et al., “Multiscale Amplitude-Modulation Frequency-Modulation (AM-FM) texture analysis of congestive heart disease,” IEEE Transactions on Information Technology in Biomedicine, vol. 15, no. 1, pp. 119–129, 2020. [Google Scholar]
14. R. Rajagopal and V. Ranganathan, “Evaluation of effect of unsupervised dimensionality reduction techniques on automated arrhythmia classification,” Biomedical Signal Processing and Control, vol. 34, no. 1, pp. 1–8, 2017. [Google Scholar]
15. D. Zhang, L. Zou, X. Zhou and F. He, “Integrating feature selection and feature extraction methods with deep learning to predict clinical outcome of breast cancer,” IEEE Access, vol. 6, pp. 28936–28944, 2018. [Google Scholar]
16. S. Negi, Y. Kumar and V. M. Mishra, “Feature extraction and classification for EMG signals using linear discriminant analysis,” in Proc. of the 2016 2nd Int. Conf. on Advances in Computing, Communication, & Automation (ICACCA) (Fall), Bareilly, India, IEEE, 2016. [Google Scholar]
17. D. Valencia, F. Tabares, D. Medina, I. Llorente and G. Dominguez, “TFR-based feature extraction using PCA approaches for discrimination of heart murmurs,” in Proc. of the 2009 Ann. Int. Conf. of the IEEE Engineering in Medicine and Biology Society, Minneapolis, MN, USA, IEEE, pp. 5665–5668, 2009. [Google Scholar]
18. UCI Machine Learning Repository, “Heart disease data set,” 2020. [Online]. Available: http://archive.ics.uci.edu/ml/datasets/heart+disease. [Google Scholar]
19. R. Williams, T. Shongwe, A. N. Hasan and V. Rameshar, “Heart disease prediction using machine learning techniques,” in Proc. Int. Conf. on Data Analytics for Business and Industry (ICDABI), Paris, France, pp. 118–123, 2021. [Google Scholar]
20. M. Khan, Q. Yaseen, A. Mumtaz, A. Saleem, S. Ishaq et al., “Severe analysis of cardiac disease detection using the wearable device by artificial intelligence,” in Proc. 2020 IEEE Int. Conf. for Innovation in Technology (INOCON), Cairo, Egypt, pp. 1–8, 2020. [Google Scholar]
21. S. S. Khan and S. M. K. Quadri, “Prediction of angiographic disease status using rule based data mining techniques,” Biological Forum—An International Journal, vol. 8, no. 2, pp. 103–107, 2016. [Google Scholar]
22. S. Kumar, “Predicting and diagnosing of heart disease using machine learning algorithms,” International Journal of Engineering and Computer Science, vol. 6, no. 6, pp. 2319–7242, 2017. [Google Scholar]
23. R. Das, I. Turkoglu and A. Sengur, “Effective diagnosis of heart disease through neural networks ensembles,” Expert Systems with Applications, vol. 36, no. 4, pp. 7675–7680, 2009. [Google Scholar]
24. K. Srinivas, G. Raghavendra Rao and A. Govardhan, “Analysis of coronary heart disease and prediction of heart attack in coal mining regions using data mining techniques,” in Proc. of 2010 5th Int. Conf. on Computer Science & Education, Hefei, China, IEEE, pp. 1344–1349, 2010. [Google Scholar]
25. N. G. B. Amma, “Cardiovascular disease prediction system using genetic algorithm and neural network,” in Proc. of the 2012 Int. Conf. on Computing, Communication and Applications, Dindigul, India, IEEE, 2012. [Google Scholar]
26. T. Santhanam and E. P. Ephzibah, “Heart disease classification using PCA and feed forward neural networks,” in Mining Intelligence and Knowledge Exploration. Cham, Switzerland: Springer, 2013. [Google Scholar]
27. A. K. Gárate-Escamila, A. Hajjam El Hassani and E. Andrès, “Classification models for heart disease for elderly patients’ prediction using feature selection and PCA,” Informatics in Medicine Unlocked, vol. 19, p. 100330, 2020. [Google Scholar]
28. P. Ramprakash, R. Sarumathi, R. Mowriya and S. Nithyavishnupriya, “Heart disease prediction using deep neural network,” in Proc. of the 2020 Int. Conf. on Inventive Computation Technologies (ICICT), Coimbatore, India, IEEE, pp. 666–670, 2020. [Google Scholar]
29. B. Aman Kanksha, P. Sagar, M. Rahul and K. Aditya, “An intelligent unsupervised technique for fraud detection in health care systems,” Intelligent Decision Technologies, vol. 15, no. 1, pp. 127–139, 2021. [Google Scholar]
30. K. Divya, A. Sirohi, S. Pande and R. Malik, “An IoMT assisted heart disease diagnostic system using machine learning techniques,” Cognitive Internet of Medical Things for Smart Healthcare, vol. 3, no. 11, pp. 145–161, 2021. [Google Scholar]
 | This work is licensed under a Creative Commons Attribution 4.0 International License, which permits unrestricted use, distribution, and reproduction in any medium, provided the original work is properly cited. |