DOI:10.32604/jai.2022.027730
| Journal on Artificial Intelligence DOI:10.32604/jai.2022.027730 | |
| Article |
Application of BP Neural Network in Classification and Prediction of Blended Learning Achievements
1School of Automation, Nanjing University of Information Science & Technology, Nanjing, 210044, China
2School of Automation, Wuxi University, Wuxi, 214105, China
*Corresponding Author: Liu Zhang. Email: 1797584210@qq.com
Received: 24 January 2022; Accepted: 01 March 2022
Abstract: Analyzing and predicting the learning behavior data of students in blended teaching can provide reference basis for teaching. Aiming at weak generalization ability of existing algorithm models in performance prediction, a BP neural network is introduced to classify and predict the grades of students in the blended teaching. L2 regularization term is added to construct the BP neural network model in order to reduce the risk of overfitting. Combined with Pearson coefficient, effective feature data are selected as the validation dataset of the model by mining the data of Chao-Xing platform. The performance of common machine learning algorithms and the BP neural network are compared on the dataset. Experiments show that BP neural network model has stronger generalizability than common machine learning models. The BP neural network with L2 regularization has better fitting ability than the original BP neural network model. It achieves better performance with improved accuracy.
Keywords: Blended teaching; student performance prediction; BP neural network; binary prediction
The wide application of Chao-Xing, Jreenity and other high-quality online wisdom teaching platforms in the process of university teaching has greatly promoted the development of blended teaching from concept to realities [1,2]. As a new teaching mode combining online and offline, blended teaching not only exerts the leading role of teachers by assigning tasks and uploading resources on the wisdom teaching platform, but also promotes students to learn actively. Students can log in to the learning platform in a variety of ways without time and space constraints, their learning behavior data are recorded on the platform. These data reflect the learning state and habits of students. which have an important impact on the final academic performance [3,4]. Blended learning has high requirements for self-discipline of students [5]. In the process of actual implementation, participation of students is uneven due to the interference of various factors [6]. Therefore, how to use the learning behavior data to analyze learning status of students, and guide students to study actively has become an urgent problem to be solved in teaching management.
By mining and analyzing learning behavior data, the hidden rules can be exposed, with which the grades of students can be classified and predicted. Then the students with learning difficulties can be found and intervened timely, which is helpful to improve the teaching quality [7]. Scholars have presented the methods of predicting academic performance based on online learning behavior data. Yu et al. [8] used SVM to predict academic performance and realized early academic warning. Lv et al. [9] compared the prediction effects of classification algorithms such as perceptron and SVM. It is found that the score prediction model based on SVM has higher accuracy. Wang et al. [10] used 10 behavioral features such as login times and length of video viewing time to verify the effectiveness of k-nearest neighbor optimization algorithm in predicting MOOC academic performance. Jia et al. [11] used MOOC course data and rapid miner big data mining platform to build an academic performance prediction model based on AdaBoost algorithm. Song et al. compared the effects of four different algorithm models SVR, RF, GBDT and XGboost in academic performance prediction through experiments. Finally, it is concluded that XGboost algorithm with integrated features has the best prediction [12]. Cortez et al. [13] used the information provided by Minho University to predict the grades of students by decision tree, random forest and support vector machine in three forms: binary classes, five classes according to average, and average. The results showed that if the historical scores of the previous semester are available, the scores of the next semester are predictable. Xing et al. [14] developed a model based on genetic programming to predict at-risk students by using data from the GeoGebra software in a sample of students from a Mathematics course. Azcona et al. [15] developed a predictive model using k-nearest neighbor, random forest, logistic regression and so on to detect at-risk students in some subjects based on their weekly assignment and to simultaneously support adaptive feedback. However, fitting effects of these methods are not ideal, it is hard to accurately predict learning achievement of students. So neural network-featured prediction methods with enhanced nonlinear modeling capability are applied. BP (Back Propagation) neural network is a multi-layer feed forward network based on error back propagation [16], which is one of the most widely used neural networks so far. However, most of these models are linear, and the learning behavior features in blended teaching are complex, which has a nonlinear relationship with the prediction results, resulting in a relatively large prediction error of the traditional linear prediction model. BP neural network has very strong nonlinear mapping ability, which can better predict the grade of students nonlinearly.
In order to improve the generalizability of the model, a single-layer hidden layer is used which selects a sigmoid function as the activation function of the hidden layer and a Relu function is used as the activation function of the output layer. A three-layer BP neural network model is constructed. L2 regularization term is added to reduce the risk of overfitting of the neural network. To verify the generalizability of BP neural network model, Bayesian, AdaBoost, and Logistic Regression are used to compare with BP neural network models based on the dataset. Accuracy, recall, precision and F1 score are selected as evaluation indexes of the model. The fitting effect of the model is proved by comparing the accuracy curve and loss curve of BP neural network before and after adding L2 regularization.
The paper is organized as follows: Dataset introduction and data pre-processing are first outlined in Section Feature Engineering. The Implementation of Neural Network Prediction Model is described afterwards, followed by the Experiment and Result Analysis used to evaluate predictive models. A Summary and Future Work is described in Section 5. This section includes the work and significance of this paper and possible future lines of research.
In this section, construction procedure of feature engineering is introduced, including data pre-processing, feature analysis and selection. Finally, all the features used in model training and estimation are presented.
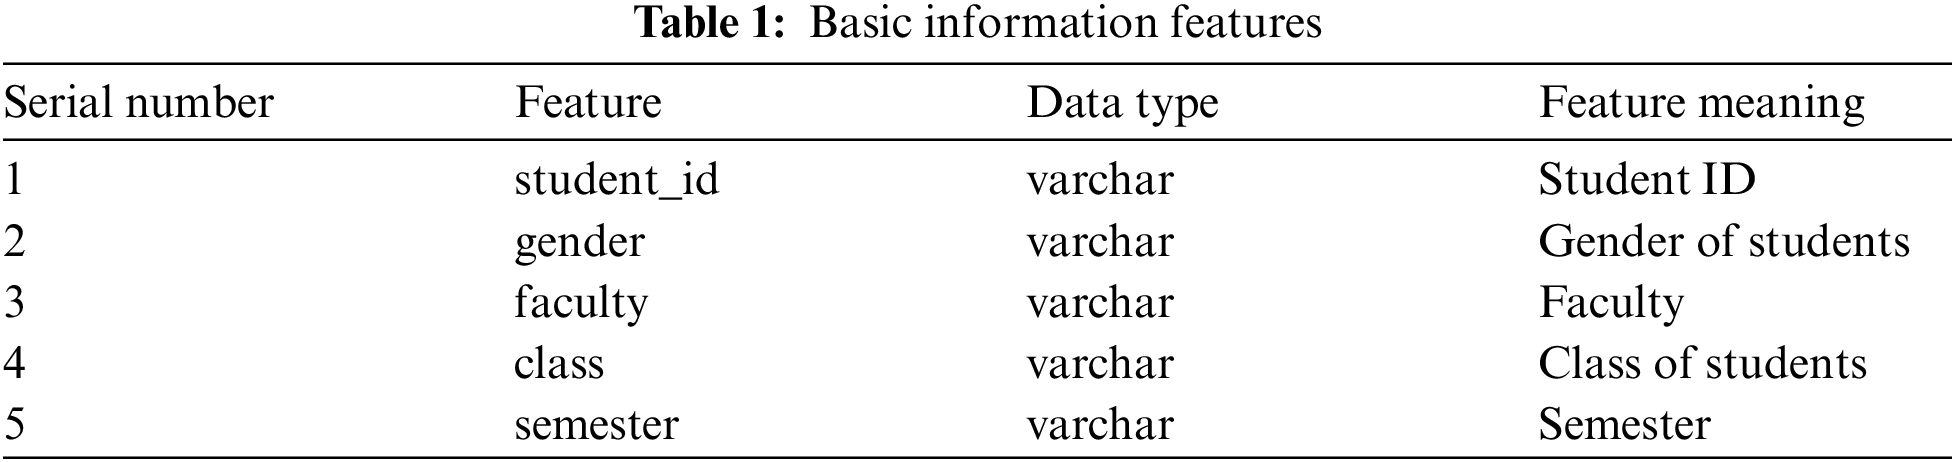
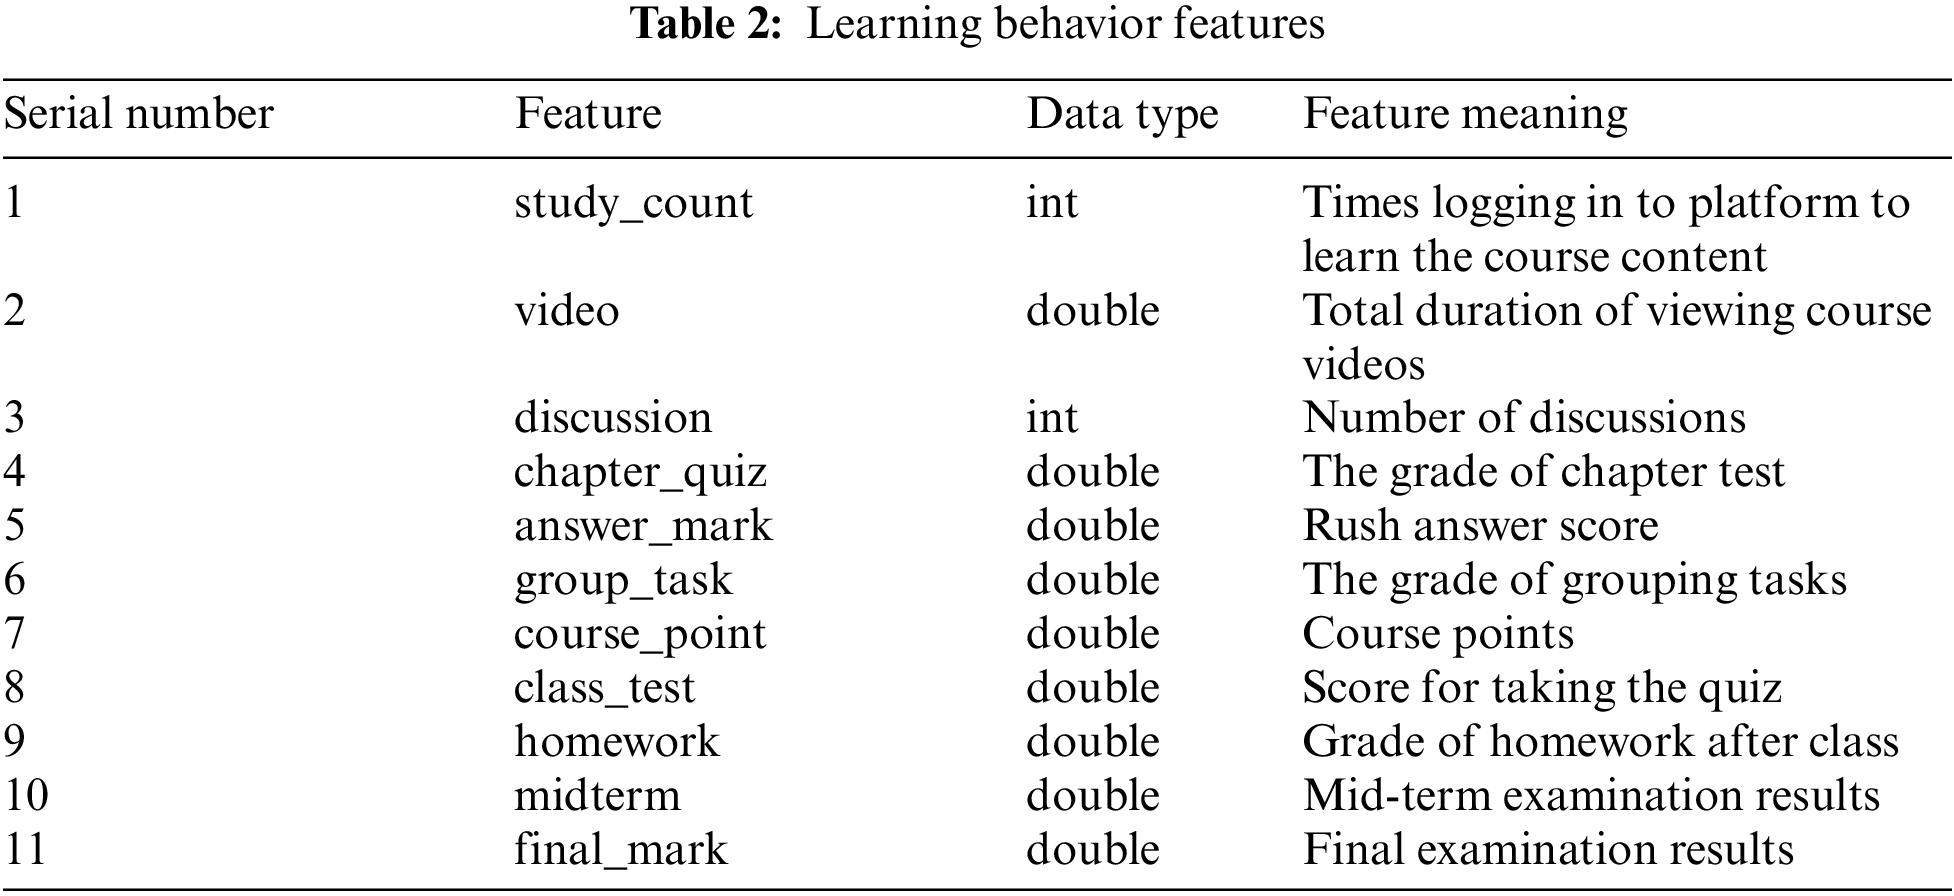
The dataset is collected from the Chao-Xing platform and educational administration system. There are 229 students’ instances, including nearly 60000 online learning records and 229 offline performance records. The student features in the dataset have 16 dimensions, which are divided into two categories, namely basic information features and learning behavior features of students. The description of the student features is shown in Tabs. 1 and 2 respectively.
Due to the diversity of blended learning feature data, it is necessary to pre-process the data according to the features of data and algorithm models. Data pre-processing mainly includes the normalization of feature data which under different assessment standards and the discretization of continuous data.
Different classes have different task points, learning resources and classroom activities in the course of Chao-Xing learning, which results in different ranges of feature values. It is necessary to use the interval scaling method to map the data to the same interval. The interval scaling method is a way of normalization. The interval length of the data is calculated by the two extreme values (maximum and minimum) of the feature data, and the data is scaled on the entire interval in a certain proportion. The scale equation is as follows.
In Eq. (1), x represents the same feature set with m feature variables.
The type of data in the dataset mainly include varchar, int and double. The prediction algorithm used in this paper is implemented by sklearn and other libraries. Sklearn library requires that the data type input into the model must be numerical data. In order to ensure the consistency of the data type, the continuous feature data needs to be discretized by the box operation. Therefore, function cut() in the pandas library is utilized to divide and discretize the int-type and double-type data features in Tab. 2.These features are mapped numerically. Five features data in Tab. 1 are qualitative discrete variables and aredirectly mapped to numerical variables.
2.3 Feature Analysis and Selection
Feature selection is usually required before using model to predict the target. Through feature selection, we can remove irrelevant features, reduce computational complexity and improve the interpretability of the model [17]. In this paper, Pearson coefficient is used to calculate the correlation between features. Pearson coefficient mainly measures the linear correlation between variables, and the value range of the result is [−1, 1]. −1 represents completely negative correlation between the two features and +1 represents complete positive correlation between the two features. There are 16 features in our dataset, including the basic information features and learning behavior features of students. The results of the correlation coefficients are presented in the form of thermodynamic diagram, as shown in Fig. 1.
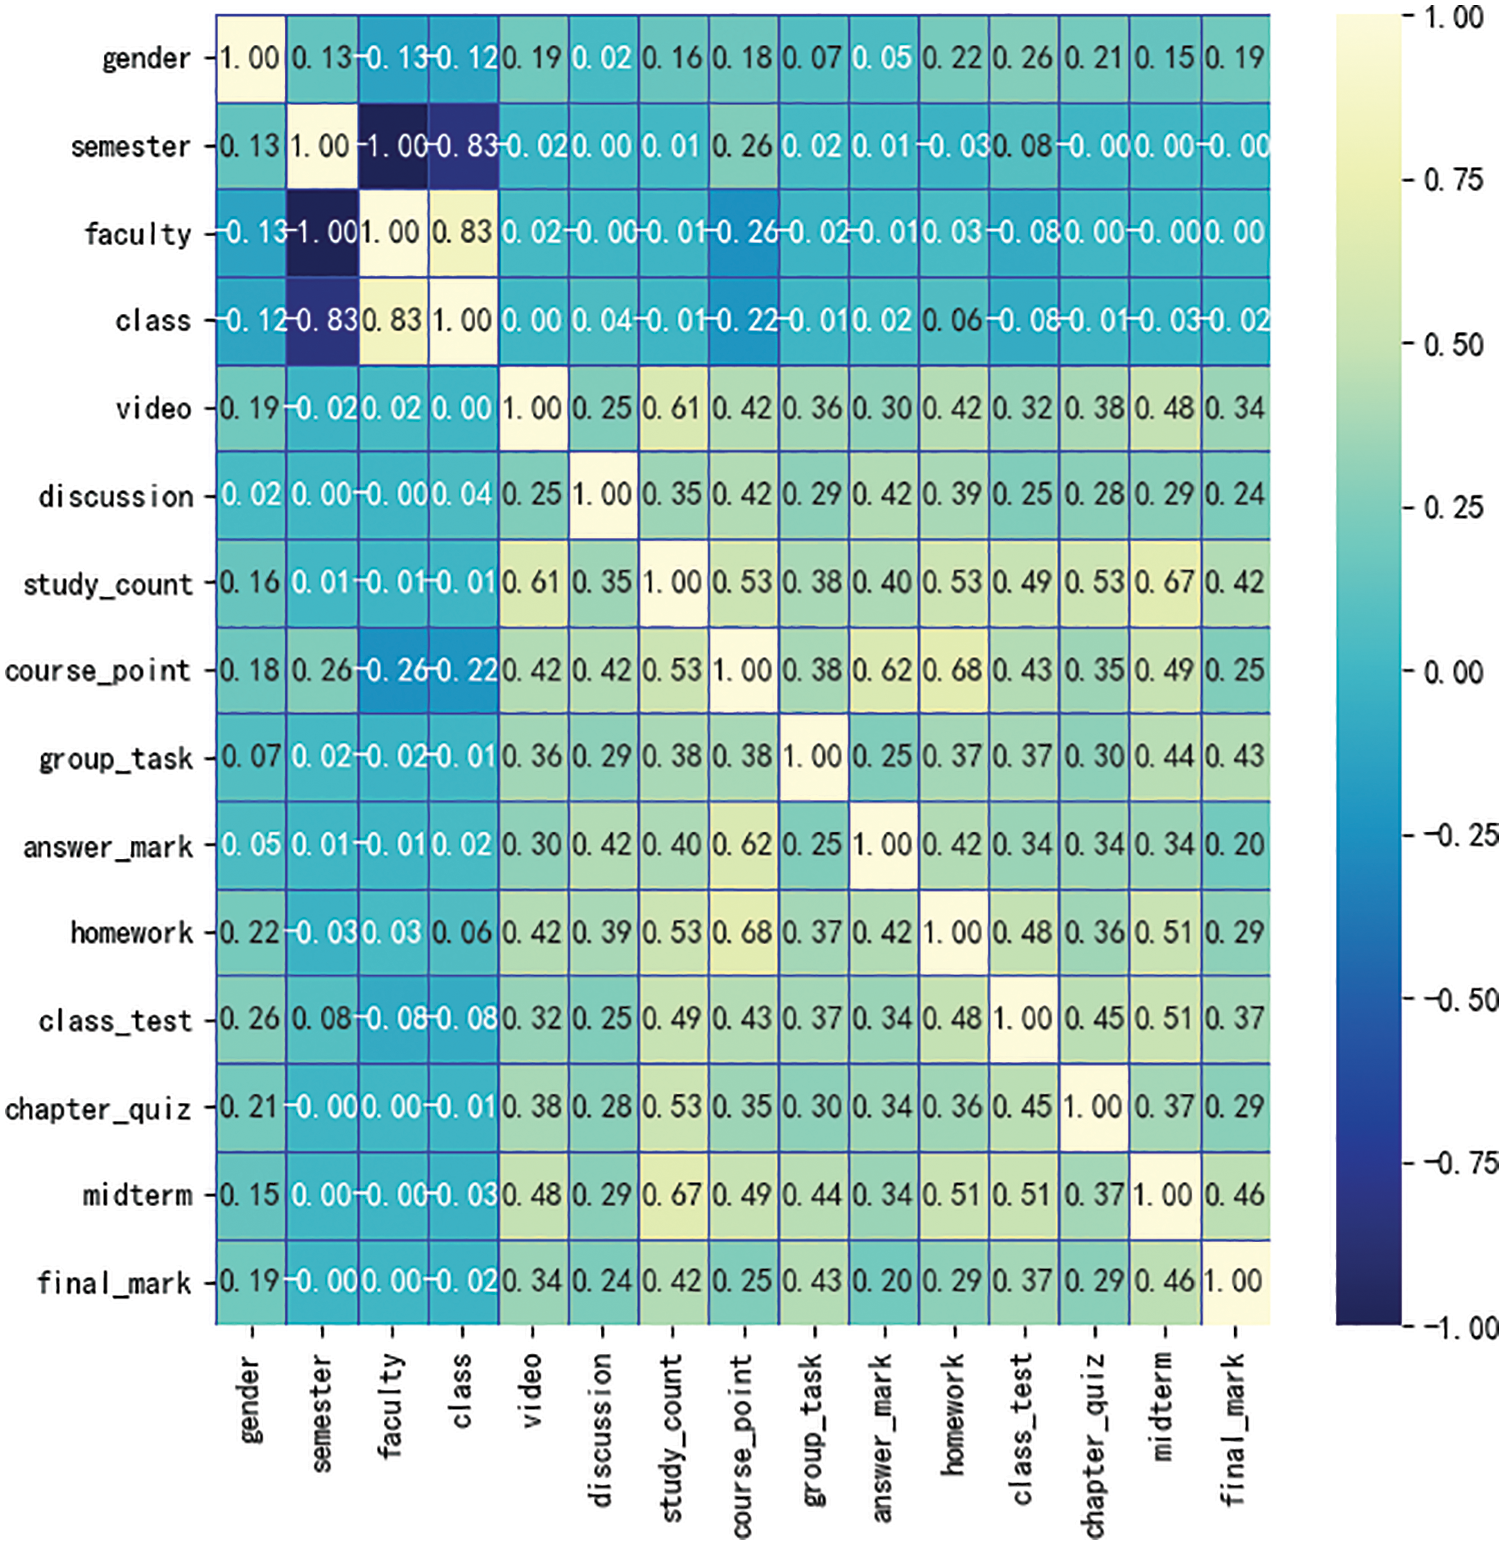
Figure 1: Feature correlation coefficient matrix thermodynamic diagram
The correlation coefficients between semester, gender, faculty, class and target feature fianl_mark are less than 0.2, which means the correlation is weak. The correlation coefficients between semester, faculty and target features fianl_mark are 0, and which indicates that there is no correlation. The features of correlation coefficient greater than 0.4 with final_mark are midterm, study_count, group_task. The highest correlation coefficients with the target feature fianl_mark is midterm, which is 0.46. The correlation between other 7 features, including answer_mark, chapter_quiz etc., and target feature final_ mark is relatively average. Therefore, the useless features, such as semester and faculty with correlation of 0, are deleted. While midterm, group_ task, class_ test and other 13 relatively important features are retained.
3 Neural Network Prediction Model
BP neural network is an algorithm with error back propagation, which is mainly composed of input layer, output layer and several hidden layers. It can approach any continuous function with arbitrary accuracy through continuous iteration. And it is often used in function approximation, classification and pattern recognition. The basic principle of BP neural network is to update the weight and approximate the real value through the forward propagation of signal and the back propagation of errors.
Any function in a closed interval can be approximated by a BP neural network with a hidden layer. Therefore, a three-layer BP neural network with input layer, hidden layer and output layer can map any n-dimension to m-dimension [18].
The input layer and output layer of neural network are determined by basic features and target features of training and test. Hidden layer is needed when the data need nonlinear separation. The number of hidden layers significantly affects the performance of neural network [19]. For a complex dataset involving time series or computer vision, multiple hidden layers are necessary to be used [20]. The practical dataset in this paper is relatively simple. Therefore, one hidden layer is chosen to establish a three-layer neural network as shown in Fig. 2.
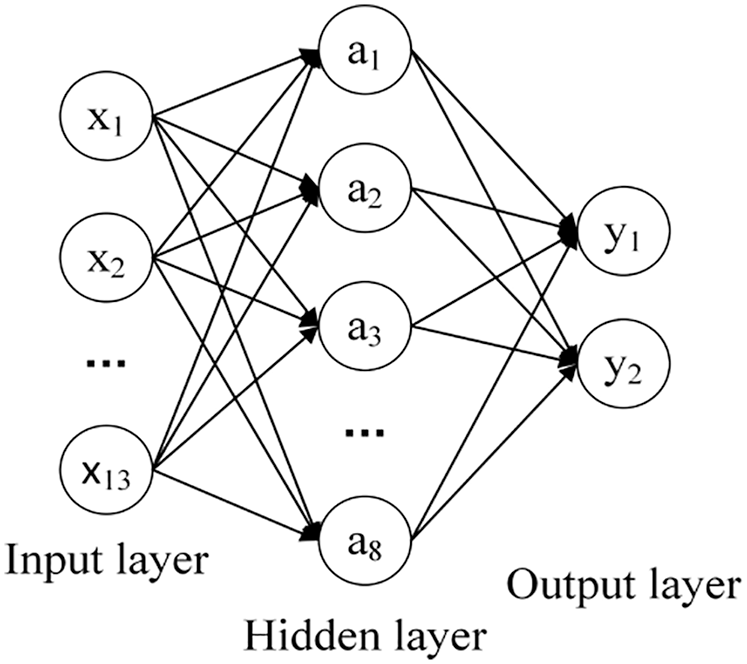
Figure 2: Neural network structure diagram
3.2 Number of Neurons in Input Layer and Output Layer
The number of neurons in the input layer is decided by the number of input variables in the dataset. The number of neurons in the output layer is the number of output variables. There are many factors that can reflect the learning status of students and affect the final academic performance of students. By analyzing learning behavior data of students, 13 relatively important features, such as midterm, group_task, class_test and so on are selected as the input of the model. According to the number of features selected, the input layer of this model is set with 13 neurons. The final scores of students are divided into two categories pass and failed. Therefore, the number of neurons in the output layer is 2.
3.3 Number of Hidden Layer Neurons
The number of hidden layers and neurons determines the accuracy of neural network. The number of neurons in hidden layer depends on the number of neurons in input layer and output layer. A small number of neurons in the hidden layer will cause the model with poor relationship and susceptible to flat. However, if too many neurons are used, it will also lead to some problems. Firstly, it will increase the number of nodes in the neural network. If the amount of information in the training set is not sufficient to train all neurons in the hidden layer, the model will overfitting. Secondly, even the data information in the training set is sufficient, too many nodes in the hidden layer will increase the training time of the neural network. Then it is difficult to achieve the expected performance. Therefore, it is important to select the appropriate number of hidden layer neurons, which is generally selected according to experience. In this paper, the number of hidden layer neurons is selected according to Eq. (2).
where m is the number of neurons in the input layer, n is the number of neurons in the output layer, and a is a constant between 1 and 10. After trial calculation, the number of neurons in the hidden layer is set to 8.
3.4 Activate Function Settings
The activation function adds nonlinear factors to neurons. Therefore, the output of each layer in the neural network can undertake the nonlinear transformation of the input function of the previous layer. Activation functions mainly include sigmoid and Relu. The sigmoid function, also known as logistic function, is used for the output of hidden layer, which maps a real number to the range of (0, 1). The equation of sigmoid function is as follows.
The Relu function is a piecewise linear function that changes all negative values to 0, while positive values remain unchanged. It can more efficiently reduce the gradient and back propagation, which effectively avoid the problems of gradient explosion and gradient disappearance. The Relu function is as follows.
In our model, sigmoid function is used as the activation function of the hidden layer, and Relu function is selected as the activation function of the output layer.
In supervised learning, the gap between the predicted value and the real value is usually measured by the loss function. The parameters of the prediction model are solved iteratively to minimize the loss function. In the experiments, BCE loss function is adopted as the evaluation function of the algorithm. It is the average value of the calculation vector when calculating the loss value. The definition of BCE loss function as following.
where w is the weight,
When overfitting occurs, the algorithm function curve often bends violently, so the curvature of the algorithm function will be very high at a local position. The curvature of the function is a linear or nonlinear combination of function parameters. In order to reduce overfitting, L2 norm is introduced as L2 regularization, so that the values of function parameters are dense and uniform near 0. L2 regular term refers to the square root of quadratic sum for each element in the weight vector w, which is usually expressed as
4 Experiment and Result Analysis
In this section, the effectiveness of proposed approach is evaluated through experiments. The experiments are conducted on a computer with Intel i7-8750u processor and 16GB available main memory. All algorithms are implemented on PyCharm with Python 3.7.0. The python tool libraries used in the algorithm implementation process include keras, numpy, pandas, matplotlib, seaborn and sklearn, et al. In order to train the machine learning model, the data is split into two parts, the training set and the test set with ratio 70 for training and 30 for testing.
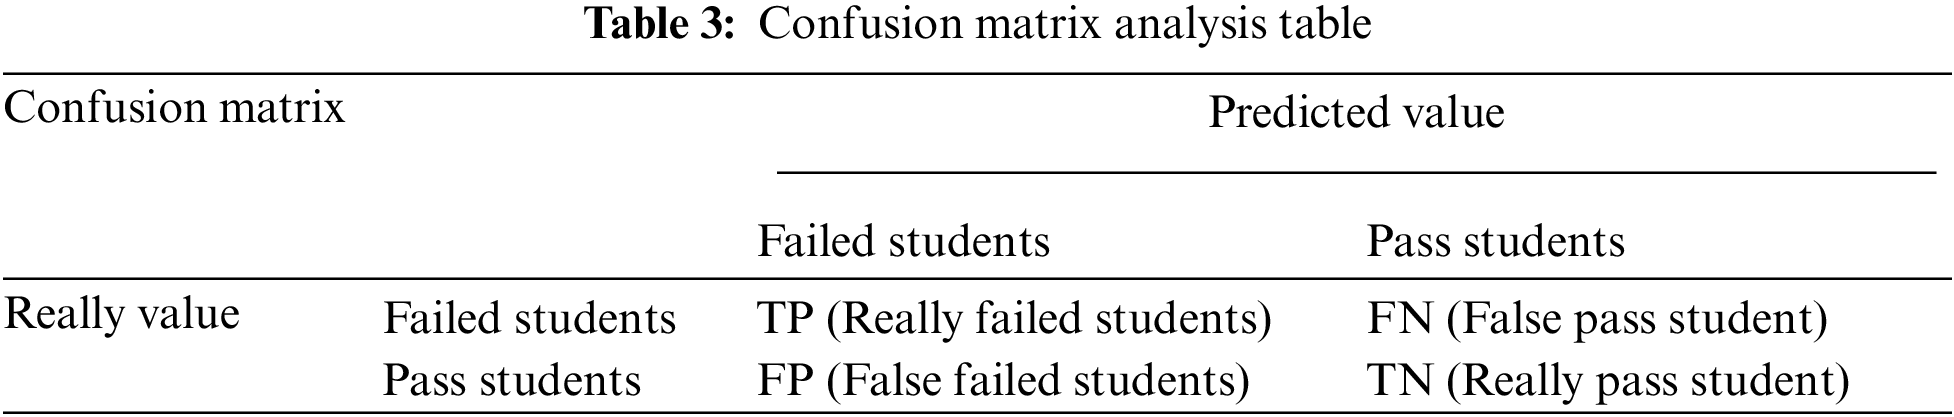
The paper is intended to predict whether students can pass the final exam or not through relevant student features. The prediction results are divided into pass and failed, which is a binary prediction. The confusion matrix analysis table of binary prediction problem is shown in Tab. 3.
Accuracy (A), recall (R), precision (P) and F1 score (F1) are used to evaluate the prediction results. Accuracy is defined as the percentage of correct predictions for pass students in the test data. However, more attention should be paid to the percentage of real failed students than to that of the pass students here. Therefore, recall is introduced as the evaluation indicator. The improvement of recall will lead to the decline of precision and the virtual high of the model. Recall and precision are a pair of relatively contradictory variables. F1 score is adopted to balance the recall and precision, which evaluates the model more objectively. The calculation of each indicator is as follows.
4.2 Experimental Prediction Results and Analysis
In this paper, L2 regular term is added to the BP neural network, which can reduce the overfitting risk of BP neural network due to the increase of iterations. The accuracy curves of the experiments are shown in Figs. 3 and 4 respectively.
The accuracy curve of the BP neural network with L2 regularization in the experiment is more stable than the BP neural network without L2 regularization in the control group, which can effectively reduce the risk of model overfitting.
As show in Figs. 5 and 6, the gap between the loss curve of the training set and the test set becomes greater with the increase of the number of iterations in the BP neural network without L2 regularization. While the loss curve of training set is close to the test set in the BP neural network with L2 regularization. This indicates that BP neural network with L2 regularization can effectively reduce the risk of overfitting.
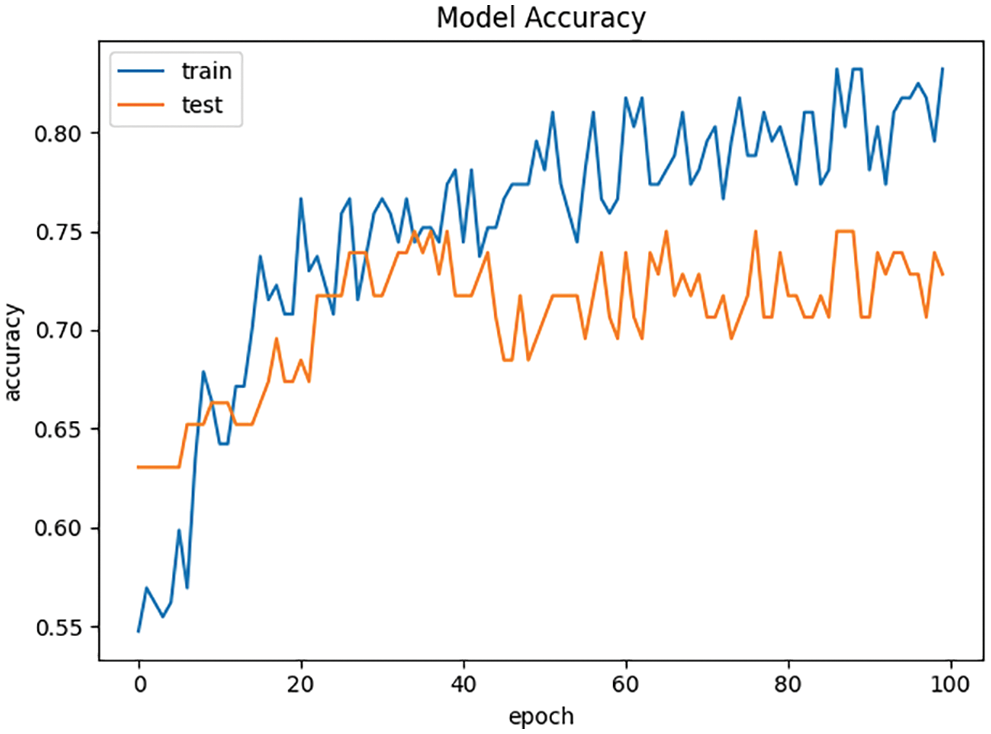
Figure 3: Accuracy curve of BP neural network without L2 regularization
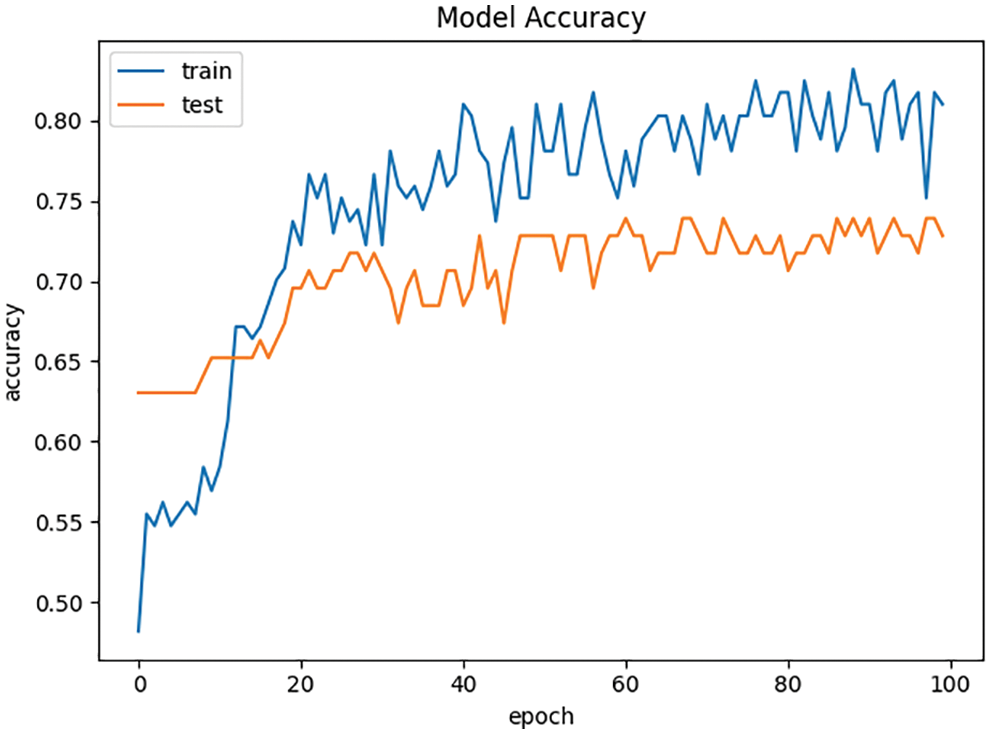
Figure 4: Accuracy curve of BP neural network with L2 regularization
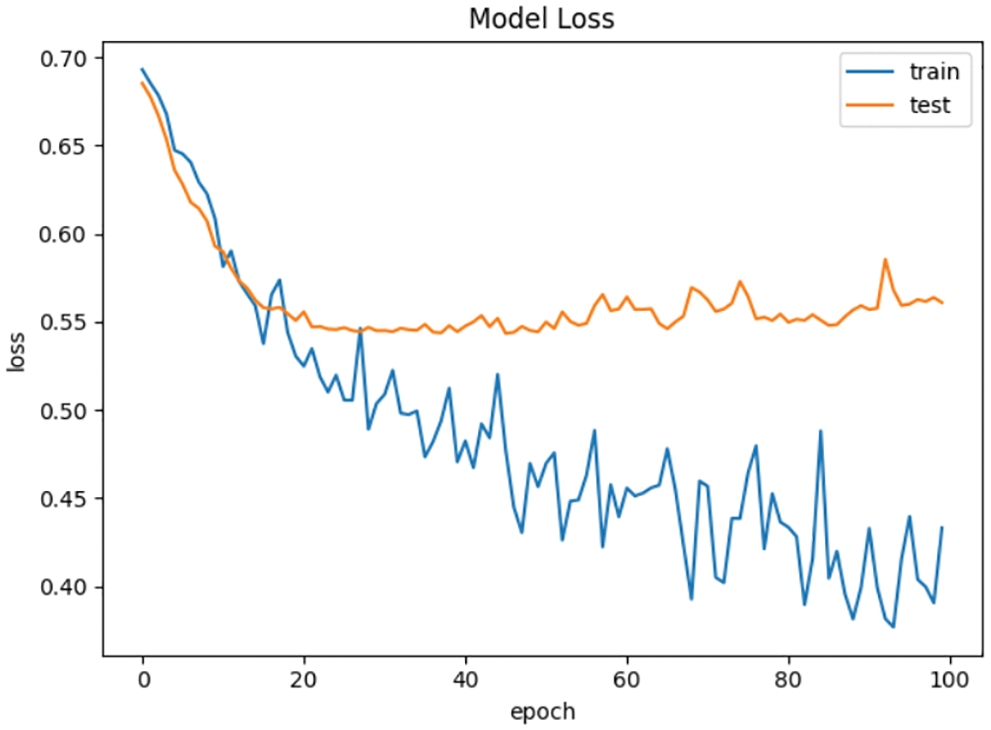
Figure 5: Loss curve of BP neural network without L2 regularization
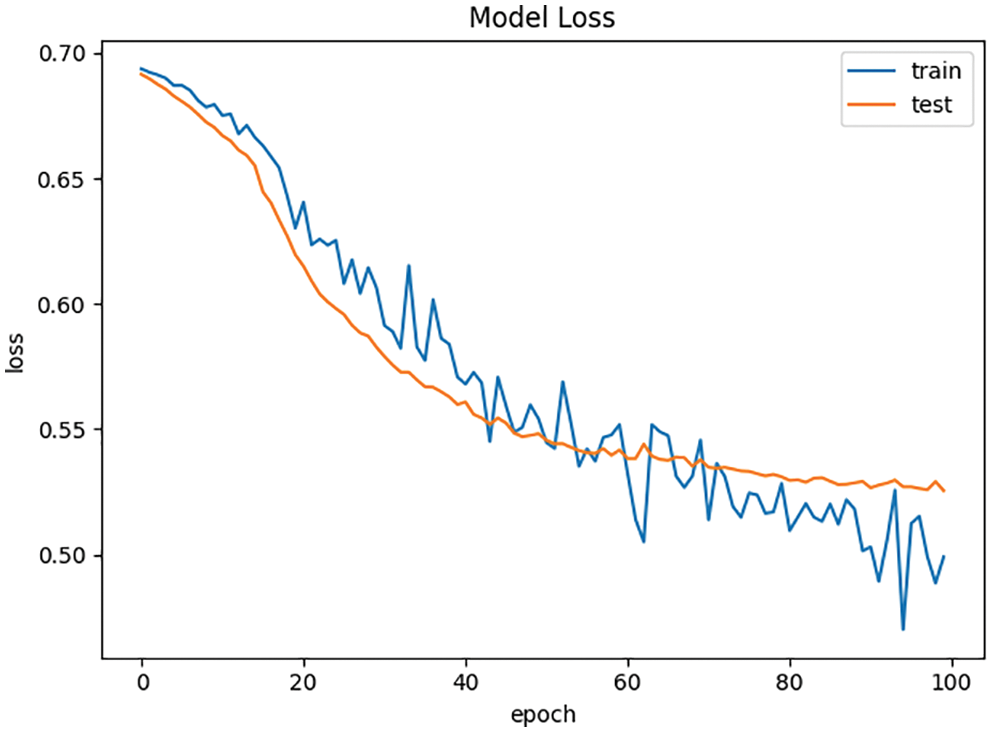
Figure 6: Loss curve of BP neural network with L2 regularization
In order to test the generalizability of BP neural network with L2 regularization, we compare it with other machine learning algorithms, including AdaBoost, Bayes and Logistic Regression on the dataset. The results of the empirical study using accuracy, recall, precision and F1 score performance metric are shown in Tab. 4.
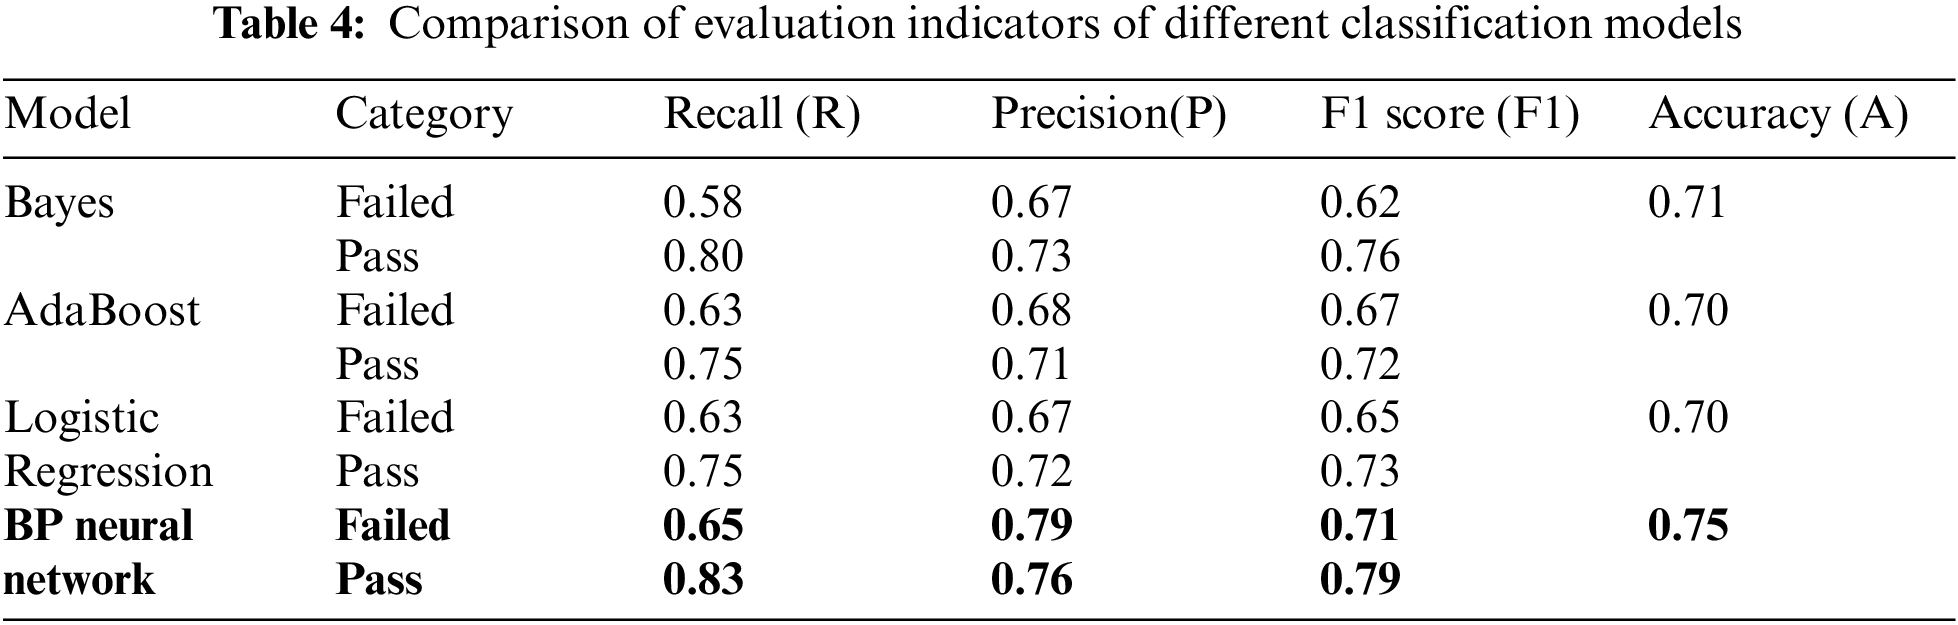
Tab. 4 shows the Bayes, AdaBoost and Logistic Regression has 71%, 70% and 70%, while the BP neural network approach attains 75% accuracy overall. The pass category classification F1 score of Bayes, AdaBoost and Logistic Regression are 76%, 72% and 73% respectively, while BP neural network reach 79%. The failed category classification F1 score of Bayes, AdaBoost and Logistic Regression are 62%, 67%, and 65% respectively, while F1 score of the BP neural network in the failed category obtain the 71%. BP neural network shows the most consistent highest with all the classifiers model employed. This indicates that the generalizability of BP neural network model in blended teaching classification prediction better than the traditional machine learning prediction model.
In conclusion, BP neural network is more effective than traditional machine learning algorithms, such as AdaBoost, Bayes, Logistic Regression in the classification and prediction of blended learning achievements. By introducing L2 regularization, BP neural network model can effectively prevent overfitting.
Binary prediction based on BP neural network is presented for the application in blended learning achievement. Firstly, pretreating and mining student information and student online learning data recorded on the Chao-Xing platform. Then, effective features are selected by Pearson correlation analysis. Finally, the effectiveness of the algorithm is verified on the dataset. Compared with the traditional machine learning algorithm, this model can better classify and predict the final grades of students. In the future work, we will build multi-layer hidden layers to improve the fitting ability of neural network and collected more data to train the model. These may be helpful to improve the prediction accuracy of the model.
Acknowledgement: We thank the editor and the anonymous reviewers for their helpful comments and suggestions in improving the paper.
Funding Statement: This research was supported by the Natural Science Foundation of the Jiangsu Higher Education Institution of China, (Grant No. 19KJB520044); the Innovation and Entrepreneurship Training Program for College Students in Jiangsu Province of China, (Grant No. 202113982023Y); the Jiangsu Graduate Practice and Innovation Project of China, (Grant No. SJCX21_0356); Innovation Practice Project of Graduate Students in Wuxi Campus of Nanjing University of Information Science & Technology, (Grant No. WXCX202117); Project on Teaching Reform Research of Wuxi University, (Grant No. JGYB202113).
Conflicts of Interest: The authors declare that they have no conflicts of interest to report regarding the present study.
1. M. Christie and E. D. Graaff, “The philosophical and pedagogical underpinnings of active learning in engineering education,” European Journal of Engineering Education, vol. 42, no. 1, pp. 5–16, 2017. [Google Scholar]
2. Y. Lee, “Effect of uninterrupted time-on-task on students’ success in massive open online courses (MOOCs),” Computers in Human Behavior, vol. 86, no. 1, pp. 174–180, 2018. [Google Scholar]
3. Y. Mourdi, M. Sadgal, H. E. Kabtane and B. F. Wafaa, “A machine learning-based methodology to predict learners’ dropout, success or failure in MOOCs,” International Journal of Web Information Systems, vol. 15, no. 5, pp. 489–509, 2019. [Google Scholar]
4. S. N. Ismail, S. Hamid, M. Ahmad, A. Alaboudi and N. Jhanjhi, “Exploring students engagement towards the learning management system (lms) using learning analytics,” Computer Systems Science and Engineering, vol. 37, no. 1, pp. 73–87, 2021. [Google Scholar]
5. Z. Shen, H. Zhao and Z. Liu, “Impact of blended learning on students’ performance, classification and satisfaction in a practical introductory engineering course,” International Journal of Engineering Education, vol. 37, no. 6, pp. 1730–1742, 2021. [Google Scholar]
6. S. A. Naser, I. Zaqout, M. A. Ghosh, R. Atallah and E. Alajrami, “Predicting student performance using artificial neural network: In the faculty of engineering and information technology,” International Journal of Hybrid Information Technology, vol. 8, no. 2, pp. 221–228, 2015. [Google Scholar]
7. K. Abhirami and M. K., “Student behavior modeling for an e-learning system offering personalized learning experiences,” Computer Systems Science and Engineering, vol. 40, no. 3, pp. 1127–1144, 2022. [Google Scholar]
8. T. S. Yu, Z. Gan, X. Li and C. Yang, “Application of SVR regression in performance prediction and early warning,” Chinese Educational Informational, no. vol. 11, pp. 76–80, 2020. [Google Scholar]
9. P. Lv, W. B. Yu, X. Wang and C. L. Ji, “Student achievement prediction and teaching enlightenment based on machine learning,” Computer Technology and Development, vol. 29, no. 4, pp. 200–203, 2019. [Google Scholar]
10. F. Q. Wang and Y. Li, Q. L. Han, “Research on academic performance prediction of MOOC based on k-nearest neighbor optimization algorithm,” Computer and Digital Engineering, vol. 47, no. 4, pp. 785–788, 2019. [Google Scholar]
11. J. Y. Jia, Y. B. Li, Q. H. Yao, and Z. H. Yuan, “Research on MOOC academic achievement prediction model based on AdaBoost,” Software Guide, vol. 20, no. 3, pp. 242–246, 2021. [Google Scholar]
12. J. Song, “Learning Behavior Analysis and Achievement Prediction Based on Campus Big Data,” M.S. dissertation, University of central china normal, WuHan, 2020. [Google Scholar]
13. P. Cortez and A. M. G. Silva, “Using data mining to predict secondary school student performance,” in Proc. of 5th Annual Future Business Technology Conf., Porto, Portugal, pp. 5–12, 2008. [Google Scholar]
14. W. Xing, R. Guo, E. Petakovic and G. Sean, “Participation-based student final performance prediction model through interpretable genetic programming: Integrating learning analytics, educational data mining and theory,” Computers in Human Behavior, vol. 47, pp. 168–181, 2015. [Google Scholar]
15. D. Azcona and I. H. Hsiao, A. F. Smeaton, “Detecting students-at-risk in computer programming classes with learning analytics from students’ digital footprints,” User Modeling and User-Adapted Interaction, vol. 29, no. 4, pp. 759–788, 2019. [Google Scholar]
16. M. Zaffar, M. A. Hashmani, R. Habib, K. Quraishi, M. Irfan et al., “A hybrid feature selection framework for predicting students performance,” Computers, Materials & Continua, vol. 70, no. 1, pp. 1893–1920, 2022. [Google Scholar]
17. A. S. Mahedy, A. A. Abdelsalam, R. H. Mohamed and I. F. El-Nahry, “Utilizing neural networks for stocks prices prediction in stocks markets,” International Journal of Information Technology and Computer Science, vol. 12, no. 3, pp. 1–7, 2020. [Google Scholar]
18. H. Zhang, T. Huang, S. Liu, H. Yin, J. Li et al., “A learning style classification approach based on deep belief network for largescale online education,” Journal of Cloud Computing: Advances, Systems and Applications, vol. 9, pp. 1–17, 2020. [Google Scholar]
19. R. A. Ellis, F. Han and A. Pardo, “Improving learning analytics-combining observational and self-report data on student learning,” Educational Technology and Society, vol. 20, no. 3, pp. 158–169, 2017. [Google Scholar]
20. E. Seidel and S. Kutieleh, “Using predictive analytics to target and improve first year student attrition,” Australian Journal of Education, vol. 61, no. 2, pp. 200–218, 2017. [Google Scholar]
 | This work is licensed under a Creative Commons Attribution 4.0 International License, which permits unrestricted use, distribution, and reproduction in any medium, provided the original work is properly cited. |