| Journal on Artificial Intelligence DOI:10.32604/jai.2022.028140 | |
| Article |
Predict the Chances of Heart Abnormality in Diabetic Patients Through Machine Learning
Department of Electrical Engineering, Madhav Institute of Technology and Science, Gwalior, 474005, India
*Corresponding Author: Monika Saraswat. Email: monikasaraswat20@gmail.com
Received: 03 February 2022; Accepted: 29 March 2022
Abstract: Today, more families are affected by Diabetes Mellitus (DM) disease on account of its continually increasing occurrence. Most patients remain unknown about their health quality or the DM’s risk factors prior to diagnosis. The medical world has witnessed that individuals are affected by two different diabetes namely a) Type-1 diabetes (T1D), as well as b) Type-2 diabetes (T2D). As Type 2 Diabetes affects the other organs of the body, the proposed system concentrates specifically on Type 2 Diabetes. This work aims to ascertain the cardiac disorder in T2D patients. As of the ECG dataset, the requisite data is gathered it contains healthy volunteer and patients record with pathologies like Myocardial Infarction, Cardiomyopathy, Bundle branch block, Dysrhythmia, from the dataset, the system regarded 245 persons of data in which 160 volunteers are non-diabetic and 85 volunteers are diabetic. The classification is performed. Here, a K-Nearest Neighbor (KNN), Multi-layer Perceptron’s (MLP), along with Support Vector Machines (SVM) learning models is concerned for the investigation of typical cardiac abnormality in diabetic persons. From the attained outcomes, the proposed work could be perceived to show maximal accuracy and minimal error rate percentage in the least time while comparing existing machine learning algorithms. KNN attained 80%, MLP attained 93.8% and SVM attained 96.25% of accuracy, respectively.
Keywords: Electrocardiogram; classification; K-nearest neighbors; receiver operating characteristic; support vector machine; multi-layer perceptron
Diabetes mellitus is basically a chronic disease and it occurs when the percentage of glucose is remarkably high in blood. Glucose is the key energy source that the body absorbs as of the food that one consumes regularity [1]. A hormone called Insulin controls the blood sugar level within the body. T1D and T2D are the ‘2’ disparate sort of diabetes in which type 1 diabetes is termed insulin-dependent DM (IDDM) or juveniles-onset diabetes and T2D is termed non-insulin-dependent DM (NIDDM) or adults-onset diabetes. Individuals who are under 30 are likely to be affected by T1D [2]. In T2D, though the pancreas generates some insulin, the quantity produced is insufficient for the body’s requirements, or alternatively, the body’s cells will resistant towards it [3]. Diabetic individuals will also be prone to an assortment of diseases like heart disease, stroke, kidney issues, vision failure, dental issues, nerve damage, [4] along with foot issues. Among all these, diabetic patients will more probably be hit by CVD. As per the American heart association (AHA) statement, [5] there is a tough correlation linking diabetes and CVD. Regardless of the occurrence of arterial hypertension, dyslipidemia, together with obesity conditions, the Diabetes induced hyperglycemia brings about cardiovascular abnormalities. ST-T changes, left ventricular hyper-trophy, QT dispersion, in addition to sinus tachycardia are some changes in ECG that might be caused by Diabetes induced Cardiovascular Autonomics Neuropathy (CAN) [6,7].
The American heart association finds diabetes mellitus to be major controllable hazard factors aimed at cardio vascular disease. During the Framingham study, an assortment of predictors is observed in the prediction of heart disease in diabetes patients centered on ECG. Some of such predictors like body mass index (BMI), gender, age, fasting glucose, higher-density lipoprotein, blood pressure, family history of diabetes mellitus, triglycerides, etc. contribute to cardio vascular disease along with heart attack. Envisage of the heart disease in diabetes mellitus is the main challenge. Centered on the challenge, lots of researches were conducted for detecting proper traits as of ECG signal data and predicting Heart Disease [8,9]. Some techniques are Discrete Wavelet Transforms (DWT), Principal Components Analysis Independent Components Analysis along with Fast-ICA. However, this is inclined to be more intricate, tedious, and also not competent to envisage heart disease in a diabetic individual. There is a requirement for the prediction [10–14], model to be designed in a convenient, lower price, precise, and also it should be bio-inspired.
Lately, an assortment of machine learning for the heart disease prediction in diabetes patients has been performed [15], Some old researches aimed at predicting heart disease in diabetes individuals centered on machine learning are, random forests, Decision-Tree, Naïve Bayes (NB), ensemble method together with extreme gradient boost (XGBOOST). Though these procedures predict heart disease, they can’t attain full accuracy because of particular factors. False Prediction (FP) is attained because of the factors like artifacts, inapt Features Extraction (FE), improper feature selection, etc. To trounce these challenges, the work has employed several ML, say MLP, SVM, together with KNN for investigating the CVD on diabetic individuals [16–20].
Further, the paper is prearranged as: Section 2 illustrates the associated related work. Section 3 about the Data collection and ECG signal, Section 4 Classification of disease or non-disease by different Machine learning techniques, Section 5 states the result and its discussion for analyzing the proposed model’s performance. At last, 6 concludes the work.
A deep-transfer learning framework aimed at the automatic diabetes mellitus diagnosis. This framework was suggested centered on the heart rates signals acquired as of ECG information. The suggested framework was deployed for 2D signals. Here, the models previously trained with 2D huge image data were employed to 1D heart rates signals. The 1D signals were then transmuted into frequency spectrum imageries, which were chiefly utilized for application to eminent pre-trained models, particularly: AlexNet, DenseNet, VggNet, and ResNet. The DenseNet model acquired the highest (97.62%) classification accuracy and (90%) sensitivity for detecting diabetes mellitus subjects through heart rates signal recordings. But this framework led to higher computational time [21].
Recommended an automatic system intended for effectively classifying diabetes and normal classes with the Heart rate information attained as of the ECG signals. Here, the 5 levels of DWT decomposition, that is, the extraction of the kurtosis, sample entropy, skewness, approximation entropy, and energy features at disparate detailed coefficient levels were done for automatically detecting the diabetes mellitus. The ranking approaches, say, the t-test, wilcoxon, Bhattacharyya-space, and entropy test were employed to rank those features. The ranked features were sent to disparate classifiers that embrace NB, DT, and KNN, along with SVM. The outcomes had evinced maximal diagnostic differentiation performance with minimal features. they were ineffectual for training the machine learning models [22].
It builds an improved fuzzy logic-centric artificial Neural networks (IFANN) classifier to predict coronary artery heart disease amongst diabetes mellitus patients. The data were compiled and the built IFANN was analogized to certain approaches in respect of certain performance metrics. The Mathews’ Correlation Coefficients (MCC) tested the competency of the machine learning classifier for certain performance metrics. Amid their Implementations in Scilab, the acquired results corroborate that the built IFANN performed well when contrasted to the existing approaches. The classifier evinced pre-eminent performance but had a constraint like over-fitting, which elevated the false Positive rate (FPR) [23].
Delineated some signal processing approaches that picked features as of heart rates signals and proffered an analysis process that utilized those features for diagnosing diabetes mellitus. Via the statistical analysis, it recognized the correlation dimensions, recurrence plot, and Poincare geometry properties as valuable features. The features distinguished the heart rate information of diabetes mellitus individuals from the normal people and had validated it with the classifier termed “AdaBoost” using the perceptron weak learner, which acquired 86% classification accurateness. The picked features contain disparate irregular artifacts that not permitted the model for accurate prediction [24].
It propounded a framework grounded on data mining for exactly diagnosing the type 2 diabetes. Grounded on innumerable preprocessing rules, the framework comprised 2 parts, the logistic regression along with improved K-means algorithms. The Waikato settings and Pima Indians Diabetes Dataset for Knowledge Analyses toolkit were employed for contrasting the outcomes with the ones attained as of certain researchers. The conclusion corroborated that the framework showed 3.04% prediction accuracy, which was higher when analogized to those of researchers. Additionally, the framework ensured the concerned dataset’s quality. For further evaluating the framework’s performance, it was employed to 2 other diabetes mellitus datasets. Both experiments’ outcomes evinced a pre-eminent performance. But, the framework consumed more time while training the data and showed less accuracy [25].
The elucidated two novel approaches for ascertaining the risk-aspects and employed a machine learning pipeline for the longer-term prediction of Type2 Diabetes. The approaches had been assessed with data as of longitudinal clinical analysis, termed San Antonio Heart research. The approach acquired 95.94% accuracy for predicting whether a person would build Type2 Diabetes within the subsequent 7–8 years or not, on account of improper data, there might be more chance for false positive [26].
This collects and measures information as of the dataset; in the proposed case, the PTB-Diagnostic ECG dataset is used. PTB-Diagnostic is an online database which is available on physionet.org site. The dataset contains of healthy volunteer and patients records with pathologies like Myocardial Infarction, Cardiomyopathy, Bundle branch block, Dysrhythmia. Each ECG lead have 10000 samples and their amplitude range is ±16.384 mV with sampling frequency 1000 Hz. For the experiment we have selected ECG data, the system regarded 245 persons in which 160 volunteers are non-diabetic and 85 volunteers are diabetic, their medical history is available [27]. ECG database MATLAB R2018b software were used for analysis. the 12-lead ECG curve as shown in Fig. 1.
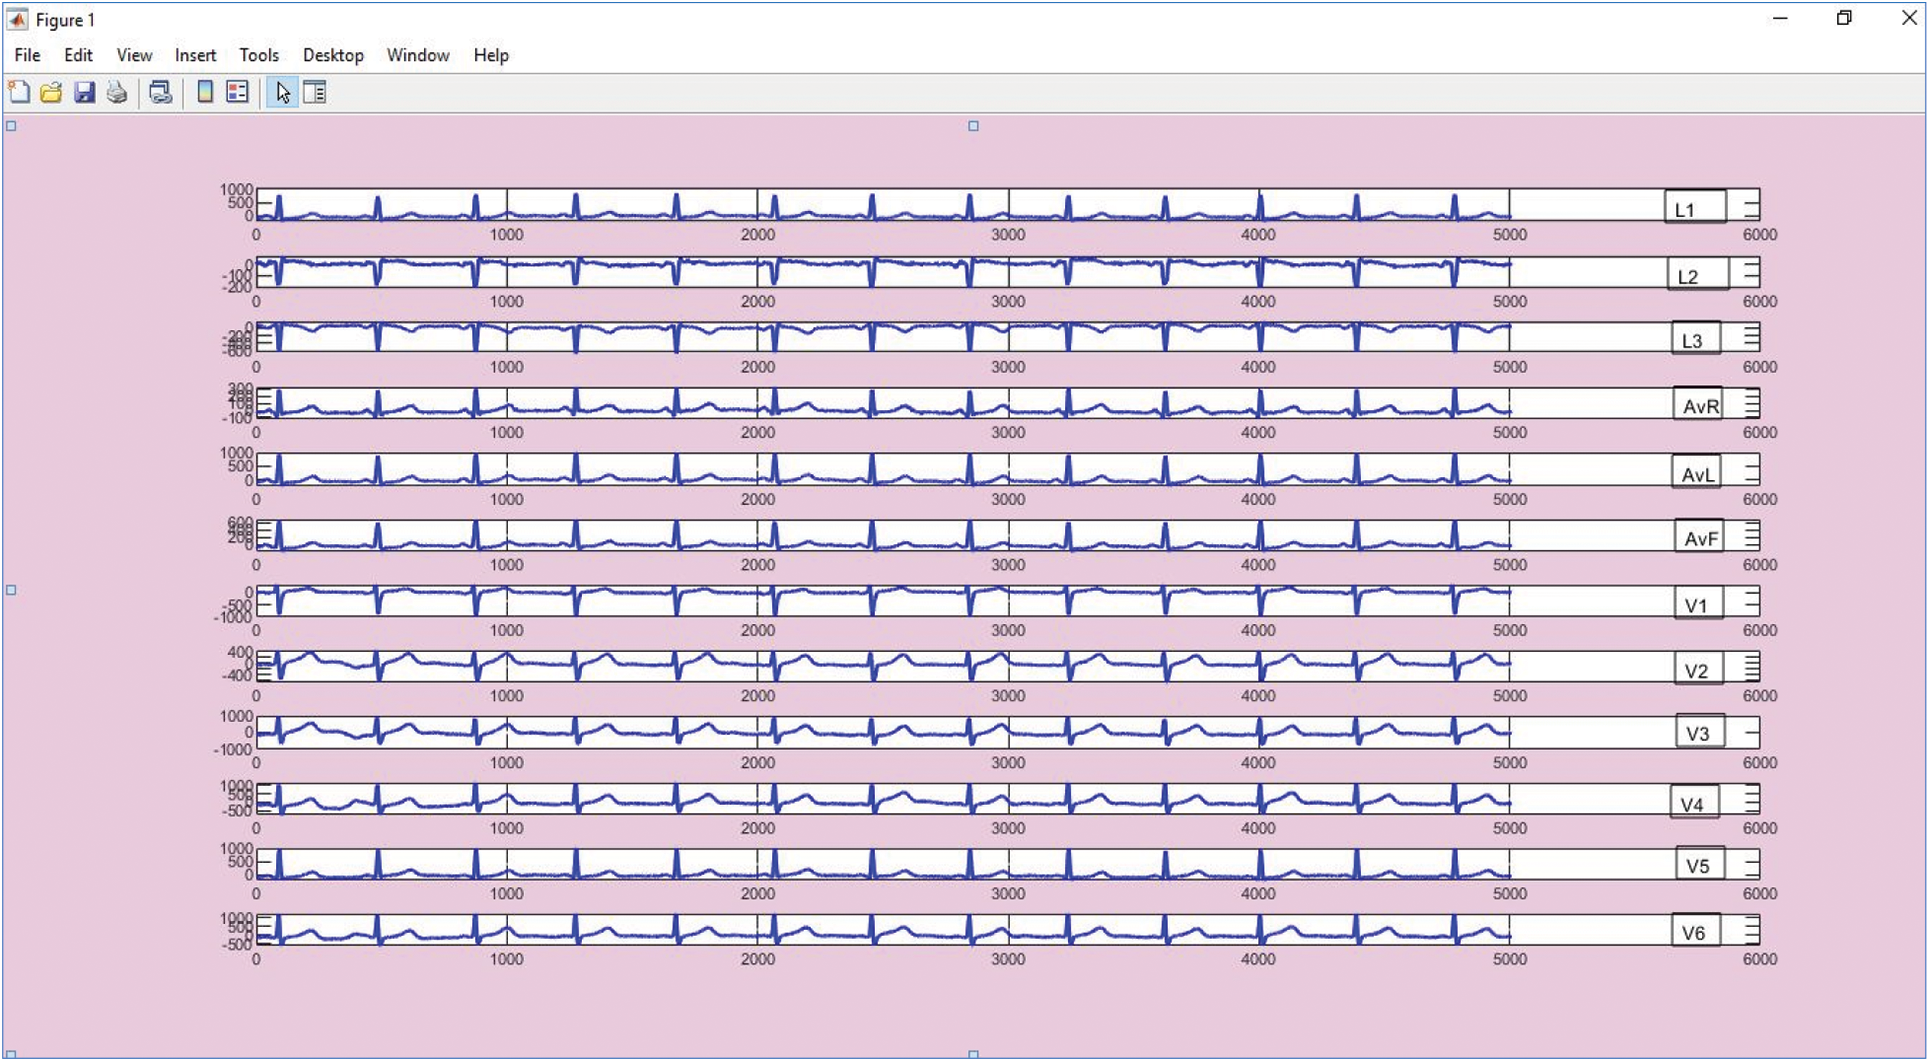
Figure 1: 12-lead ECG curve plotted using PTB diagnostic data
ECG Signal
The electrocardiogram is a picture of the electrical waves in the heart that electrocardiography creates (ECG). The periodic impulse propagation of the cardiac muscle’s Pacemaker nerve fibers (SA node, AV node, Purkinje fiber) generates cycles of depolarization and repolarization [28,29]. Muscular contraction is caused by depolarization, while muscle relaxation is caused by repolarization. The Atrium muscle (porch, left and right) and Ventricle muscle (chambers, left and right) make up the heart muscle [30]. The heart’s conduction system refers to this system. According to Einthoven, various aspects of cardiac activity are portrayed as ECG signals, including:
(i) The depolarization of the atrial muscle as a P wave.
(ii) ‘QRS’ wave is the depolarization of the ventricular muscle.
(iii) ‘T’ wave represents the repolarization of the ventricular muscle.
There is a ‘R’wave in each ECG cycle, which is the largest potential difference as a result of the maximal depolarization of the ventricular muscle. Impulse because the human body is an excellent conductor, the pacemaker propagates from the SA node until the Purkinje fiber reaches the surface of the human skin. The ECG signal is commonly employed in clinical practice. The Holter ECG device [31] is the most often utilized ECG signal recorder. If paramedics need to monitor the irregularities in a patient’s ECG, they use this gadget. The paramedics will decipher the waves and complexities of the ECG data. The characteristics used to determine whether or not the ECG is normal. The wave’s interval and height are determined by the parameters, like ON-set and OFF-set of QRS-complex, amplitudes-durations, T-wave and feature related to diabetes like QT-dispersion (QTd), ST-depression (STd), QT-corrected (QTc), P-wave dispersion and HRV, these feature extraction factors are done in my previous paper [32]. This paper is extension of my previous work and proposed to focus on the classification of abnormal and normal cases of heart disease with diabetes by using different machine learning techniques and also to find out which technique gives a higher accuracy in least time.
4 Classification Using Machine Learning Algorithms
In this paper we focus on classification using different machine learning algorithm such as, Multilayer perceptron, Support vector machine and K-nearest neighbor. Subsequent to gathering the data as one of the datasets, Classification is executed, which is a vital task to ascertain a better performance on a heart disease with diabetes mellitus in addition to a healthy group. The proposed work employed disparate techniques of machine learning as a classifier for the complete experiment machine learning classification techniques were exhibited to potentially enhance prediction results in coronary heart disease. Such classification techniques include KNN, MLP-NN, along with SVM. The proposed method’s structural design is evinced in the below Fig. 2, The classification procedure of ‘3’ tree algorithms are elucidated as:
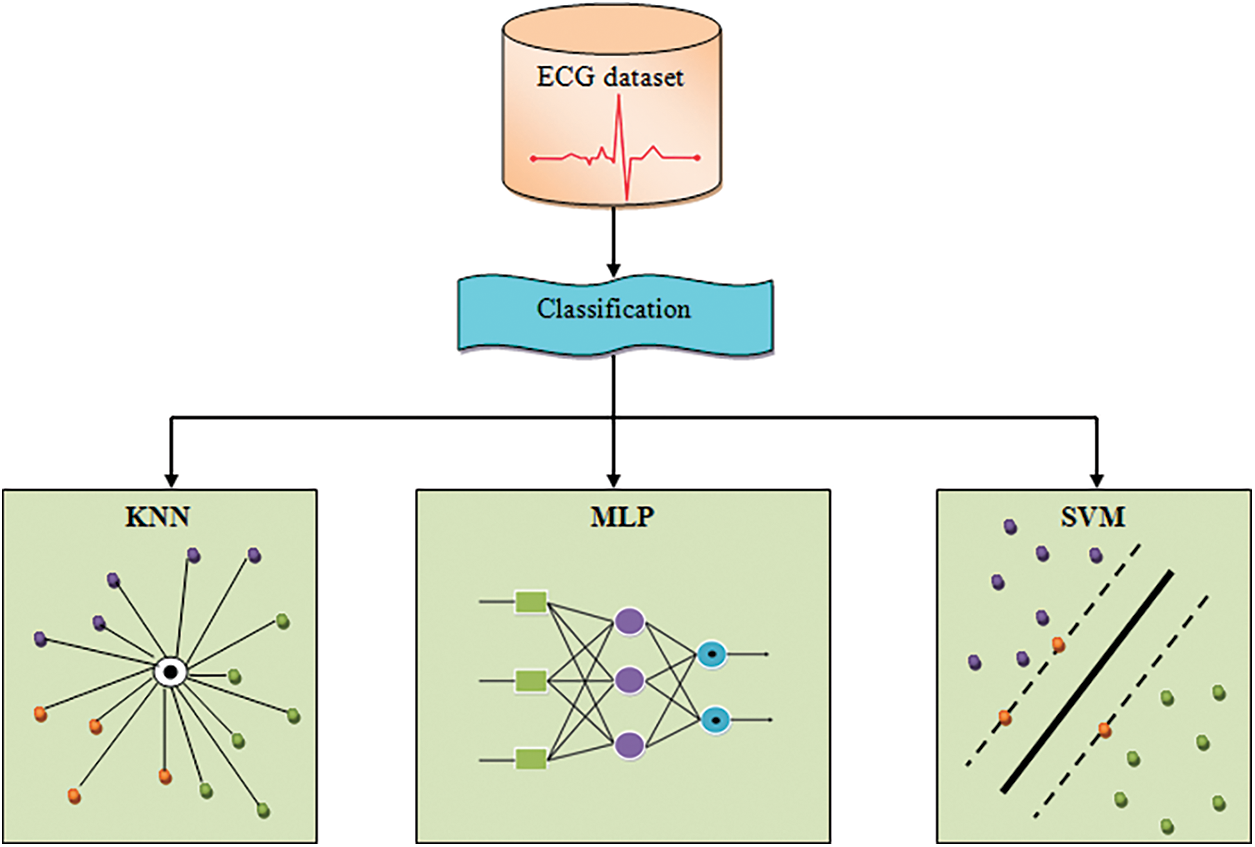
Figure 2: Architecture diagram for the proposed methodology
KNN is basically a simple classifier that ascertains the KNN utilizing the minimal distance betwixt the testing and training data. The commonest one amongst the KNN is allocated to a class. This has bad run-time performance when the training set is larger. Here, the proposed system utilized k = 2, 5, 8, 11, 14, 17, 20, and 23. This utilizes ‘feature similarity’ to envisage the values of new data points that further means that the new point will be allotted with a value-centered on how intimately it matches the points on the training set. The KNN’s algorithmic procedures are elucidated below,
Step 1: Initially, take an ECG dataset of u columns and v rows named as
Step 2: Regard a test dataset of
Step 3: After that, gauge the Euclidean distances betwixt ‘2’ points
Step 4: Subsequently, decide a random value of R Here, R implies the total nearest neighbors. After that, classify the sample
4.2 Multi-Layer Perceptron (MLP) Neural Network
MLP is one of the main branches of feedforward artificial neural networks. MLP consists of a minimum of three layers of nodes. MLP utilizes the Feed forward neural network for its training which is part of the supervised learning method. This structure of deep learning is able to distinguish data which are not linearly separable. Whenever data is linearly separable, all neurons can have a linear activation function, which will linearly map the input to the output. For non-linearly separable data, the algorithm will use a non-linear activation function, such as a sigmoidal or logistic function. MLP is very popular in diverse fields, such as speech recognition, image recognition, and machine translation software [33].
Mathematically, it is illustrated as follows:
where in, implies the ECG dataset and signifies the number of information about disease as well as non-disease.
a) Input Layer
The lowest layer that gathers input as of the ECG dataset is termed the non-hidden layer as it is the exposed part of a network. An NN is often designed with a non-hidden layer bearing one neuron per input value or column in the considered ECG dataset. As above-mentioned, they remain not neurons but they simply transfer the inputted value to the succeeding layer.
b) Hidden layer
Layers successive to the inputted layer are termed as hidden layer since it is not showing directly to the input. The network structure with only one neuron on the hidden layer that outputs the value directly is concerned as the simple structure.
c) Output Layer
The final hidden layer is labeled as the output and it is answerable for outputting a value or vector of values that match the arrangement requisite for the problem. The MLP has the succeeding structure.
Step 1: First, input the ECG dataset on behalf of training the structure and allot their corresponding weight, this is written as
Step 2: After initialization, the input training ECG dataset values “
Here,
• Assigned value
Step 3: Next, the Activations Function of the network, also termed as a transfer function, is evaluated. it is an easy approach of charting the summated weighted input to the neuron’s output. It is termed an activation function since it directs the strength of the output and the threshold upon which the neuron gets activated. It has the mathematical denotation of:
Step 4: Then, the first hidden layer’s output is computed as,
where,
The
Step 5: Next, the output of the required input is estimated. This computation aids to acquire the neuron values on the OL. It is evaluated mathematically as:
The output is linked to the inputs of other neurons on the HL and is non-visible in the output. The output is symbolized as “0” and “1”, where, 0–“healthy people” and 1–“heart disease with diabetes patients”.
Step 6: At last, the error in respect of the preferred outputs are evaluated as,
where,
Here, a threshold is set with a minimal value for the loss function. If the initialized threshold satisfies this fitness, then the output is concerned as the last output, else, the weight value’s position is renewed. Again, the output unit is ascertained grounded on this MLP algorithm, and also the output data is trained on behalf of the retrieval process.
4.3 Support Vector Machine (SVM)
SVM is centered on the supervised learning algorithm and is utilized for classifying the sample data to dissimilar classes. It is primarily utilized in the domain of medicinal diagnosis for their classification together with regression purposes. The SVM can well be employed for binary classification; it constructs a model amid the training stage and creates a decision line betwixt the sample groups with the utilization of Hyper-Planes (HP). When the distance betwixt the classes is increasing, the classification accuracy also elevates.
As the considered samples are in the non-linear form, it is non-separable. On that account, the Kernel Function (KF) is utilized for the classification. In Kernel Function, low dimensional features space is concerned as input and gets transmuted to the data output in a high-dimension space. Now the data is turned into the separable form and it could be easily utilized in the classification. And here, the data is transmuted in the model of 1D to 2D. SVM ascertains a Hyper-Planes bearing the highest feasible segment points of an identical class on a similar plane. This parallel line separation Hyper-Planes is termed as optimum separating Hyper-Planes. It elevates the distance stuck betwixt the 2 parallel Hyper-Planes and diminishes the risk of misclassification of the testing dataset. The SVM algorithm performs the steps proffered below,
Step 1: The input training ECG dataset
Step 2: The positive data and negative data are isolated via the separating HP as,
where,
This brings about the optimization problem that highly lessens an objective function,
By regarding the constraints,
where,
Step 3: A minimization or maximization optimization issue has restraints in the variables being optimized. The error or cost function is added to those constraints and multiplied with the Lagrange multipliers for its augmentation. Contrarily, the Lagrangian function is developed for SVM via increasing the objective function using a weighted total of those constraints,
where,
Step 4: The discriminant function is evaluated by utilizing,
where,
Step 5: High-level noise is existent in the inputted data. Hence, this work utilizes a soft-margin SVM and is detailed below with the indication of the non-negatives. The problem in the primal variable is now regarded as the minimization of an OF, which is written as,
By regarding the constraints:
Here,
Where,
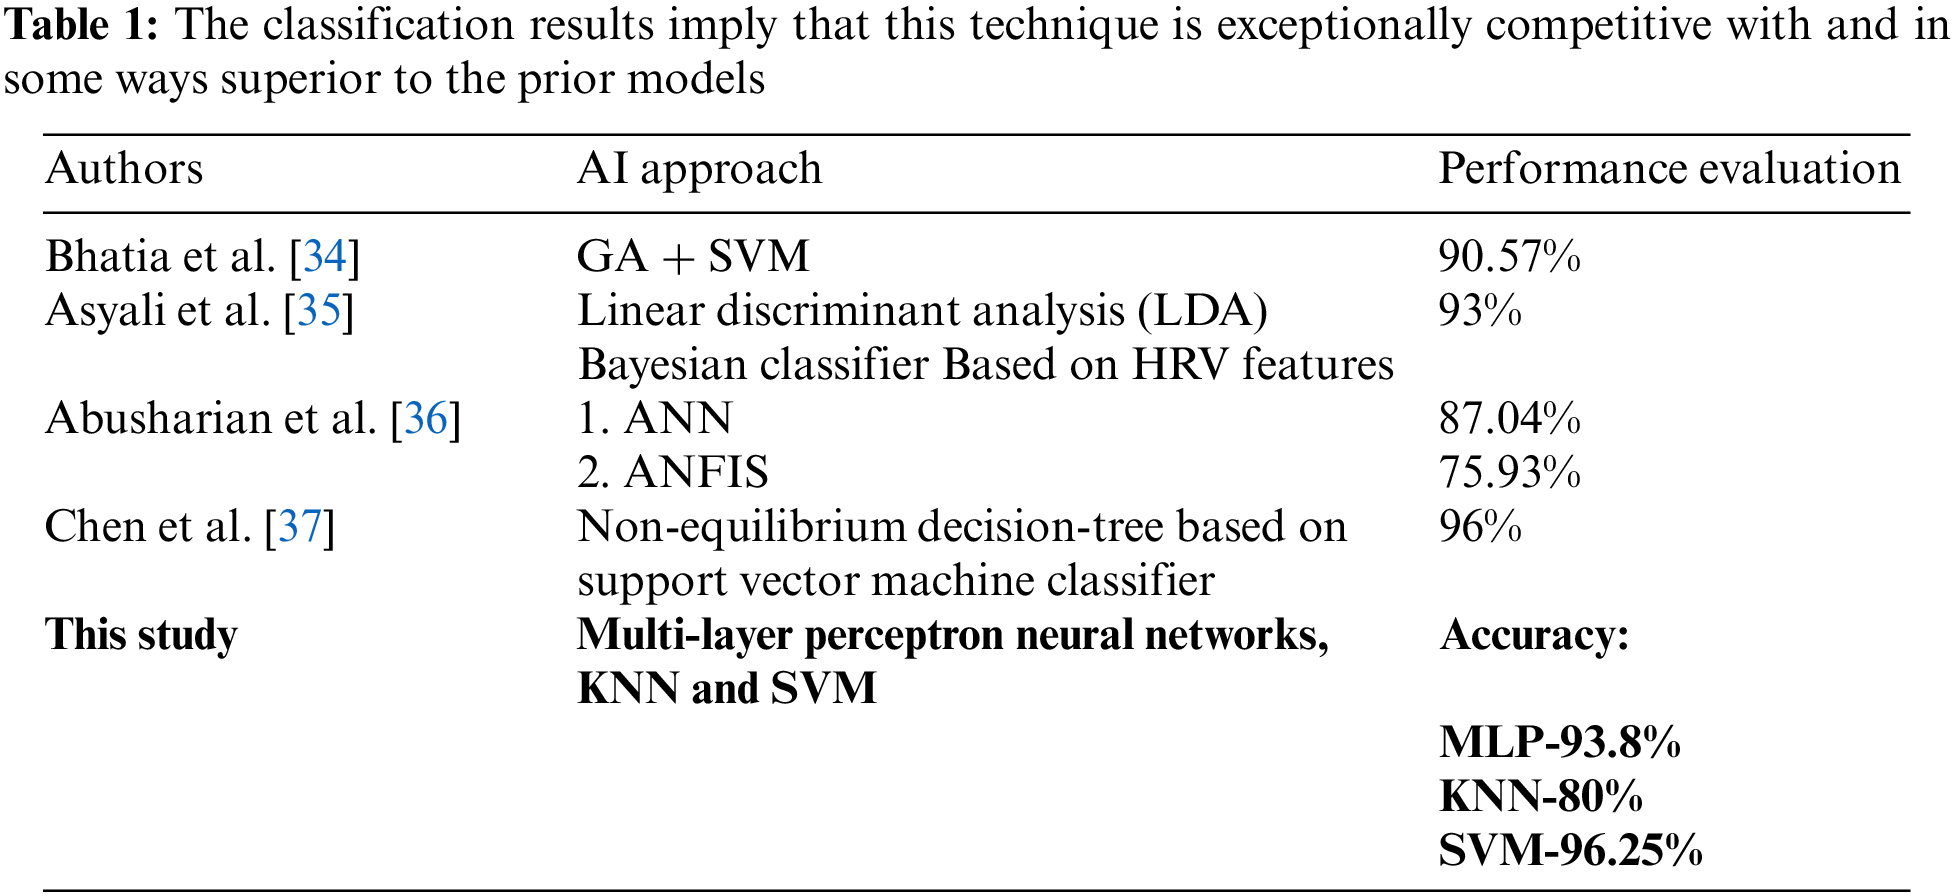
In this results analysis section, the proposed system’s performance in predicting the cardiac abnormality in diabetic patients utilizing disparate machine learning algorithms is analyzed. Here, the outcomes were acquired by employing three algorithms (KNN, MLP, along with SVM) to show top-level accuracy. The recognition of disease diagnostic tests is also included. The proposed approaches’ performances are validated and detailed through the below sections. As given in Tab. 1.
This work utilizes and employs the ECG dataset to different ML approaches (KNN, MLP, and SVM).
The Dataset utilized for training the classifier encompasses 245 patients’ records out of which 85 are diabetes patient and also the other 160 records are non-diabetic persons. After the analysis of the proposed algorithm is finding abnormality in the diabetic and non-diabetic patients here, out of 245 patients, 186 persons ECG has shown abnormality in heart like, Myocardial infarction, Cardiomyopathy, Myocardial ischemia, Bundle branch block and remaining 59 persons of ECG are normal i.e., healthy. Here, the performance rendered by the proposed ML algorithms (KNN, MLP, along with SVM) is analyzed. Some qualitative metrics, say, specificity, accuracy, and sensitivity are evaluated for this comparison and are mathematically described below,
a) Accuracy
It is the percentage of precise predictions done by a classifier when analogized to the label’s actual value in the testing phase. Also, it is the ratio between the number of precise assessments and that of all assessments, which is signified as:
where,
b) Sensitivity
It is the ability to recognize the proportions of
c) Specificity
It is the percentage of
These performance analyses are tabulated in the below table,
5.2 Experimental Results and Comparative Analysis
Here, the proposed KNN, SVM, along with MLP are represented in a graphical form centered on their performance. The decision of treatment relies upon the diagnosis. The appropriate test and the medical treatment are chosen grounded on the factors say specificity, accuracy, and sensitivity, which are the mainly utilized statistics aid to decide a diagnostic medical test. They are elucidated using the below Fig. 3.
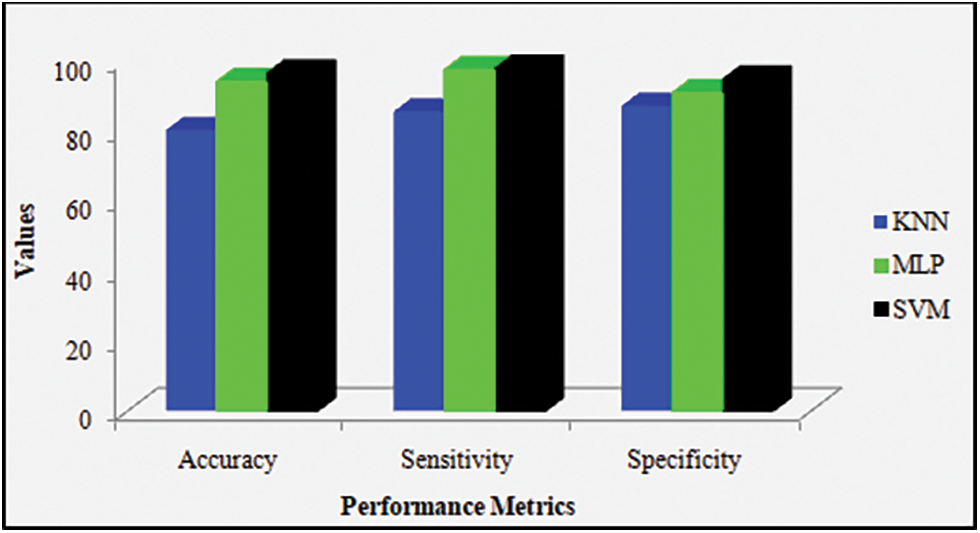
Figure 3: Accuracy, sensitivity, and specificity graph for the proposed machine learning techniques
Discussion: Fig. 3 contrasts disparate proposed ML techniques, say, KNN, SVM along with MLP classifiers centered on their performances. This comparison is done by utilizing performance metrics, say, specificity, accuracy, together with sensitivity. On considering accuracy, the proposed KNN, SVM, in addition to MLP show 80%, 96.25%, and 93.8%-accuracy values, respectively. Likewise, on considering the specificity metric and sensitivity metric, the proposed KNN attains 86.9% specificity and 85.30% sensitivity, the proposed MLP attains 90.6% specificity and 97.2% sensitivity, and the proposed SVM offers 94.5% specificity and 97.6% sensitivity. From these outcomes, the proposed SVM is confirmed to acquire higher-most performance when analogized to the remaining proposed method.
Discussion: Fig. 4 explicates the performance shown by the proposed MLP. The system utilizes epochs as the parameters on behalf of training the NN. It is proffered as “epoch”, that is, the quantity of time elapsing between the presentation of the first and final sample of the training set. On that account, the termination criteria may be a pre-set number of reasonable epochs, it deduces that the utmost certain validation performance is 0.5638 at epoch 13.
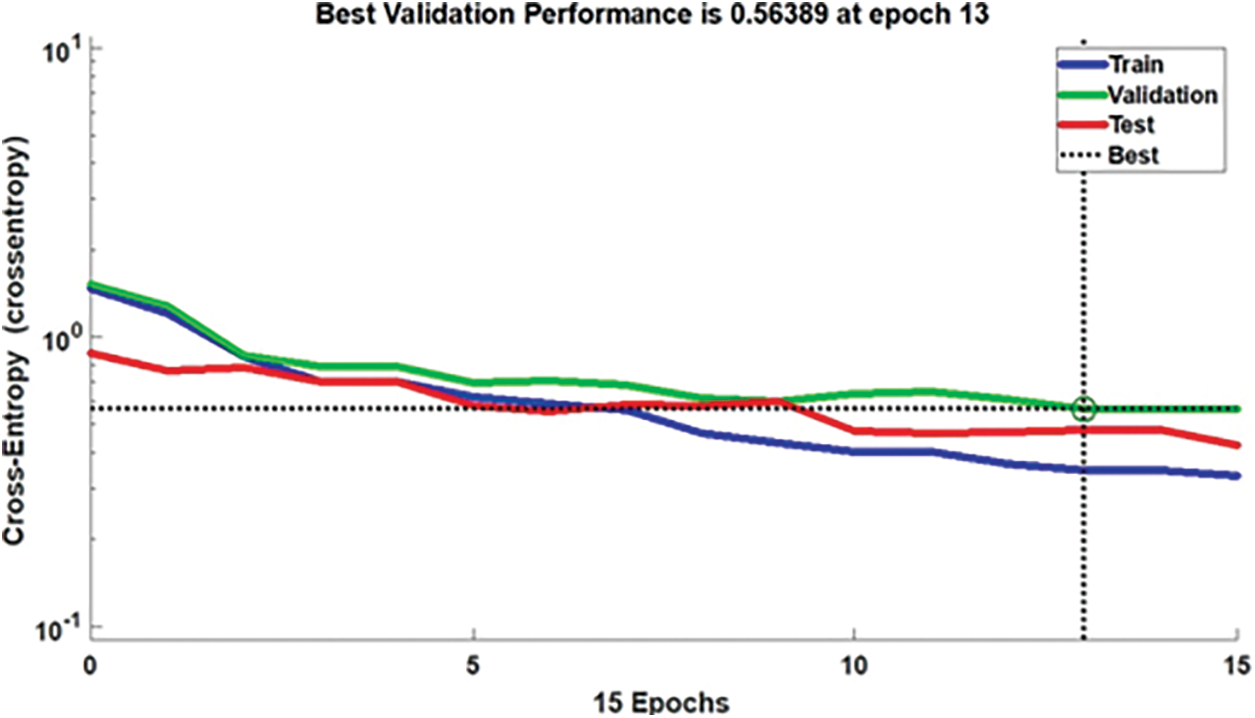
Figure 4: Performance of classifier in MLP at epoch 13
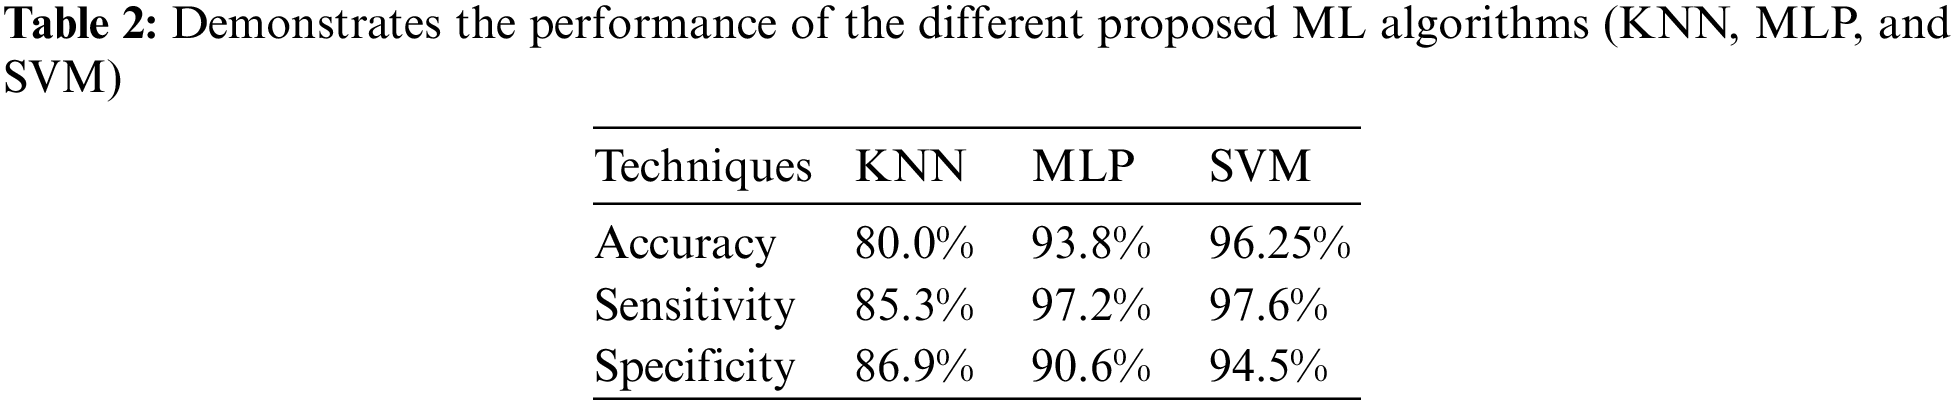
Discussion: The Tab. 2 proffers the specificity, accuracy, along with sensitivity values attained by different proposed KNN, MLP, and SVM algorithms. The comparison is performed by utilizing some qualitative performance metrics, say, specificity, accuracy, and sensitivity. The entire proposed ML models (KNN, MLP, and SVM) utilized the top-performing features at the time of model development and evaluation. Here, the proposed KNN acquires 80% accuracy, 85.30% sensitivity, and 86.9% specificity, the proposed MLP shows 93.8% accuracy, 97.2% sensitivity, and 90.6% specificity. Also, the proposed SVM offers 96.25% accuracy, 97.6% sensitivity, and 94.5% specificity. From these outcomes, the proposed SVM is confirmed to acquire higher most performance when analogized to the proposed KNN and MLP classifiers.
Discussion: Fig. 5 compares the diagnostic performance of disparate ML approaches (KNN, MLP, and SVM) with the utilization of approaches termed Receiver operating characteristic graph. This graph is utilized to explicate the performance shown by the binary classifier framework. Plot TPR and FPR at disparate threshold settings and this graph brings about a curve. Here, the proposed MLP and KNN proffer lowermost performance when analogized to the SVM. Thus, the prediction outcomes evinced that SVM performed-well when analogized to the other methods (KNN and MLP) by acquiring the maximal values of specificity (94.5%), accuracy (96.25%), along with sensitivity (97.6%).
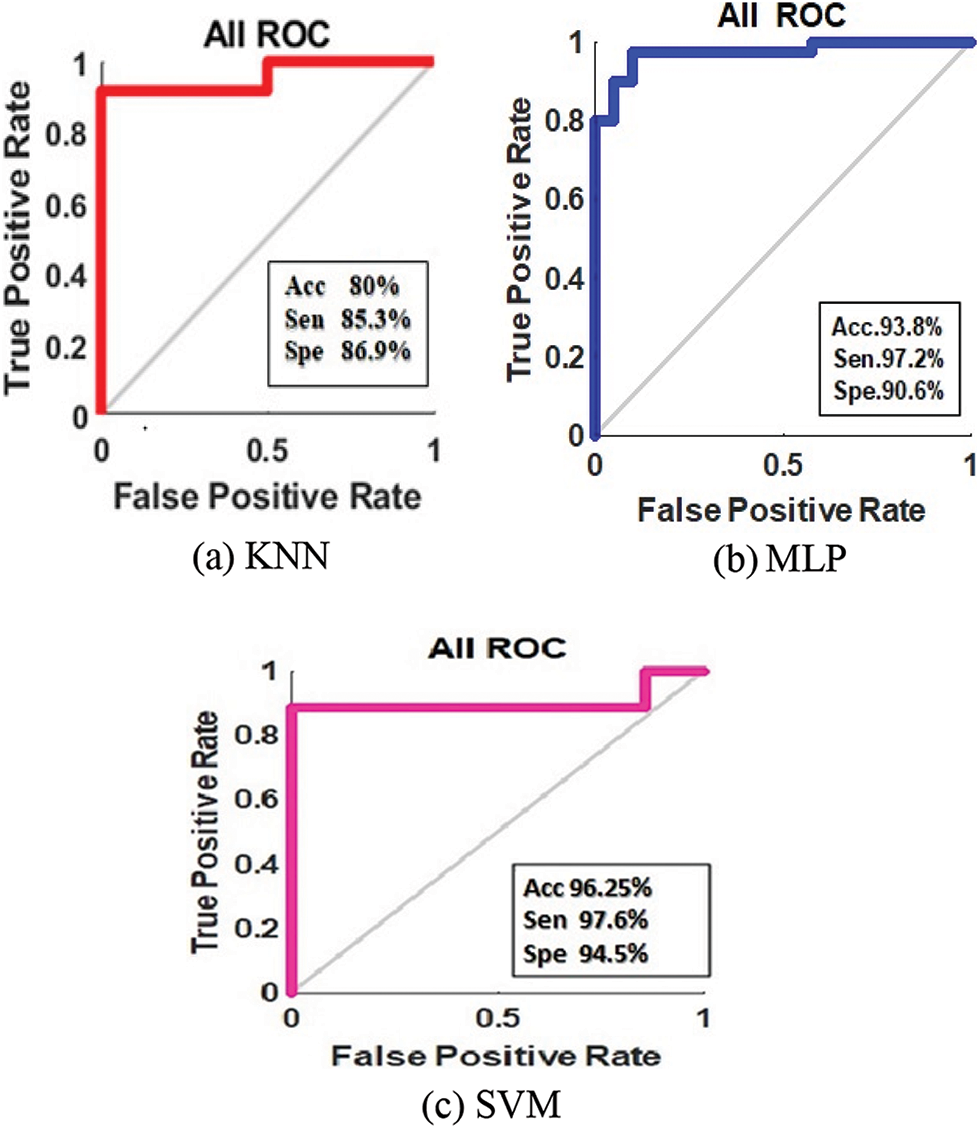
Figure 5: ROC curve of classification of predicted classes in 6 (a) KNN, 6 (b) MLP, and 6 (c) SVM
The prediction of diabetes mellitus disease is a hard task that could offer people an advantage of early knowledge and intervention. For people, this prediction enhances the health quality and averts the possibility of heart disease. An accurate prediction of the disease could significantly lessen national healthcare expenditure, specifically for diabetes mellitus and the associated complications. On that account, this work proposes to predict the chances of heart disease in diabetes mellitus patients utilizing disparate ML approaches like KNN, MLP, and SVM. The classifier predicts cardiovascular disease on diabetic persons or non-diabetic persons. The proposed KNN, MLP, and SVM are analyzed centered on its performance in respect of specificity, accuracy, and sensitivity metrics. Here, the proposed KNN, SVM, and MLP, and acquire 80%, 96.25%, and 93.80% accuracies. From the outcomes, the SVM is confirmed to have higher-most accuracy and minimum error rate than some existing classifiers. In the future, the research can well be made with the deep convolutional approaches for acquiring a minimal error rate and maximal accuracy in less time.
Acknowledgement: This research work was partially helped by Dr. Archana Gupta, General physician department, GRMC hospital, Gwalior and Dr. Nishika Saraswat, OMFS oncology department, BSES hospital, Mumbai and Biomedical laboratory MITS, College under Quality Improvement Programme Scheme Gwalior.
Funding Statement: The authors received no specific funding for this study.
Conflicts of Interest: The authors declare that they have no conflicts of interest to report regarding the present study.
References
1. G. Swapna, R. Vinayakumar and K. P. Somanm, “Diabetes detection using deep learning algorithms,” ICT Express, vol. 4, no. 4, pp. 243–246, 2018. https://www.sciencedirect.com/science/article/pii/S2405959518304624. [Google Scholar]
2. C. C. Naranjo, L. M. Sanchez-Rodriguez, M. B. Martínez, M. E. Baez and A. M. Garcia, “Permutation entropy analysis of heart rate variability for the assessment of cardiovascular autonomic neuropathy in type 1 diabetes mellitus,” Computers in Biology and Medicine, vol. 1, no. 86, pp. 90–97, 2017. [Google Scholar]
3. R. Sajratul Yakin, Md. M. Rahman and Md. K. Hasan, “Important feature selection & accuracy comparisons of different machine learning models for early diabetes detection,” in Int. Conf. on Innovation in Engineering and Technology (ICIET), Dhaka, Bangladesh, IEEE, pp. 1–6, 2018. [Google Scholar]
4. Y. Liu, S. Ye, X. Xiao, C. Sun, G. Wang et al., “Machine learning for tuning, selection, and ensemble of multiple risk scores for predicting type 2 diabetes,” Risk Management and Healthcare Policy, vol. 12, pp. 189–198, 2019. https://doi.org/10.2147/RMHP.S225762. [Google Scholar]
5. J. Li, B. Zhang, G. L. J. You and D. Zhang, “Body surface feature-based multi-modal learning for diabetes mellitus detection,” Information Sciences, vol. 472, pp. 1–14, 2019. https://doi.org/10.1016/j.ins.2018.09.010. [Google Scholar]
6. R. B. Lukmanto, A. Nugroho and H. Akbar, “Early detection of diabetes mellitus using feature selection and fuzzy support vector machine,” Procedia Computer Science, vol. 157, pp. 46–54, 2019. https://doi.org/10.1016/j.procs.2019.08.140. [Google Scholar]
7. P. Pławiak and U. R. Acharya, “Novel deep genetic ensemble of classifiers for arrhythmia detection using ECG signals,” Neural Computing and Applications, vol. 32, no. 15, pp. 11137–11161, 2020. [Google Scholar]
8. T. N. Gia and I. B. Dhaou, “Energy efficient fog-assisted IoT system for monitoring diabetic patients with cardiovascular disease,” Future Generation Computer Systems, vol. 93, pp. 198–211, 2019. https://doi.org/10.1016/j.future.2018.10.029. [Google Scholar]
9. B. Narasimhan and A. Malathi, “Artificial Lampyridae Classifier (ALC) for coronary artery heart disease prediction in diabetes patients,” International Journal of Advance Research, Ideas and Innovations in Technology, vol. 5, no. 2, pp. 683–689, 2019. [Google Scholar]
10. A. Mohsin and O. Faust, “Automated characterization of cardiovascular diseases using wavelet transform features extracted from ECG signals,” Journal of Mechanics in Medicine and Biology, vol. 19, no. 1, pp. 194009, 2019. https://doi.org/10.1142/S0219519419400098. [Google Scholar]
11. M. Aakanksha, S. Kumar and R. Bansal, “Diagnosis of diabetes mellitus using PCA and genetically optimized neural network,” in Int. Conf. on Computing, Communication and Automation (ICCCA), Greater Noida, India, IEEE, pp. 334–338, 2017. https://doi.org/10.1109/CCAA.2017.8229838. [Google Scholar]
12. S. Muhammad, S. Shah and F. A. Shah, “Support vector machines-based heart disease diagnosis using feature subset, wrapping selection and extraction methods,” Computers & Electrical Engineering, vol. 84, pp. 106628, 2020. https://doi.org/10.1016/j.compeleceng.2020.106628. [Google Scholar]
13. G. T. Reddy, N. Khare, S. Bhattachary and S. Singh, “Early detection of diabetic retinopathy using PCA-firefly based deep learning model,” Electronics, vol. 9, no. 2, pp. 274, 2020. https://doi.org/10.3390/electronics9020274. [Google Scholar]
14. R. R. Holman and R. L. Coleman, “Effects of acarbose on cardiovascular and diabetes outcomes in patients with coronary heart disease and impaired glucose tolerance (ACEA randomized, double-blind, placebo-controlled trial,” The Lancet Diabetes & Endocrinology, vol. 5, no. 11, pp. 877–886, 2017. https://doi.org/10.1016/S2213-8587(17)30309-1. [Google Scholar]
15. Md. A. Islam and N. Jahan, “Prediction of onset diabetes using machine learning techniques,” International Journal of Computer Applications, vol. 180, no. 5, pp. 7–11, 2017. https://doi.org/10.5120/ijca2017916020. [Google Scholar]
16. S. Xu, Z. Zhang and D. Wang, “Cardiovascular risk prediction method based on CFS subset evaluation and random forest clasxsification framework,” in IEEE 2nd Int. Conf. on Big Data Analysis (ICBDA), Beijing, China, IEEE, pp. 228–232, 2017. [Google Scholar]
17. S. Mirza, S. Mittal and M. Zaman, “Decision support predictive model for prognosis of diabetes using smote and decision tree,” International Journal of Applied Engineering Research, vol. 13, no. 11, pp. 9277–9282, 2018. [Google Scholar]
18. I. Insani, M. A. Alamsyah and A. T. Putra, “Implementation of expert system for diabetes diseases using naïve Bayes and certainty factor methods,” Sci. J. Informatics, vol. 5, no. 2, pp. 185–193, 2018. https://doi.org/10.15294/sji.v5i2.16143. [Google Scholar]
19. S. Perveen, M. Shahbaz, A. Guergachi and K. Keshavjee, “Performance analysis of data mining classification techniques to predict diabetes,” Procedia Computer Science, vol. 82, pp. 115–121, 2016. https://doi.org/10.1016/j.procs.2016.04.016. [Google Scholar]
20. L. Wang, X. Wang and A. Chen, “Prediction of type 2 diabetes risk and its effect evaluation based on the XGBoost model,” Healthcare, Multidisciplinary Digital Publishing Institute, vol. 8, no. 3, pp. 247, 2020. https://doi.org/10.3390/healthcare8030247. [Google Scholar]
21. O. Yildirim, M. T. Betul Ay, U. B. Baloglu, G. Aydin and U. R. Acharya, “Automated detection of diabetic subject using pre-trained 2D-CNN models with frequency spectrum images extracted from heart rate signal,” Computers in Biology and Medicine, vol. 113, pp. 103387, 2019. https://doi.org/10.1016/j.compbiomed.2019.103387. [Google Scholar]
22. U. R. Acharya, K. S. Vidya, D. N. Ghista, W. J. E. Lim, F. Molinari et al., “Computer aided diagnosis of diabetic subjects by heart rate variability signals using discrete wavelet transform method,” Knowledge-based Systems, vol. 81, pp. 56–64, 2015. https://doi.org/10.1016/j.knosys.2015.02.005. [Google Scholar]
23. B. Narasimhan and A. Malathi, “Improved fuzzy artificial neural network (IFANN) classifier for coronary artery heart disease prediction in diabetes patients,” Indian Journal of Applied Research, vol. 9, no. 4, pp. 1–4, 2019. [Google Scholar]
24. U. R. Acharya, O. Faust, S. V. Sree, D. N. Ghista, S. Dua et al., “An integrated diabetic index using heart rate variability signal features for diagnosis of diabetes,” Computer Methods in Biomechanics and Biomedical Engineering, vol. 16, no. 2, pp. 222–234, 2013. https://doi.org/10.1080/10255842.2011.616945. [Google Scholar]
25. H. Wu, S. Yang, Z. Huang, J. He and X. Wang, “Type 2 diabetes mellitus prediction model based on data mining,” Informatics in Medicine Unlocked, vol. 10, pp. 100–107, 2018. [Google Scholar]
26. Md. S. Islam, M. K. Qaraqe, S. B. Belhaouari and M. A. Abdul-Ghani, “Advanced techniques for predicting the future progression of type 2 diabetes,” IEEE Access, vol. 8, pp. 120537–120547, 2020. https://doi.org/10.1109/ACCESS.2020.3005540. [Google Scholar]
27. A. L. Goldberger, L. A. Amaral, L. Glass, J. M. Hausdorff, P. C. Ivanov et al., “Components of a new research resource for complex physiologic signal,” Circulation, vol. 101, no. 23, pp. e215–e220, 2013. https://physionet.org/physiobank/database/ptbdb. [Google Scholar]
28. S. Setiawidayat and A. Y. Rahman, “New method for obtaining peak value R and the duration of each cycle of electrocardiogram,” IEEE, vol. 4, no. 3, pp. 77–81, 2020. https://doi.org/10.29207/resti.v4i3.1658. [Google Scholar]
29. S. Setiawidayat, D. Sargowo, S. P. Sakti and S. Andarini, “The peak of the PQRST and the trajectory path of each cycle of the ECG 12-lead wave,” Indones. J. Electr. Eng. Comput. Sci, vol. 4, no. 1, pp. 169–175, 2016. [Google Scholar]
30. S. Malcolm and M. D. Thaler, The Only EKG Book You’ll Ever Need, 9th ed. Lippincott Williams & Wilkins, Philadelphia, US, 2021. [Google Scholar]
31. Q. Zhao and L. Zhang, “ECG feature extraction and classification using wavelet transform and support vector machines,” in 2005 Int. Conf. on Neural Networks and Brain, Beijing, China, vol. 2, pp. 1089–1092, 2005. [Google Scholar]
32. M. Saraswat, A. K. Wadhwani and S. Wadhwani, “Non-invasive estimation of HRV performance for diabetes mellitus with cardiac disorder on the basis of time-frequency and poincare plot analysis,” in Intelligent Computing Applications for Sustainable Real-World Systems, ICSISCET 2019. Proceedings in Adaptation, Learning and Optimization, Cham: Springer, vol. 13, 2020. https://doi.org/10.1007/978-3-030-44758-8_42. [Google Scholar]
33. S. Rajasekaran and G. A. V. Pai, “Neural networks, fuzzy logic and genetic algorithm: Synthesis and application,” in PHI Learning, 2003. [Online]. Available: https://books.google.co.in/books?id=S9XzngEACAAJ. [Google Scholar]
34. S. Bhatia, P. Prakash and G. N. Pillai, “SVM based decision support system for heart disease classification with integer-coded genetic algorithm to select critical features,” in Proc. of the World Congress on Engineering and Computer Science, San Francisco, USA, pp. 978-988-98671-0-2, 2008. [Google Scholar]
35. M. H. Asyali, “Discrimination power of long-term heart rate variability measures,” Proceedings of the 25th Annual International Conference of the IEEE Engineering in Medicine and Biology Society, vol. 1, pp. 200–203, 2003. [Google Scholar]
36. M. A. M. Abushariah, A. A. M. Alqudah, O. Y. Adwan and R. M. M. Yousef, “Automatic heart disease diagnosis system based on artificial neural network (ANN) and adaptive neuro-fuzzy inference systems (ANFIS) approaches,” Journal of Software Engineering and Applications, vol. 7, no. 12, pp. 1055–1064, 2014. [Google Scholar]
37. W. Chen, L., Zheng, K. Li, Q. Wang, G. Liu et al., “A novel and effective method for congestive heart failure detection and quantification using dynamic heart rate variability measurement,” PLoS One, vol. 11, no. 11, pp. e0165304, 2016. [Google Scholar]
 | This work is licensed under a Creative Commons Attribution 4.0 International License, which permits unrestricted use, distribution, and reproduction in any medium, provided the original work is properly cited. |