DOI:10.32604/jihpp.2022.026440
| Journal of Information Hiding and Privacy Protection DOI:10.32604/jihpp.2022.026440 | |
| Article |
SPN-Based Performance Analysis of Multiple Users’ Behaviors for SNS
1School of Data Science and Media Intelligence, Communication University of China, Beijing, 100024, China
2Collaborative Innovation Center, Communication University of China, Beijing, 100024, China
3State Key Laboratory of Media Convergence and Communication, Communication University of China, Beijing, 100024, China
4School of Computer and Cyber Sciences, Communication University of China, Beijing, 100024, China
*Corresponding Author: Zhiguo Hong. Email: hongzhiguo@cuc.edu.cn
Received: 27 December 2021; Accepted: 29 January 2022
Abstract: With the rapid development of various applications of Information Technology, big data are increasingly generated by social network services (SNS) nowadays. The designers and providers of SNS distribute different client applications for PC, Mobile phone, IPTV etc., so that users can obtain related service via mobile or traditional Internet. Good scalability and considerably short time delay are important indices for evaluating social network systems. As a result, investigating and mining the principle of users’ behaviors is an important issue which can guide service providers to establish optimal systems with SNS. On the basis of analyzing the characteristics of social network system, this paper constructed a Stochastic Petri Net (SPN) model for describing the behaviors of three users for SNS. Moreover, the scalability of users’ behaviors of SNS was studied by extending the SPN model of three users to the one of four users. Furthermore, average time delay was chosen as the performance index to evaluate the performance of these two constructed SPN models with Stochastic Petri Net Package (SPNP) 6.0. For different parameters of number of connections, traffic load and buffer size, various trends and numerical results are derived thereby. The methodology of modeling and simulation in this paper can be further used to study the performance of SNS.
Keywords: Social network; petri nets; performance analysis; traffic load
The evolution of smartphones, social network services (SNS) [1,2] and cloud compuing has led to big data era [3]. Social network sites play an important role in connecting various users via networks. By using SNS, people all over the world can share their information and opinion with each other very easily and conveniently [4]. They chat with each other and exchange data through social network systems. Among those systems, skype and twitter are successful examples. Reference [4] proposed user profile data ontology for SNS. That is, by considering Age, Gender, Education, Interesting, Use friendly, Club and Blog as the factors in their work, one user profile data ontology for SNS was proposed. Further, petri-net based user profile data ontology for SNS was constructed, which gave a brief process and specification for user profile data ontology. However, quantitative analysis of social network systems would be more instructive for SNS providers and it has been an important and urgent issue to better the experiences for users. Good scalability and considerably short time delay are key indices for evaluating social network systems.
Nowadays, methodologies of performance evaluation for collaborative system mainly take three ways, which are direct measurement, mathematic modeling [5,6], and simulation. Mathematic modeling and simulation are undoubted useful methodologies. Consequently, how to model and evaluate the behaviors of participants is an important issue which offers theoretical foundations for building and deploying manage systems for entertainment performance chains. Petri nets, which was first developed in 1962 by C.A. Petri in his PhD. dissertation, is powerful in modeling concurrent, distributed, asynchronous behaviors of a system [7]. With algebra theory and the net theory as its mathematical basis, the Petri nets theory has been successfully employed to describe various relations and behaviors of the discrete event system and communication networks [8,9].
Social network analysis is a process of analyzing networked structure using graph theory [10]. Consequently, the properties of network’s topology can be studied as performance indices, such as density, degree, betweenness, closeness. Reference [11] presented an algorithm for the automatic generation of hypothetical Sociograms (Social Network Graphs). Reference [12] utilized topological indices to analyze social networks. Besides, Reference [13] used graph theory and network science to make link prediction of social networks.
However, these related works on Social Network Systems only focus on the static performances and lack the detailed interactions among users and systems. As a result, they didn’t take the dynamic behaviors of users into account.
For this, we concern on the dynamic and parallel behaviors of users in this paper.
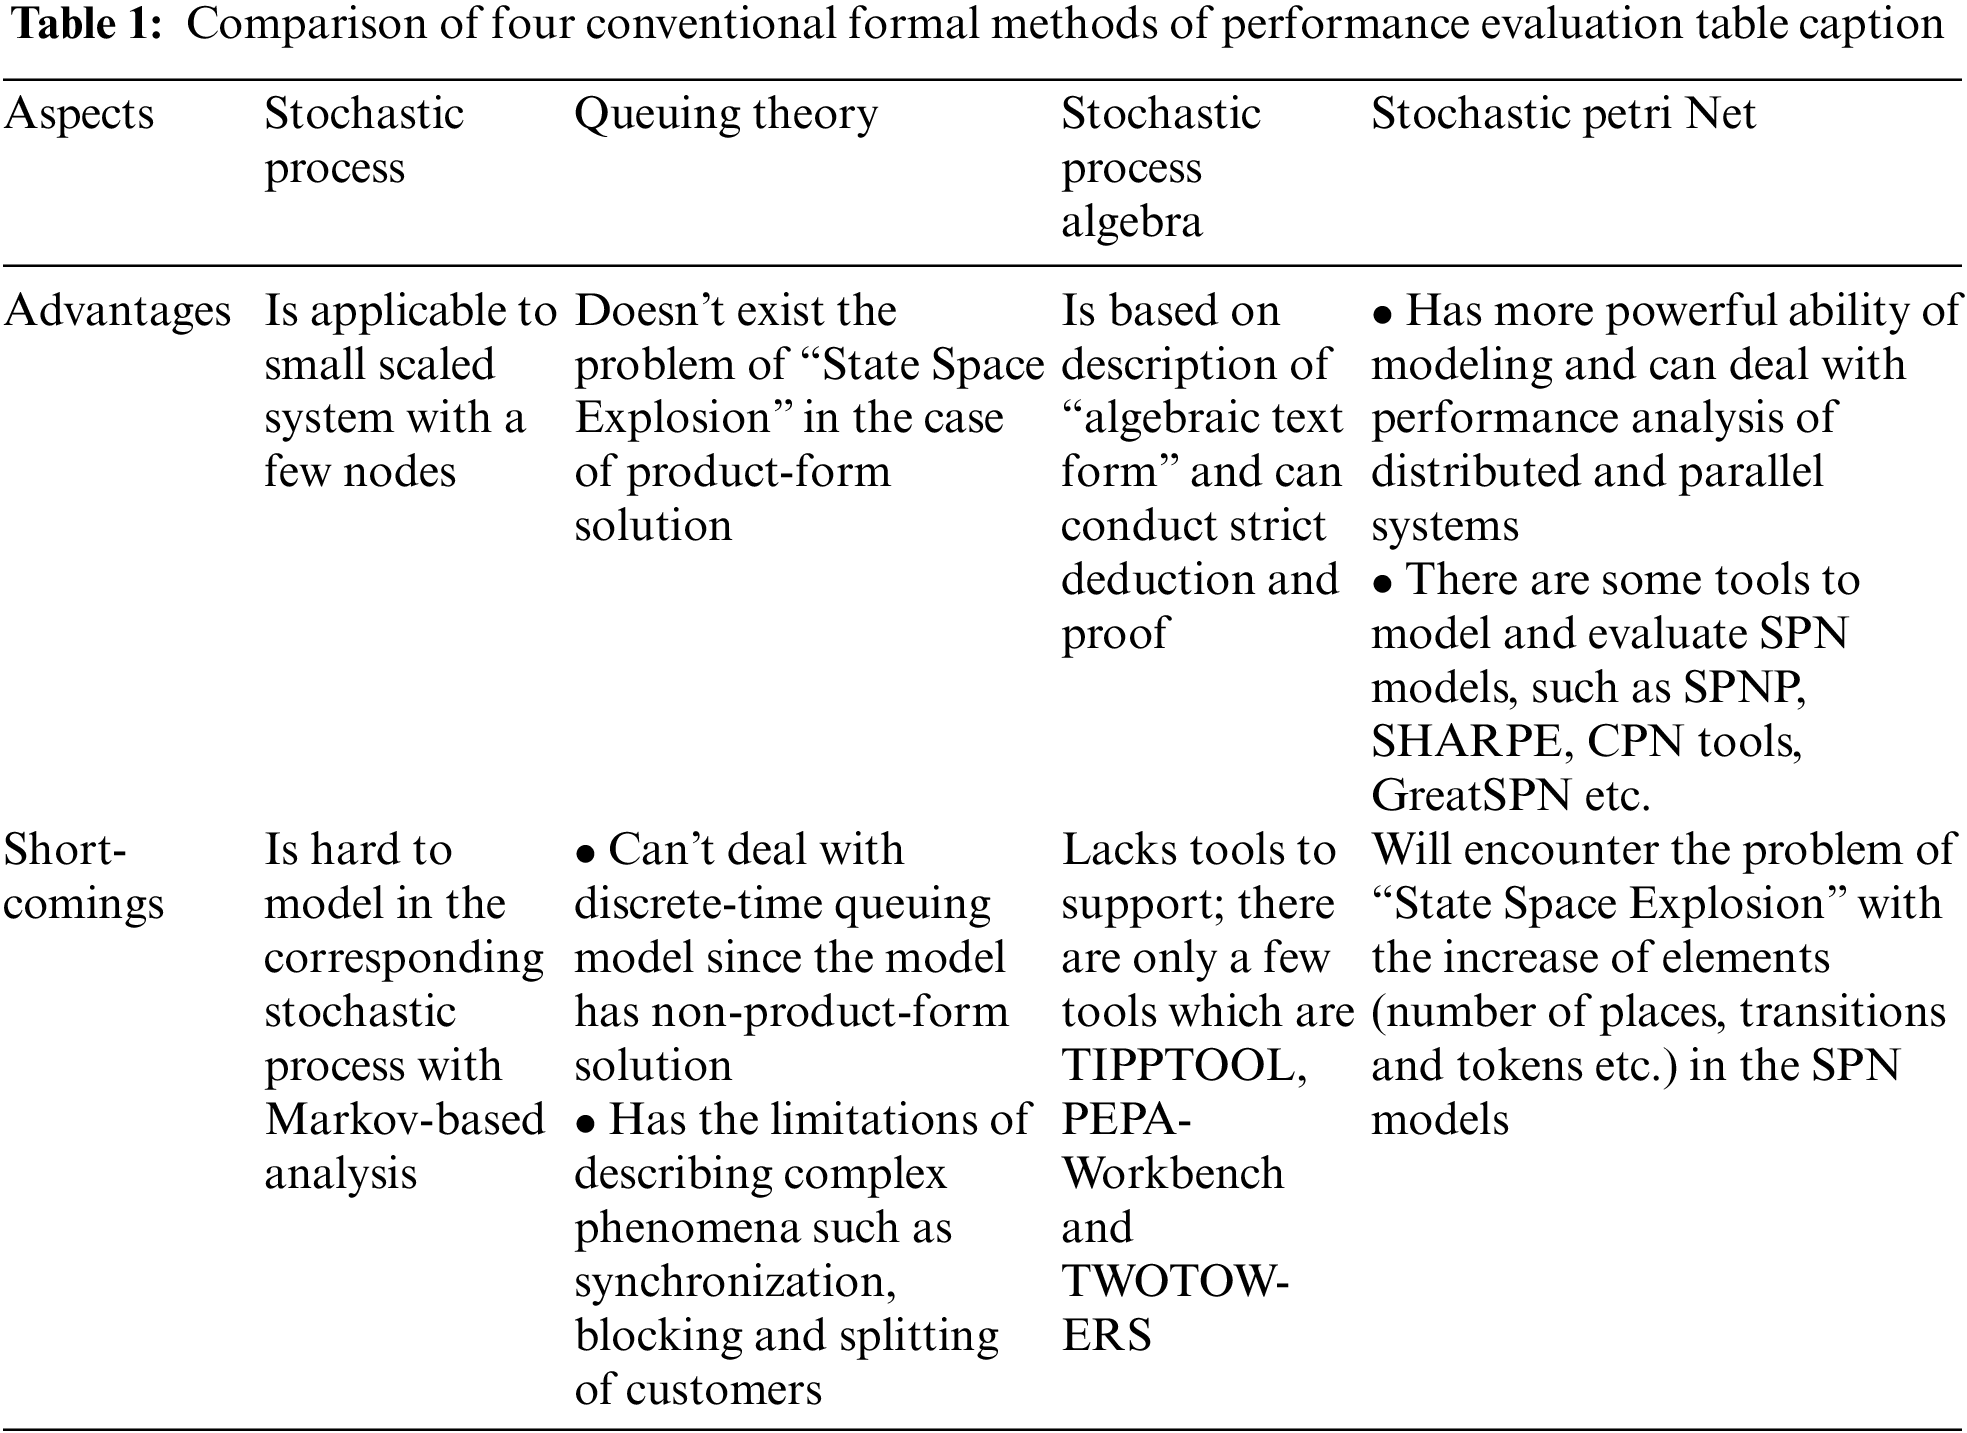
1.2 Comparison of Some Formal Methods of Performance Evaluation
There are some commonly used formal methods to evaluate the performance of computer networks and systems. Here, comparison of four conventional formal methods, which are Stochastic Process, Queuing Theory, Stochastic Process Algebra and Stochastic Petri Net [14], is listed in Tab. 1.
Therefore, this paper conducted Petri-net based performance analysis of multiple users’ behaviors for SNS. The remainder of this paper is organized as follows. In Section 2, we study the interactive process among three users for SNS and give the timing diagram for these users’ behaviors. In Section 3, we construct two Stochastic Petri Net (SPN) [15] models of behaviors for SNS in the case of three users and four users respectively. In Section 4, by choosing average time delay as the performance index, performance evaluations of these constructed SPN models are made with Stochastic Petri Net Package (SPNP) 6.0 [16]. For different parameters of message number, traffic load and bandwidth of shared links, various trends are derived through numerical analysis thereby. Finally, Section 5 concludes this paper.
2 Interaction Process Among Three Users for SNS
All For typical social network systems, there are a number of interactive relationships among users and the systems. Fig. 1 gives the timing diagram of interaction process among three users and social network system. Here User1, User2 and User3 are used to symbolize the three users. Besides, let K2 represent available bandwidth of shared links.
As Fig. 1 demonstrates, the whole interaction process can be divided into three phases, which are preparation procedure, critical transmission one and shared transmission one.
Here we introduce the detailed steps in the interaction process as follows.
I. Three users are ready for delivering data packets.
II. During the critical transmission procedure, only one of three users can gain the right of data transmission. Each user is requesting links for transmission with q units of bandwidth.
III. Then the social network system checks if there are available bandwidth of critical links. When “available bandwidth of critical links ≥ q” satisfies, q units of bandwidth are set aside for one of triple users. At the same time the other two users are queued.
IV. The user who has gained the access of critical links delivers data packets.
V. After the phase of critical transmission, the user releases q units of bandwidth. At the same time, the critical links of social network system are recovered to be available.
VI. During the shared transmission procedure, some or all of three users can deliver data packets according to the size of shared links’ available bandwidth. Each user is requesting links for transmission with q units of bandwidth.
VII. Then the social network system examines if there are available bandwidth of shared links.
VIII. Once “q ≤ K2 < 2q” holds, q units of bandwidth are offered for one of triple users. When “2q ≤ K2 < 3q” satisfies, q units of bandwidth are offered for two of triple users respectively. On the “K2 ≥ 3q” exists, each of triple users can obtain sufficient bandwidth for delivering data packets.
IX. After the phase of shared transmission, the users release q units of bandwidth correspondingly. Meanwhile, the shared links of social network system are recovered to be available.
X. Three users are ready for the next round’s data transmission.
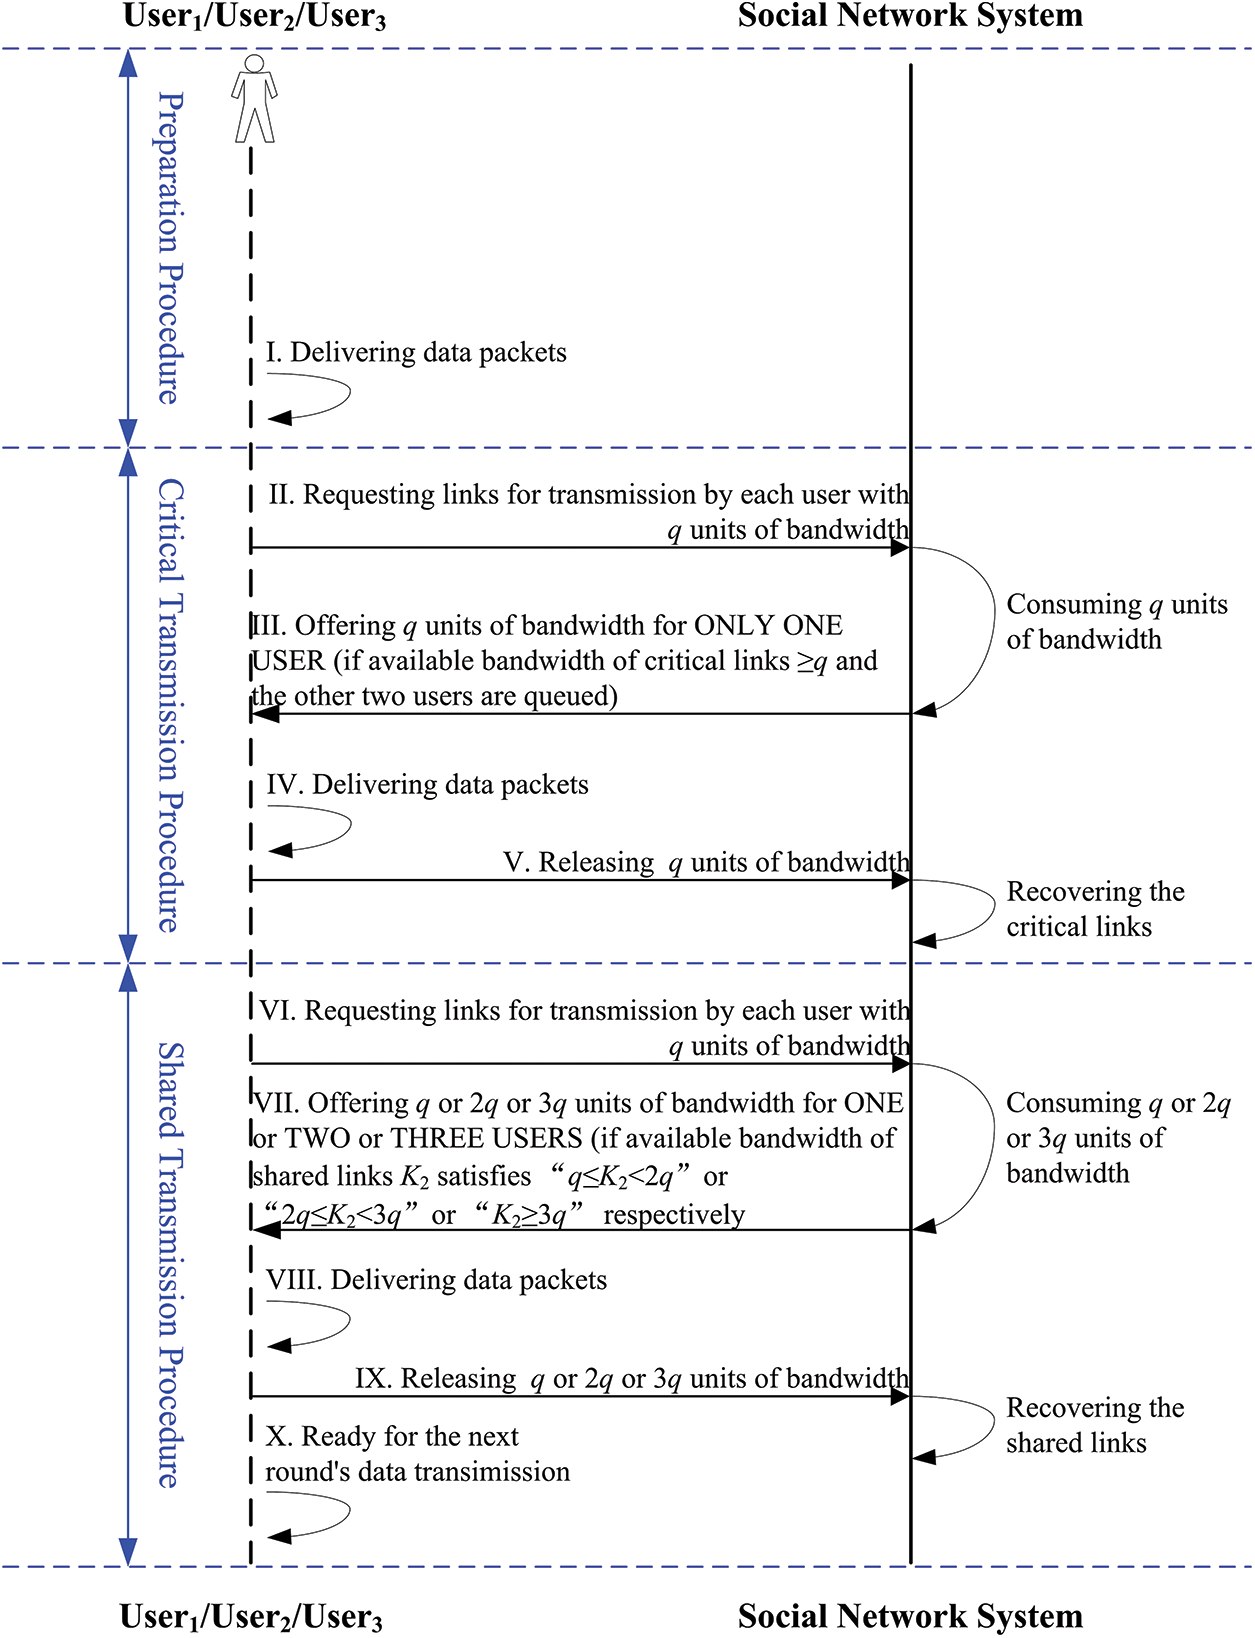
Figure 1: The timing diagram of interaction process among three users and social network system
3 SPN Model of Three Users’ Behaviors for SNS
Places and transitions are two basic types of elements of Petri net. The connection between place and place or between transition and transition is not allowed. A directed arc connecting a place (transition) to a transition (place) is called an input arc (output arc) of the transition. The number of tokens in a place is zero or positive integer. And a positive number can also be assigned to the multiplicity of corresponding input arc. The corresponding transition is enabled if each of its input places’ tokens is no less than the multiplicity of an input arc.
Here, we assume that “the behaviors of three users’ arrivals are independent of each other, and follow the Poisson process”. Further, we assume that the topology of SNS to be network structure. We can model real users’ interactions with a different order of magnitude by setting different arrival rates which are symbolized with λ. In order to reflect the phenomena of high load when users acquire bandwidth, we use the weighted arcs with the value of q. We constructed the SPN model as shown in Fig. 2.
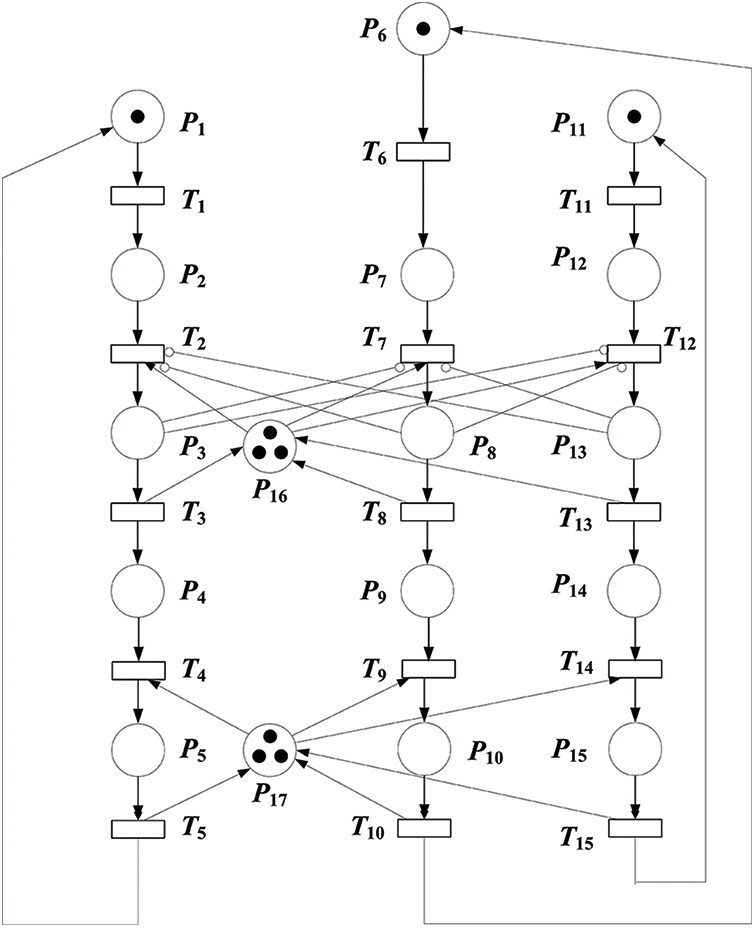
Figure 2: SPN model of three users’ behaviors for SNS
Let “#” symbolize the token number of a certain transition. The firing condition of T2 is formalized as follows:
As mentioned above, during the Critical Transmission Procedure, only one user can obtain the right of transmission. Therefore, as Fig. 2 demonstrates, six arcs are used to express mutual exclusion among three users, which are the arc from P3 to T7, the one from P3 to T12, the one from P8 to T2, the one form P8 to T12, the one from P13 to T2 and the one from P13 to T7.
As Fig. 2 symbolizes, 12 arcs reflect the phenomena of competition in using the shared bandwith (buffer) with different resource needs. For the Criticital Transimisson Procedure, six arcs are connected among place P16 and transitions T2, T3, T7, T8, T12, T13. In the same way, for the Shared Transimisson Procedure, another six arcs are jointed among place P17 and transitions T4, T5, T9, T10, T14, T15.
In the same manner, during the Shared Transimisson Procedure, three users request for using shared bandwidth (buffer) simultaneously. The related transition can be fired if the available bandwidth (buffer) is enough to utilize. Otherwise, the user has to be queued until the firing condition is satisfied.
Additionally, the firing condition of T4 is formalized as follows:
Moreover, the scalability of users’ behaviors of SNS is studied by extending the SPN model of three users to the one of four users.
4 SPN Model of Four Users’ Behaviors for SNS
For the same, by making similar assumptions and analyzing the interaction process among four users, the SPN model of four users’ behaviors for SNS as Fig. 3 shows.
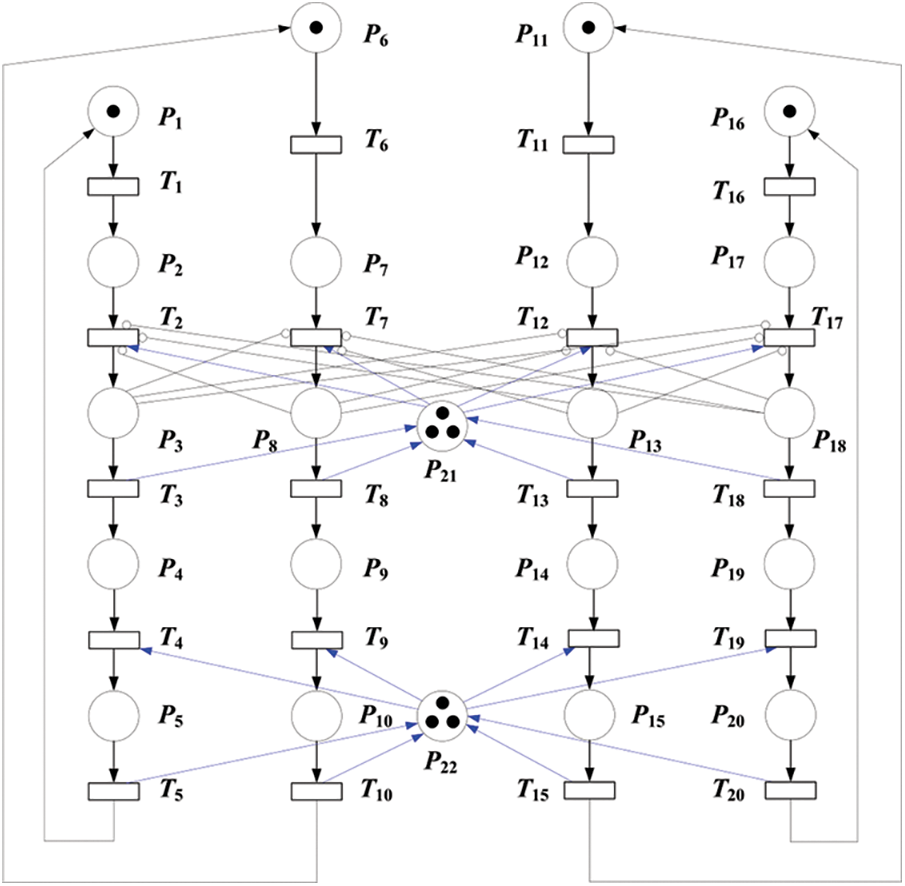
Figure 3: SPN model of four users’ behaviors for SNS
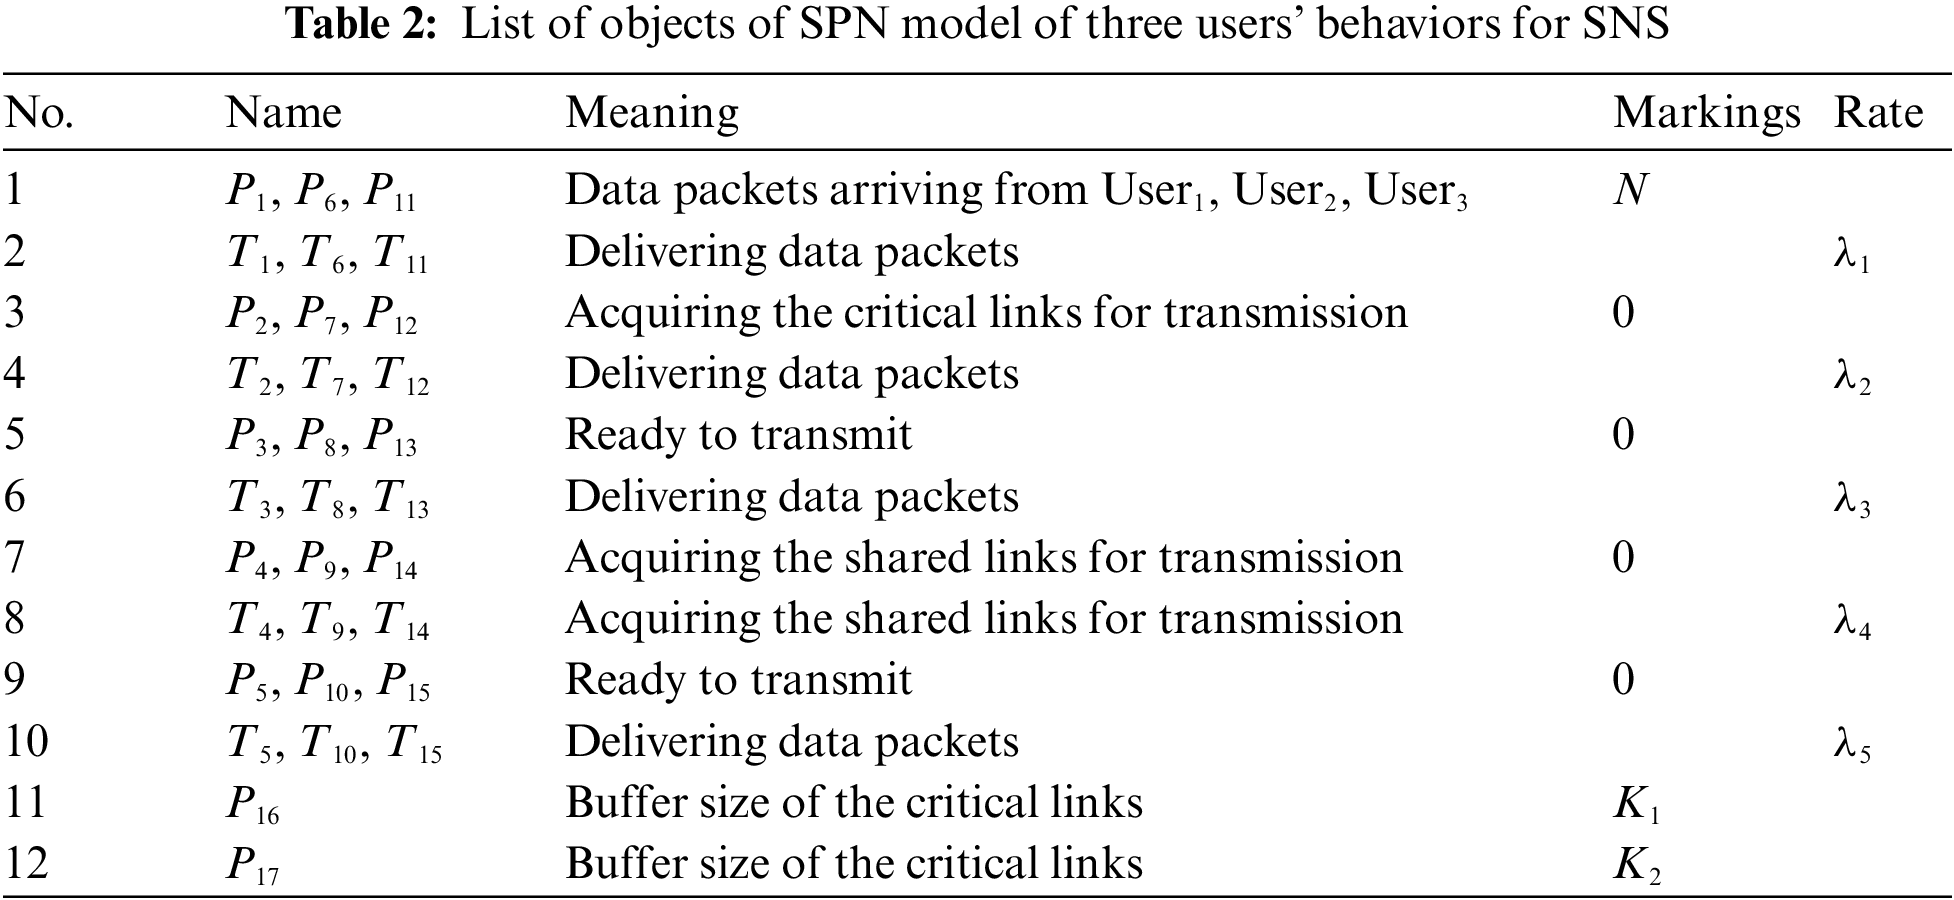
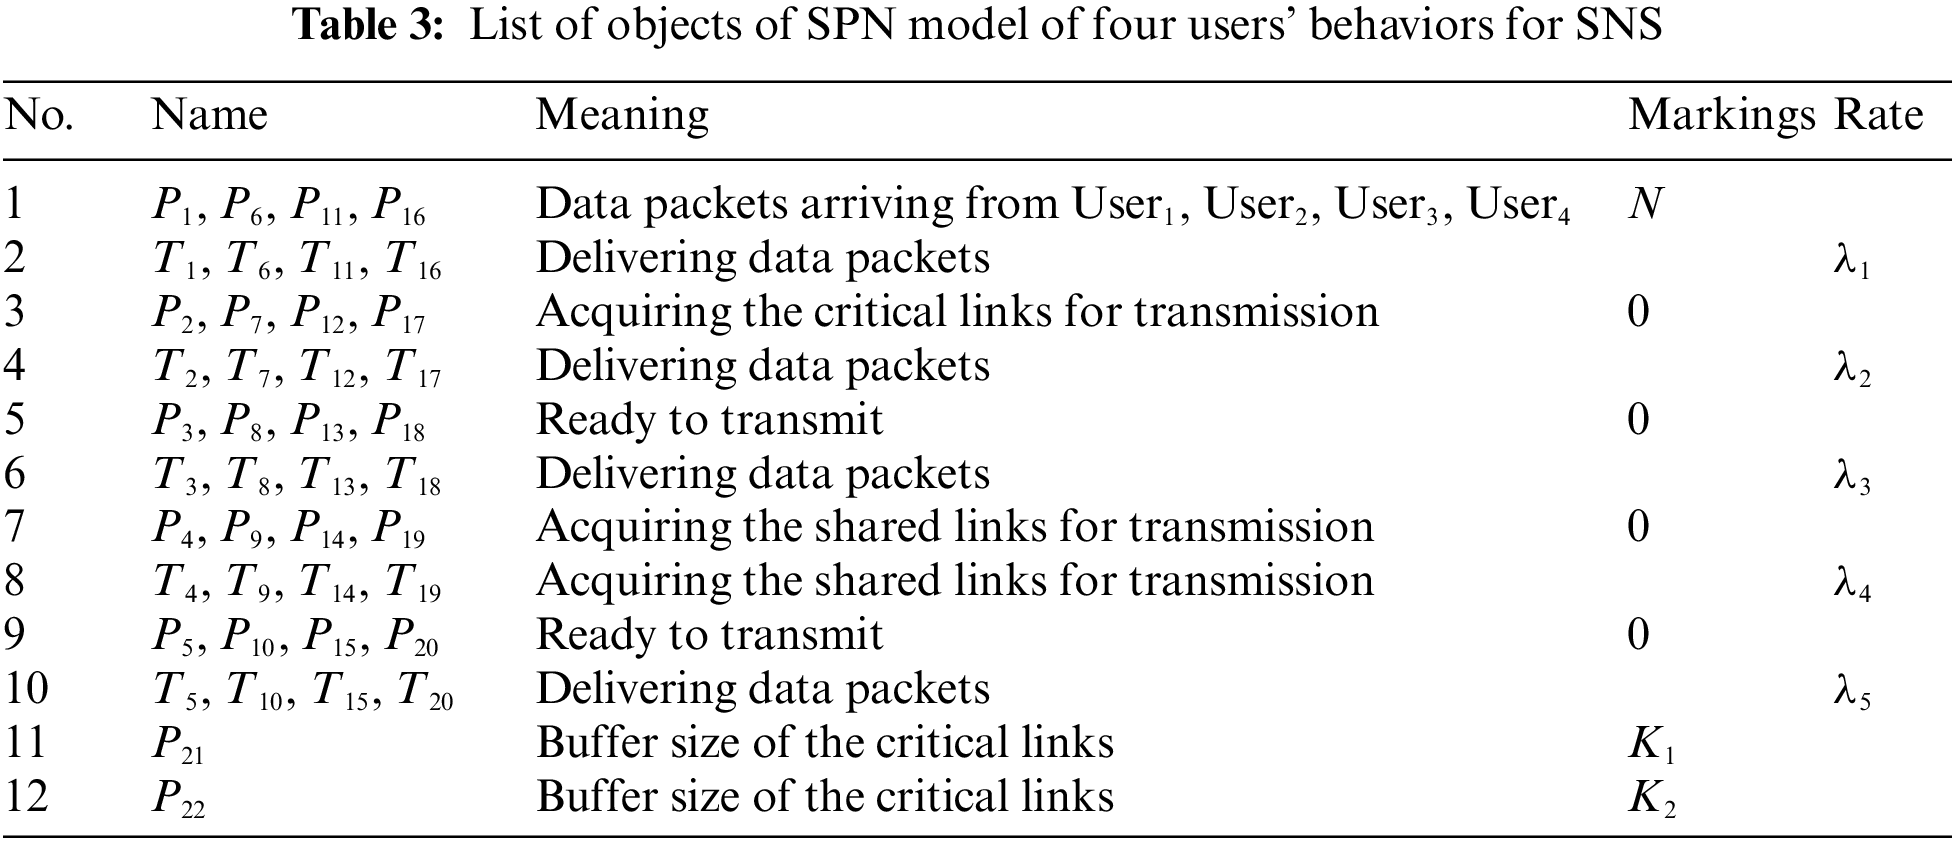
The objects of this SPN model are listed in Tab. 3.
5.1 Performance Evaluation of two SPN Models
In this part, we will conduct performance evaluation of two constructed SPN model of three users’ behaviors and four users’ ones for SNS respectively.
Based on the analysis of multiple users’ behaviors for SNS, we concern average time delay of social network system for each user as a key performance index. Further, through SPN reachability analysis and isomorphic continuous time Markov process equations with SPNP 6.0 software, we can calculate average time delay of the constructed SPN model by applying Little’s theorem and principle of balance [17]. Additionally N represents the value of tokens, which means the number of data packets to be delivered for each
Further, due to the symmetry of three users’ behaviors and four users’ ones, the firing rates of related transitions are set to be the same in these constructed SPN models. Consequently, the average time delays of three users or four users for SNS are also identical. Then four experiments are designed to study different parameters’ effects on average time delay.
Case 1: In the case of q = 2, K1 = 2, λ1 = λ2 = λ3 = λ4 = λ5 = 0.25, the effect of number of data packets, buffer size of the shared links on average time delay is shown in Fig. 4. For the different parameters of K2 = 2, 4 and 6, three corresponding series are depicted.
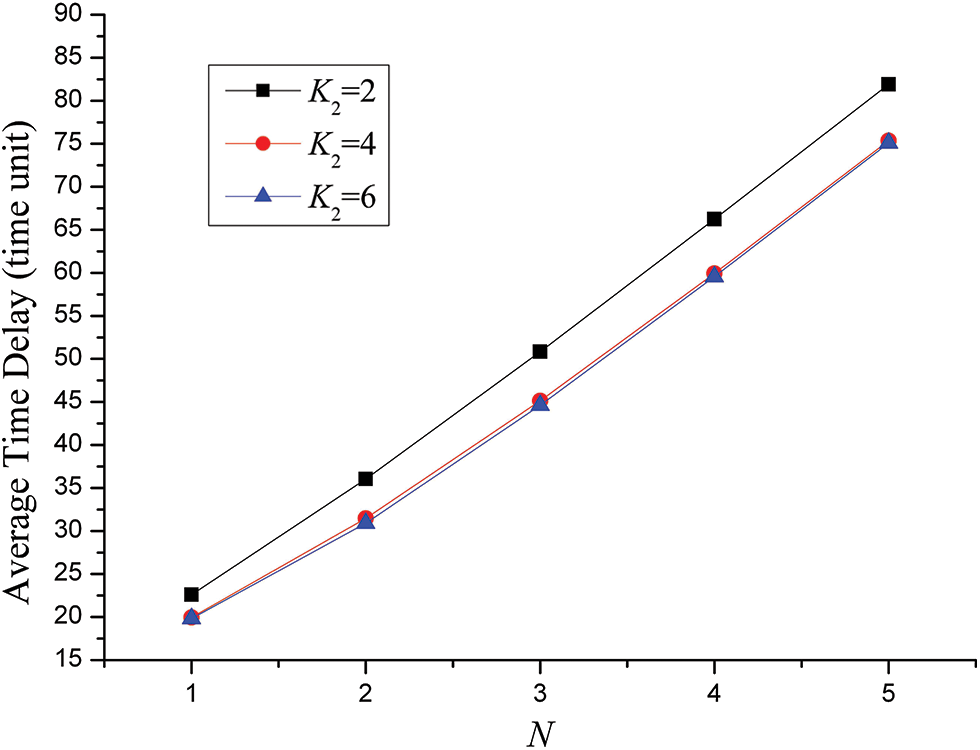
Figure 4: Effect of number of data packets, buffer size of the shared links on average time delay for the SPN model of four users’ behaviors for SNS
Due to the increase of data packets to be delivered, it can be seen that in general for each user average time delay becomes bigger with the addition of N. Also “q = 2” reveals that each user’s traffic load is in a relatively low level. What’s more, three users competes with each other in using shared links to gain the right of transmitting data packets. For the curve of K2 = 2, it satisfies the equation of K1 = q, which means only one of three users can deliver data packets at the same time. Thus, two other users will be queued until the shared links are available. For the curve of K2 = 4, it satisfies the equation of K1 = 2q, which means only two of three users can send data packets meanwhile. Threefore, another user has to be waited until the shared links are free. For the curve of K2 = 6, it satisfies the equation of K1 = 3q, which means all of three users can deliver data packets simultaneously. This is the reason why we can observe that for a certain N, average time delay of the curve of K2 = 2 is much bigger than that of the curve of K2 = 4. Also, for a certain N, average time delay of the curve of K2 = 4 is slightly higher than that of the curve of K2 = 6.
Case 2: In the case of N = 3, K1 = 5, λ1 = λ2 = λ3 = λ4 = λ5 = 0.25, the effect of traffic load, buffer size of the shared links on average time delay is illustrated in Fig. 5. For the different parameters of K2 = 5, 8, 10, 13, 15 and 18, six corresponding series are plotted.
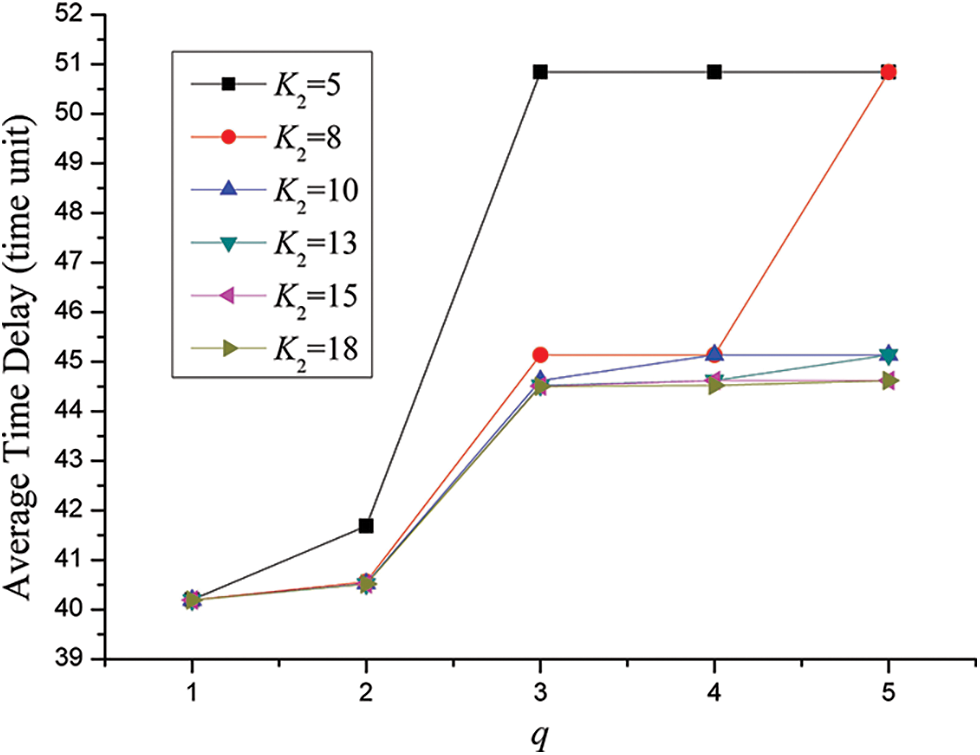
Figure 5: Effect of traffic load, buffer size of the shared links on average time delay for the SPN model of three users’ behaviors for SNS
Due to the uprise of traffic load of each user in the social network system, it can be observed that as a whole average time delay increases with the augment of q. Moreover, with the rise of traffic load for each user average time delay become bigger gradually in the form polygonal line. Besides, for a certain traffic load q, larger buffer size of the shared links would lead to smaller average time delay. Further, take the curve of K2 = 5 for instance, average time delay of q = 3 is much bigger than that of q = 2. Still, there exist two jump points in the curve of K2 = 8 which are the dots when q = 3 and q = 5 respectively.
In order to explore the mechanism of K2’s accurate affections on average time delay for each user, we can find that there exists a regular mode about jump points. With regard to these points, average time delay increase drastically relative to former points. Since shorter average time delay play an important role in improving user’s experience on SNS, one key principle of designing social network system is to minimize the chance of conflicts in using shared links to the utmost. That is, the best and optimal condition is that the buffer size of the shared links is large enough for all users to deliver data packets in parallel. Still, the better condition is that the buffer size of the shared links is sufficient for some users to transmit data packets at the same time. And the worst condition is that the the buffer size of the shared links can only offer the right of transferring data for just one user at one time. In short, queue delay will take a large proportion of average time delay for the better condtion and the worst one. More exactly, these jump points in Fig. 4 will appear when
Case 3: In the case of q = 2, K1 = 2, λ1 = λ2 = λ3 = λ4 = λ5 = 0.25, the effect of number of data packets, buffer size of the shared links on average time delay is shown in Fig. 6. For the different parameters of K2 = 2, 4, 6 and 8, four corresponding series are displayed.
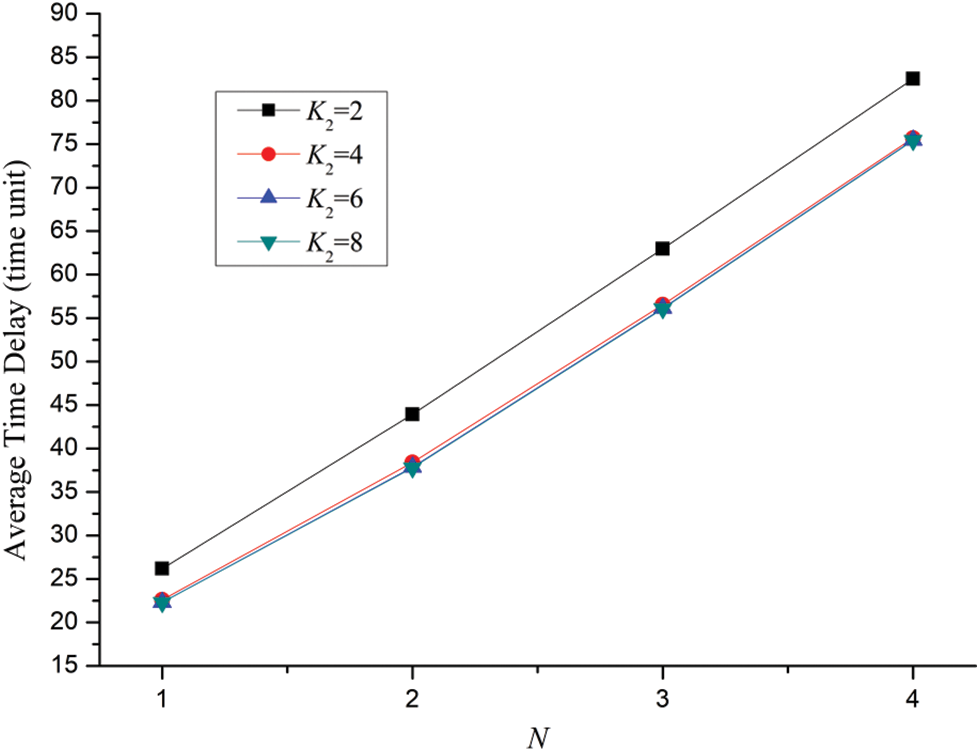
Figure 6: Effect of number of data packets, buffer size of the shared links on average time delay for the SPN model of four users’ behaviors for SNS
Due to the augment of data packets to be delivered, it can be observed that for each user average time delay tends to become bigger with the addition of N. In this case, q is set to be 2. Additionally, four users compete with each other in using shared links to gain the chance of transmitting data packets. For the curve of K2 = 2, it satisfies the equation of K2=q, which means that only one of four users can deliver data packets at the same time. Consequently, three other users will be queued until the shared links are available. For the curve of K2 = 4, it satisfies the equation of K2 = 2q, which means that only two of four users can send data packets simultaneously. Therefore, another two users have to be waited until the shared links are available for transmission. For the curve of K2 = 6, it satisfies the equation of K2 = 3q, which shows that among four users, three users can deliver data packets for this time. Still, for the curve of K2 = 8, it satisfies the equation of K2 = 4q, which signs that all these four users can deliver data packets at that time. This is the reason why we can observe that for a certain N, average time delay of the curves appear to decline with the increase of K2.
Case 4: In the case of N = 3, K1 = 5, λ1 = λ2 = λ3 = λ4 = λ5 = 0.25, the effect of traffic load, buffer size of the shared links on average time delay is illustrated in Fig. 7. For the different parameters of K2 = 5, 8, 10, 12, 15, 16, 20 and 23, eight corresponding series are charted.
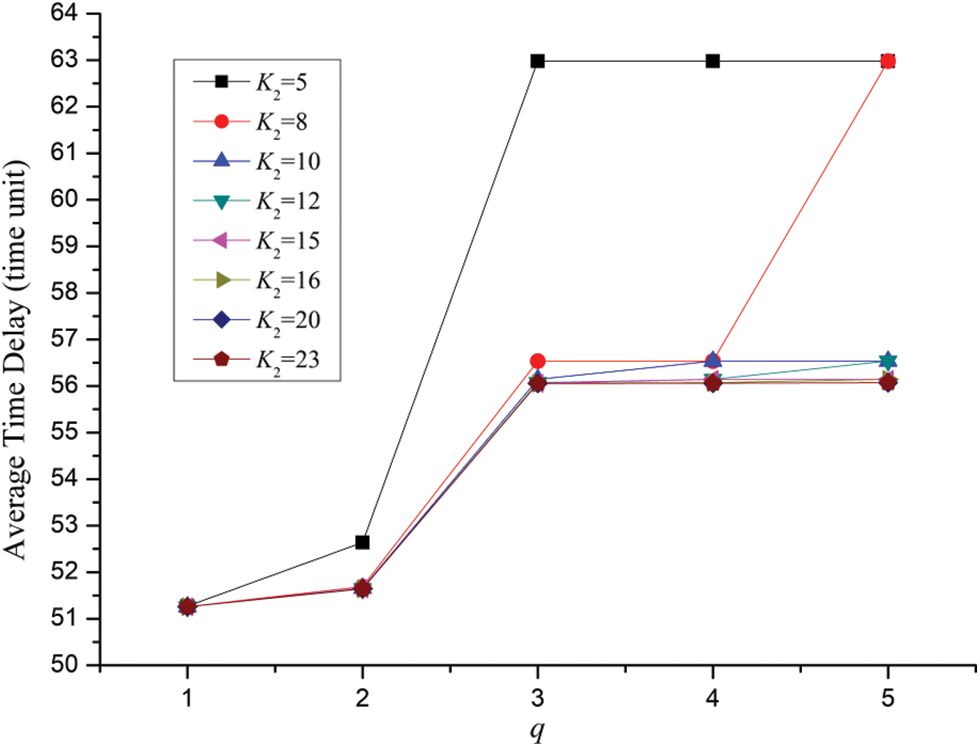
Figure 7: Effect of traffic load, buffer size of the shared links on average time delay for the SPN model of four users’ behaviors for SNS
Due to the increase of traffic load of every user in the social network system, it can be noticed that average time delay gradually increases with the raise of q. Besides, with the augment of traffic load for each user average time delay become bigger generally in the form polygonal line which is very similar to the pattern demonstrated in Fig. 5. Still, for a certain traffic load q, larger buffer size of the shared links would lead to smaller average time delay. Further, take the curve of K2 = 10 for example, average time delay of q = 3 is much bigger than that of q = 2. Additionally, there exist three jump points in the curve of K2 = 10 which are the dots when q = 2, q = 3 and q = 4 respectively.
In the same way, the jump points in Fig. 7 will occur when
Theoretically, the methodology of SPN model-based modeling and performance evaluation in this paper can further be extended under the condition of the number of users being more than five. However, because of the complexity of SPN model and interactions among elements (i.e., places and transitions) the solution of the model will encounter the problem of state explosion.
5.2 The Problem of State Explosion
We take “tangible markings” (abbr. Markings) and “marking-to-marking transitions” (abbr. Transitions) as two performance indices to investigate the complexity of SPN model of four users’ behaviors for SNS. Once the number of such performance indices becomes considerably large, it would cost much time of solving related model with SPNP software.
Case 5: In the case of q = 2, K1 = 2, λ1 = λ2 = λ3 = λ4 = λ5 = 0.25, the effect of number of data packets, buffer size of the shared links on the number of the model’s states is illustrated in Fig. 8. For the different parameters of K2 = 2, 4 6 and 8, eight corresponding series are plotted.
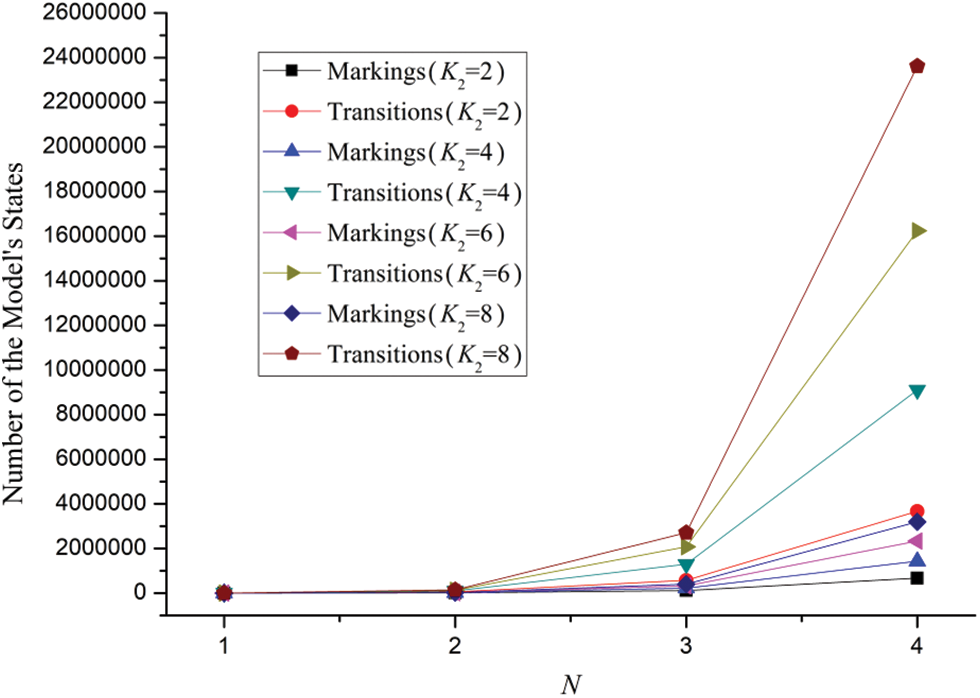
Figure 8: The number of Reachable Graph States for the SPN model of four users’ behaviors for SNS
From Fig. 8 we can observe that with the enlargement of N, the number of reachable graph states for the SPN model increases drastically and has the tendency of exponential growth. Moreover, the phenomenon is rather obvious by comparing the adjacent dots of various series of curves when N = 3 and N = 4. Still, it can be noticed that the number of Markings nearly reaches 24,000,000 which signs a large amount of states.
Besides, we make an in-depth experiment to calculate the average time delay of the SPN model of four users’ behaviors for SNS for the parameters of N = 5, q = 2, K1 = 2 and K2 = 8. However an exception occurs with the hint of “EXIT: not enough memory”. That is to say, for the SPN model of multiple users above five, we can hardly solve the model since this would be beyond the limitation of SPNP software’s computation.
5.3 General Conclusion on Jump Points of the Curves of Average Time Delay
Let K be the buffer size of shared links in social network system. Assume M be the number of users who compete in using shared links with each other. Additionally, the users’ behaviors are alike. Then we can deduce the general conclusion from the specific situation as follows.
The curve, which demonstrates the effect of q, K on average time delay, contains some jump points.
Such jump points arise when
Based on the analysis of social network system’s characteristics, this paper constructs two SPN models to evaluate three users’ behaviors of SNS under the situation of three users and four users respectively. Four case studies are conducted correspondingly to analyze different parameters’ effects on average time delay for three users and four users by comparison. Also, the problem of State Explosion is discussed which demonstrates the limitation of performance analysis of SPN model for more complex parameters with bigger values with SPNP 6.0 software. Therefore, the trend that average time delay varies with number of data packets, traffic load, buffer size of the shared links are illustrated. Finally, conclusion on some jump points, which reflects dramatic increase of each user’s average time delay, is derived thereby. Further works on analysis of social network system can be carried on.
Funding Statement: The research work was supported by the Excellent Young Teachers Training Project (the second level, Project Number: YXJS201508), Teaching reform projects of Communication University of China (Project Number: JG190033, Project Number: JG22062).
Conflicts of Interest: The authors declare that they have no conflicts of interest to report regarding the present study.
1. M. Daouah, A. Abou El Kalam and A. Ait Ouahman, “Social networks services: Survey,” in Proc. 2013 National Security Days (JNS3), Rabat, Morocco, pp. 1–4, 2013. [Google Scholar]
2. R. Irfan, G. Bickler, S. U. Khan, J. Kolodziej, H. X. Li et al., “Survey on social networking services,” Networks, IET, vol. 2, no. 4, pp. 224–234, 2013. [Google Scholar]
3. J. S. Kim, M. H. Yang, Y. J. Hwang, S. H. Jeon, K. Y. Kim et al., “Customer preference analysis based on SNS data,” in Proc. 2nd Int. Conf. on Cloud and Green Computing (CGC), Xiangtan, Hunan, China, pp. 609–613, 2013. [Google Scholar]
4. H. Y. Jeong, J. H. Park, Y. S. Jeong and D. S. Park, “Petri-net based user profile data ontology for SNS,” in Proc. 27th Int. Conf. on Advanced Information Networking and Applications Workshops (WAINA), Barcelona, Spain, pp. 744–748, 2013. [Google Scholar]
5. S. Y. Kim, “Modeling and analysis of a web-based collaborative enterprise using petri nets,” in Proc. IEEE Int. Conf. on Information Reuse and Integration, Las Vegas, NV, USA, pp. 422–428, 2008. [Google Scholar]
6. R. Kwangyeol and E. Yucesan, “A novel method of modeling collaborative processes in manufacturing,” in Proc. 9th Int. Conf. on Computer Supported Cooperative Work in Design, Coventry, UK, vol. 2, pp. 1082–1087, 2005. [Google Scholar]
7. C. A. Petri, “Kommunkation mit automaten”, Bonn: Institut fur lnstrum entelle mathematik, schriften des IIM Nr. 3(1962). Also English translation, “Communication with automata”. Technical Report RADC-TR-65-377, New York, Rome Air Dev. Center, 1966. [Google Scholar]
8. C. Xiong, T. Murata, and J. Tsai, “Modeling and simulation of routing protocol for mobile ad hoc networks using colored petri nets, research and practice in information technol,” Australian Computer Society, vol. 12, pp. 145–153, 2002. [Google Scholar]
9. J. Wise, J. Xia, C. K. Chang, and J. C. Huang, “Performance analysis based on requirements traceability,” Tech. Rep. 05-04, Dept. Computer Science, Iowa State Univ. 2005. [Google Scholar]
10. D. Radha and P. T. Nithia, “A case study on social network analysis: Thesaurus book,” in Proc. 2nd Int. Conf. on Computational Systems and Information Technology for Sustainable Solution (CSITSS), Bangalore, pp. 1–5, 2017. [Google Scholar]
11. A. Ade-Ibijola, “Synthesis of hypothetical sociograms for social network analysis,” in Proc. 5th Int. Conf. on Soft Computing & Machine Intelligence (ISCMI), Nairobi, Kenya, pp. 79–83, 2018. [Google Scholar]
12. C. Laghridat, I. Mounir and M. Essalih, “Analyzing friendship’s social networks using the topological indices,” in Proc. 2019 Int. Conf. on Wireless Networks and Mobile Communications (WINCOM), Fez, Morocco, pp. 1–5, 2019. [Google Scholar]
13. H. Yuliansyah, Z. A. Othman and A. A. Bakar, “Taxonomy of link prediction for social network analysis: A review,” IEEE Access, vol. 8, pp. 183470–183487, 2020. [Google Scholar]
14. C. Lin, Y. J. Li and Z. M. Wang, “Status and development of formal methods for performance evaluation,” Acta Electronica Sinica, vol. 30, no. 12A, pp. 1917–1922, 2002. [Google Scholar]
15. M. A. Marson, “Stochastic petri nets: An elementary introduction,” in Lecture Notes in Computer Science, 424, New York: Springer-Verlag, 1989. [Google Scholar]
16. C. Hirel, B. Tuffin, K. S. Trivedi, “SPNP: Stochastic petri nets. Version 6.0,” Lecture Notes in Computer Science, vol. 1786, pp. 354–357, 2000. [Google Scholar]
17. C. Lin, Stochastic Petri Nets and System Performance Evaluation. Beijing: Tsinghua University Press, 2005. [Google Scholar]
 | This work is licensed under a Creative Commons Attribution 4.0 International License, which permits unrestricted use, distribution, and reproduction in any medium, provided the original work is properly cited. |