| Journal of Renewable Materials |
DOI: 10.32604/jrm.2021.015756
ARTICLE
Long-Term Loading Test of Reinforced Glulam Beam
1College of Civil Engineering, Northeast Forestry University, Harbin, 150040, China
2School of Civil Engineering and Architecture, Wuyi University, Wuyishan, 354300, China
*Corresponding Author: Ling Li. Email: liling0048hit@163.com
Received: 11 January 2021; Accepted: 31 March 2021
Abstract: Due to creep characteristics of wood, long-term loading can cause a significant stress loss of steel bars in reinforced glulam beams and high long-term deflection of the beam midspan. In this study, 15 glulam beams were subjected to a 90-day long-term loading test, and the effects of long-term loading value, reinforcement ratio and prestress level on the stress of steel bars, midspan long-term deflection, and other parameters were compared and analyzed. The main conclusions drawn from this study were that the long-term deflection of the reinforced glulam beams accounted for 22.5%, 20.6%, and 18.2% of the total deflection respectively when the loading value was 20%, 30%, and 40% of the estimated ultimate load under the long-term loading. The higher the loading level was, the smaller the proportion of the long-term deflection in the total deflection was. Compared with ordinary glulam beams, the long-term deflection of the reinforced glulam beam was even smaller. Under the condition of the constant loading level, the total stress value of the steel bars decreased by 17.5%, 13.6%, and 9.1%, and the proportion of the long-term deflection of the beam midspan in the total deflection was 26.9%, 24.2%, and 20.6% respectively when the reinforcement ratio was 2.05%, 2.68 %, and 3.39%. With the increase of the reinforcement ratio, the stress loss of the steel bars decreased, and the proportion of the long-term deflection decreased as well. When other conditions remained constant and the prestress level of the steel bars was 0 MPa, 30 MPa, and 60 MPa, the total stress value of the steel bars decreased by 9.1%, 9.4%, and 10.2%, respectively, and the proportion of the long-term deflection in the total deflection was 20.6%, 26.1%, and 64.9%, respectively. With the increase of the prestress value, the stress loss of the steel bars increased, and the proportion of the long-term deflection increased as well.
Keywords: Reinforced glulam beams; long-term loading tests; creep characteristics; prestress; total stress of steel bars
Wooden houses have always been a popular architectural form with the characteristics of safety and habitability. In the context that green buildings are being vigorously promoted around the globe, wooden structures have ushered in new development opportunities due to their merits of low carbon footprint, environmentally-friendly, and sustainable development [1–5]. Glulam is an important material for wooden structures, which has several advantages such as scattered defects, high strength, and variable shapes of cross-sections and components, etc. However, glulam beams are prone to brittle tensile failure under bending with the majority of compressive strength of wood not fully utilized. Moreover, due to the lower elastic modulus and the creep characteristics of the wood [6–8], the deformation of the glulam beam is relatively large. Therefore, the design of the glulam beams is often controlled by deformation so that the strength of the wood is not fully utilized. To take advantage of this reserve wood strength, a steel-wood composite component structure “the reinforced glulam beam” [9–13] is proposed, which could bear tensile force with its prestressed steel bars and bear the compressive force with the glulam. This kind of beam can make full use of the compressive strength of glulam, meanwhile, applying prestress can reduce the deformation of the beam, making it an efficient composite component. Under the long-term load, wood will undergo viscoelastic creep, which requires a constant load that changes with time. When the load applied on the reinforced glulam beam changes with time, both the strength and stiffness of the beam will degrade. After the prestress is applied, the degradation will become even more significant. Therefore, it is of significant theoretical and engineering importance to understand the long-term mechanical performance of the reinforced glulam beams and clarify the impact of creep.
In recent years, various researchers mainly focused on aspects such as the creep characteristics of wood [14], the creep of components and structures, mechanical properties of glulam beams [15,16], and relaxation of prestressed steel bars [17–20], etc. Since the reinforced glulam beam is a novel component structure proposed by the authors, no study on its long-term mechanical performance has been reported yet. However, the research results of previous scholars have provided very important reference significance for the research work of this paper, which has also proved the research value and the feasibility of this study.
In this study, a 90-day long-term loading test was conducted on 15 beams that were divided into 4 groups to explore the impact of loading level, reinforcement ratio, and prestress on the long-term bending performance of the reinforced glulam beams from two perspectives of the total stress variation of the steel bars and the maximum deflection of the beam midspan. Based on the test results, several points that should be paid attention to when designing the reinforced glulam beam are proposed, which also provides the insights for future research.
2.1 Test-Piece Design and Grouping
According to the relevant standards [21,22] and the purpose of experiment, 15 beams of glulam with a geometric scale ratio of 1:2 were designed and fabricated, the span-height ratio was 20, and the size of the beams was 3100 mm × 150 mm × 100 mm. The specimens included 3 unreinforced glulam beams, 8 reinforced glulam beams, and 4 prestressed glulam beams. Reinforcements were placed in groove of the glulam beams, and then passed through the anchor plates set at the end of the beam and anchored at the end with two nuts to form the reinforced glulam beam. In order to place the reinforcements at the bottom of the beam, the reinforced glulam beam was designed with two grooves of 22 mm in width and 30 mm in height at the bottom of the beam, and the center distance between the two grooves was 48 mm. A diagram of the fabricated reinforced glulam beam piece was shown in Fig. 1. The wood in the glulam beams was Pinus sylvestris, and the steel bar grade was HRB400 (360 MPa nominal tensile strength).
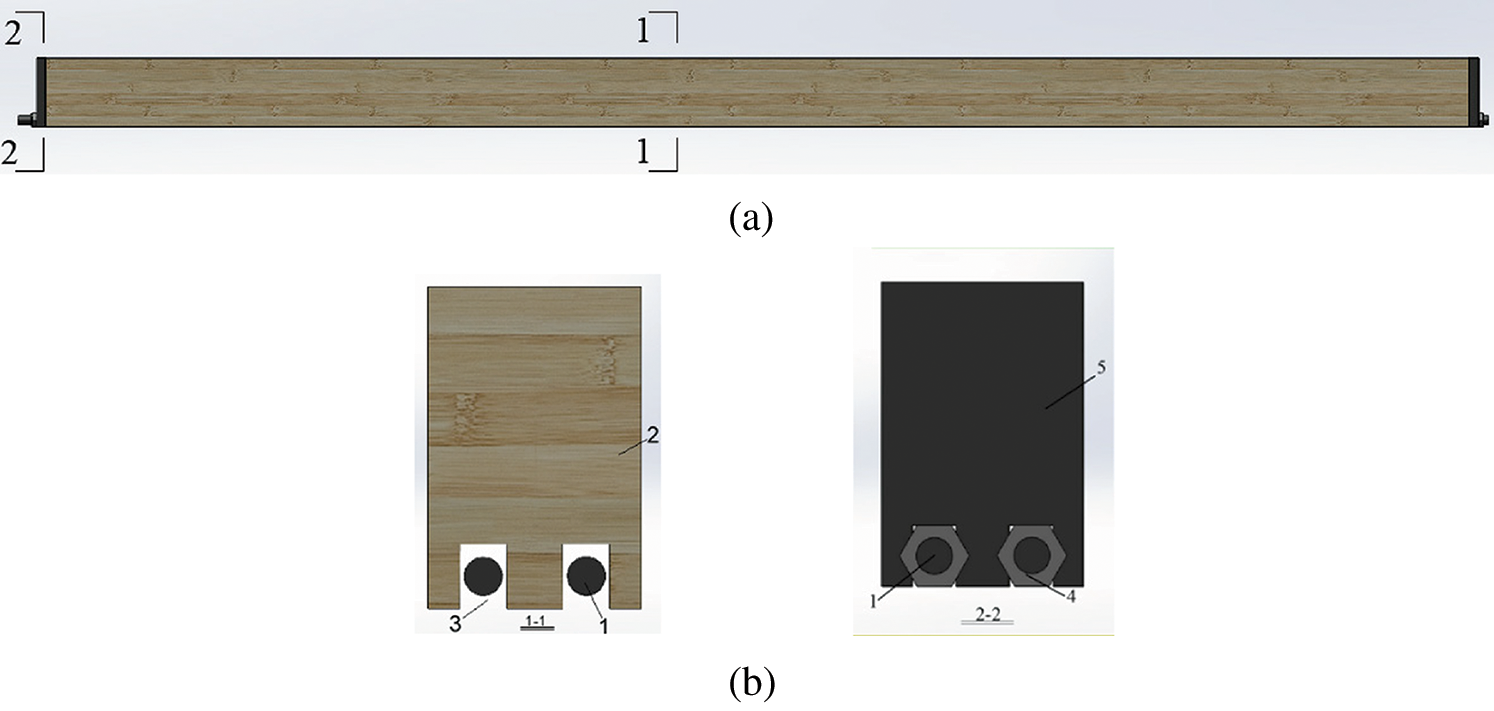
Figure 1: Diagrams of the beam. (a) Elevation view. (b) Sectional view 1—steel; 2—glulam; 3—groove; 4—nut; 5—anchor bearing plate
According to beam type, loading level, reinforcement ratio, and total prestress level, the specimens were divided into A, B, C, and D groups respectively. Loading level was the percentage of long-term loading value to estimated ultimate load obtained by the finished short-term loading experiment [6]. According to the relationship between the bearing capacity R and the loading effect S (R ≥ γ0S, γ0 was the Partial factor calculated by the reliability design method), it was determined that the service load was 30% of the ultimate bearing capacity. Group A was the unreinforced glulam beam (LA) group with different loading level, which was considered as a reference group; Group B studied the impact of the long-term loading value on the mechanical performance of the reinforced glulam beam (PLB); Group C studied the influence of the reinforcement ratio on the long-term mechanical performance, and the Group D studied the impact of the prestress level, more details were shown in Tab. 1.

2.2 Loading Device and Measuring Point Layout
Due to the large size and the large number of beams for the long-term experiment, a set of long-term loading devices was designed by the research team for the experiment, as shown in Fig. 2. The device consisted of eight steel columns, four short steel beams, and two long steel beams. A steel plate was designed on the upper part of the steel column, as shown in Fig. 2b, and the side of the steel column was shown in Fig. 2c. A short steel beam had eight bolt holes so that the two steel columns could be connected to it to form a foundation support, as shown in Fig. 2d. However, a long steel beam needed to be built on two foundation supports to form a loading support, as shown in Figs. 2e, 2f. The plane layout of the loading device and the beams were shown in Fig. 2a. The device could be used to carry out the long-term bending test on 5 beams at a time with high efficiency. The bearing capacity and rigidity of the device were relatively large, it was for this reason that the device would have little influence on the test results. In addition, the device had preferable compatibility for the reason that the spacing between the two loading supports could be adjusted according to the length of the beams.
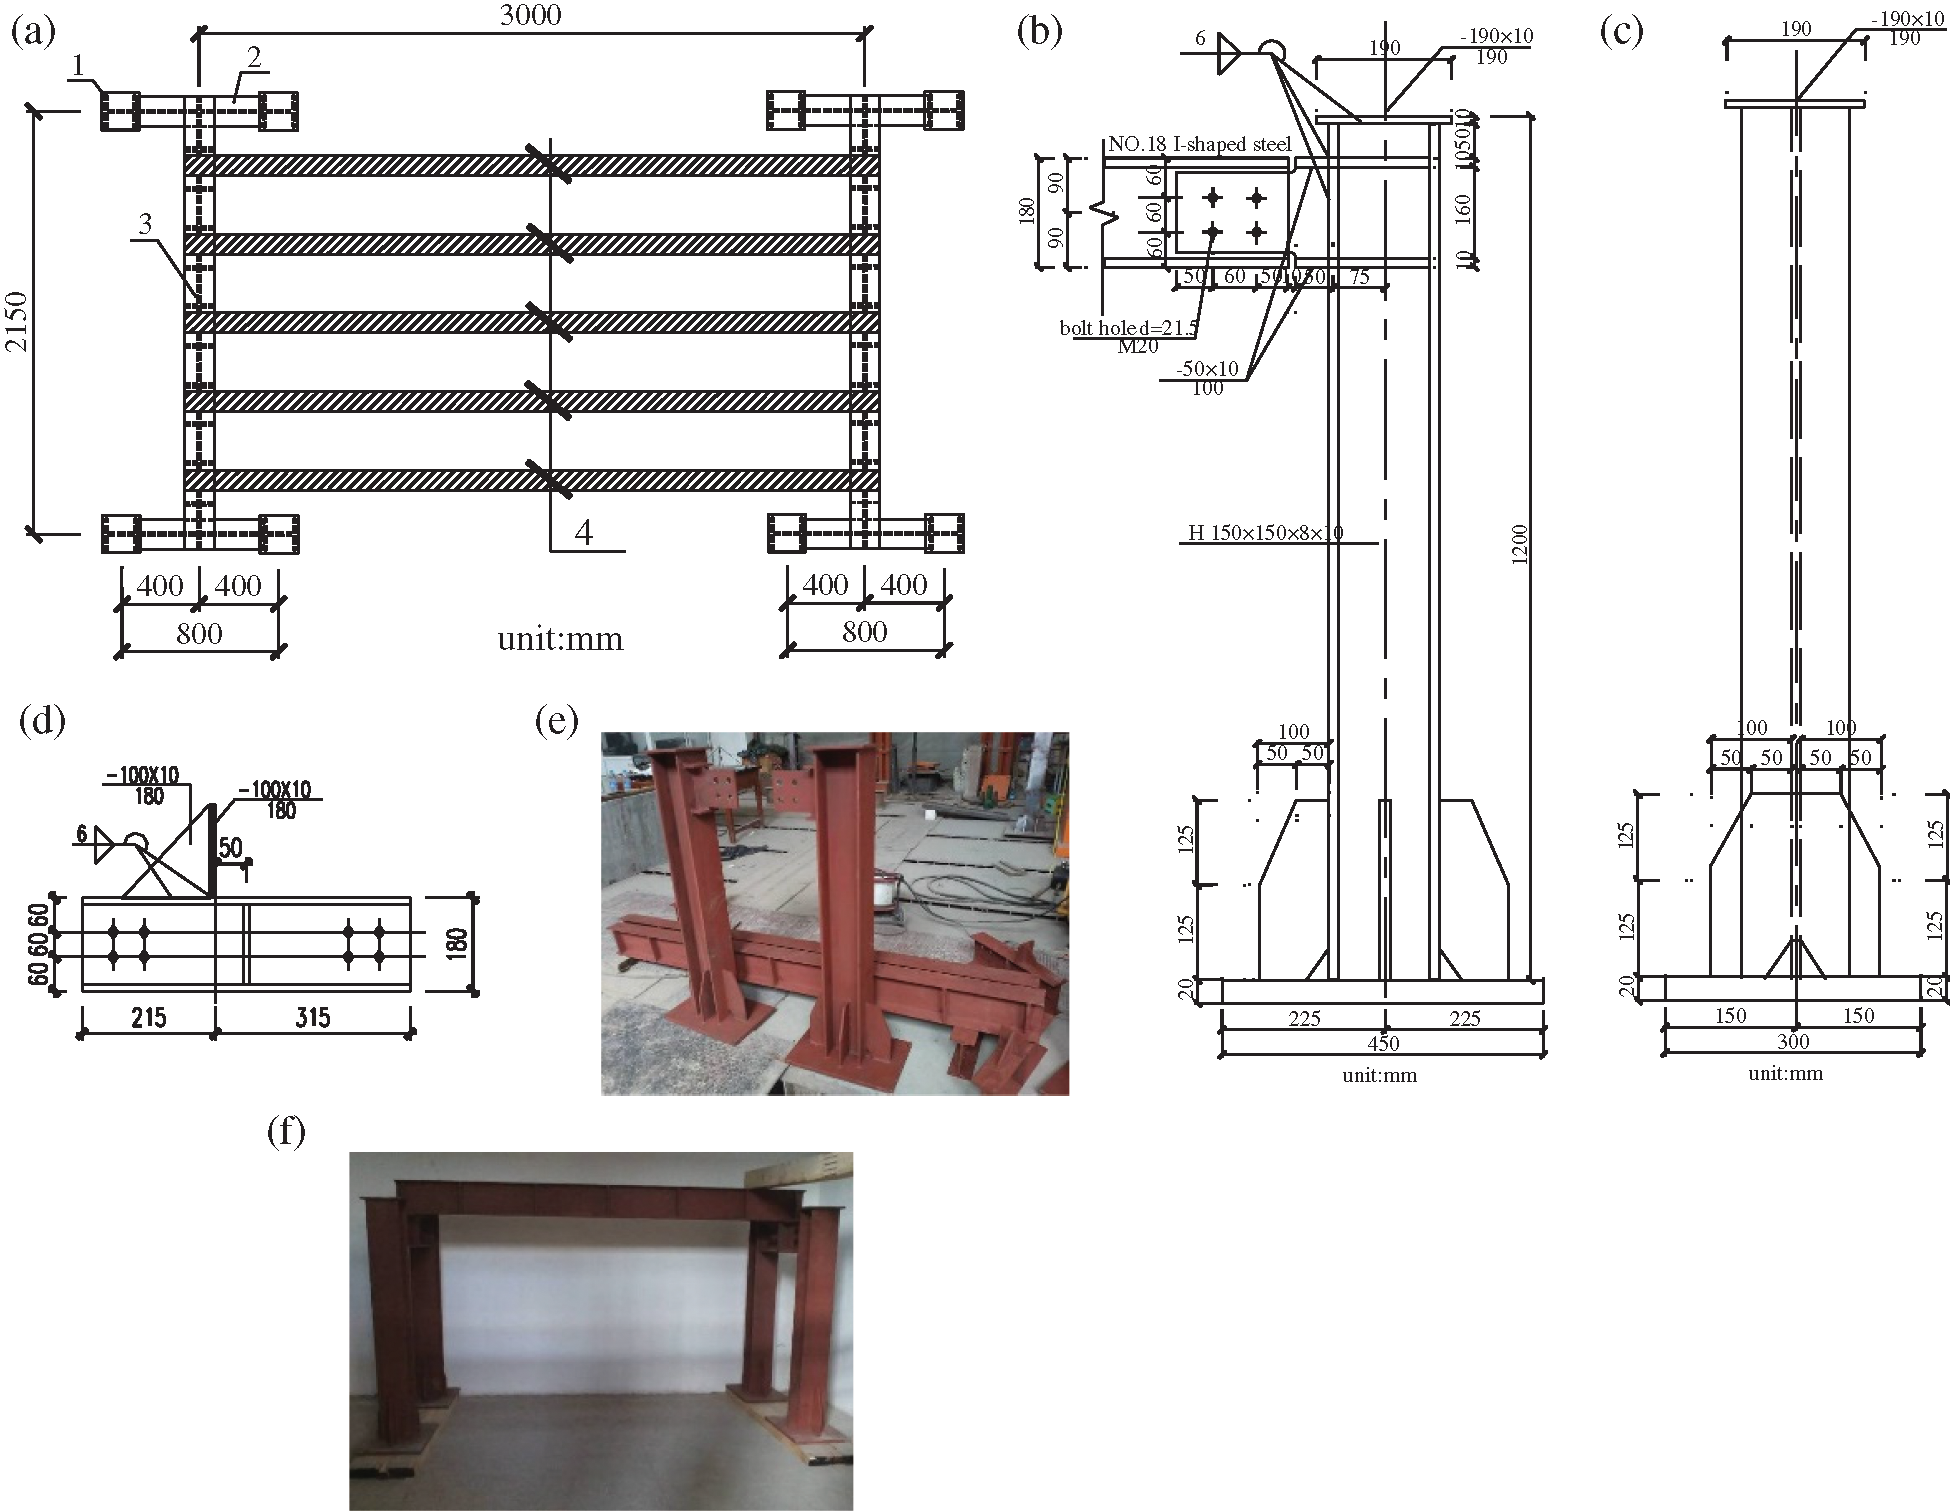
Figure 2: Long-term loading test device. (a) The plane layout of the device 1—steel column; 2—short steel beam; 3—long steel beam; 4—glulam beams. (b) Front elevation of the steel column. (c) Side elevation of the steel column. (d) Detail of the short steel beam. (e) Material object of the steel beam and the steel column. (f) Loading support
A two-point symmetrical loading method was adopted in the test. According to the relevant standards [21,22] and the tests performed by previous researchers [23,24], the loading time was set to 90 days. In order to ensure the constant loading value during the loading period, the dead load was applied by heavy weights. To prevent the local compression failure at loading points, steel plates were placed on the upper surface of the beam at the three equal points and a wooden block was placed on each steel plate, as shown in Fig. 3.
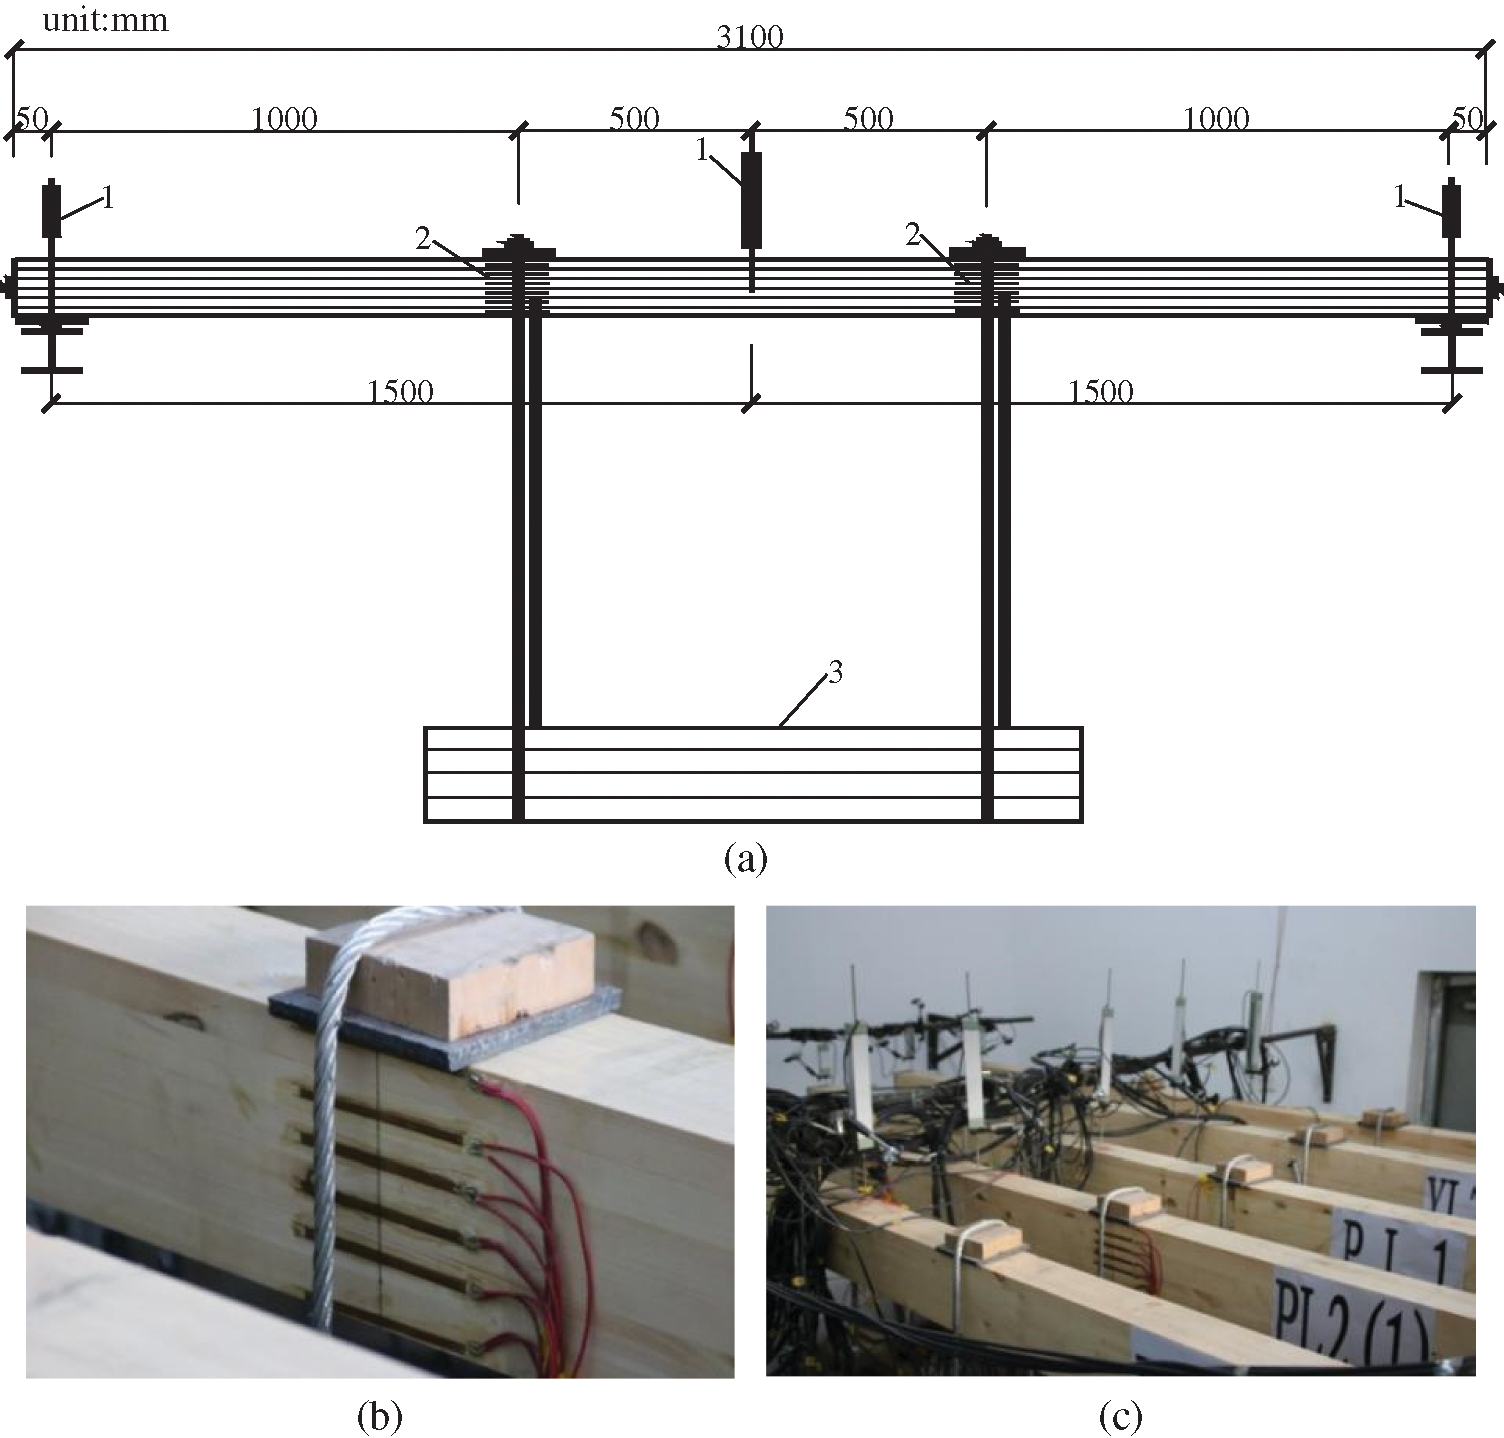
Figure 3: Test plan and measuring point layout of the long-term loading test. (a) Side elevation. 1—displacement sensor; 2—strain gauge; 3—weight (b) suspension point. (c) displacement meter
The measurement in this test included the displacement value of the midspan and the support brackets of the beam, strain of the glulam beams, and strain of the steel bars. To collect the displacement value at the midspan and both ends of the beam, three displacement meters were arranged on these three positions. To collect the strain value of the wood, six strain gauges were uniformly pasted along the side surface at the three equal points on both sides of the glulam part of the test beam. It was worth noting that the defect would be inside the glulam beam. For defective parts, such as microcracks, the strain measured by the strain gauges would be too large under the same deformation. The length of the strain gauges was 100 mm so that the measured strain could be within a certain range, which could largely eliminate the influence of the internal defects on strain measurement results. Moreover, two strain gauges were attached to the top and bottom surfaces of the beam midspan, respectively. As for the reinforced glulam beam, one strain gauge was attached to the middle position of two steel bars at the groove of the beam bottom, as shown in Fig. 4. The strain data were collected by the Model JM3813 multifunctional static strain test system. After the program was run and configured in the computer, dead load was applied to the beams. During the test, the load and the displacement were monitored in real-time, the failure mode was observed and recorded by taking photos.
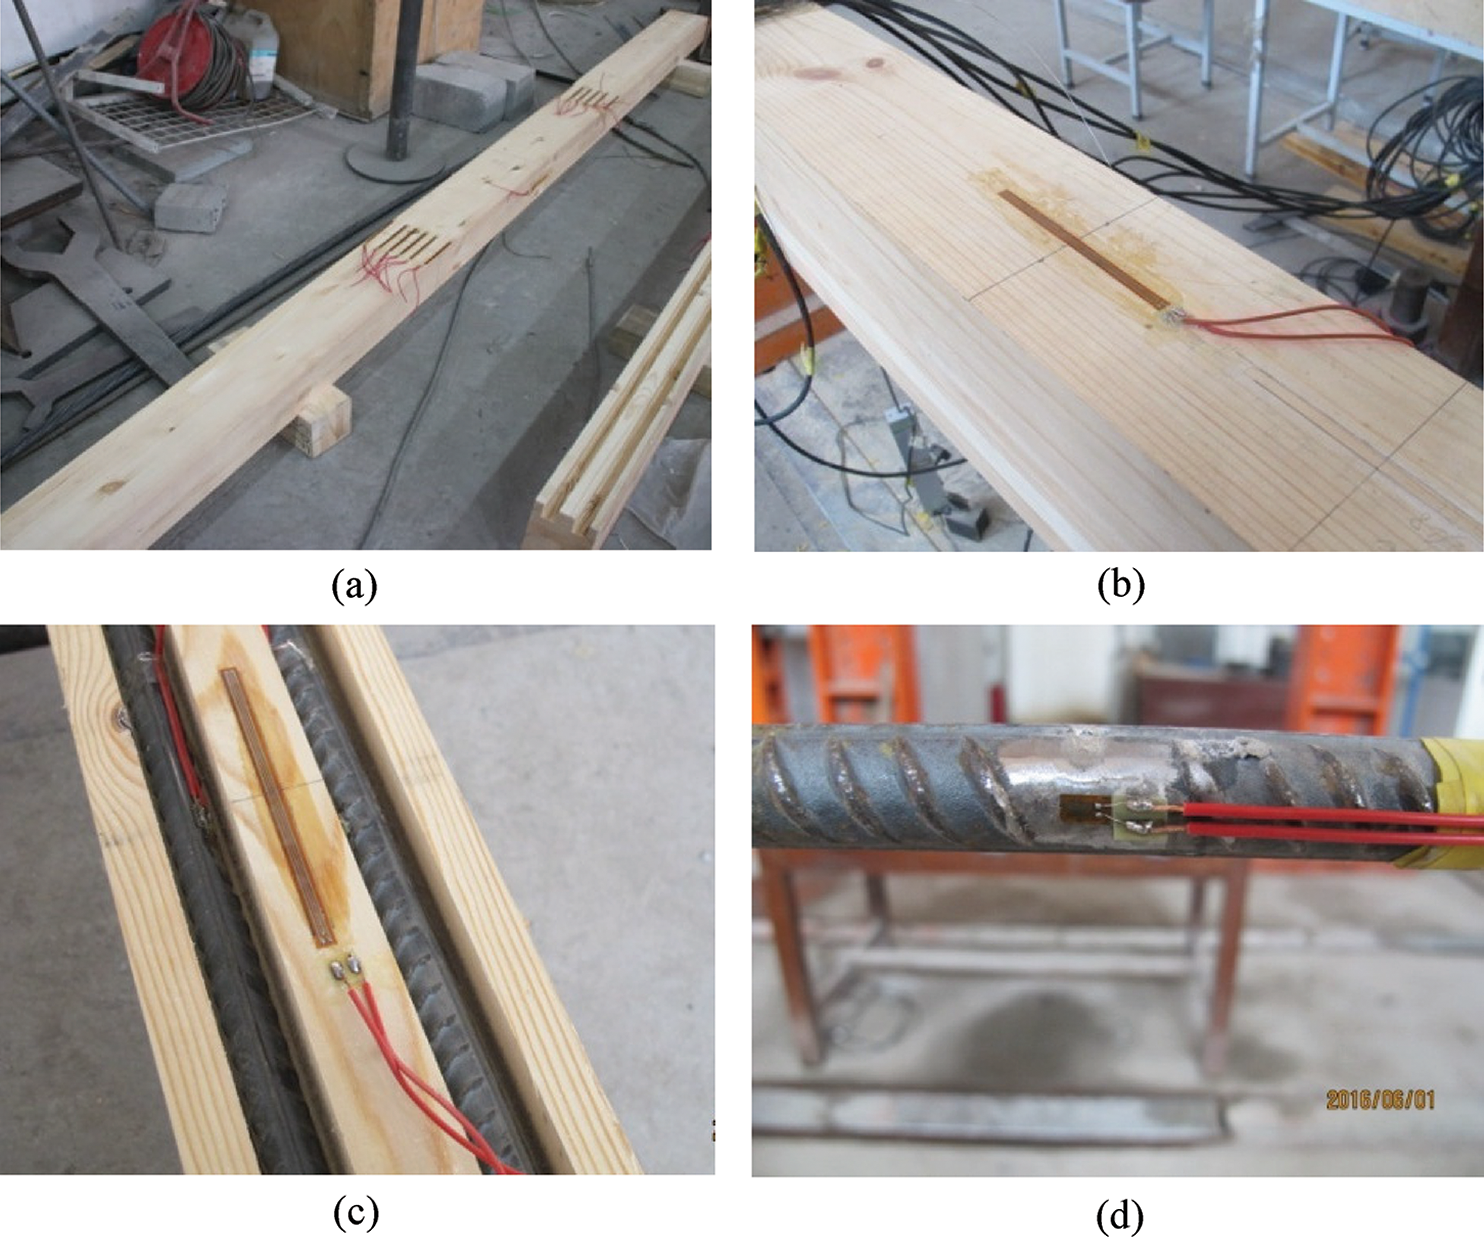
Figure 4: Arrangement of strain gauges. (a) Strain gauges at the three equal points. (b) Strain gauge at the beam top. (c) Strain gauge at the beam bottom. (d) Strain gauge pasted on the steel bar
The prestress was applied by tightening the end nuts (pointed by the arrow) and transferred to the glulam beam through the anchor plates, and then the prestressed glulam beam was formed with compression at the bottom and tension at the top, as shown in Fig. 5a. In the process of tightening the end nuts, the spanner would give the glulam beam a lateral force, which would make the glulam beam incline to one side and hinder the application of prestress. Therefore, a set of the auxiliary prestressing device (pointed by the arrow) was designed to ensure the lateral stability of the prestressed glulam beams in the process of prestressing, as shown in Fig. 5b.
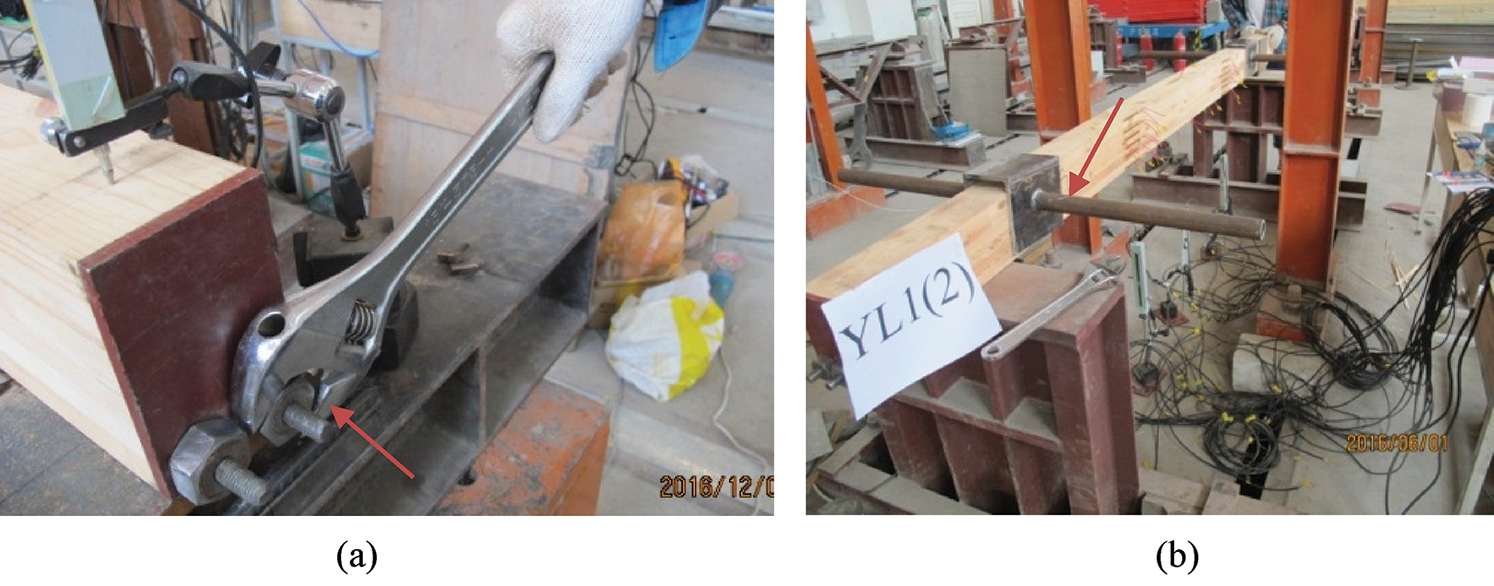
Figure 5: Application of the prestress. (a) Screw nut. (b) Auxiliary device
3.1.1 Change of Temperature and Relative Humidity
According to the previous research results [25], the external environment (temperature and relative humidity) was an important factor on affecting the creep of wood. With the increase of the temperature and relative humidity, the creep deformation of wood would increase. In the long-term test of the beams, the temperature and humidity of each batch of the test beams should be relatively constant. The test should be carried out in the normal indoor environment (temperature: 20°C; relative humidity: 70%), which was also to simulate the stress state of the beams under the circumstance of normal use. During this period, measures such as sprinkling water in summer and heating in winter were taken, and the temperature and humidity of each batch of the beams were regularly monitored so that the relative stability of the indoor environment could be ensured. By observing the obtained data, it was found that the temperature and humidity had little change in general, so the influence of the change of the temperature and humidity on the analysis of the test results could be ignored.
3.1.2 Long-Term Change Phenomenon of Test Beams
For subsequent analysis, the glulam beams were observed and photographed every 30 days, and the phenomenon in the whole creep process were recorded from the beginning to the end of the experiment. A state diagram of the glulam beams at different times in the long-term experiment was shown in Fig. 6.
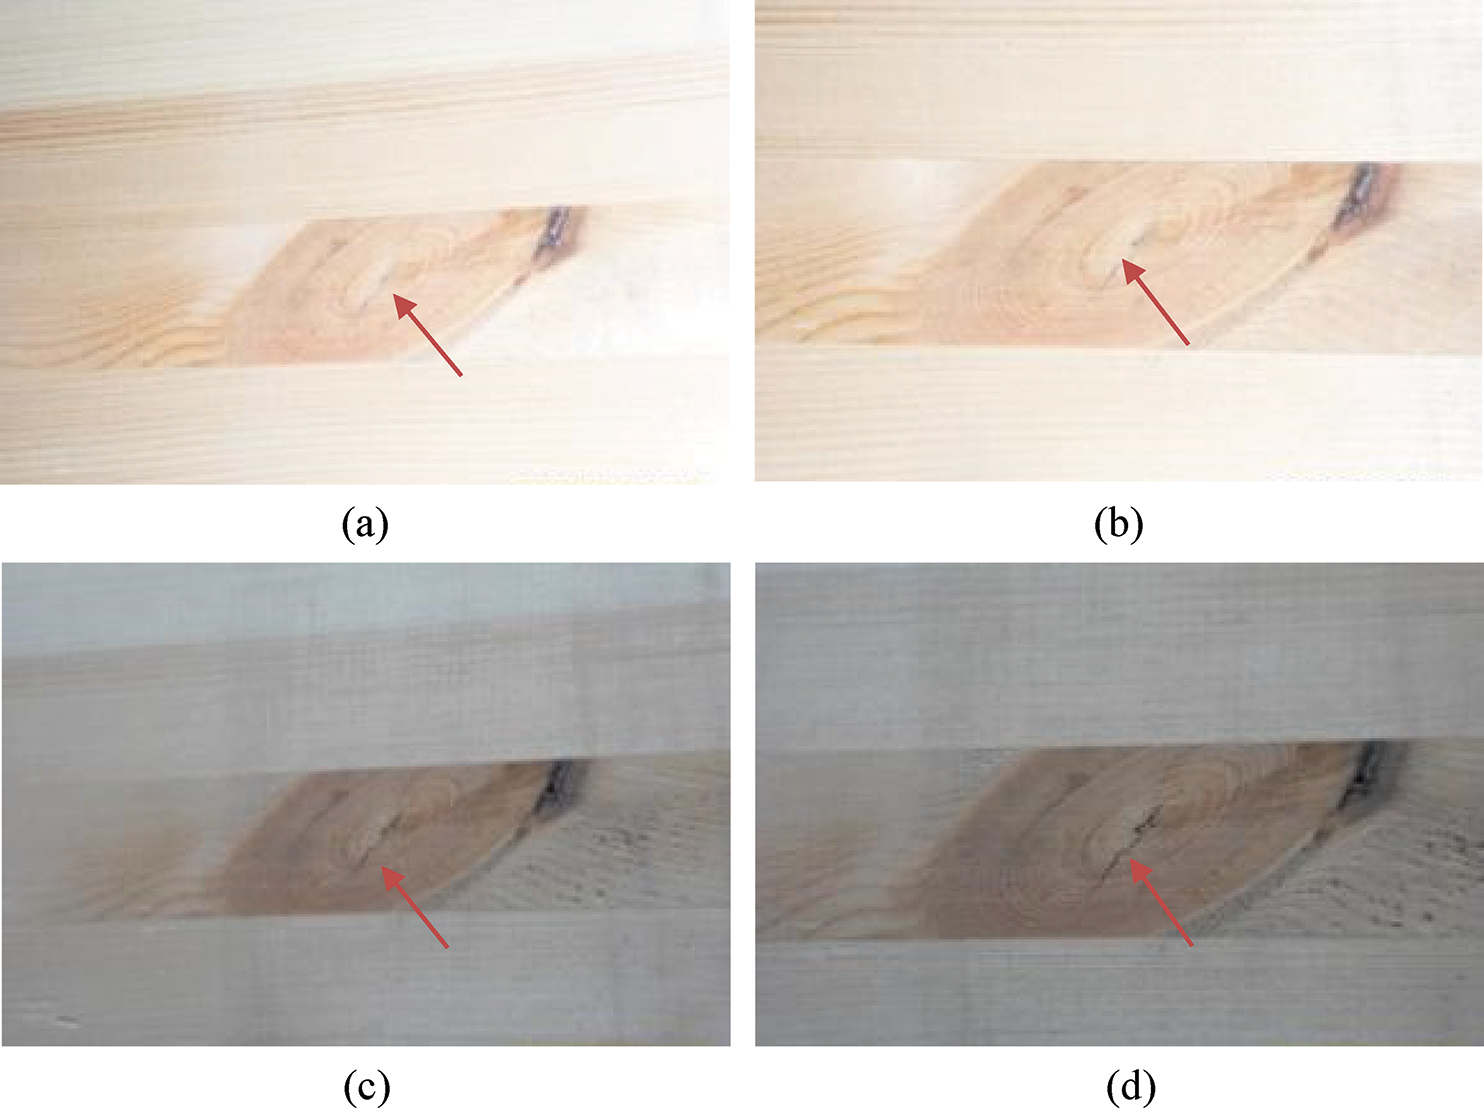
Figure 6: Status of the test beams. (a) On the 1st day of the test. (b) On the 30th day of the test. (c) On the 60th day of the test. (d) On the 90th day of the test
As could be seen from Fig. 6, compared with the first day of the experiment, the beams showed cracks (pointed by arrows) slightly extending at the position of the wood knot of the beams on the 30th day of the experiment, and the cracks of the 60th and 90th day did not extend obviously. Since the purpose of the long-term test was to provide a basis for the limit state design of serviceability, and the applied long-term load was service load that was quite different from the failure load of beam. Therefore, obvious cracks, wrinkle and other damage phenomena were not observed except obvious changes of deflection in the process of loading.
3.2 Stress Variation of Steel Bars
In the long-term loading test, the stress level of the steel bars was an important indicator for the mechanical performance of the reinforced glulam beam. In this test, the stress variation of the steel bars was caused by two factors, one was the relaxation of the steel bars, and the other was the creep characteristic of the glulam. Previous studies showed that the relaxation of the steel bars was not significant anymore when the initial stress of the prestressed steel bars was less than 0.5 times value of the ultimate tensile strength Ry [26–33]. Since the maximum prestress applied in this study was 60 MPa < 0.5fu = 270 MPa, the stress variation caused by the relaxation of the steel bars was ignored, and it was considered that the stress variation of the steel bars was mainly caused by the creep of the glulam.
For the beams in group B, C, and D, the variation of the total stress of the steel bars (namely the stress sum of all the steel bars in a beam, as for the reinforced glulam beams in group C and D, the total stress means the average value of the total stress of two identical beams) with time in the whole process from the initial loading to the end of loading was shown in Fig. 7.
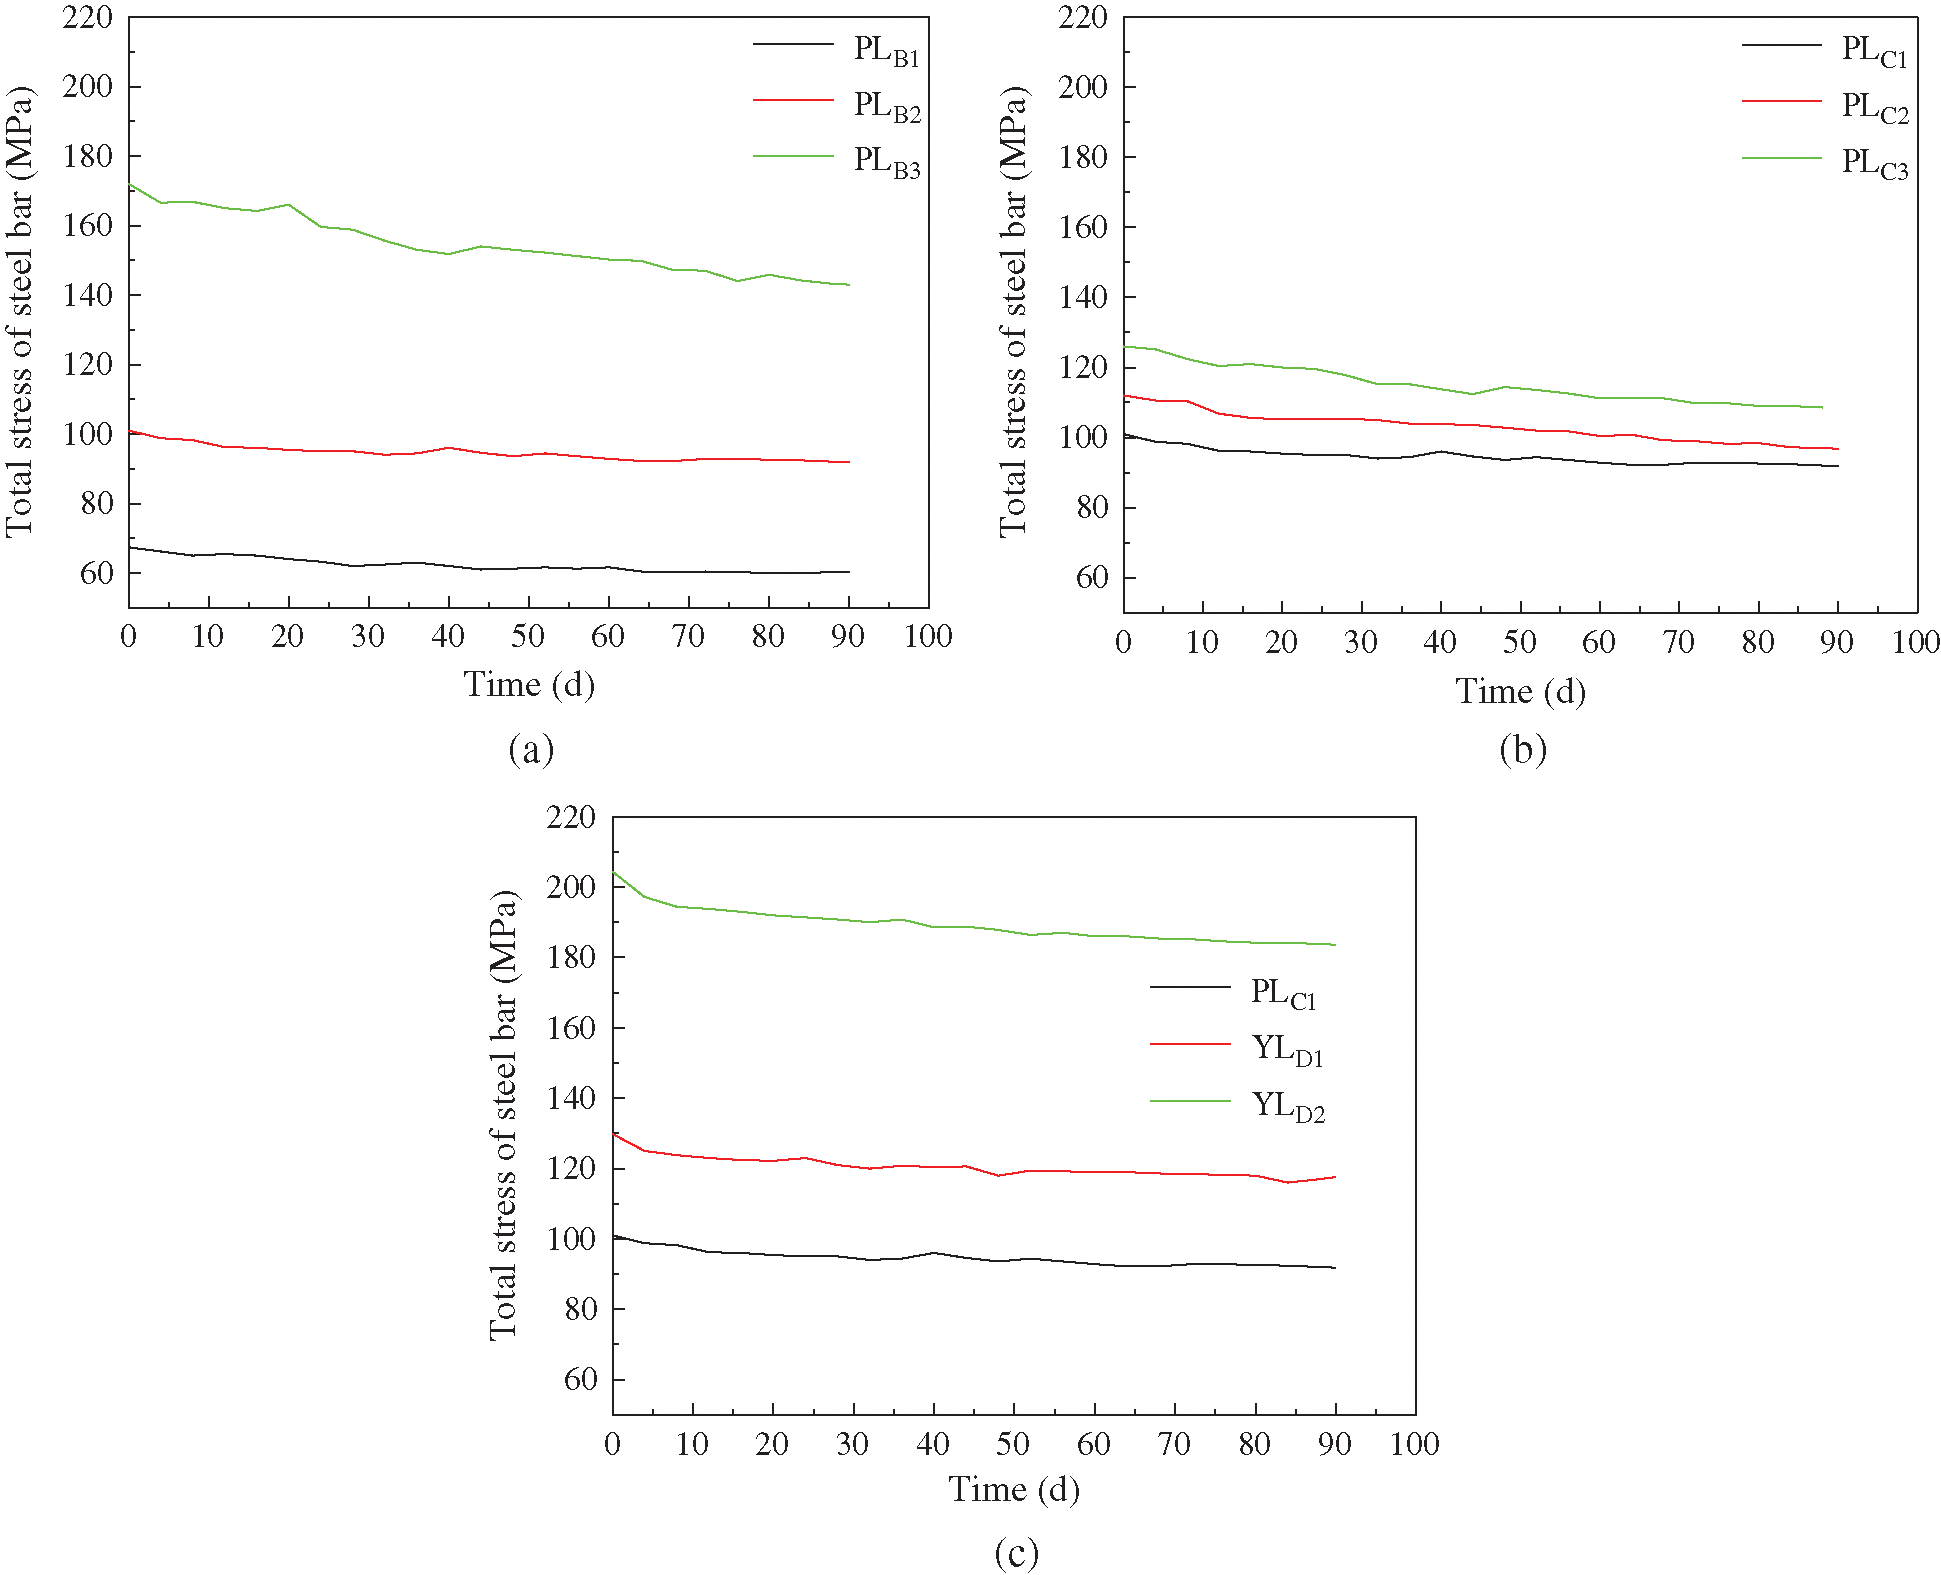
Figure 7: Time-varying curve of total stress of the steel bars (a) Test group B (different loading level). (b) Test group C (different reinforcement ratio). (c) Test group D (different prestress value)
It was known from Fig. 7 that the total stress value of the PLB1, PLB2, and the PLB3 decreased by 10.7%, 9.1%, and 16.9% respectively from the beginning to the end of the test. Under the condition of the constant reinforcement ratio, the total stress value of the steel bars gradually decreased and stabilized, and the decrease range had little difference when the loading level was less than 30% (equivalent to the service load). With the increase of the loading level, the decrease of the stress of the steel bars accelerated, but did not stabilize within 90 days when the loading level was more than 30%. This was because in the case of the same reinforcement ratio, the greater the external load applied, the greater the bending moment generated in the beam, and the greater the compressive stress presence in the top of the glulam was. For the reinforced glulam beam, the glulam part was mainly subject to compressive force, and the compressive stress value of the high-stress area at the beam top was the key factor affecting the magnitude of the creep of the entire beam, which would lead to the greater creep of the glulam and therefore significantly decrease the stress of the steel bars. For the PLC1, PLC2, and the PLC3, this value decreased by 9.1%, 13.6%, and 17.5%, respectively. Fig. 7 illustrated that the decrease of the steel bar stress was higher with the decrease of the reinforcement ratio under the condition of the same loading level. This was because the smaller the reinforcement ratio of the beam was, the greater the initial stress value of the steel bars was, and the stress value of the steel bars would decrease more when the loading level was constant. The total stress of the PLC1, YLD1, and the YLD2 decreased by 9.1%, 9.4%, and 10.2%, respectively. As could be seen from Fig. 7 that the stress loss of the steel bars increased as well with the increase of the prestress level in the case of the same loading level and reinforcement ratio. This was because the greater the prestress value was, the greater the compressive stress presence in the beam top was, and the greater the creep developed.
To clarify the change rate of the steel bars stress value, the initial stress of the steel bar was set to 0, The variation of steel bar stress value during the experiment was called relative stress value and the time-varying curve of the relative stress of the steel bar was shown in Fig. 8.
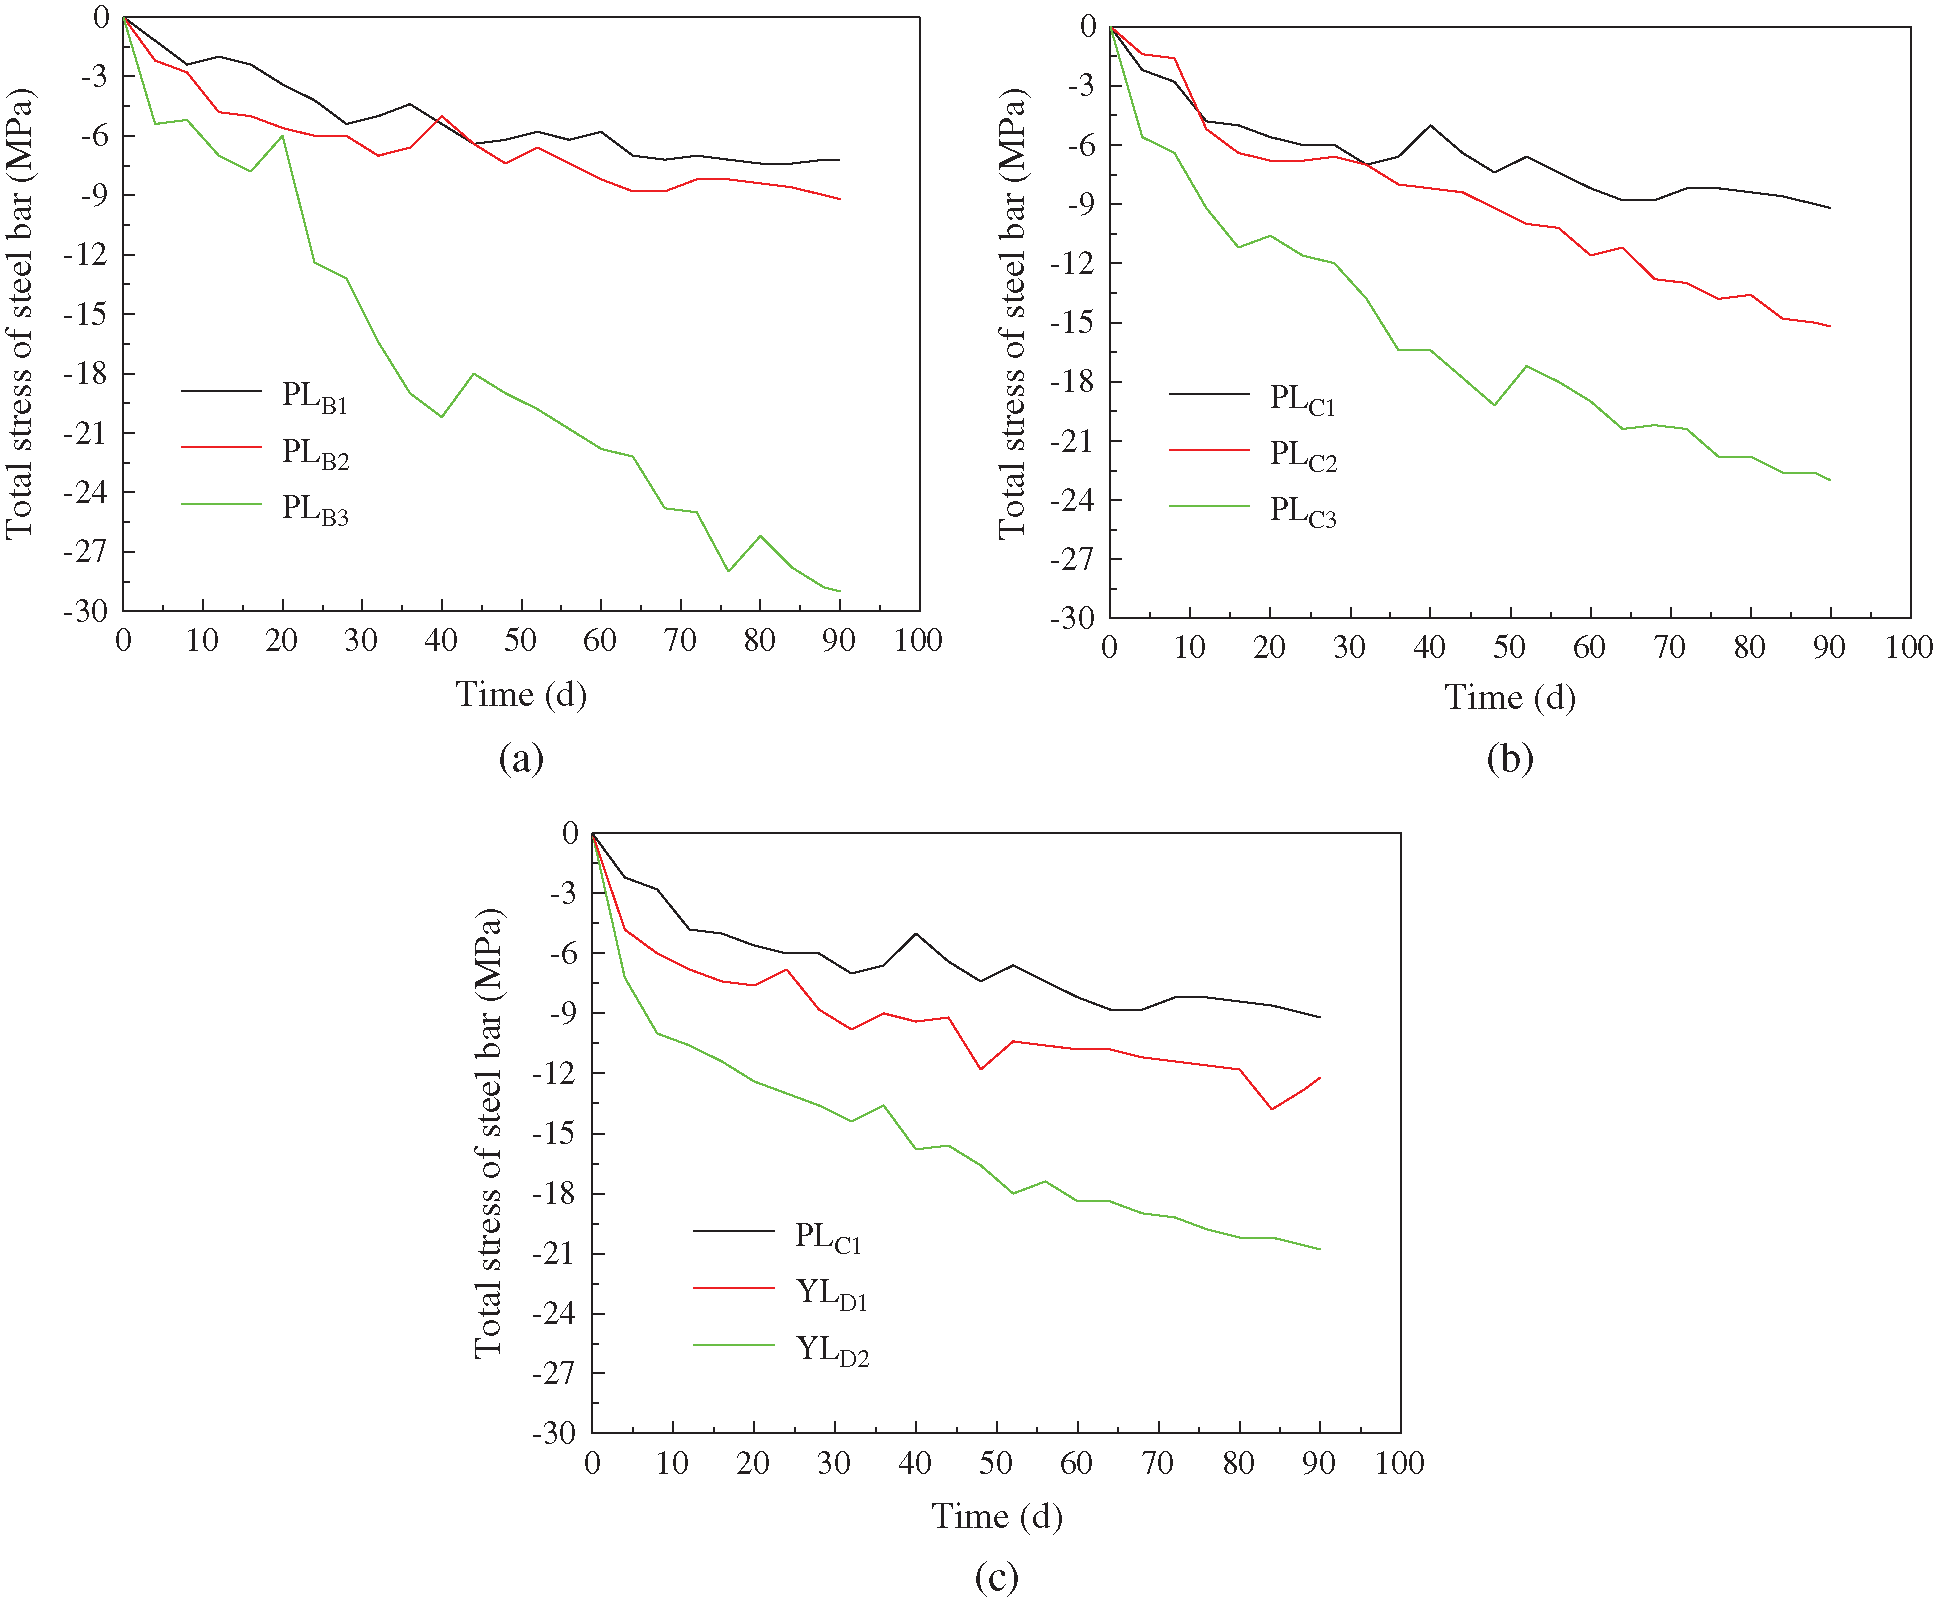
Figure 8: Time-varying curve of the relative stress of the steel bars. (a) Test group B (different loading levels). (b) Test group C (different reinforcement ratios). (c) Test group D (different prestress values)
Fig. 8 illustrated that the steel bar stress decreased faster with the increase of the loading level. With the passage of time, the decrement of the steel bar stress showed a trend of continuous acceleration when the reinforcement ratio remained constant, which indicated that the higher the loading level was, the faster the creep developed. With the decrease of the reinforcement ratio, the steel bar stress decreased faster, and with the passage of time, the decrement of the steel bar stress also showed a trend of continuous acceleration when the loading level was the same, which indicated that the creep development speed of the glulam was faster when the reinforcement ratio was relatively small. With the increase of the prestress level, the steel bar stress decreased faster when other conditions remained constant, which indicated that the greater the prestress was, the faster the creep of glulam developed. Compared with the un-prestressed glulam beams, the creep development of the prestressed glulam beams was faster.
3.3 Deflection of Beam Midspan
In the long-term loading test, observing and recording the development of midspan deflection had great significance in studying the creep performance of the glulam beam. For each batch of the beams, the data were sorted to obtain the long-term deflection development rule of the glulam beams, and the time-midspan deflection relationship curve was drawn as shown in Fig. 9.
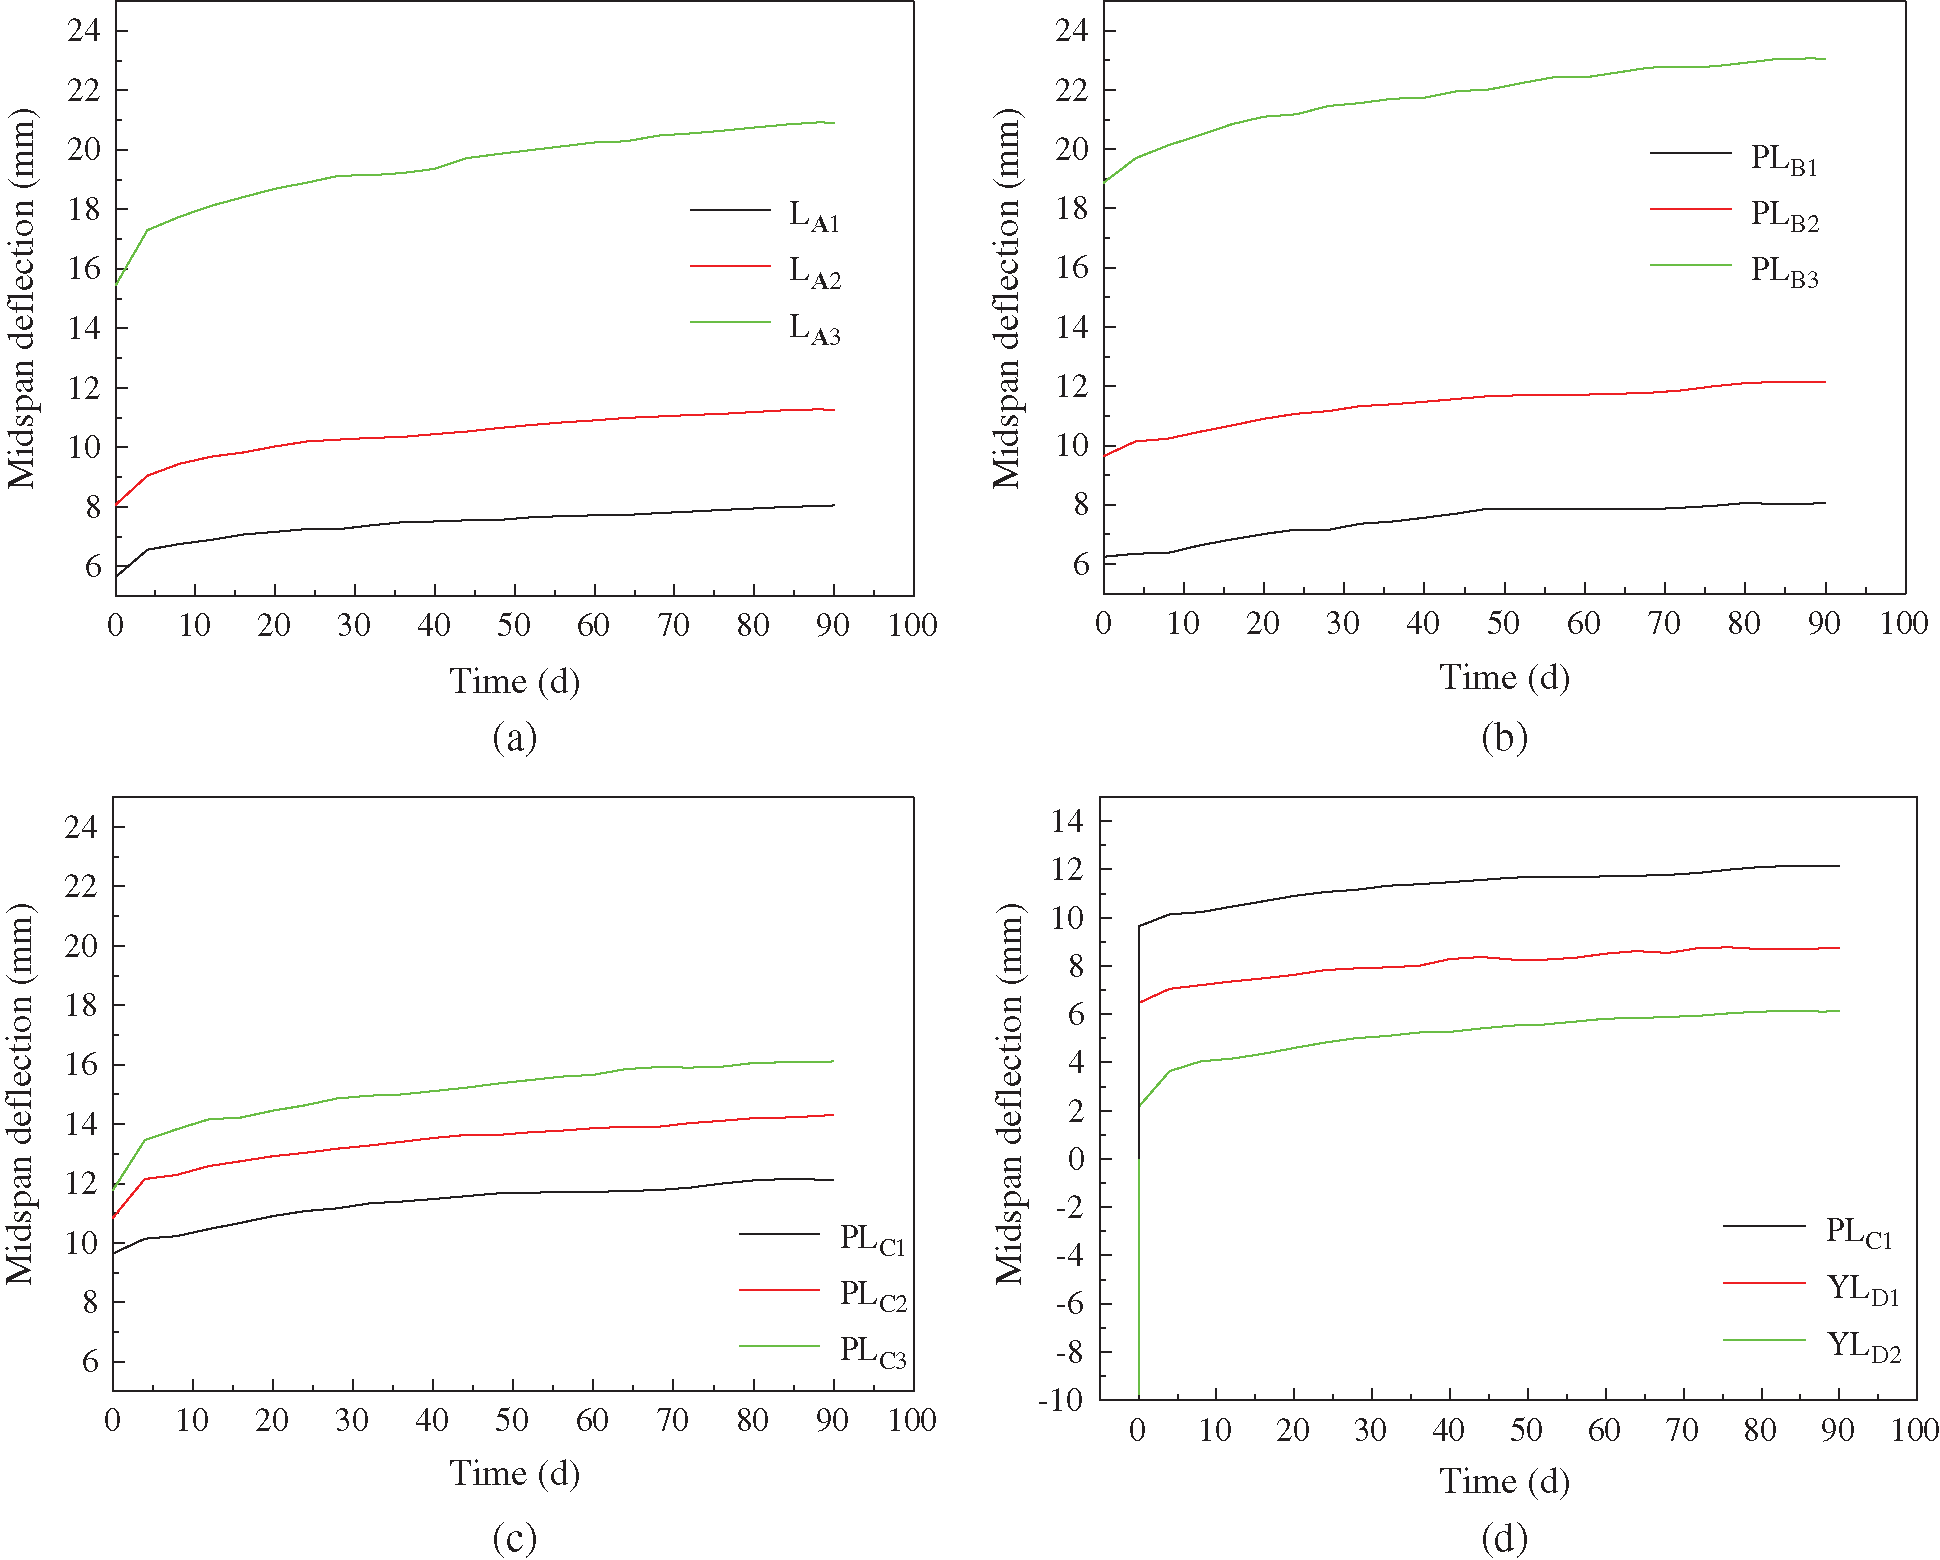
Figure 9: Time-varying curve of midspan deflection. (a) Group A (Control group). (b) Group B (different loading levels). (c) Group C (different reinforcement ratios). (d) Group D (different prestress values)
To facilitate comparison, the downward deflection was specified as positive, and the upward deflection was specified as negative. For prestressed beams, anti-arch would appear, so the inverted arch value of midspan was negative. The midspan deflection which generated instantaneously after the applying of the external load was identified as short-term deflection. After the 90-day long-term loading, the extra beam deflection caused by the creep of glulam was long-term deflection, and the sum of the short-term deflection and the long-term deflection was the total deflection. The inverted arch value, the short-term deflection, the long-term deflection, and the total deflection of the beams of A, B, C, and D test groups were shown in Tab. 2.

As could be seen from Fig. 9 that for beams without reinforced steel bars, the midspan deflection was 2.41 mm, 3.19 mm, and 5.47 mm, respectively, and accounted for 29.9%, 28.3%, and 26.2% of the total deflection; in the case of the same reinforcement ratio, the long-term deflection of the beam midspan was 1.81 mm, 2.50 mm, and 4.19 mm, respectively, and accounted for 22.5 %, 20.6%, and 18.2% of the total deflection when the loading level was 20%, 30%, and 40%. In the case of the 30% loading level, the long-term deflection of the beam midspan was 2.50 mm, 3.47 mm, and 4.34 mm, respectively, and accounted for 26.9%, 24.2%, and 20.6% of the total deflection when the reinforcement ratio of the steel bars was 2.05%, 2.68%, and 3.39%. In the case of the same loading level and the same reinforcement ratio, the long-term deflection of the beam midspan was 2.50 mm, 2.28 mm, and 3.97 mm, respectively, and accounted for 20.6%, 26.1%, and 64.9% of the total deflection when the prestress value was 0 MPa, 30 MPa, and 60 MPa. Compared with the un-prestressed beams, when the prestress value was 30 and 60 MPa, the proportion of midspan long-term deflection in total deflection increased by 5.5% and 44.3%, respectively. Based on the above analysis, the proportion of the long-term deflection in total deflection would decrease with the increase of the loading level, steel bar diameter, and the decrease of prestressing. This was because although the above-mentioned reasons had made the glulam bear more stress and made the beam creep deformation be greater, with the increase of the reinforcement ratio, the prestress value, and the loading level, the initial deflection of the beam increased as well. However, although both values had increased, the increase of the initial deflection had a greater impact on the long-term deflection of the beam midspan, and the proportion of the long-term deflection in total deflection decreased.
In order to analyze the long-term creep rate of the beam more intuitively, the short-term deflection was ignored, and then the time-varying curve of the long-term deflection in the glulam beam was shown in Fig. 10.
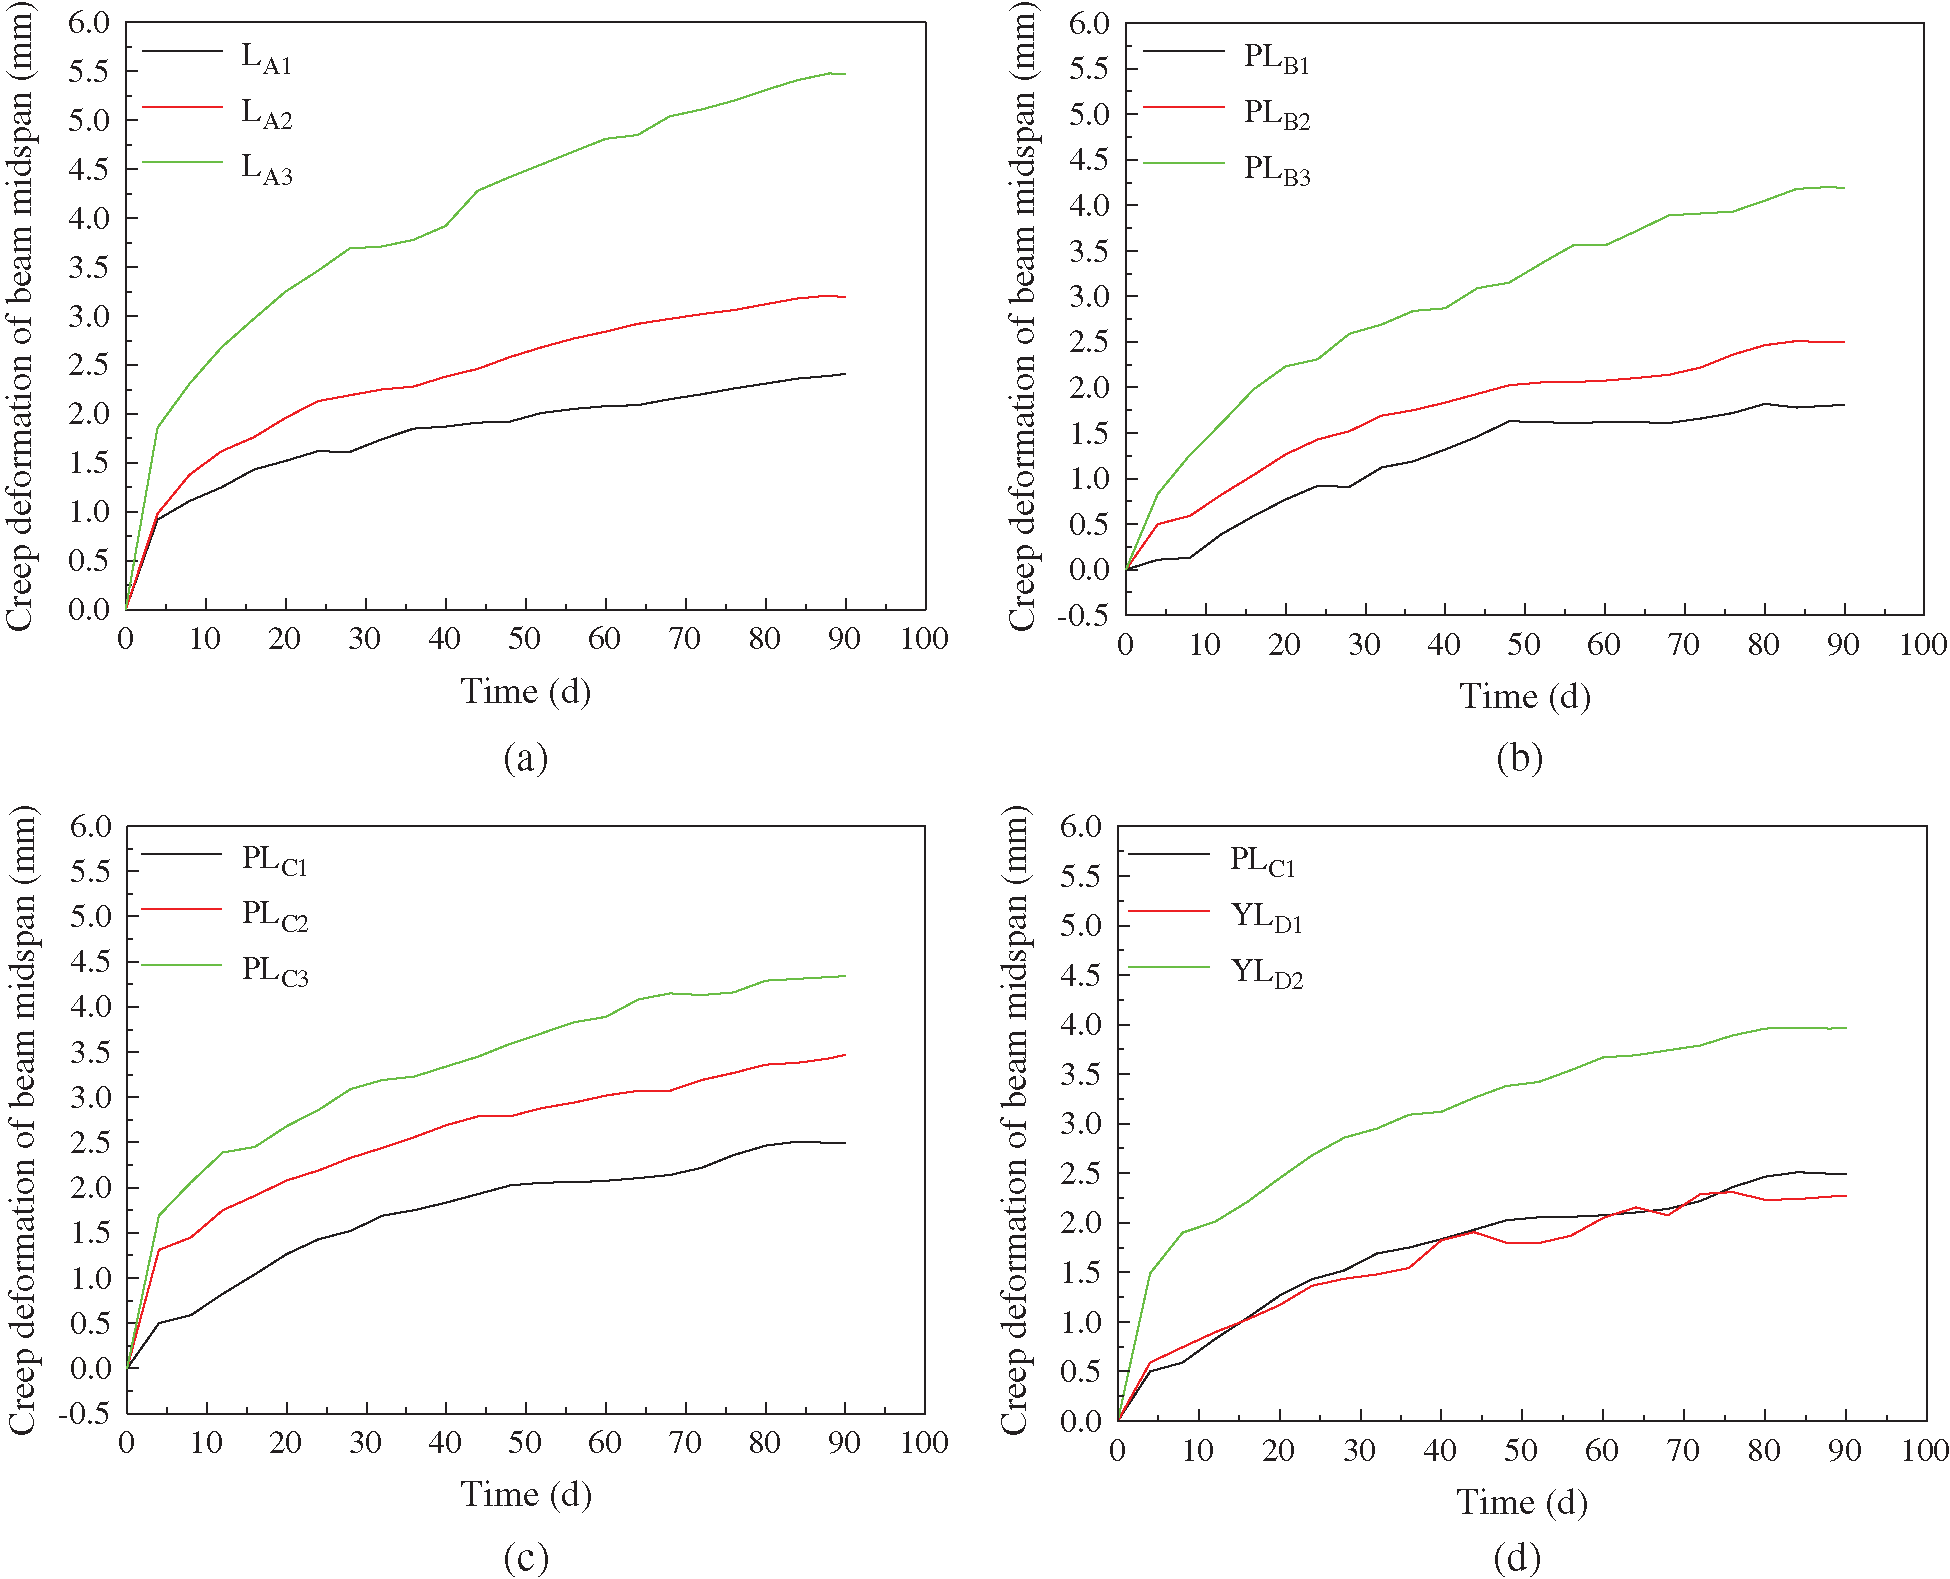
Figure 10: Time-varying curve of the creep deformation. (a) Group A (control group). (b) Group B (different loading levels). (c) Group C (different reinforcement ratios). (d) Group D (different prestress values)
Fig. 10 illustrated that the midspan long-term deflection of the beams in the four groups had completed 61% to 76% of the total deflection on the 30th day. By the 60th day, the deflection had completed 83% to 92%. The beam midspan deflection changed faster in the early stage of the test, and then it decreased gradually in later stages and stabilized, which was consistent with the characteristic of the creep development of glulam.
As shown in Fig. 10, the increase rate of the long-term deflection grew gradually with the increase of the loading level, and the increment was not linear for test beams in Group A. Once the loading level exceeded 30% of the estimated ultimate load, namely the service load, and then the deflection increased very rapidly. For test beams in Group B, the growth rate of the long-term deflection was slower than that of Group A. Therefore, the adding of the reinforced steel bars could effectively control the long-term deflection of beam midspan. For test beams in Group C, the increase rate of long-term deflection gradually slowed down with the increase of the reinforcement ratio. Therefore, increasing the reinforcement ratio could reduce the increase rate of long-term deflection. For test beams in Group D, with the increase of the prestress level, the long-term deflection of the beam increased quickly. This phenomenon was not obvious when the prestress level was relatively low, but when the prestress was higher, the creep deformation of the wood became more significant, and the long-term deflection developed more quickly.
For further study of the creep behavior of the reinforced glulam beam, this paper took the average value of the strain gauges at the loading point on both sides of the glulam beam, the strain gauge layout was shown in Fig. 11, and then the time-varying curve of strain (uε) in the glulam beam was shown in Fig. 12. The Fig. 12 illustrated that the strain of the ordinary glulam beams increased slowly not only in the compression zone but also in the tension zone with time varying, and for the reason that the stress distribution of the reinforced glulam beams was more uniform, the increased amplitude of strain of the reinforced glulam beams and the prestressed glulam beams decreased in turn when they were compared with the ordinary glulam beams.
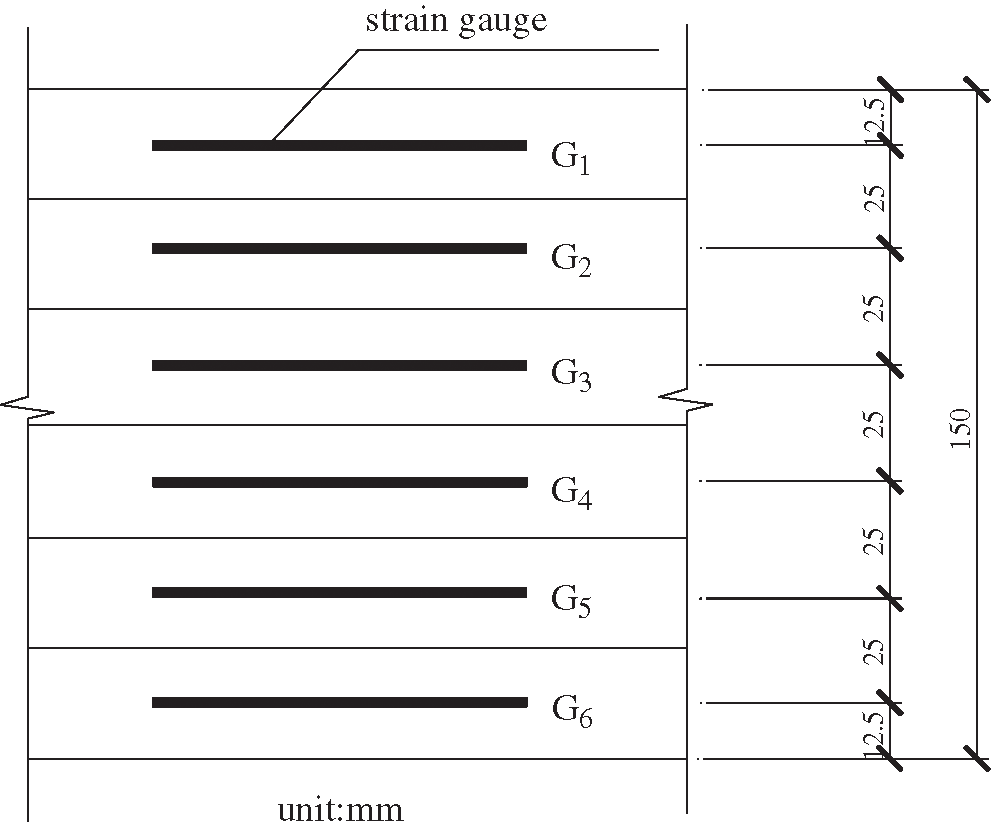
Figure 11: Strain gauge layout diagram
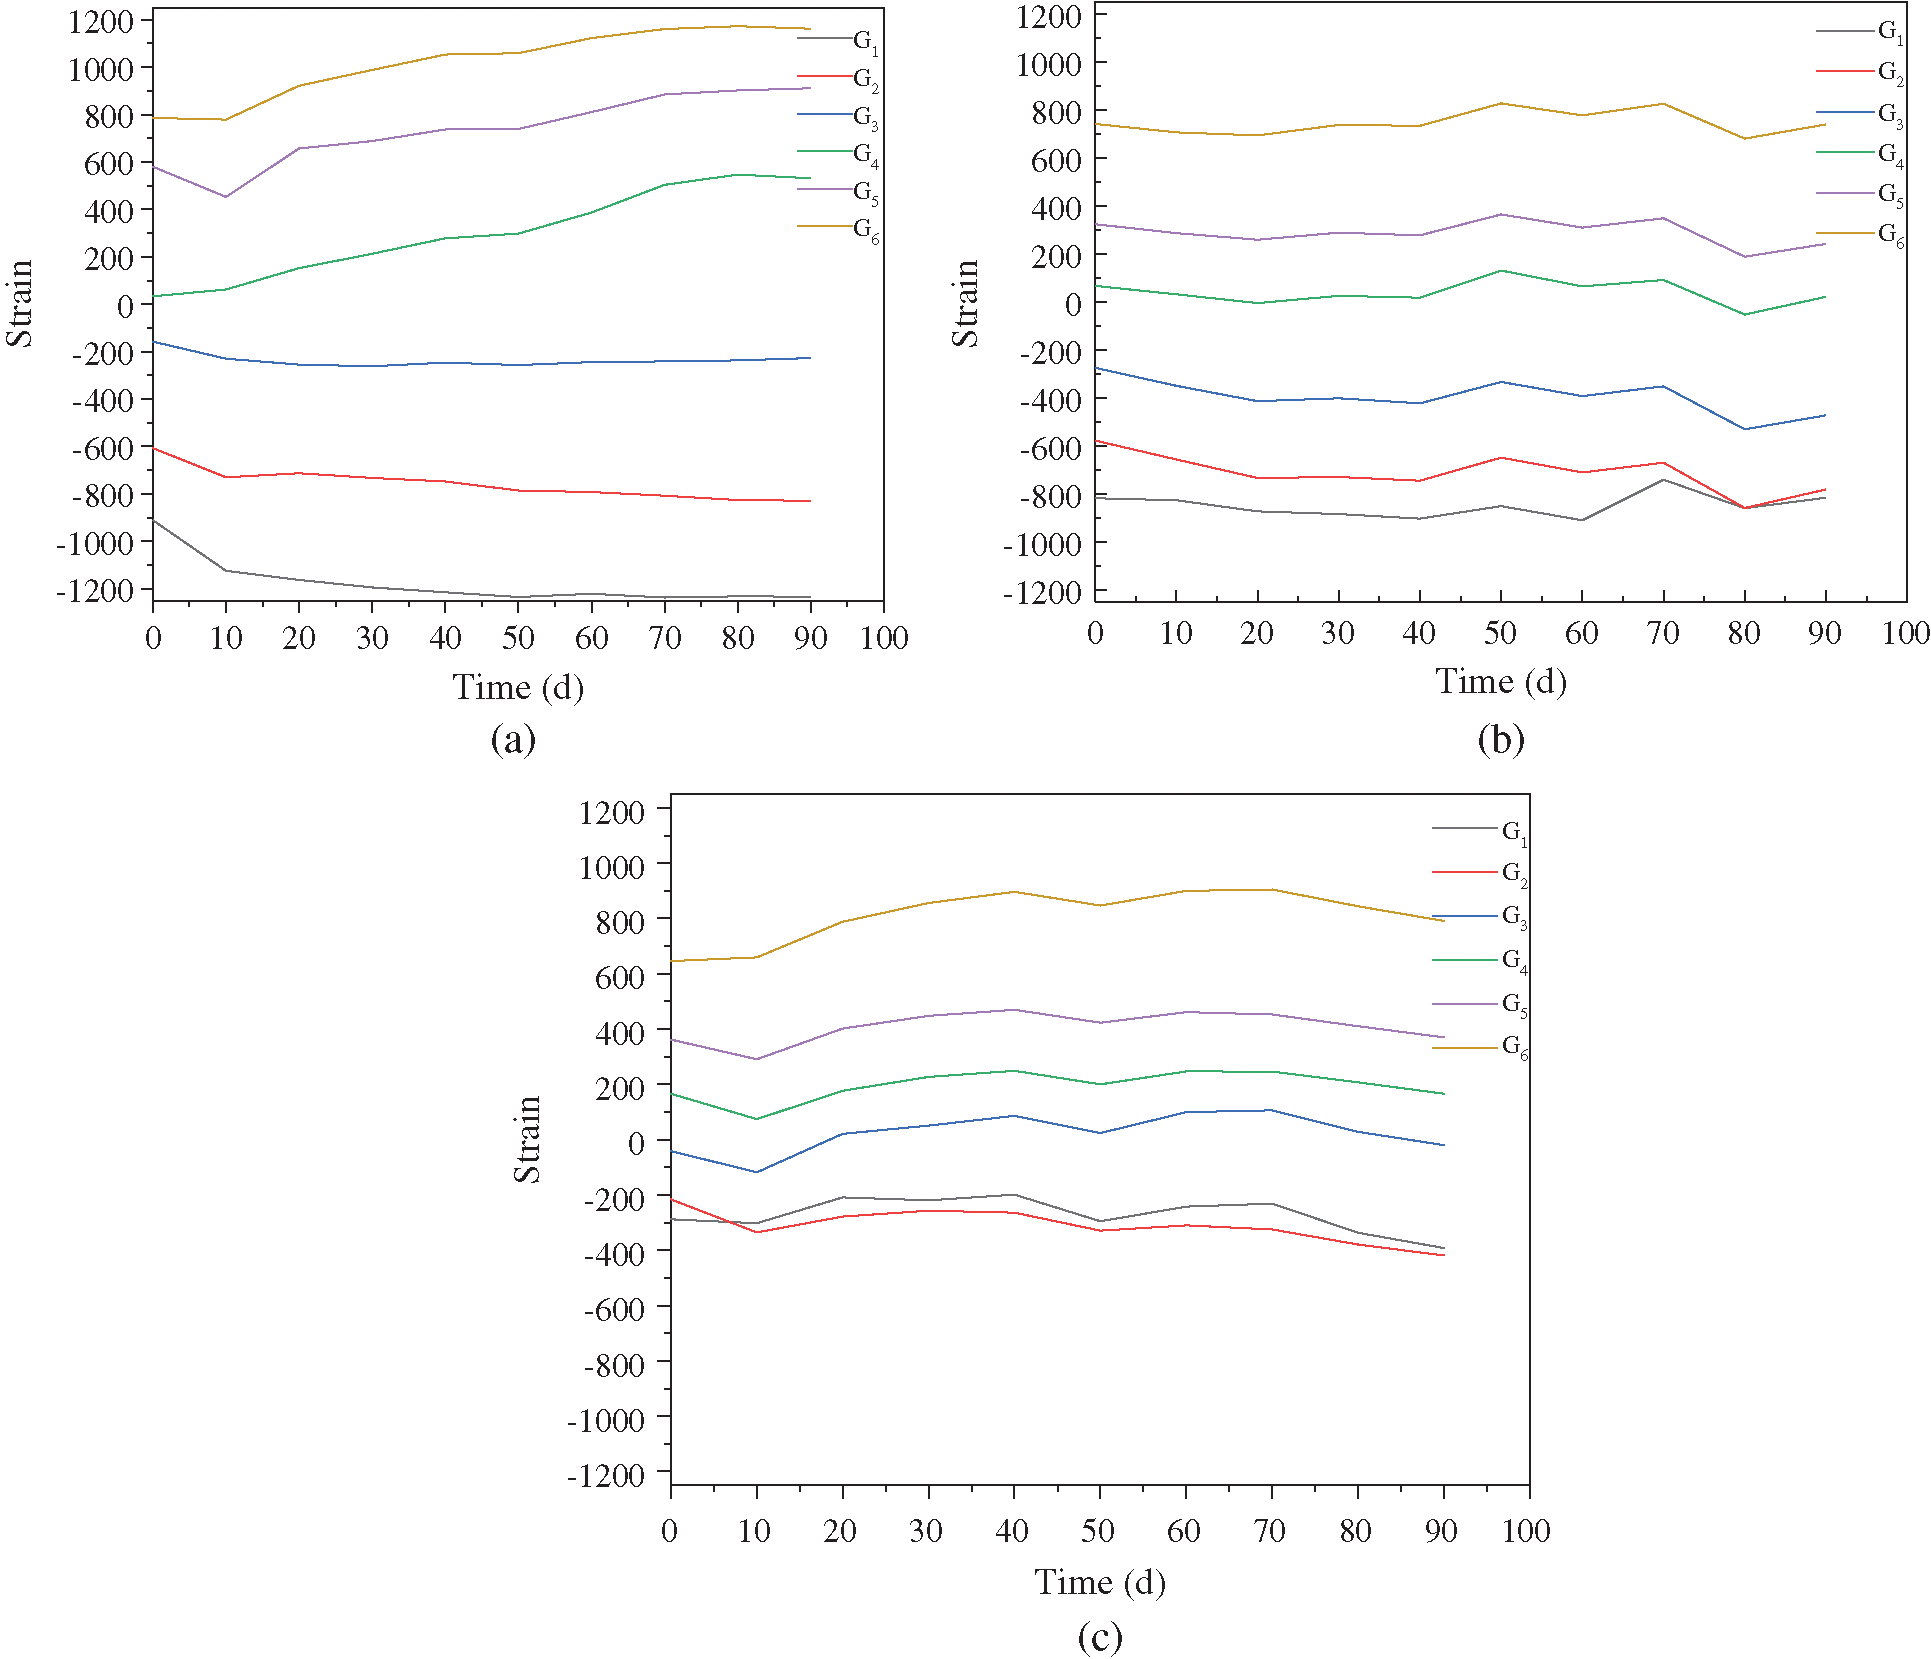
Figure 12: Time-Strain curve of the beams. (a) LA2 (ordinary glulam beam). (b) PLB2 (reinforced glulam beam). (c) YLD1-1 (prestressed glulam beam)
3.5.1 Establishment of Creep Model
The long-term test in this paper lasted for 90 days. However, the design service life of the general structure was 50 years in the building structure. Combined with the previous research experience [34], the existing test data was applied to establish creep model for fitting and estimating the long-term deformation of 50 years in this paper.
A power-law model for the fitting of experimental data and the prediction of the creep deformation of the glulam beams in the long-term experiment was used in this test. The time-midspan deflection formula could be derived from the power-law model expressed by Eq. (1):
In the formula:
f(t)—the final midspan deflection value of the glulam beam (mm);
t—the time of creep deformation of the glulam beam (d);
a, b, c—experiment parameters, derived from the fitting curve;
Through the custom function of the origin software, the power-law model formula was used for the fitting analysis of the creep data of the glulam beams in the long-term experiment. In order to control the length of the article, the creep fitting curve of the LA1 beam was shown in Fig. 13, and the beam fitting results of other working conditions were shown in Tab. 3.
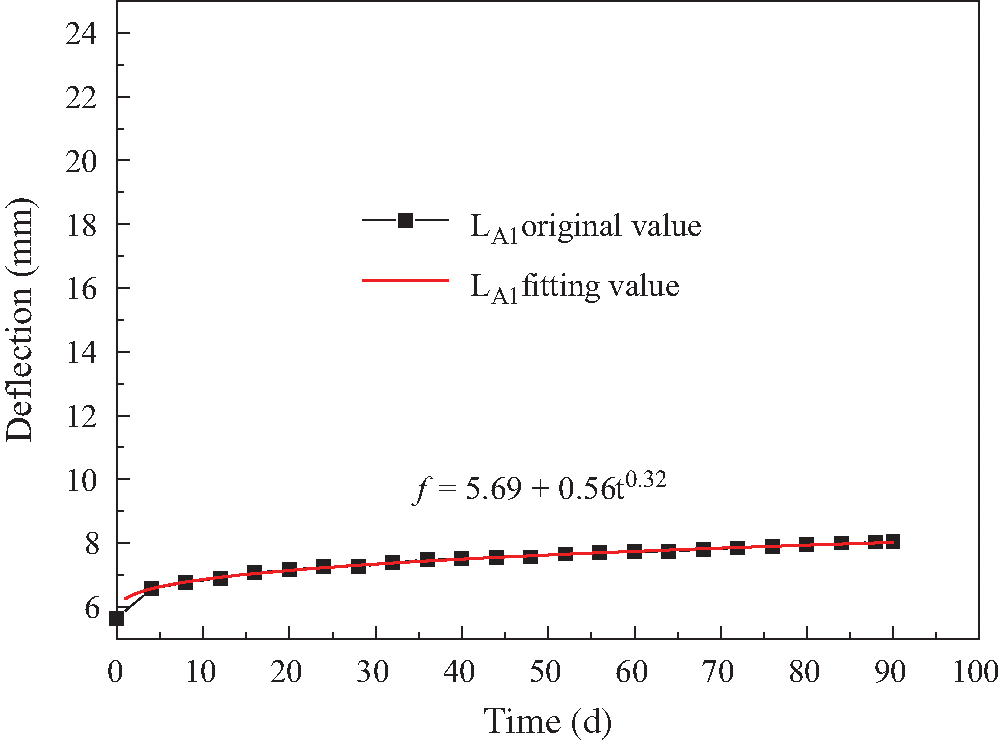
Figure 13: Creep fitting curve of LA1 beam

Tab. 3 illustrated that the correlation coefficients of the sets of the fitting curves were greater than 0.98, which indicated that the fitting accuracy between the results of experimental data and the results in the fitting formula was high. The above mentioned excellently proved that the power-law model formula could well reflect the long-term creep characteristics of glulam.
In this paper, the creep deformation coefficient θ was defined as the ratio of the additional deflection produced by creep and the elastic deflection produced by loading. It could be expressed by Eq. (2).
In this formula:
fc-the additional deflection value produced by the creep of the glulam beam;
fL-the long-term deflection value of the glulam beam;
fs- the elastic deflection value produced by the load.
The specific value of the creep deformation coefficient calculated by Eq. (2) was shown in Tab. 4.

According to the research content in this paper, Tab. 4, and the above analysis results, it was suggested that the creep deformation coefficient could be 2.34 for the theoretical calculation of the glulam beams; as for the reinforced glulam beam, the higher the reinforcement ratio was, the greater the creep deformation coefficient was. When the reinforcement ratio was between 2.05% and 3.39%, the creep deformation coefficient was between 1.73 and 2.09; as for the prestressed glulam beam, it was suggested that the creep deformation coefficient could be 1.78.
3.5.2 Calculation of Long-Term Deflection
The long-term deflection of flexural members under normal service conditions included the elastic deflection caused by loading, and the creep deflection caused by the creep of wood under continuous load. The elastic deflection fs of the flexural members could be calculated according to the knowledge of structural mechanics, while the creep deflection could be calculated by multiplying the deformation fQ by the creep deformation coefficient θ. The calculation formula was shown in Eq. (3).
In the formula:
fQ—Deformation due to quasi-permanent combination of loads;
For the prestressed beams, the application of prestress would make the beams produce a corresponding reverse arch. The deflection change of the prestressed beams during the application of prestress and the whole loading process was shown in Fig. 14.
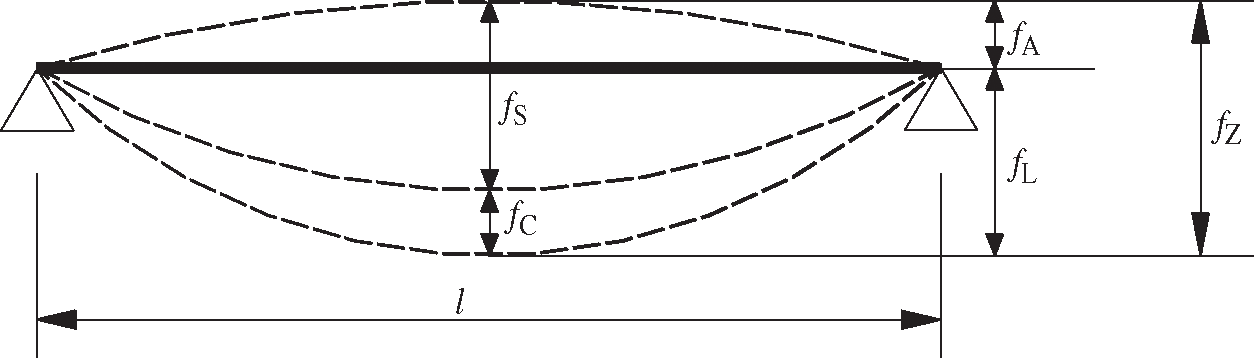
Figure 14: Deformation diagram of the prestressed beam during loading
The calculation of long-term deflection of the prestressed beam was shown in Eq. (4).
In the formula:
fA— height of anti-arch;
1. When the loading level was 20%, 30%, and 40% of the estimated ultimate load, for the beam midspan of ordinary glulam, the proportion of the long-term deflection in total deflection was 29.9%, 28.3%, and 26.2%, respectively; while for the beam midspan of glulam with reinforced steel bars, this proportion was 22.5%, 20.6%, and 18.2%, respectively. With the loading level increased, the proportion of the long-term deflection due to wood creep effects in the total deflection decreased.
2. In the case of unchanged loading level, the total stress value of the steel bars in the reinforced glulam beams decreased by 17.5%, 13.6%, and 9.1%, respectively when the reinforcement ratio was 2.05%, 2.68%, and 3.39%. The higher the reinforcement ratio was, the less the stress loss of the steel bars was. For the reinforced glulam beams, the proportion of the long-term deflection in the total deflection was 26.9%, 24.2%, and 20.6% respectively. With the increase of the reinforcement ratio, the proportion of the long-term deflection due to wood creep effects in the total deflection decreased.
3. In the case of the same loading level and same reinforcement ratio, after subjected to long-term loading, the total stress value of the steel bars decreased by 9.1%, 9.4%, and 10.2%, respectively, and the proportion of the long-term deflection in the total deflection was 20.6%, 26.1%, and 64.9% respectively when the prestress of the steel bars was 0 MPa, 30 MPa, and 60 MPa. With the increase of the prestress value, the stress loss of the steel bars increased, and the proportion of the long-term deflection in the total deflection increased as well.
Acknowledgement: The author thanks Prof. Hongliang Zuo, Prof. Guodong Li, and Prof. Jianmin Zhang for participating in the wood and other experimental equipment purchase for this study.
Funding Statement: This research work was supported by the Fundamental Research Funds for the Central Universities (2572017DB02), the natural science foundation of Heilongjiang Province (LH2019E005), and the natural science of Heilongjiang Province (LH2020E009).
Conflicts of Interest: The authors declare that they have no conflicts of interest to report regarding the present study.
1. Cen, X. Q., Zhen, Y. H., Zhi, F. J., Peng, K. Q. (2020). Development of prefabricated wooden structure building–A case study of qian dong nan prefecture. Scientific and Technological Innovation, 31, 131–133. [Google Scholar]
2. Stellacci, S., Rato, V., Poletti, E., Vasconcelos, G., Borsoi, G. (2018). Multi-criteria analysis of rehabilitation techniques for traditional timber frame walls in pombalino buildings (Lisbon). Journal of Building Engineering, 16, 184–198. DOI 10.1016/j.jobe.2018.01.001. [Google Scholar] [CrossRef]
3. Vogrinec, K., Premrov, M. (2018). Influence of the design approach on the behavior of timber-frame panel buildings under horizontal forces. Engineering Structures, 175, 1–12. DOI 10.1016/j.engstruct.2018.08.014. [Google Scholar] [CrossRef]
4. Matos, F. T., Branco, J. M., Rocha, P., Demschner, T., Lourenco, P. B. (2019). Quasi-static tests on a two-story CLT building. Engineering Structures, 201. DOI 10.1016/j.engstruct.2019.109806. [Google Scholar] [CrossRef]
5. Rossi, S., Casagrande, D., Tomasi, R., Piazza, M. (2016). Seismic elastic analysis of light timber-frame multi-story buildings: Proposal of an iterative approach. Construction and Building Materials, 102, 1154–1167. DOI 10.1016/j.conbuildmat.2015.09.037. [Google Scholar] [CrossRef]
6. Lu, W. D., Song, E. W., Kong, Y., Liu, W. Q. (2013). Experimental study on creep performance of FRP board reinforced glued-wood beam. Building Materials, 16(2), 294–297. DOI 10.3969/j.issn.1007-9629.2013.02.020. [Google Scholar] [CrossRef]
7. He, M., Lu, W. D., Kong, Y., Song, E. W. (2013). FRP enhances creep property of glue-wood arch. Journal of Nanjing University of Technology (Natural Science Edition), 35(2), 107–110. DOI 10.3969/j.issn.1671-7627.2013.02.022. [Google Scholar] [CrossRef]
8. Na, B., Pizzi, A., Lu, X. N. (2009). Study on creep properties of one component polyurethane adhesive for wet material gluing and its gluing wood. Journal of Nanjing Forestry University (Natural Science Edition), 33(4), 121–124. DOI 10.3969/j.issn.1000-2006.2009.04.026. [Google Scholar] [CrossRef]
9. Zuo, H. L., Li, Y. S., Fu, D. Q., Guo, N. (2019). Influence of size effect on bending performance of reinforced glulam beams. Journal of Northeast Forestry University, 47(8), 62–65. DOI 10.13759/j.cnki.dlxb.2019.08.012. [Google Scholar] [CrossRef]
10. Yang, H. F., Liu, W. Q., Lu, W. D., Zhu, S. J., Geng, Q. F. (2016). Flexural behavior of FRP and steel reinforced glulam beams: Experimental and theoretical evaluation. Construction and Building Materials, 106, 550–563. DOI 10.1016/j.conbuildmat.2015.12.135. [Google Scholar] [CrossRef]
11. Daniel, L., Ghasan, D. (2020). Towards enhancing the post-peak performance of glued-laminated timber beams using multi-directional fibre reinforced polymers. Engineering Structures, 215. DOI 10.1016/j.engstruct.2020.110680. [Google Scholar] [CrossRef]
12. Soriano, J., Pellis, B. P., Mascia, N. T. (2016). Mechanical performance of glued-laminated timber beams symmetrically reinforced with steel bars. Composite Structures, 150, 200–207. DOI 10.1016/j.compstruct.2016.05.016. [Google Scholar] [CrossRef]
13. Lu, W. D., Ling, Z. B., Geng, Q. F., Liu, W. Q., Yang, H. F. et al. (2015). Study on flexural behavior of glulam beams reinforced by near surface mounted (NSM) CFRP laminates. Construction and Building Materials, 91, 23–31. DOI 10.1016/j.conbuildmat.2015.04.050. [Google Scholar] [CrossRef]
14. Guo, N., Xiong, H. J., Wu, M. T., Zuo, H. L., Jiang, F. G. et al. (2020). Long-term bending behavior of prestressed glulam bamboo-wood beam based on creep effect. Structural Durability & Health Monitoring, 14(3), 229–248. DOI 10.32604/sdhm.2020.09104. [Google Scholar] [CrossRef]
15. Zuo, H. L., Liu, H. R., Lu, J. X. (2020). The effect of new self-tapping screw reinforcement measures on the bending performance of glued timber beams. Journal of Northeast Forestry University, 48(5), 112–116 + 121. DOI 10.13759/j.cnki.dlxb.2020.05.022. [Google Scholar] [CrossRef]
16. Sun, X. L., Liu, W. Q., Lu, W. D., Zhu, X. W., Yuan, S. L. (2016). Study on bending performance test and engineering application of glued-wood string beam. Journal of Nan Jing University of Technology (Natural Science Edition), 38(5), 121–128. DOI 10.3969/j.issn.1671-7627.2016.05.020. [Google Scholar] [CrossRef]
17. Yang, H. F., Ju, D. D., Liu, W. Q., Lu, W. D. (2016). Prestressed glulam beams reinforced with CFRP bars. Construction and Building Materials, 109, 73–83. DOI 10.1016/j.conbuildmat.2016.02.008. [Google Scholar] [CrossRef]
18. Luca, V. D., Marano, C. (2012). Prestressed glulam timbers reinforced with steel bars. Construction and Building Materials, 30, 206–217. DOI 10.1016/j.conbuildmat.2011.11.016. [Google Scholar] [CrossRef]
19. Zhang, J., Wang, W. C., Qiu, R. G., Hao, S., Xu, Q. F. et al. (2019). Experimental study on short-term bending performance of internal prestressed glued-wood beams. Civil Engineering, 52(5), 23–34. DOI 10.15951/j.tmgcxb.2019.05.003. [Google Scholar] [CrossRef]
20. Zuo, H. L., Di, J., Wang, T. (2019). Lateral resistance of shear wall of light timber structure with prestressed cross tie bar under low cyclic reciprocating load. Journal of Northeast Forestry University, 47(6), 61–64. DOI 10.13759/j.cnki.dlxb.2019.06.012. [Google Scholar] [CrossRef]
21. Long, W. G., Wang, Y. W., Yang, X. B., Zhu, E. C. (2017). Standard for design of timber structures (GB 50005-2017). [Google Scholar]
22. CSA Group (2014). Engineering design in wood (086-14). [Google Scholar]
23. Li, H. T., Wu, G., Zhang, Q. S., Deeks, A. J., Su, J. W. (2018). Ultimate bending capacity evaluation of laminated bamboo lumber beams. Construction and Building Materials, 160, 365–375. DOI 10.1016/j.conbuildmat.2017.11.058. [Google Scholar] [CrossRef]
24. Derikvand, M., Kotlarewski, N., Lee, M., Jiao, H., Chan, A. et al. (2019). Short-term and long-term bending properties of nail-laminated timber constructed of fast-grown plantation eucalypt. Construction and Building Materials, 211, 952–964. DOI 10.1016/j.conbuildmat.2019.03.305. [Google Scholar] [CrossRef]
25. Lu, B., Fu, Y. J., Yu, H. Q., Zeng, Z. (2004). A new test method for creep of structural plywood. Timber Industry, 4, 16–19. DOI 10.19455/j.mcgy.2004.04.005. [Google Scholar] [CrossRef]
26. Hariharan, K., Dubey, P., Jain, J. (2016). Time dependent ductility improvement of stainless steel SS 316 using stress relaxation. Materials Science & Engineering A, 673, 250–256. DOI 10.1016/j.msea.2016.07.074. [Google Scholar] [CrossRef]
27. Pommier, H., Busso, E. P., Morgeneyer, T. F., Pineau, A. (2016). Intergranular damage during stress relaxation in AISI 316l-type austenitic stainless steels: Effect of carbon. nitrogen and phosphorus contents. Acta Materialia, 103, 893–908. DOI 10.1016/j.actamat.2015.11.004. [Google Scholar] [CrossRef]
28. Kyoung, S. M., Won, N. K., Ha, H. S., Hong, P. S., Do, H. S. (2020). Inhibitory effect of ethanol and thiamine dilaurylsulfate against loosely, intermediately, and tightly attached mesophilic aerobic bacteria, coliforms, and salmonella typhimurium in chicken skin. Poultry Science, 99(3), 1571–1580. DOI 10.1016/j.psj.2019.10.058. [Google Scholar] [CrossRef]
29. Cho, J., Lee, C. H. (2016). FE analysis of residual stress relaxation in a girth-welded duplex stainless steel pipe under cyclic loading. International Journal of Fatigue, 82, 462–473. DOI 10.1016/j.ijfatigue.2015.09.001. [Google Scholar] [CrossRef]
30. Xiang, S., Zeng, L., Liu, Y. H., Mo, J. X., Ma, L. L. et al. (2020). Experimental study on the dynamic behavior of T-shaped steel reinforced concrete columns under impact loading. Engineering Structures, 208. DOI 10.1016/j.engstruct.2020.110307. [Google Scholar] [CrossRef]
31. Sá, E. R., Rodrigues, S. F., Aranas, C., Siciliano, F., Reis, G. S. et al. (2020). Softening-precipitation interaction in a Nb-and N-bearing austenitic stainless steel under stress relaxation. Journal of Materials Research and Technology, 9(4), 7807–7816. DOI 10.1016/j.jmrt.2020.05.066. [Google Scholar] [CrossRef]
32. Cornejo, A., Barbu, L. G., Escudero, C., Martínez, X., Oller, S. et al. (2019). Methodology for the analysis of post-tensioned structures using a constitutive serial-parallel rule of mixtures: Large scale non-linear analysis. Composite Structures, 216, 315–330. DOI 10.1016/j.compstruct.2019.02.092. [Google Scholar] [CrossRef]
33. Nguyen, N. V., Vu, Q. A., Kim, S. E. (2020). An experimental study on stress relaxation behavior of high strength steel wire: Microstructural evolution and degradation of mechanical properties. Construction and Building Materials, 261. DOI 10.1016/j.conbuildmat.2020.119926. [Google Scholar] [CrossRef]
34. Guo, N., Wang, W. B., Zuo, H. L. (2019). Flexural property of string beam of pre-stressed glulam based on influence of regulation and control. Structural Durability & Health Monitoring, 13(2), 143–179. DOI 10.32604/sdhm.2019.04640. [Google Scholar] [CrossRef]
 | This work is licensed under a Creative Commons Attribution 4.0 International License, which permits unrestricted use, distribution, and reproduction in any medium, provided the original work is properly cited. |